Abstract
As an important neuropathological hallmark of Alzheimer’s disease (AD), the oligomerization of amyloid-β (Aβ) peptides has been intensively investigated in both theoretical and experimental studies. However, the oligomerization space in term of the kinetics, molecular mechanism and the oligomer structures remains mysterious to us. An equation which can quantitatively describe the time it takes for Aβ oligomers to appear in the human brain at a given Aβ monomer concentration is extremely vital for us to understand the development and disease progression of AD. In this study we utilized molecular dynamics (MD) simulations to investigate the oligomerization of Aβ42 peptides at five different monomer concentrations. We’ve elucidated the formation pathways of Aβ tetramers, characterized the oligomer structures, estimated the oligomerization time of Aβ dimers, trimers and tetramers, and for the first-time derived equations which could quantitatively describe the relationship between the oligomerization time and the monomer concentration. Applying these equations, our prediction of oligomerization time agrees well with the experimental and clinical findings, in spite of the limitations of our oligomerization simulations. We’ve found that the Aβ oligomerization time depends on the monomer concentration by a power of −2.4. The newly established equations will enable us to quantitatively estimate the risk score of AD, which is a function of age. Moreover, we have identified the most dominant pathway of forming Aβ tetramers, the probably most important and toxic Aβ oligomer. Our results have showed that the structures of Aβ42 dimer, trimer and tetramer, which are distinguishable from each other, depend on the monomer concentration at which the oligomers form. Representative oligomer structures which can serve as potential drug targets have been identified by clustering analysis. The MD sampling adequacy has been validated by the excellent agreement between the calculated and measured collisional cross section (CCS) parameters (the prediction errors are within 2%). In a conclusion, this study provides the kinetics and structure basis for developing inhibitors to decelerate the Aβ oligomerization process.
Keywords: Amyloid-beta, oligomers, oligomerization, concentration, equation, Alzheimer’s disease
Graphical Abstract
INTRODUCTION
Currently, there are around 50 million people living with dementia in the world, and this number is increasing by nearly 10 million every year.1 The most common type of dementia is Alzheimer’s disease (AD) which most often begins in people 65 years of age and older.1,2 A patient with AD will experience a variety of symptoms including memory loss, language decay, disorientation, loss of motivation, difficulty in managing self-care, and behavioral issues.1,3 The strongest known risk factor of AD is increasing age. AD prevalence increases with age, which is approximately 1% among people 65 to 69 years of age, 10% among people 80 to 85 years of age and above 40% among persons 95 years of age and above.4 The etiology of AD is complex, but extensive evidence accumulated during the last hundred years suggests that amyloid β peptides are important contributors to AD pathology.5,6 The Aβ peptides, which are proteolytic byproducts of the amyloid precursor protein, are most commonly composed of 40 (Aβ40) and 42 (Aβ42) amino acids. They play many physiological roles such as neuroprotectors and synaptic activity modulators, and may even be crucial for neuronal cell survival.7–9 However, the Aβ peptides may aggregate into many different conformations which are possibly harmful to the brain. Among the structures of Aβ peptides, it is the soluble Aβ oligomers (AβOs), rather than the monomers or insoluble fibrils, are toxic to the brain and instigate multiple facets of AD-neuropathology.6 Therefore, understanding the mechanism of Aβ oligomerization and characterizing the structures of oligomers are vital for developing therapeutic strategies to fight AD, for which there is no cure available yet.
A complete Aβ aggregation may be considered as a two-step process including a nucleation phase and an elongation phase. The nucleation phase is an oligomerization process, in which the peptides form soluble oligomers from monomers. The elongation phase is characterized by the formation of large pre-fibrillar and mature fibrillar structures. Beside environmental factors such as temperature and pH, the oligomerization of Aβ peptides is strongly governed by Aβ monomer concentration.10–13 The Aβ aggregated structures can be formed within minutes when the monomer concentration is in the micromolar (μM) range or in days when the concentration is the hundred nanomolar (nM) range.11,12,14 The dependence of amyloid aggregation rate on the monomer concentrations has been investigated in many experimental studies with a wide concentration range from nM to millimolar (mM). However, the experiments were performed in different conditions and current technologies cannot accurately determine the exact time oligomers formed. The dependence of Aβ oligomerization on the monomer concentration is still elusive. On the other hand, the Aβ monomer concentration in human brain, which may be in range from picomolar (pM) to nM, is much lower than the ones used in the experiment. Thus, an equation which can quantitively describes the time it takes for the AβOs to appear in the human brain vs. Aβ monomer concentrations is extremely vital for us to understand the development and disease progression of AD.
In an amyloid aggregation process, a critical size of amyloid aggregate, which was proposed as a critical nucleus, must be formed.15,16 Once the nucleus is formed, the fibrils grow rapidly. Many studies were performed to identify the critical nucleus for Aβ peptides.15,16 Despite the dynamics of nucleation phase was intensively investigated, a unique value of the critical nucleus size has not been agreed on yet. And the critical nucleus was predicted in range from dimer to 21mers.15,16 On the other hand, it is believed that smaller amyloid oligomers are usually more toxic than larger oligomers, and the toxic size of AβOs maybe as small as a dimer.17–21 Interestingly, many studies showed that tetramer is more toxic than dimer and trimer.18,20,22 Those results suggest that Aβ tetramer may be the most toxic AβOs.18,22 In this work, we utilized molecular dynamics (MD) simulation to study the oligomerization of tetramer full-length Aβ42 peptides at five different Aβ42 concentrations (Table 1). We focused on identifying the oligomerization pathways and characterizing the structures of Aβ42 oligomers. Especially, we investigated the time required to form dimers, trimers and tetramers at the given Aβ monomer concentrations and intended to establish the quantitative relationship between oligomerization time and monomer concentration.
Table 1:
List the parameters for five MD system groups. The rmin and rcen are respectively the minimum and center of mass distances between two monomers (Fig. 1). Other parameters including number of water molecule (waters), volume (V), peptide concentration (C). Each system group has nine MD systems and a 500-ns MD simulation was performed for each MD system.
| System Group | rcen (Å) | rmin (Å) | water molecules (#) | Box size (nm) | V (nm3) | C (mM) |
|---|---|---|---|---|---|---|
| 1 | 35 | ≥ 6 | 9998 | 7.8 | 330 | 20.13 |
| 2 | 40 | ≥ 11 | 15385 | 8.8 | 495 | 13.42 |
| 3 | 45 | ≥ 16 | 22219 | 9.9 | 705 | 9.44 |
| 4 | 50 | ≥ 21 | 30794 | 11.0 | 969 | 6.85 |
| 5 | 60 | ≥ 31 | 53794 | 13.1 | 1701 | 3.91 |
Complementary to the experiment means, a series of MD simulations have been performed studying Aβ oligomer structures and oligomerization process from different perspectives.24–28 However, most of these studies focused on structural characterization of small systems, such as dimer or trimer. Very few studies focused on studying the pathways of aggregation,24 and none on the oligomerization time. This study moves far beyond these limitations. For the first time, we will establish an equation which can be applied to answer the fundamental question why the increasing age is the strongest risk factor of AD. These equations can also be applied to quantitively calculate the risk score of Alzheimer’s disease. Secondly, we will identify representative oligomer structures which can serve as drug targets for developing drugs inhibiting Aβ oligomerization.
RESULTS
The initial structure and oligomeric state definitions
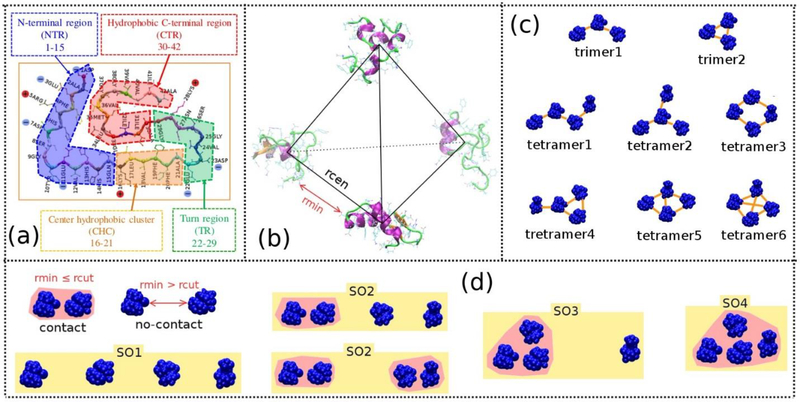
The initial structure consisting of four Aβ42 monomers was constructed by placing the monomers at the four vertices of a regular tetrahedron as shown in Fig. 1b. The tetrahedron has the minimum distance between any two monomers to be rmin (in Å), and the distance between the mass centers of any two monomers to be rcen (in Å). The monomers with different initial conformations were randomly selected from a pool of 400 representative monomer structures which were collected from our previous work,21 and were randomly rotated around their center of mass. We first created nine MD systems which contain four randomly selected monomers with rcen = 35 Å and rmin ≥ 6 Å and the Aβ42 monomer concentration is 20.13 mM. Other lower monomer concentration systems were built by proportionally expanding the distances between the mass centers of any two Aβ42 monomers. In total, forty-five MD systems with five different concentrations were constructed and the main system parameters were listed in Table 1.
Figure 1:
The regions of Aβ42 peptide (a). Initial structure of a four-mer system (b). Possible trimer and tetramer formations based on monomer-monomer pair contacts (c). Relationship between two monomers and different states of the four monomers (d). The rmin and rcen are the minimum and center of mass distances between two monomers, respectively. The two monomers were considered as a dimeric oligomer when their rmin ≤ 3 Å (rcut). SO1 is the state where the four monomers are separated from each other. SO2, SO3 and SO4 are the states which contain the largest oligomeric size as dimer, trimer or tetramer, respectively. The oligomers are highlighted in pink color, and the orange line between two monomers indicates the monomers in contact.
To facilitate us to define the dimeric, trimeric and tetrameric oligomers, we introduced “contact state”, to describe the relationship between two monomers in space. Two monomers fall into the “contact state” when a distance between any two atoms which belong to different monomers is equal to or smaller than 3 Å (Fig. 1d). A dimeric oligomer is formed when two monomers are in contact state. Three monomers would be a trimeric oligomer when a dimer is formed and either or both of the monomers are in “contact state” with the third monomer. A tetrameric oligomer would be established when a trimeric oligomer is formed and at least one monomer is in “contact state” with the fourth monomer. Based on the oligomeric size, we classified four-mer system into four different states, SO1, SO2, SO3 and SO4. SO1 has four monomers, SO2 has either one or two dimers, SO3 and SO4 have one trimer and tetramer, respectively (Fig. 1d).
The oligomers can also be characterized according to the monomer-monomer contact profile (CP) including the number of monomer-monomer pairs (MMP) in contact state. As shown in Fig. 1c, trimers have two CP types, trimer1 and trime2, which have two and three MMP in contact state, correspondingly. As to tetramers, there are in total six CP types. Tetramer1 and tetramer2 both have three MMP in contact state, however, any monomer in the tetramer1 is in contact state with a maximum of two other monomers; while in tetramer2, there is a monomer which is in contact state with all the other three monomers. Similarly, tetramer3 and tetramer4 both have four MMP in contact state, however any monomer in tetramer3 is in contact state with two other monomers; while in the tetramer4, there is a monomer which is in contacted with all the three other monomers. tetramer5 and tetramer6 have five and six MMP in contact state, respectively.
To characterize the time needed to form dimeric, trimeric or tetrameric oligomers, we defined the oligomerization time as the period between the beginning of NVT simulation and the time point when the first dimer, trimer or tetramer was formed, respectively.
The oligomerization of Aβ42 peptides
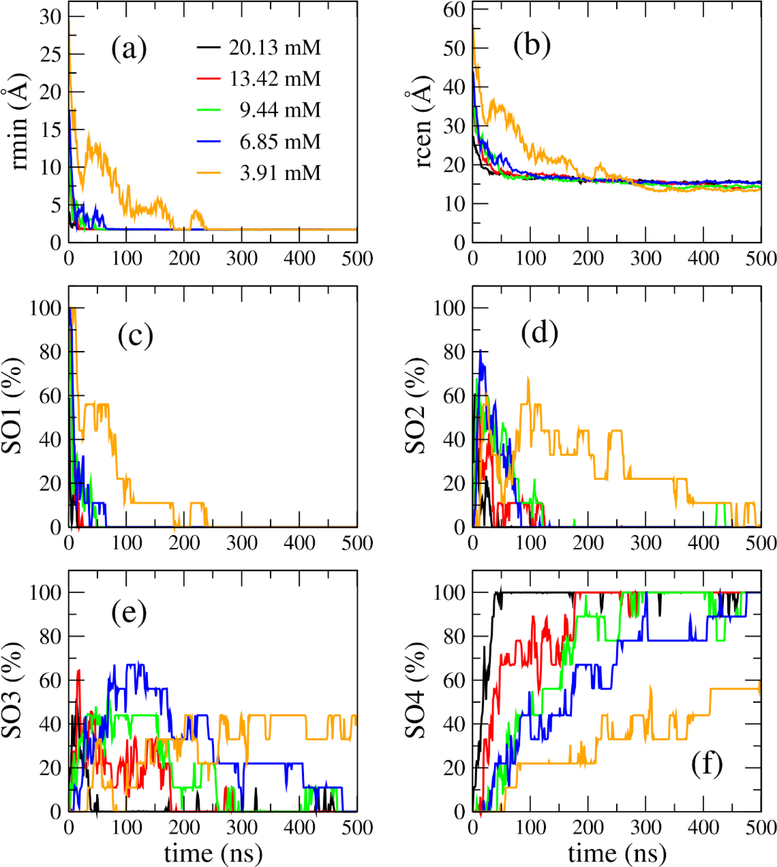
After 500-ns molecular dynamics (MD) simulations were performed for 45 MD systems, post-MD analysis was performed for the collected MD snapshots. The time evolution of the minimum intermolecular distance (rmin), the minimum mass center distance between any two monomers (rcen), and the population of the four states, SO1, SO2, SO3 and SO4, are shown in Fig. 2. The time for rmin to reach the equilibrium value which is about 2 Å, was inversely proportional to the monomer concentration (Fig. 2a). It was several ns at monomer concentration of 20.13 mM and about 250 ns at 3.91 mM. The time evolution of rcen is similar to that of rmin, but rcen required a little longer time than rmin to reach equilibrium (Fig. 2b). As shown in Fig. 2c–2f, the SOi (i=1, 2, 3, 4) populations followed similar trends: at concentration of 20.13 mM, the four-mer Aβ42 quickly formed dimers (SO2), then trimer (SO3), and were completely in tetrameric state (SO4) within 50 ns, and this oligomerization process slowed down at lower concentrations. Particularly, the population of SO4 state just reached to 57% after 500 ns at concentration of 3.91 mM, while it reached 100% at the other four higher concentrations. This result was in good agreement with the experimental data as it clearly demonstrated that the lower the Aβ monomer concentration was, the slower the oligomerization process was.11,12,29
Figure 2:
Time dependence of the minimum distances (a) and minimum mass center distances (b) between any two monomers in the four-peptides systems. The evolution of the population of SO1, SO2, SO3 and SO4 states (defined in Fig. 1) in the four-peptides systems are shown in (c), (d), (e) and (f) panels, respectively. The data were averaged from MD snapshots collected every 100 ps in all 9 MD runs for each concentration.
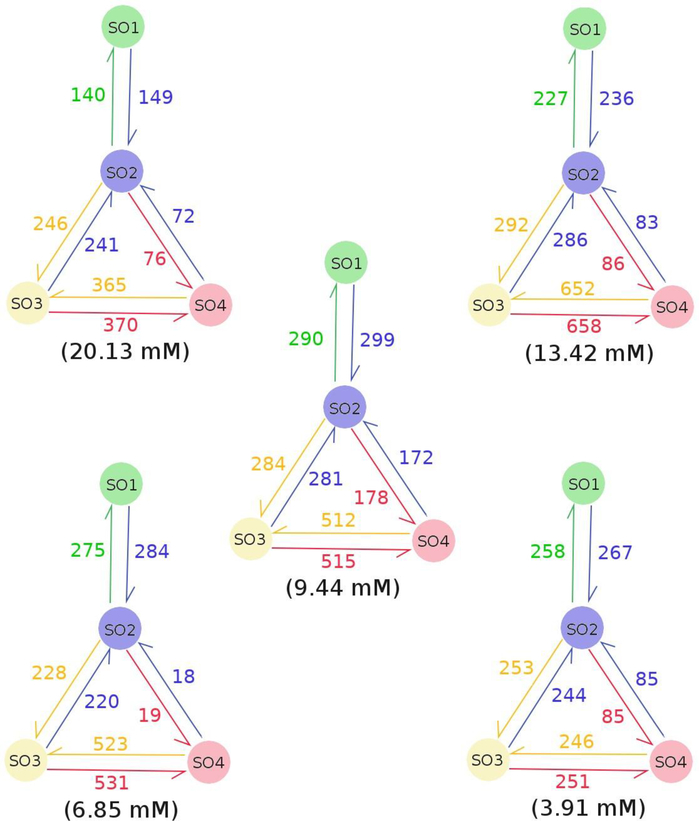
To investigate the oligomerization pathways of the four monomers we tracked the transitions between the SOi states along the simulation time (Fig. 3). The transitions are found to frequently take place between the state pairs including SO1-SO2, SO2-SO3, SO2-SO4 and SO3-SO4. It indicated that the association and dissociation alternately occur in the oligomerization process. This association-dissociation coexistence was also observed in previous studies.24,30 Interestingly, we did not observe any SO1↔SO3 or SO1↔SO4 transitions, suggesting that trimers and tetramers could not be formed directly from monomers. Based on the transition directions and frequencies between oligomerization state pairs, two pathways, SO1→SO2→SO3→SO4 and SO1→SO2→SO4, were identified in tetramer formation. Considering the transition rates of SO2↔SO3 and SO3↔SO4 are much higher than that of SO2↔SO4 at all concentrations, the former is therefore the dominant pathway. It indicates that tetramer is more likely to form directly from a trimer and a monomer than from two dimers. This finding contrasts with Barz et al.’s study which proposed that the SO1→SO2→SO4 pathway has more contribution than the SO1→SO2→SO3→SO4 pathway in Aβ42 tetrameric formation.24 This difference maybe come from the treatment of solvent effect, instead of using an implicit solvent model in Barz et al.’s study, we used an explicit water model. We also investigated the numbers of SOi→SOj (j≥i) transitions on monomer concentration (Fig. S1). For SO1→SO2, the number of transitions reaches maximum at the monomer concentration of 9.44 mM. The number was proportional to the monomer concentration when it is smaller than 9.44 mM, but inversely proportional to the monomer concentration when it is larger than 9.44 mM; for SO2→SO3, the numbers of transitions are similar at all the considered monomer concentrations; for SO2→SO4, the number of transitions has a maximum at 9.44 mM and a minimum at 6.85 mM; as to SO3→SO4, the transitions occur more frequently at the monomer concentrations of 13.42 mM, 9.44 mM and 6.86 mM than at other monomer concentrations. It is pointed out that the number of SO3→SO4 transitions at the monomer concentration of 3.91 mM may increase if the simulation is extended. Overall, there is no general rule governs the numbers of the transitions at different monomer concentrations.
Figure 3:
Transition between SO1, SO2, SO3 and SO4 states (see Fig. 1) in the four-peptide systems. The green, blue, yellow and pink colors represent SO1, SO2, SO3 and SO4 states, respectively. The half-arrow and number which have the same color as an oligomerization state indicate the direction and number of times of the transition from another state to the current one. The transition parameters were obtained using all 9 MD runs for each concentration.
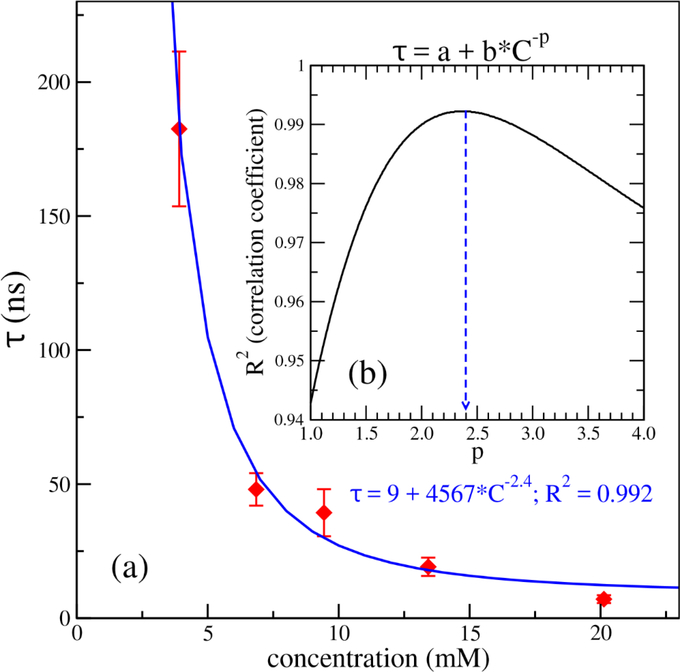
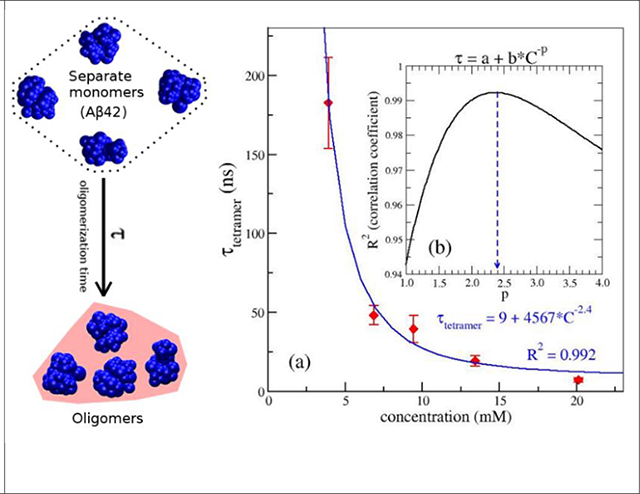
It was proposed that an Aβ aggregation process is characterized by the primary nucleation mechanism in the oligomerization phase without Aβ fibrils, and then secondary nucleation mechanism once a critical concentration of amyloid fibrils has formed.31 In a protein aggregation which undergoes the primary nucleation pathways, the dependence of any characteristic time (τF) such as tenth-time, half time or lag time, on the concentration of monomer (C) is given by: τF ~ C−(nc+1)/2.32 Here, nc is the size of the critical nucleus of the aggregation. In this study, one of major aims was to establish a quantitative relationship between the oligomerization time (τ) and the monomer concentration at the early oligomerization phase of the Aβ aggregation, at which Aβ fibrils is absent. The dependence of the oligomerization time, τ, on the monomer concentration should be described by the above equation. For each concentration, we first estimated the oligomerization time, τ, for dimers, trimers and tetramers for every MD simulation, then the mean and standard error of each oligomerization time were calculated using all nine MD trajectories. The concentration dependence of the tetrameric oligomerization time, τSO4, is shown in Fig. 4a. We carried out the fitting for τSO4 (in ns) and the monomer concentration C (in mM) by using the equation τ = a + b * C−p with a and b as fitting constants. We scanned p to get the best correlation coefficient (R) between the calculated data and fitting data. As shown in Fig. 4b, the best fitted p value was about 2.4, and the corresponding constants, a = 9 (ns) and b = 4567. Interestingly, applying p = 2.4 to above τF’s equation, we received nc = 3.8. This nc value is very close to 4 which is equal to the number of monomers in a tetramer. Doing the similar analysis for dimer and trimer, the p values obtained for dimeric and trimeric oligomerization time were 3.3 and 3.5. However, if we apply those values to the τF’s equation, the calculated nucleus sizes, = 5.6 and 6, are not consistent to the fact that the numbers of monomers in the AβOs are 2 and 3, respectively. Therefore, the fitting results indicate that the critical nucleus of the early Aβ42 oligomerization process may be a tetramer. Additionally, tetramer was proposed as the most toxic of AβOs.18,22 Therefore, we applied the same p = 2.4 in the fitting of dimeric and trimeric oligomerization. We had τSO2 = 1018 * C−2.4 with R2 = 0.99 and τSO3 = 3246 * C−2.4 with R2 = 0.98 (Fig. S2). We can represent the same fitting equations with τ in the unit of hour, day or year and concentration C in nM in the following formulas:
| (1) |
| (2) |
| (3) |
Figure 4:
The dependence of the tetrameric oligomerization time (τ) on monomer concentrations of the Aβ peptides. In panel (a), the red diamonds represent the data calculated from the simulations, while the blue line represents the best fit for the data. Panel (b) shows the dependence of the square of Pearson correlation coefficient (R2) on the power (p) in the fitting by the nonlinear function, τ= a + b * C−p, where a and b are constants and τ (in nanosecond) and C (in millimolar) are the oligomerization time and monomer concentration, respectively. The blue dash arrow points to the p value (2.4) which gives the maximum R2. The best fitting function is explicitly shown in blue text. The standard error was calculated from the 9 MD simulation trajectories for each state at each peptide concentration.
Characterizations of Aβ42 oligomers
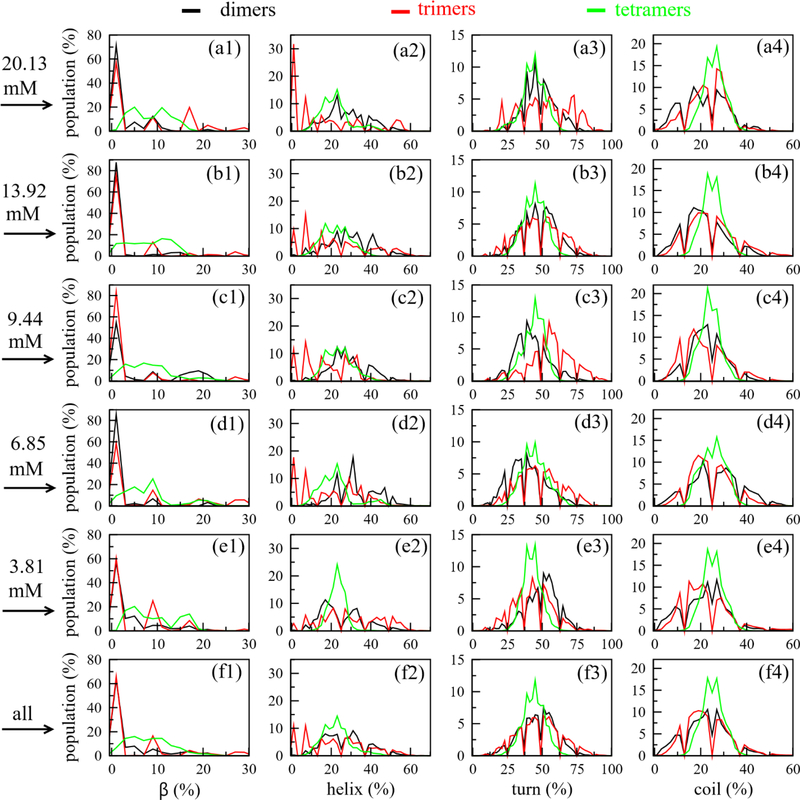
To characterize the structures of Aβ42 oligomers, we first performed analysis on their secondary structures. As shown in Fig. S6, the overall secondary structures demonstrated different timedependent patterns for four Aβ42 peptides in all systems. Specifically, the β-content slightly increased, the turn content lightly decreased, while helix and coil contents varied around the initial value with small amplitudes, ≤ 5% (Fig. S6). The secondary structures of individual monomers underwent frequently changes during the oligomerization process (Fig. S7). The secondary structural distributions of dimers, trimers and tetramers forming at different monomer concentrations were showed in Fig. 5. It is demonstrated that the distribution patterns of secondary structures in different oligomer (dimer, trimer or tetramer) are different, however, for the same oligomer, the distribution patterns in different MD systems are similar. The contributions of the secondary structures in dimer are 9 ± 7% for β-content, 20 ± 9% for helix, 45 ± 10% for turn and 26 ± 6% for coil. In the trimer, the contributions are 7 ± 5% for β-content, 24 ± 9% for helix, 44 ± 9% for turn and 25 ± 5% for coil. In the tetramer, those numbers are 8 ± 5% for β-content, 23 ± 7% for helix, 44 ± 8% for turn and 25 ± 5% for coil. Note that initial monomers, which were taken from our previous work, had undergone long simulation time, and they were already well sampled.25 Therefore, our result showed little changes on the overall secondary structures, independently if the AβO is a dimer, trimer or tetramer.
Figure 5:
The distributions of the secondary structures of Aβ42 dimers (black), trimers (red) and tetramers (green) forming in different monomer concentrations.
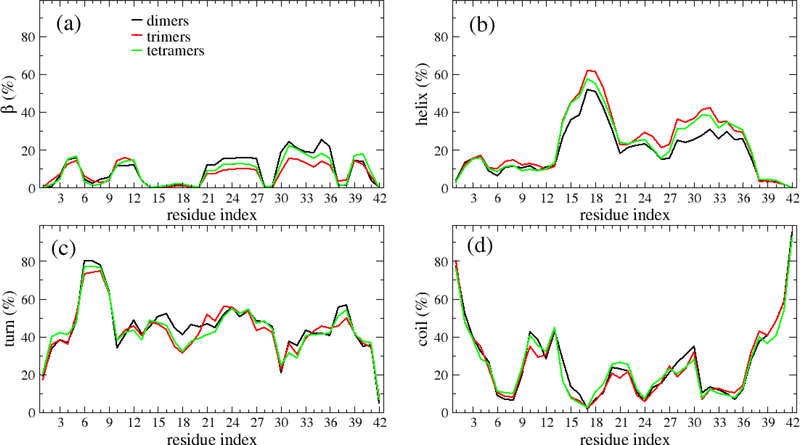
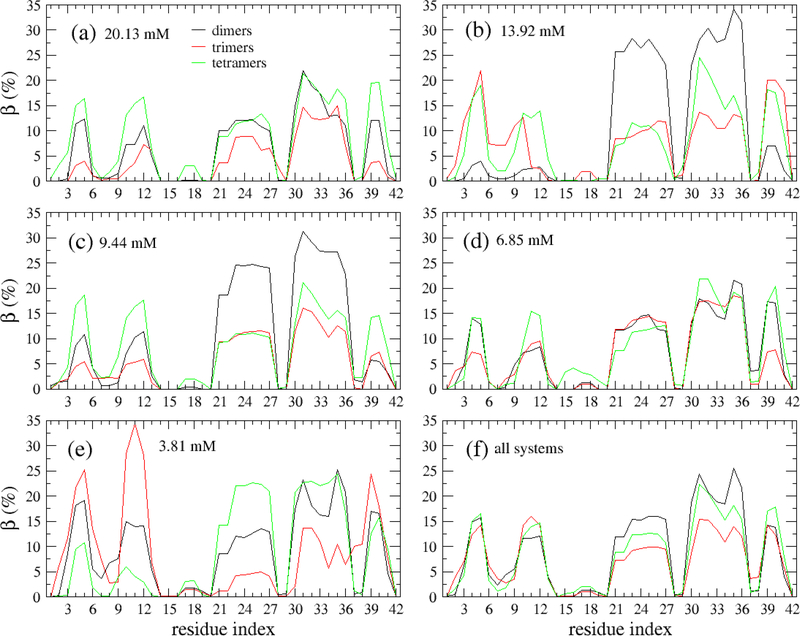
The profiles of secondary structures of the oligomers along the sequence is shown in Fig. 6. The β profiles of the dimers, trimers and tetramers are significantly different at two regions covering Residues 21–27 and 30–36. In these regions, the residues have higher β propensity in dimers than in trimers and tetramers (Fig. 6a). The helix propensity of the Residues 14–36 in dimers are lower than in trimers and tetramers (Fig. 6b). Fewer turn content was observed for the dimers than trimers and tetramers in the region of Residues 16–19. As to the coil, the three profiles are similar. Overall, the profiles of the secondary structures share the similar shape for different oligomers. It is noted that the above analysis was done using all the oligomers for all the systems. However, as shown in Figs. 7, S8, S9 and S10, those profiles of the secondary structures remarkably depend on the monomer concentrations. For example, the β profile of the dimers forming at monomer concentration of 20.13 mM shows five peaks with equally heights (Fig. 7), while the dimers forming at monomer concentration of 13.93 mM has a β profile which contains two major peaks and three minor peaks.
Figure 6:
Secondary structure propensities of each amino acid of Aβ42 dimers (black), trimers (red) and tetramers (green). The data was calculated from all the oligomer structures collected from all the systems and all the 500-ns MD simulations for each system. The results are also cumulated over all the concentrations.
Figure 7:
The β propensities of each amino acid of Aβ42 dimers (black), trimers (red) and tetramers (green) forming from different monomer concentrations, 20.13 mM (a), 13.92 mM (b), 9,44 mM (c), 6.85 mM (d) and 3.81 mM (e). Panel (f) is a shown for the data calculated over all considered monomer concentrations. The data was collected from all the 500-ns MD simulations for all the systems.
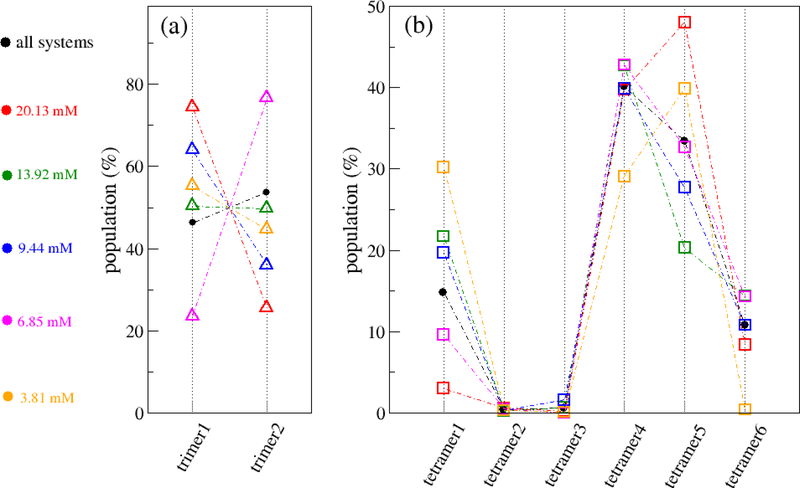
Based on the monomer-monomer contact profile, we next classified trimers into two CP types and tetramers into six CP types (Fig. 1c) and characterized their structures. The distributions of the trimer and tetramer CP types forming at different monomer concentrations are shown in Fig. 8. It is demonstrated that the distribution of trimer CP types strongly depended on the monomer concentration but did not follow any common rule. Over all the systems, the probabilities of forming trimer1 and trimer2 are almost the same (Fig. 8a). For the tetramers, the most dominant CP types are tetramer4 and tetramer5, followed by tetramer1 and tetramer6. The population size of tetramer2 was almost zero, and the population size of tetramer3 was very low (Fig. 8b). Similar to trimer, the populations of tetramer CP types also depended on the monomer concentrations. For example, at monomer concentrations of 20.13 mM and 3.81 mM, tetramer5 was the most populated CP type, while at other monomer concentrations, tetramer4 was the most populated CP type.
Figure 8:
The distributions of the trimer and tetramer types forming in different monomer concentrations, 20.13 mM (red), 13.92 mM (green), 9,44 mM (blue), 6.85 mM (magenta) and 3.81 mM (orange). The statistical data from all systems was shown in black. The data was collected from all the 500-ns MD simulations for all the systems.
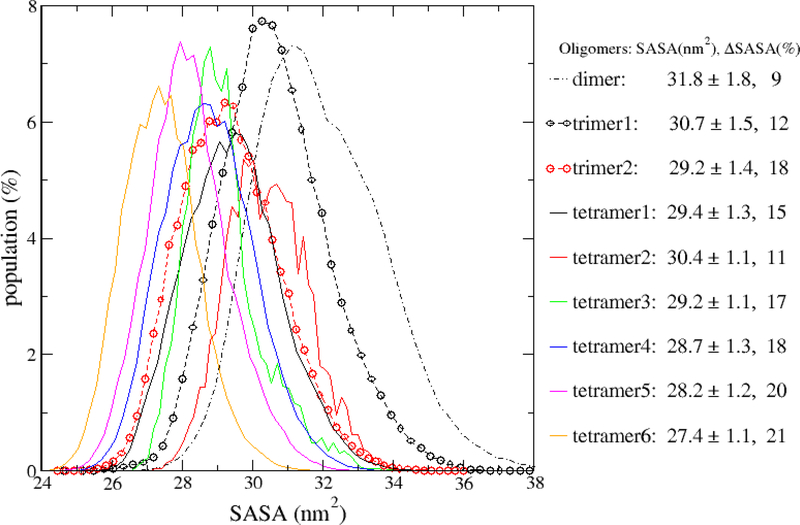
Next, we analyzed the solvent accessible surface areas (SASA) of the oligomers including dimer, two CP types of trimer and 6 CP types of tetramer. Fig. 9 shows the SASA distributions of the oligomers. Here, SASA was rescaled using the number of monomers in the oligomer to allow us to compare the compactness of dimers, trimers and tetramers unbiasedly. Generally, the smaller SASA per peptide is, the more compact an oligomer is. We also defined ΔSASA, the SASA loss as the percentage of the SASA which was lost when the oligomer is formed from monomers. Mathematically, it was calculated using the following equation: , where n is the number of monomers in an oligomer, SASAi is the solvent accessible surface area for monomer i, and SASAoligomer is the solvent accessible surface of the oligomer without scaling. The larger the ΔSASA, the more stable an oligomer is. The SASA of the dimer obtained by our simulation varied from 54 to 76 nm2. It is similar to that reported by Zou et al.,33 but slightly larger than that by Sun et al.34 The averaged SASA of the tetramers was in range of 109–121 nm2, which is larger than that reported by Brown et al.35 As illustrated by Fig. 9, in most scenarios, the larger oligomer has smaller scaled SASA. However, for tetramer2, its scaled SASA is larger than those of trimers. Among the two trimer CP types, trimer2 is more compact and stable than trimer1 as its scaled SASA is smaller and ΔSASA is larger. For the six tetramer CP types, tetramer2 has the largest scaled SASA and smallest ΔSASA, while, tetramer6 has the smallest scaled SASA and largest ΔSASA. The SASA decreasing and ΔSASA increasing followed the following order: tetramer2 → tetramer1 → tetramer3 → tetramer4 → teteramer5 → tetramer6. The SASA analysis result was also affected by the monomer concentrations as expected. The detailed result was shown in Table S1. A major observation is that dimers formed at low monomer concentrations tend to have smaller scaled SASA, implying that dimers formed at low monomer concentrations are more stable. This pattern was not observed for the trimers and tetramers.
Figure 9:
The scaled solvent accessible surface area (SASA) distribution of the oligomer formations. Both the scaled SASA and percent SASA loss (ΔSASA) for each oligomer are listed in the legend. The data were calculated using all the 45 simulation systems and all the 500-ns simulation time of each MD run.
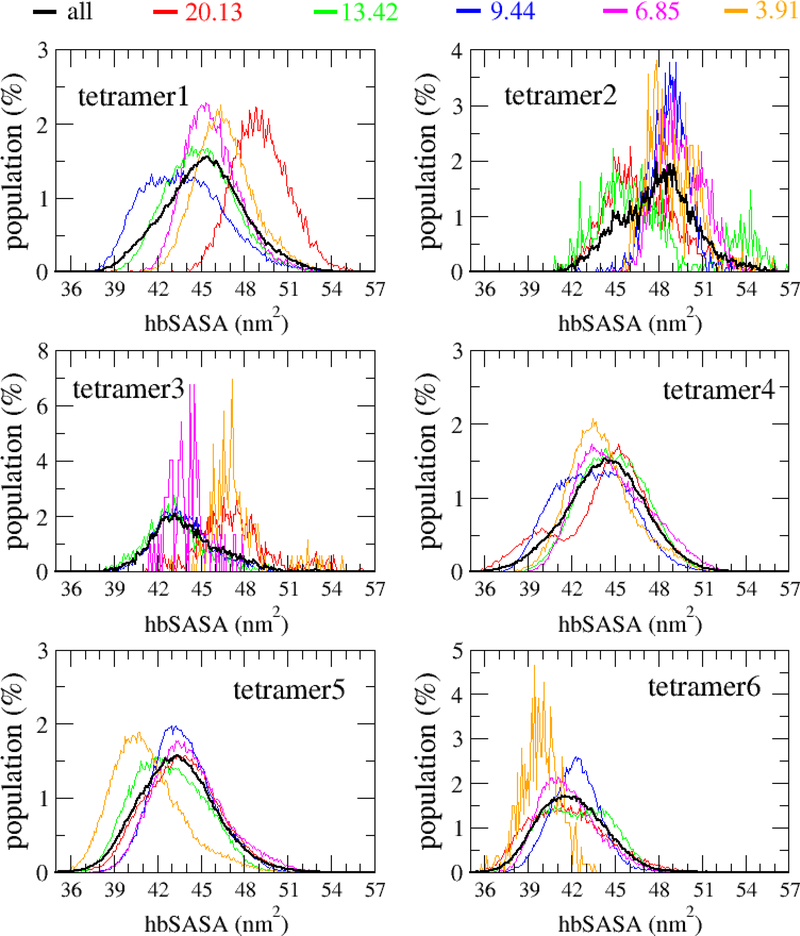
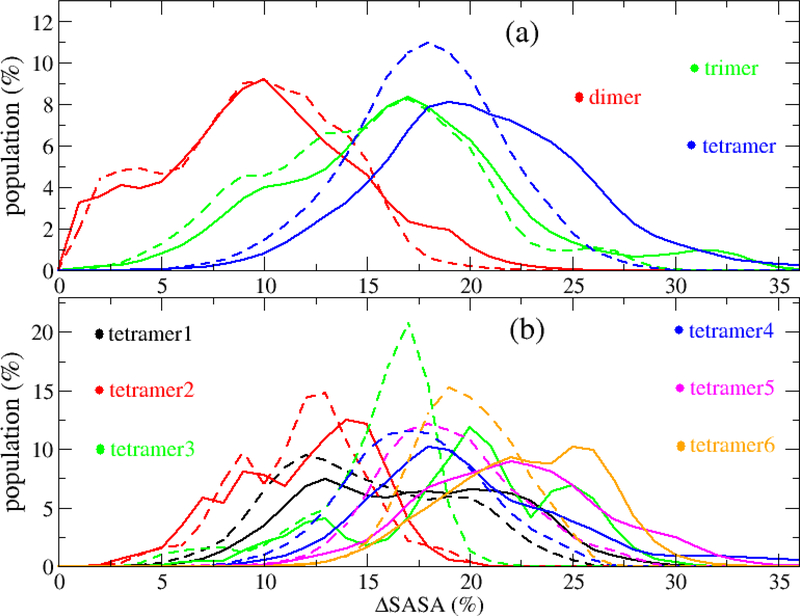
Among the two components of SASA, hydrophobic/nonpolar solvent accessible surface area (hbSASA) and hydrophilic/polar solvent accessible surface area (pSASA), hbSASA plays a dominant role in protein aggregation,36–38 and it has been linked to the cytotoxicity of Aβ42 oligomers.39 Thus, hbSASA parameter was frequently used to characterize the AβOs.24,35,40 In this study, we analyzed hbSASA and pSASA of the Aβ42 oligomers. The hbSASA and pSASA distributions of the Aβ42 dimers, trimers and tetramers were shown in Figs. 10, S12 and S13. Our result showed that the ranges of hbSASA are 20–30 nm2 for the dimers, 29–42 nm2 for the trimers and 36–56 nm2 for the tetramers. As shown in Fig. S13, the hbSASA distributions of Aβ42 oligomers forming at different monomer concentrations have different patterns, particularly, the hbSASA distribution of an oligomer formed at the highest monomer concentration tends to have larger hbSASA values and is distinct from those formed at lower concentrations. Additionally, the different CP types of tetramers also have different hbSASA distributions (Fig. 10). The hbSASA of tetramer3 and tetramer6 are significantly smaller than the hbSASA of tetramer1, tetramer3 and tetramer4. We also examined the ΔSASA of hbSASA (ΔhbSASA) and pSASA (ΔpSASA) in different oligomeric formations (Fig. 11). As seen from Fig. 11, ΔhbSASA and ΔpSASA follow the same trend of ΔSASA, which showed the loss increases from dimer, trimer to tetramer (Fig. 11a). For the six tetramer CP types, the following order was observed for both ΔhbSASA and ΔpSASA: tetramer2 < teramer1 < tetramer4 < tetramer3 < teramer5 < tetramer6 (Fig. 11b). In all the oligomeric structures, ΔhbSASA was always larger than ΔpSASA.
Figure 10:
The hydrophobic solvent accessible surface area (hbSASA) distribution of the tetramers. The data was collected from all the 500-ns MD simulations for all the systems.
Figure 11:
The distribution of lost SASA (ΔSASA) for Aβ42 dimer, trimer and tetramer (a), and for different tetramer CP types (b). The solid and dash lines represented for the ΔSASA of hbSASA (ΔhbSASA) and pSASA (ΔpSASA), respectively. The ΔSASA is percentage of the SASA which was lost when the oligomer form in comparison with the sum of all monomers whose SASA were calculated separately. The data was collected from all the 500-ns MD simulations for all the systems.
Another important parameter, collisional cross sections (CCS), which is used to characterize Aβ oligomer structures and can be experimentally measured by using ion mobility mass spectrometry, was calculated for each oligomer CP type and reported in Table 2. As listed in this table, CCS values of dimers and trimers become smaller with the decrease of the monomer concentrations, while CCS values of tetramers only depend on the CP types. The order of CCS values for the tetramer CP types is as follows: tetramer1, tetramer2 > tetramer3 > tetramer4 > tetramer5 > tetramer6. The range of CCS values are from 1334 ± 74 to 1365 ± 69 for dimers, from 1741 ± 76 to 1937 ± 81 for trimers and from 2095 ± 55 to 2459 ± 85 for tetramers. The CCS distributions of the different oligomers forming at different monomer concentrations were shown in Fig. S14 and S15. In general, a CCS distribution shares the similar trend as the SASA distribution, i.e., the order of the peak positions for different tetramer CP types is the same: tetramer2 > tetramer1 > tetramer4 > tetramer3, tetramer5 > tetramer6.
Table 2:
Collision cross sections (in Å2) of the Aβ42 oligomers forming at different monomer concentrations. The errors are the standard deviations.
| Oligomers | System Family | |||||
|---|---|---|---|---|---|---|
| 20.13 mM | 13.42 mM | 9.44 mM | 6.85 mM | 3.91 mM | all systems | |
| dimer | 1365 ± 69 | 1363 ± 63 | 1336 ± 89 | 1334 ± 74 | 1334 ± 68 | 1337 ± 73 |
| trimer1 | 1937 ± 81 | 1903 ± 114 | 1874 ± 84 | 1892 ± 76 | 1874 ± 89 | 1881 ± 88 |
| trimer2 | 1822 ± 114 | 1792 ± 74 | 1776 ± 74 | 1761 ± 80 | 1741 ± 76 | 1759 ± 80 |
| tetramer1 | 2391 ± 204 | 2306 ± 107 | 2320 ± 99 | 2422 ± 123 | 2389 ± 144 | 2344 ± 128 |
| tetramer2 | 2324 ± 81 | 2390 ± 102 | 2422 ± 133 | 2459 ± 85 | 2381 ± 49 | 2384 ± 109 |
| tetramer3 | 2319 ± 242 | 2297 ± 142 | 2248 ± 49 | 2266 ± 57 | 2337 ± 63 | 2271 ± 118 |
| tetramer4 | 2227 ± 91 | 2280 ± 120 | 2238 ± 67 | 2257 ± 108 | 2274 ± 115 | 2253 ± 102 |
| tetramer5 | 2203 ± 88 | 2167 ± 84 | 2194 ± 77 | 2167 ± 89 | 2229 ± 53 | 2193 ± 85 |
| tetramer6 | 2115 ± 107 | 2095 ± 55 | 2109 ± 57 | 2142 ± 73 | 2176 ± 28 | 2114 ± 76 |
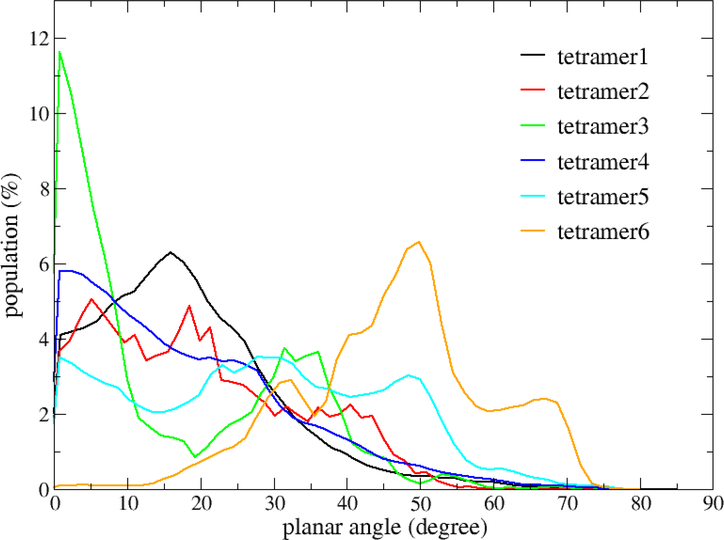
To check whether the four monomers in a tetramer were in a plane or not, i.e. how flat a tetramer was, we calculated the planar angle of the four monomers of a tetramer (Fig. 12). A planar angle ranges from 0 to 90 degrees. If all four monomers are in the same plane (flat), the planar angle is 0 degree. And the larger a planar angle is, the less flat the four monomers (tetramer) is. As shown in Fig. 12, each distribution of planar angles has one or multiple peaks. The maximal peaks appeared at small planar angles (< 5 degrees) for tetramer2, tetramer3 and tetramer4, while at larger planar angles (> 10 degrees) for the other tetramer PC types. In another word, most tetramer2, tetramer3 and tetramer4 are flatter than other tetramer types.
Figure 12:
The distribution of the planar angles of the tetramers.
To investigate the role of peptide residues in the oligomerization of Aβ42 peptides, we have examined the intermolecular residue-residue interactions of Aβ42 peptides in the dimeric, trimeric and tetrameric oligomers. As shown in Fig. S16, the following intermolecular residue-residue interactions play a dominant role for all oligomeric structures: Residues 32–36/32–36, 32–36/3942, 18–25/26–35, 13–19/38–42, 4–10/25–31, and 18–21/18–21. Note that the residues before and after the forward slashes belong to different molecules and the same notion also applies to the following residue-residue interactions. The interactions between Residues 5–7/18–20, as well as 5/6–11 frequently appeared in dimers and trimers, but not in tetramers. We also found that the interaction between hydrophobic residues, such as Residues 19–20/19–20, 19–20/31–32, 31–32/3132, 31–32/38–42, frequently appeared in all the oligomer structures, while the interactions between charged-charged residues, including ARG5/ASP7, ARG5/GLU11, ARG5/GLU22, ARG5/ASP23, LYS28/ASP7, and LYS28/GLU11, had the highest probability to be found in dimers and the probabilities decreased with the increase of oligomer size. Overall, the following residues were recognized as the key residues driving the oligomerization processes: Residues 5, 28, 19, 20, 22, 23, 28, 30–32, 34–36 and 39–42. As a conclusion, both the intermolecular charged and hydrophobic residues interactions make contribution to the formation of the oligomers, particularly the charged residue interactions play a critical role in the very early stage oligomer formation. Interestingly, the interactions between LYS28 and Residues GLU22 and ASP23, which are among the strongest interactions for all types of oligomers, were also recognized by Luhrs et al. for their important role in both the Aβ42 fibril formation and stability maintenance.41
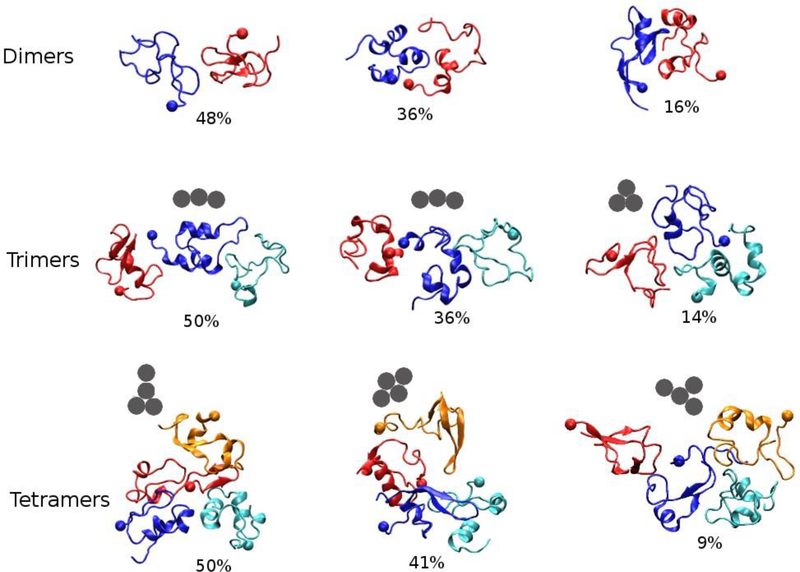
Finally, we applied a k-means clustering method42 to group the conformations of Aβ42 dimers, trimers and tetramers. Three clusters were obtained for each oligomer type and the representative structures of each cluster are shown in Fig. 13. For the trimers, the representative structures of the first two clusters belong to trimer1, and that of the third cluster is in the trimer2 form. As to tetramers, the representative structures of the three clusters are in tetramer4, tetramer5, tetramer2 forms, sequentially. It is notable that tetramer2 has a potential to be changed to tetramer4 given the two CP types have similar topologies. We believed that some of those representative structures can be valuable drug targets for designing small molecular inhibitors which can interfere Aβ42 oligomerization.
Figure 13:
The presentative structures of oligomers. The structures were obtained by k-means clustering analysis. The monomers are shown in different colors and the end with sphere is N−terminus. The solid grey circles represent center of mass of the monomers. The analysis was performed using oligomeric structures collected from all the 500-ns MD simulations for all the systems.
DISCUSSIONS
The concentration problem on studying protein aggregation has been reviewed by Carballo−Pacheco and Strodel.14 Applying the Smoluchowski coagulation equation to two noninteraction monomers, they found out that the diffusion time (namely dimerization time in our work) for the two separated monomers to form dimer at 298 K is inversely proportional to the monomer concentration. If we apply their diffusion equation, the dimerization time will be 7, 10, 15, 20 and 36 ns for the monomer concentrations of 21.13, 13.42, 9.44, 6.85 and 3.91 mM, respectively. The corresponded dimerization time which obtained from our simulation were 1, 3, 4, 7 and 38 ns. Thus, only at the concentration of 3.91 mM, our simulation gave a little slower dimerization time than that obtained by using the diffusion equation (38 ns vs 36 ns), while at higher monomer concentrations, the dimerization time obtained from our simulation is much faster. This difference is probably due to the fact that the intermolecular interactions which are well described by the force field potential functions are missing in the Smoluchowski coagulation equation. At high monomer concentrations, the intermolecular interactions between the four-mer peptides, particularly, the hydrophobic interactions, are very strong and should not be ignored in studying the aggregation processes. However, if applying our fitting equation for the dimerization time at 1 mM of monomer concentration (Fig. S2), the dimerization time will be 1018 ns which is much slower than the value (140 ns) predicted using the diffusion equation.14 Our hypothesis is that at low monomer concentrations, the peptides are far from each other and Coulomb interactions are dominant over the van der Waals (vdW) interactions since the former decay much slower than the latter as a function of distance. Additionally, the Aβ42 peptide has a net charge of −3. Considering the repulsive interaction between the Aβ42 peptides, it is understandable that the oligomerization time is slower than the predicted one using the diffusion equation. Therefore, our equations, which were derived using the results of all-atom molecular dynamics simulations for which the long-ranged and short-ranged interactions have been adequately taken into consideration, should give a more accurate prediction.
Because the oligomerization time is sensitive to how an oligomeric state is defined, the equations describing the relationship between the oligomerization time and monomer concentration depend on the definitions of oligomeric states. Equations 1, 2 and 3 are applicable only when the contact state of two monomers is defined by using the minimum intermolecular distance (rmin) between two monomers. However, in the Carballo-Pacheco et al.’s diffusion equation, monomers were assumed as particles. Therefore, to be consistent with their assumption, we also tried to define the contact state between two monomers by using the mass center distance (rcen). The detailed definition of rcen-based contact state is provided in the supporting information. New equations were then established for the rcen-based definition and the evolution of different AβOs along MD simulations and the relationships between oligomerization time and monomer concentrations are shown in Figs. S3, S4 and S5. The new equations, which we named rcen-based equations, are as the following:
| (4) |
| (5) |
| (6) |
where the concentration C is in mM, and oligomerization time in ns. These rcen-based equations showed that the oligomerization time depends on the monomer concentration by power of −1.2 which is close to −1 in Carballo-Pacheco et al.’s diffusion equation. On the other side, Hellstrand et al. have experimentally studied the kinetics of Aβ42 aggregation at different Aβ42 monomer concentrations.43 They found that the equations which describe the monomer concentration dependence of lag-time (τlag) and half-time (τ1/2) as the following:
| (7) |
| (8) |
where the concentration C is in μM, and τlag (τ1/2) is in hour. It is pointed out that our equations for estimating oligomerization time were established at the monomer concentration of mM range, which is much higher than the μM range in in vivo assays and the nM/pM range in cerebrospinal fluid. Naturally, one may wonder if our equations are still valid to predict the oligomerization time when the monomer concentration of Aβ42 is at the nM/pM level. One possible validation is to calculate the oligomerization time by running extensive MD simulations at much lower monomer concentrations. However, it is not feasible for current available computer power to carry out all-atom simulation with explicit solvent for Aβ42 four-mers system at nM monomer concentration. On the other hand, it is interesting to apply our equations, Carballo-Pacheco et al.’s diffusion equation and Hellstrand et al.’s lag-time/half-time equations to predict the oligomerization time of Aβ42 peptides whose monomer concentrations are at the nM and pM ranges and compare these predictions with the experimental observations.
LeVine estimated that it would take about 100 minutes for oligomers to form when the Aβ42 monomer concentration is 100 ng/ml (22.15 nM) at 298 K.11 At this concentration, the dimerization time calculated from the diffusion equation and our rcen-based equation (Eq. 4) are 6.4 ms and 92 ms which are about 106 and 105 time faster. The lag-time and half-time from Hellstrand et al.’s equation are 19 s and 31 s which are about 103 time faster than LeVine’s observation. In contrast, the dimerization time predicted by using our fitting equation (Eq. 1) is 42.6 hours which is 25.6 time slower than LeVine’s experimental result. Encouragingly, the oligomerization time predicted by our equation (Eq. 1) is much closer to LeVine’s experimental result than the other predictions, even though our prediction is one order slower than the experimental result. It is emphasized that, many additive substances (such as sodium dodecyl sulfate) were added to control the oligomerization process in the experiment. Those added substances may slow down or accelerate the oligomerization of Aβ peptides. Therefore, it is a grand challenge to get accurate oligomerization time at a given monomer concentration from experiment.
The effect of Aβ42 monomer concentration on the murine brain has been studied by Puzzo et al.44 The study showed that the Aβ42 at the concentration of 200 pM could positively modulates synaptic plasticity and memory in the hippocampus of the murine brain, while the Aβ42 at the concentration of 200 nM leads to the well-established reduction of potentiation of the murine brain.28 Applying our aforementioned equation (Eq. 3) to this case, we obtained the oligomerization time of toxic tetramer, τSO4, at concentrations of 200 pM and 200 nM are approximately 1731 years and an hour, respectively. In other words, one can say that the picomolar Aβ42 is not harmful to the brain since it will take much longer than a lifetime to form toxic conformations, whereas the nanomolar Aβ42 is dangerous to the brain since the toxic AβOs can be formed in a short time. Notably, if we use Carballo-Pacheco et al.’s diffusion equation, our rcen-based equation (Eq. 6) and Hellstrand et al.’s equation (Eqs. 7 or 8) to calculate the oligomerization time of Aβ peptides, the result will be at minute or hour scale for the picomolar of monomer concentration. It means even at very low Aβ42 monomer concentration as picomolar, Aβ peptides can still be harmful to the brain, and this result is not consistent with Puzzo’s experimental finding.
Alzbiomarker’s statistical data shows that the concentration of soluble Aβ42 in the cerebrospinal fluid and plasma of a healthy person is about 155±78 pM and 9±8 pM, respectively.45 Unfortunately, the accurate information about Aβ42 concentration in certain human brain parts such as hippocampus and cortex is not available yet. However, studies on murine show that the soluble Aβ42 concentration in the hippocampus and cortex of murine’s normal brain may reach several hundred nM.46 Therefore, we assume that the Aβ42 monomeric concentration in human brain is in a range of pM to nM. Interestingly, if the Aβ42 concentration is about 0.8 nM, it will take around 62 years for toxic Aβ42 oligomers occur in the human brain according to our fitting equation Eq. 3. Of course, the number of years for the appearance of the toxic Aβ42 oligomers may not be exact 62 as our predicted one. And it may be faster or slower since we have not had the accurate information about the Aβ42 monomer concentration in the brain. Additionally, in this work, we simply considered the oligomerization of Aβ42 peptides in water and neglected the effect of the brain environment on the oligomerization process. Thus, the real oligomerization time in brain may be different from the predicted one. Nevertheless, our result at least agrees with the fact that most often AD onsets occur in people 65 years of age and older and the onsets of neurodegenerative diseases increase with the age.1,2
Characterizing the structure of Aβ42 oligomers is vital to understanding the oligomerization pathways and the oligomer toxicity, but it is also a grand challenge. The oligomerization can follow multiple pathways leading to the diversity and complexity of oligomer structures.6,24,26 Despite of many different pathways, the oligomerization process shows a common feature, the growth of β-sheet structures with the oligomerization time. Our simulations showed that during the oligomerization process the overall β-content slightly increased at all the considered monomer concentrations (Fig. S6a), while the secondary structures of each monomer frequently exchanged (Fig. S7), which indicates the monomers undergo structural rearrangements and self-assembled into dimers, trimers and tetramers in the lag phase.26 The difference of the profiles of the secondary structures for the same oligomer structure (dimers/trimers/tetramers) forming at different monomer concentrations may be a product of the pathway abundance. The dependence of the oligomer life time on the monomer concentration also makes contribution to the diversity of the profiles of the secondary structures. For example, the life time of a dimer at a high monomer concentration was shorter than the one at a lower concentration (Fig. 2d), while the life time of a tetramer was inversely proportional to the monomer concentration (Fig. 2f).
The secondary structures of the low molecular weight (LMW) Aβ42 oligomers have been investigated by both experimental and simulation studies, insensitively. The secondary structural profiles of the oligomers obtained in this study were quite similar for different AβOs (Fig. 6). This result is similar to that of Aβ42 dimer studied by replica exchange molecular dynamic (REMD) simulations using the ff14SB force field.47 Additionally, the overall secondary structure of the four-mers Aβ42 systems was only slightly changed during the simulation (Fig. S6). This is probably due to the fact that the initial structures used in this study were already well sampled by extensive REMD simulation in our previous study.25 Another possible reason is that at high monomer concentration, tetramer is formed at very early oligomerization phase and the life time of dimer and trimer may be shorter than otherwise. Moreover, our observation that there is little change of secondary structures between Aβ oligomers in early oligomerization phase, is consistent with Barz et al.’s finding which is supported by previous experiments.48,49 In fact, the reported secondary structures of the Aβ42 oligomers differed from study to study, probably due to the different conditions of experimental studies and different setting of simulation especially the employed force fields. This difference may also be explained by the hypothesis that Aβ42 is intrinsically disordered at the early state of its aggregation. The β-content of the Aβ42 oligomers obtained in our simulation was about 8 ± 8%, which is similar to that (8%) generated in the REMD study using the force field OPLS50 and SPC/E51 water model for Aβ42 dimer,52 and the one (7.2%) reported for dimer and tetramer by Barz et al.24 If including the error bar, our dimeric β-content value is close to 13% as reported by CD experiments on Aβ42 at pH 7.5 at time zero,53 12.43% for Aβ42 dimer from REMD simulation using AMBER99SB-ILDN force field54 and TIP3P water model55 by Zou et al.,33 In our previous REMD simulation study using different force fields for Aβ42 dimer, the β-content is 11.3% from CHARMM22* force field,56 13.8% from ff14SB force field, 24.3% from AMBER99SB-ILDN force field and 20.2% from OPLS force field. Das et al. obtained the β-content about 18% for Aβ42 dimer from REMD simulation with from OPLS force field and TIP3P water model,57 while Sun et al. observed a quite high β-sheet content of the dimer about 42.2% by using REMD simulation with GROMOS96 53a6 force field.34 Recently, Nguyen et al. performed multi-scale MD simulations to investigate structures of Aβ42 tetramer. They found that the β-sheet content of the tetramer is about 19%,40 which is significantly different from that (34%) reported by Brown et al.35
Despite there is very little variation in the overall secondary structure during simulation, the helix and β-sheet profiles of dimers along the amino acid sequence are significant different from those of trimers and tetramers. For instance, dimers had lower helix but higher β-sheet propensities than trimers and tetramers, suggesting that during the early phase of oligomer formation, monomer peptides with high β-sheet propensity is preferred. It is noted that this finding has not been reported in any previous study, therefore, it needs to be validated by experimental studies. Interestingly, Thu et al. revealed that there is a high correlation between the aggregation rate of amyloid-β peptide and β-content in monomeric state.58
The hydrophobic solvent accessible surface area of the dimer obtained by our simulation varied from 20 to 31 nm2 with a maximum peak at about 25 nm2 (Fig. S13), which is quite close to Barz et al.’s result (varying from 22 to 33 nm2 with maximum peak at about 28 nm2).24 A smaller hbSASA value, 23 nm2, of the coarse-grained Aβ42 dimer was observed from discrete molecular dynamics simulations. Similar to the dimer, the hbSASA values of Aβ42 tetramer (from 36 to 52 nm2 with the peak at 44 nm2) is smaller than the ones reported in Barz et al.’s study (from 44 to 56 nm2 with the peak at 50 nm2).24 The larger hbSASA of The Aβ42 oligomers in Barz et al.’s study is due to the difference of criteria to define the contact state between two monomers. In this work, we used a distance cutoff of 0.3 nm for rmin to define the contact state, while Barz et al. used a much larger cutoff, 0.5 nm.
The current experimental means cannot determine the structures of oligomers and the oligomerization time cannot be accurately measured, even though many important parameters of oligomers, such as chemical shifts, absorption spectra of the amide I band and collisional cross sections (CCS), can be measured by experiment. Although accessing the structures of oligomers at atomistic level is limited by the accuracy of employed force fields and the adequacy of sampling, molecular dynamics simulation, a complementary technique to the experimental means, can overcome some limitations of conventional biophysical techniques. Molecular modeling in combination with some experimentally determined parameters can allow us to predict the oligomer structures with a reasonable accuracy. The Aβ42 oligomerization process and oligomeric structures were experimentally investigated by using ion mobility coupled with mass spectrometry.48,59,60 The CCS (in Å2) of Aβ42 was reported to be 1256 by Bernstein et al.,59 1246 by Zheng et al.60 and 952–982 by Pujol-Pina et al.48 For Aβ42 trimer, the CCS was reported to be 1234–1243 by Pujol-Pina et al. As to Aβ42 tetramer, the CCS was reported to be 2332 by Bernstein et al.,59 21722 by Zheng et al.60 and 1474–1556 by Pujol-Pina et al.48 The CCS values of Aβ42 dimers in our simulation varied from 1334 ± 68 to 1365 ±59, which is slightly larger than those obtained by experiment,48,59,60 and from previous simulation (1188–1242).24 Similarly, the CCS of Aβ42 trimer in our simulation was also larger than the experimental value.48 This result is reasonable since the monomer concentrations in our simulation are much higher than the one used in experiment and the life of a dimer and trimer in the simulation is much shorter than that in the experiment. For the Aβ42 tetramer, the largest oligomer in our simulation, all the six CP types were well sampled to cover the structures finding in experiments. Therefore, the CCS values of Aβ42 tetramers forming in our simulation, which were from 2095 ± 55 to 2459 ± 85, covered the experimental values, 2172 and 2332. As shown in Fig. 8, at monomer concentration of 3.81 mM, the observed CP types are tetramer1 (30%), tetramer4 (30%) and tetramer5 (40%). The calculated CCS will be 0.3 × 2389 + 0.3 × 2274 + 0.4 × 2229 = 2290.5, using the CCS parameters listed in Table 2. The calculated value for tetramers at 3.81 mM, 2290.5, is close to the experimental value, 2332. This result also suggested that the structures sampled at a monomer concentration of 3.81mM, although much high than that in physiological condition, well resembled those obtained at much lower concentrations.
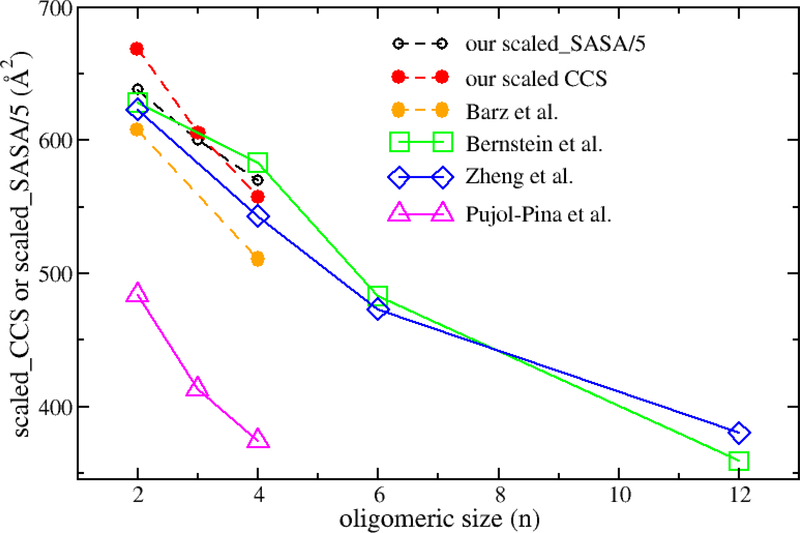
It has been discussed that the CCS values of the same oligomers are different from study to study, and none of the computational studies aimed at reproducing the conditions of the IMS-MS experiments (gas phase, different protonation states) of Aβ oligomers.24 At the experimental level, the differences in the CCS values is due to different conditions and types of ions, while at the computational level, the CCS difference is caused by a number of reasons including the sampled conformations by molecular simulations and methods/tools used to calculate CCS. Thus, comparing CCS of oligomers within a study is more practical than to compare them between different studies. From Bernstein et al.’s finding, which indicated that the apparent ‘size’ of each monomer unit within an oligomer decreases as oligomerization proceeds,59 we analyzed the Aβ42 oligomers’ CCS scaled by the oligomeric size (namely scaled CCS) from previous experimental and simulation studies. As seen in Fig. 14, all the data shows scaled CCS decreases with the increase of the oligomer size, which is in good agreement with Bernstein et al.’s finding. Interestingly, our result showed that the scaled SASA parameter of the oligomers was also consistent with the conclusion drawn for the scaled CCS data.
Figure 14:
The dependence of the scaled CCS and scaled SASA on the oligomeric size. The scaled CCS of an oligomer is calculated by dividing its CCS by its number of monomers. The data labeled with cycles in dashed lines were obtained from simulation: black for scaled-SASA/5 (this work), red for scaled CCS (this work), orange from Barz et al.’s simulation.24 The data labeled with squares, diamonds and triangles in solid lines were from experiment: green by Bernstein et al.,57 blue by Zheng et al. 58 and magenta by Pujol-Pina et al.47 The data from Barz et al.’s study was averaged of extended and compact oligomers.
Using a simple model which assumed that a monomer has spherical shape and experimental CCS values, Bernstein et al. tried to construct ideal arrangements of the monomers in an oligomer structure. For the tetramer, they found that the four monomers arranged in a plane with isosceles trapezoid shape, which is similar to tetramer1 and close to tetramer3 in our CP definition, had the CCS value that is close to experiment. If the error bar of CCS is counted, among the six tetramer CP types, the calculated CCS for tetramer5 and tetramer6 could not match the experimental value. Additionally, tetramer4 and tetramer5 are the most populations of the tetramer forms in our simulations, which also demonstrated a high propensity to have four monomers placed in a plane (Fig. 12), and tetramer4 is a dominant CP type in K-means clustering analysis (Fig. 13). Thus, we suggested that the tetramer4 is the most popular form of Aβ42 tetramer. However, Aβ42 tetramer maybe not be in an ideal form, and it may take various forms which all together make contribution to the experimental CCS value of the tetramer. Interestingly, we found that a high correlation between scaled SASA and CCS in the tetramer structures (Fig. S11). This finding indicates that SASA, which can be fast calculated for the simulation data, is a good substitute of CCS, which is computer resource demanding and time consuming in the oligomer structural analysis.
CONCLUSIONS
For the first time, we established three sets of equations to quantitively describe the relationship between the oligomerization time of Aβ42 peptides and the monomer concentration. Even though we ignored many environmental factors, such as metal ion concentration, pH and temperature, and the Aβ42 concentration in human brains has not been accurately determined yet, our equations quantitively explained why AD is more predominant in the aging populations and why the increasing age is the strongest risk factor of AD.
We have investigated the structures of Aβ42 dimers, trimers and tetramers in term of solvent accessible surface areas and collisional cross sections. Our results are consistent with previous experimental and theoretical findings. For example, both the MD and experiment showed that the larger an oligomer size is, the smaller the apparent ‘size’ of each monomer unit within the oligomer is. Particularly, we classified Aβ tetramer structures into six possible types by considering the contact states of monomer-monomer pairs. Based on the results of structural analysis of Aβ42 oligomers at five different concentrations, we concluded that tetramer4 and tetramer5 are the most abundant tetramer structures, and the CCS value obtained from Bernstein et al.’s experiment may be the average of the CCS values from all six tetramer forms with different weights of contribution. The exact population of the six CP types depends on the monomer concentration. At the lowest concentration of 3.91 mM, the calculated CCS agrees very well with the measured one and the prediction error is 1.8%. The identified representative structures of tetramers could be potential drug target for developing new generation of anti-AD drugs given the fact that the sampling adequacy is well validated by the experimental CCS parameter.
METHODS
A four-mer initial structure was placed at the center of an octagonal box, solvated and neutralized by adding sodium ions. The smallest distance between any atom of the peptides to the border of the box was set to 10–16 Å. The number of added water molecules and the volume of a system which are listed in Table 1 determine the concentration of the system. All the molecular dynamics simulations were carried out using the pmemd.cuda module of the AMBER 16 software package61 with the ff14SB force field.47 The TIP3P water model55 was used for the explicit solvent simulations with periodic boundary conditions in octahedron boxes. The long-range Coulomb interaction was evaluated by means of the Particle-Mesh Ewald (PME) method62 with a 10 Å cutoff and an Ewald coefficient of 0.30768. The van der Waals interactions were calculated by means of a 10 Å atom-based nonbonded lists, with continuous corrections applied to the long-range parts. The constant pressure simulations were carried out at 1 atm via the Berendsen barostat63 with pressure relaxation time τp being set to 3.0 ps. Each simulation system underwent the following steps. First, the steepest descent minimization followed by a conjugate gradient minimization with the peptide atoms fixed at their initial positions, then unrestrained the steepest descent minimization followed by conjugate gradient minimization were carried out. This step was followed by a short MD simulation under constant volume while the system was heated from 0 K to 310 K with weak restraints on the protein atoms. Next, a Langevin dynamics at constant temperature (310 K) and constant pressure (1 atm) were applied for 100 picoseconds (ps), after which the density of the system was found to be stable around 1.0 g/cm3. Finally, in the sampling phase, a 500-nanosecond (ns) constant volume MD run at 310 K were generated using the leap- frog algorithm with a time step of 2 femtoseconds (fs). The temperature was regulated using Langevin dynamics with a collision frequency of 1 ps-1. The SHAKE algorithm64 was applied to all bonds involving hydrogen atoms. Conformations were saved every ten picoseconds for postanalysis. In total, 50,000 snapshots were saved for post-analysis for each simulation system.
The secondary structure contents classified into β, helix and random coil were calculated by using the STRIDE algorithm.65,66 Here, the helix content includes 3–10 helix, Pi helix and αhelix, the β one consists of extended residues, and the rest is random coil. The CCS of the Aβ42 oligomers were calculated using HPCCS package67 with the trajectory method. The solvent accessible surface area (SASA) which includes hydrophobic solvent accessible surface area (hbSASA) and hydrophilic solvent accessible surface area (pSA) was calculated by using the gmx sasa tool from GROMACS package.68 A residue–residue contact is formed if the distance between the centers of mass of two residue side chains is within 6.5 Å.
The planar angle of a structure containing four monomers (namely i, j, k and l) was calculated by the following steps. First, all possible dihedral angles, which are combinations of the four mass centers of the monomers in different orders, were calculated and took their absolute values, in another word, the calculated dihedral angles vary from 0 to 180 degrees. Second, if a calculated dihedral angle is larger than 90 degrees, it is subtracted from 180 degrees and the new value is the difference. We named the dihedral angels after above treatments as derivative dihedral angles, which vary from 0 to 90 degrees. Finally, the smallest derivative dihedral angle was chosen as the planar angle of the tetramer.
We applied the k-means clustering method42 to obtain three representative structures for each oligomer including dimer, trimer and tetramer. For the dimers, the variables for the clustering performance include the distance between center of mass, the minimum distance of two monomers and the number of the intermolecular residue-residue interactions. For the trimers and tetramers, two types of clustering variables were applied, which are the distances between any monomer-monomer pair (3 distances for a trimer and 6 distances for a tetramer) and the number of the intermolecular residue-residue interactions. Two residues will be in interact state if the minimum atom-atom distance between them is within 3 Å. To avoid the degeneracy caused by the order of the monomers in trimers and tetramers as mentioned in previous study,69 we sort all the minimum distances out and reordered them by decreasing order. To get equally weights for all the variables, we carried out normalization for the variables before applying them in clustering analysis.
Supplementary Material
ACKNOWLEDGEMENTS
This work was supported by Grants R01-GM079383, R21-GM097617, P30-DA035778 from the National Institutes of Health. The content is solely the responsibility of the authors and does not necessarily represent the official views of the National Institutes of Health or other funding organizations. Computational support from the Center for Research Computing of University of Pittsburgh and Pittsburgh Supercomputing Center (CHE180028P) is acknowledged.
Footnotes
The authors declare that they have no competing financial interests
ASSOCIATED CONTENT
Supporting information includes the solvent accessible surface areas (SASA) of the oligomers (Table S1), the number of SOi→SOj state transition (Fig. S1), the dependence of dimeric and trimeric oligomerization times on the monomer concentrations (Fig. S2), the result related to the rcen-based contact state (Figs. S3, S4 and S5), the time dependence of the secondary structures (Figs. S6 and S7), the secondary structure profile of the oligomers along the sequence (Figs. S8, S9 and S10), the correlation between the collisional cross sections (CCS) and SASA of tetramers (Fig. S11), the SASA distributions of the oligomers (Figs. S12 and S13), the CCS distribution of the oligomers (Figs. S14 and S15) and the intermolecular side chain-side chain interaction of Aβ42 peptides in the oligomer structures (Fig. S16). This information is available free of charge via the Internet at http://pubs.acs.org.
References
- (1).Organization, W. H. Dementia, http://www.who.int/en/news-room/factsheets/detail/dementia, Accessed: 2018-08-11.
- (2).Henderson AS; Jorm AF Dementia; John Wiley & Sons Ltd, 2002. [Google Scholar]
- (3).Burns A; Iliffe S Alzheimer’s disease. The BMJ. 2009, 338b158. [DOI] [PubMed] [Google Scholar]
- (4).Hy LX; Keller DM Prevalence of AD among whites: a summary by levels of severity. Neurology. 2000, 55, 198–204. [DOI] [PubMed] [Google Scholar]
- (5).Hardy J; Selkoe DJ The amyloid hypothesis of Alzheimer’s disease: Progress and problems on the road to therapeutics. Science 2002, 297, 353–356. [DOI] [PubMed] [Google Scholar]
- (6).Cline EN; Bicca MA; Viola KL; Klein WL The Amyloid-Oligomer Hypothesis: Beginning of the Third Decade. J. Alzheimers Dis. 2018, 64, S567–S610. [DOI] [PMC free article] [PubMed] [Google Scholar]
- (7).Kamenetz F; Tomita T; Hsieh H; Seabrook G; Borchelt D; Iwatsubo T; Sisodia S; Malinow R APP Processing and Synaptic Function. Neuron. 2003, 37(6), 925–37. [DOI] [PubMed] [Google Scholar]
- (8).Pearson HA; Peers C Physiological roles for amyloid β peptides. J. Physiol. 2006, 575, 5–10. [DOI] [PMC free article] [PubMed] [Google Scholar]
- (9).Giuffrida ML; Caraci F; Pignataro B; Cataldo S; Bona PD; Bruno V; Molinaro G; Pappalardo G; Messina A; Palmigiano A; Garozzo D; Nicoletti F; Rizzarelli E; Copani A β-Amyloid Monomers Are Neuroprotective. J. Neurosci. 2009, 29, 10582–10587. [DOI] [PMC free article] [PubMed] [Google Scholar]
- (10).Klug GMJA; Losic D; Subasinghe SS; Aguilar M; Martin LL; Small DH β-Amyloid protein oligomers induced by metal ions and acid pH are distinct from those generated by slow spontaneous ageing at neutral pH. Eur. J. Biochem. 2003, 270, 4282–4293. [DOI] [PubMed] [Google Scholar]
- (11).LeVine H Alzheimer’s β-peptide oligomer formation at physiologic concentrations. Anal. Biochem. 2004, 335, 81–90. [DOI] [PubMed] [Google Scholar]
- (12).Iljina M; Garcia GA; Dear AJ; Flint J; Narayan P; Michaels TCT; Dobson CM; Frenkel D; Knowles TPJ; Klenerman D Quantitative analysis of co-oligomer formation by amyloid-beta peptide isoforms. Scientific Reports. 2016, 6, 28658. [DOI] [PMC free article] [PubMed] [Google Scholar]
- (13).Novo M; Freire S; Al-Soufi W Critical aggregation concentration for the formation of early Amyloid-β (1–42) oligomers. Scientific Reports. 2018, 8, 1783. [DOI] [PMC free article] [PubMed] [Google Scholar]
- (14).Carballo-Pacheco M; Strodel B Advances in the Simulation of Protein Aggregation at the Atomistic Scale. J. Phys. Chem. B. 2016, 120, 2991–2999. [DOI] [PubMed] [Google Scholar]
- (15).Saric A; Chebaro YC; Knowles TPJ; Frenkel D Crucial role of nonspecific interactions in amyloid nucleation. Proc. Natl. Acad. Sci. U.S.A. 2014, 111, 17869–17874. [DOI] [PMC free article] [PubMed] [Google Scholar]
- (16).Ghosha P; Vaidyab A; Kumarcd A; Rangachar V Determination of critical nucleation number for a single nucleation amyloid-β aggregation model. Math. Biosci. 2016, 273, 70–79. [DOI] [PMC free article] [PubMed] [Google Scholar]
- (17).Shankar GM; Li S; Mehta TH; Garcia-Munoz A; Shepardson NE; Smith I; Brett FM; Farrell MA; Rowan MJ; Lemere CA; Regan CM; Walsh DM; Sabatini BL; Selkoe DJ Amyloid-β protein dimers isolated directly from Alzheimer’s brains impair synaptic plasticity and memory. Nat. Med. 2008, 14, 837–842. [DOI] [PMC free article] [PubMed] [Google Scholar]
- (18).Ono K; Condron MM; Teplow DB Structure–neurotoxicity relationships of amyloid β-protein oligomers. Proc. Natl. Acad. Sci. 2009, 106, 14745–14750. [DOI] [PMC free article] [PubMed] [Google Scholar]
- (19).Mannini B; Mulvihill E; Sgromo C; Cascella R; Khodarahmi R; Ramazzotti M; Dobson CM; Cecchi C; Chiti F Toxicity of Protein Oligomers Is Rationalized by a Function Combining Size and Surface Hydrophobicity. ACS Chem. Biol. 2014, 9, 2309–2317. [DOI] [PubMed] [Google Scholar]
- (20).Sengupta U; Nilson AN; Kayed R The Role of Amyloid-β Oligomers in Toxicity, Propagation, and Immunotherapy. EBioMedicine. 2016, 6, 42–49. [DOI] [PMC free article] [PubMed] [Google Scholar]
- (21).Yang T; Li S; Xu H; Walsh DM; Selkoe DJ Large Soluble Oligomers of Amyloid β-Protein from Alzheimer Brain Are Far Less Neuroactive Than the Smaller Oligomers to Which They Dissociate. J. Neurosci. 2017, 37, 152–163. [DOI] [PMC free article] [PubMed] [Google Scholar]
- (22).Jana MK; Cappai R; Pham CLL; Ciccotosto GD Membrane-bound tetramer and trimer Aβ oligomeric species correlate with toxicity towards cultured neurons. J. Neurochem. 2016, 136, 594–608. [DOI] [PubMed] [Google Scholar]
- (23).Morgan C; Colombres M; Nunez MT; Inestros NC Structure and function of amyloid in Alzheimer’s disease. Prog. Neurobiol. 2004, 74, 323–49. [DOI] [PubMed] [Google Scholar]
- (24).Barz B; Liao Q; Strodel B Pathways of Amyloid-β Aggregation Depend on Oligomer Shape. J. Am. Chem. Soc. 2018, 140, 319–327. [DOI] [PubMed] [Google Scholar]
- (25).Man VH; Nguyen PH; Derreumaux P High-Resolution Structures of the Amyloidβ1−42 Dimers from the Comparison of Four Atomistic Force Fields. J. Phys. Chem. B. 2017, 121, 5977–5987. [DOI] [PMC free article] [PubMed] [Google Scholar]
- (26).Ilie IM; Caflisch A Simulation Studies of Amyloidogenic Polypeptides and Their Aggregates. Chem. Rev. 2019, 119, 6956–6993. [DOI] [PubMed] [Google Scholar]
- (27).Urbanc B; Cruz L; Yun S; Buldyrev SV; Bitan G; Teplow DB; Stanley HE In Silico Study of Amyloid β-Protein Folding and Oligomerization. Proc. Natl. Acad. Sci. U.S.A. 2004, 101, 17345–17350. [DOI] [PMC free article] [PubMed] [Google Scholar]
- (28).Man VH; Nguyen PH; Derreumaux P Conformational Ensembles of the Wild-Type and S8C Aβ1–42 Dimers. J. Phys. Chem. B. 2017, 121, 2434–2442. [DOI] [PMC free article] [PubMed] [Google Scholar]
- (29).Lambert MP; Barlow AK; Chromy BA; Edwards C; Freed R; Liosatos M; Morgan TE; Rozovsky I; Trommer B; Viola KL; Wals P; Zhang C; Finch CE; Krafft GA; Klein WL Diffusible, nonfibrillar ligands derived from Aβ1−42 are potent central nervous system neurotoxins. Proc. Natl. Acad. Sci. 1998, 95, 6448–6453. [DOI] [PMC free article] [PubMed] [Google Scholar]
- (30).Tycko R Amyloid Polymorphism: Structural Basis and Neurobiological Relevance. Neuron. 2015, 86, 632–645. [DOI] [PMC free article] [PubMed] [Google Scholar]
- (31).Cohen SIA; Linse S; Luheshi LM; Hellstrand E; White DA; Rajah L; Otzen DE; Vendruscolo M; Dobson CM; Knowles TPJ Proliferation of amyloidβ42 aggregates occurs through a secondary nucleation mechanism. Proc. Natl. Acad. Sci. U.S.A. 2013, 110, 9758–9763. [DOI] [PMC free article] [PubMed] [Google Scholar]
- (32).Saha S; Deep S Protein Aggregation: Elucidation of the Mechanism and Determination of Associated Thermodynamic and Kinetic Parameters. Current Physical Chemistry. 2014, 4, 114–136. [Google Scholar]
- (33).Zou Y; Qian Z; Chen Y; Qian H; Wei G; Zhang Q Norepinephrine Inhibits Alzheimer’s Amyloid-β Peptide Aggregation and Destabilizes Amyloid-β Protofibrils: A Molecular Dynamics Simulation Study. ACS Chem. Neurosci. 2019, 10, 1585–1594. [DOI] [PubMed] [Google Scholar]
- (34).Sun Y; Qiana Z; Wei G The inhibitory mechanism of a fullerene derivative against amyloid-β peptide aggregation: an atomistic simulation study. Phys. Chem. Chem. Phys. 2016, 18, 12582–12591. [DOI] [PubMed] [Google Scholar]
- (35).Brown AM; Bevan DR Molecular Dynamics Simulations of Amyloid β-Peptide (1–42): Tetramer Formation and Membrane Interactions. Biophys. J. 2016, 111, 937–949. [DOI] [PMC free article] [PubMed] [Google Scholar]
- (36).Chi EY; Krishnan S; Randolph TW; Carpente JF Physical Stability of Proteins in Aqueous Solution: Mechanism and Driving Forces in Nonnative Protein Aggregation. Pharm. Res. 2003, 20, 1325–1336. [DOI] [PubMed] [Google Scholar]
- (37).Chennamsetty N; Helk B; Voynov V; Kayser V; Trout L, Aggregation-Prone B Motifs in Human Immunoglobulin G. J. Mol. Biol. 2009, 391, 404–413. [DOI] [PubMed] [Google Scholar]
- (38).Berhanu WM; Hansmann UHE Side-chain hydrophobicity and the stability of Aβ16−22 aggregates. Protein Sci. 2012, 21, 1837–1848. [DOI] [PMC free article] [PubMed] [Google Scholar]
- (39).Ladiwala ARA; Litt J; Kane RS; Aucoin DS; Smith SO; Ranjan S; Davis J; Nostrand WEV; Tessier PM Conformational Differences between Two Amyloid β Oligomers of Similar Size and Dissimilar Toxicity. J. Biol. Chem. 2012, 287, 24765–24773. [DOI] [PMC free article] [PubMed] [Google Scholar]
- (40).Nguyen HL; Krupa P; Nguyen MH; Linh HQ; Li MS Structure and Physicochemical Properties of Aβ42 Tetramer: Multi-Scale Molecular Dynamics Simulations. J. Phys. Chem. B. 2019, 123, 7253–7269. [DOI] [PubMed] [Google Scholar]
- (41).Luhrs T; Ritter C; Adrian M; Riek-Loher D; Bohrmann B; Doeli H; Schubert D; Riek R 3D structure of Alzheimer’s amyloid-beta(1–42) fibrils. Proc. Natl. Acad. Sci. 2005, 102, 17342–17347. [DOI] [PMC free article] [PubMed] [Google Scholar]
- (42).Lloyd SP Least squares quantization in pcm. IEEE Transactions on Information Theory. 1982, 28, 129–137. [Google Scholar]
- (43).Hellstrand E; Boland B; Walsh DM; Linse S Amyloidβ-Protein Aggregation Produces Highly Reproducible Kinetic Data and Occurs by a Two-Phase Process. ACS Chem. Neurosci. 2010, 1, 13–18. [DOI] [PMC free article] [PubMed] [Google Scholar]
- (44).Puzzo D; Privitera L; Leznik E; Fa M; Staniszewski A; Palmeri A; Arancio O Picomolar Amyloid-β Positively Modulates Synaptic Plasticity and Memory in Hippocampus. J. Neurosci. 2008, 28, 14537–14545. [DOI] [PMC free article] [PubMed] [Google Scholar]
- (45).Alzbiomarker, Alzbiomarker, 2018, https://www.alzforum.org/alzbiomarker.
- (46).Zerbinatti CV; Wozniak DF; Cirrito J; Cam JA; Osaka H; Bales KR; Zhuo M, Paul SM; Holtzman DM; Bu G Increased soluble amyloid-β peptide and memory deficits in amyloid model mice overexpressing the low-density lipoprotein receptor-related protein. Proc. Natl. Acad. Sci. 2004, 101, 1075–1080. [DOI] [PMC free article] [PubMed] [Google Scholar]
- (47).Maier JA; Martinez C; Kasavajhala K; Wickstrom L; Hauser KE; Simmerling C ff14SB: Improving the Accuracy of Protein Side Chain and Backbone Parameters from ff99SB. J. Chem. Theory Comput. 2015, 11, 3696–3713. [DOI] [PMC free article] [PubMed] [Google Scholar]
- (48).Pujol-Pina R; Vilaprinylo-Pascual S; Mazzucato R; Arcella A; Vilaseca M; Orozco M; Carulla N SDS-PAGE analysis of Aβ oligomers is disserving research into Alzheimer’s disease: appealing for ESI-IM-MS. Scientific Reports. 2015, 5, 14809. [DOI] [PMC free article] [PubMed] [Google Scholar]
- (49).Kotler SA; Brender JR; Vivekanandan S; Suzuki Y; Yamamoto K; Monette M; Krishnamoorthy J; Walsh P; Cauble M; Holl MMB; Marsh ENG; Ramamoorthy A High-resolution NMR characterization of low abundance oligomers of amyloid-β without purification. Sci. Rep. 2015, 5, 11811. [DOI] [PMC free article] [PubMed] [Google Scholar]
- (50).Kaminski GA; Friesner RA; Tirado-Rives J; Jorgensen WL Evaluation and Reparameterization of the OPLS-AA Force Field for Proteins via Comparison with Accurate Quantum Chemical Calculations on Peptides. J. Phys. Chem. B. 2001, 105, 6474–6487. [Google Scholar]
- (51).Berendsen H; Postma J; van Gunsteren W; Hermans J In Intermolecular Forces; Reidel, 1981. [Google Scholar]
- (52).Zhang T; Zhang J; Derreumaux P; Mu Y Molecular Mechanism of the Inhibition of EGCG on the Alzheimer Aβ1–42 Dimer. J. Phys. Chem. B. 2013, 117, 3993–4002. [DOI] [PubMed] [Google Scholar]
- (53).Kirkitadze MD; Condron MM; Teplow DB Identification and characterization of key kinetic intermediates in amyloid β-protein fibrillogenesis. J. Mol. Biol. 2001, 312, 1103–1119. [DOI] [PubMed] [Google Scholar]
- (54).Lindorff-Larsen K and Piana S and Palmo K and Maragakis P and Klepeis JL and Dror RO and Shaw DE, Improved side-chain torsion potentials for the AMBER99SB protein force field. Proteins Struct. Funct. Bioinf. 2010, 78, 1950. [DOI] [PMC free article] [PubMed] [Google Scholar]
- (55).Jorgensen WL; Chandrasekhar J; Madura JD; Impey RW; Klein ML Comparison of simple potential functions for simulating liquid water. J. Chem. Phys. 1983, 779, 926–935. [Google Scholar]
- (56).Piana S; Lindorff-Larsen K; Shaw DE How Robust Are Protein Folding Simulations with Respect to Force Field Parameterization? Biophys. J. 2011, 100, L47–L49. [DOI] [PMC free article] [PubMed] [Google Scholar]
- (57).Das P; Chacko AR; Belfort G Alzheimer’s Protective Cross-Interaction between WildType and A2T Variants Alters Aβ42 Dimer Structure. ACS Chem. Neurosci. 2017, 8, 606–618. [DOI] [PubMed] [Google Scholar]
- (58).Thu TTM; Co NT; Tu LA; Li MS Aggregation rate of amyloid beta peptide is controlled by beta-content in monomeric state. J. Chem. Phys. 2019, 150, 225101. [DOI] [PubMed] [Google Scholar]
- (59).Bernstein SL; Dupuis NF; Lazo ND; Wyttenbach T; Condron MM; Bitan G; Teplow DB; Shea J-E; Ruotolo BT; Robinson CV; Bowers MT Amyloid-β protein oligomerization and the importance of tetramers and dodecamers in the aetiology of Alzheimer’s disease. Nature Chemistry. 2009, 1, 326–331. [DOI] [PMC free article] [PubMed] [Google Scholar]
- (60).Zheng X; Liu D; Roychaudhuri R; Teplow DB; Bowers MT Amyloid β-Protein Assembly: Differential Effects of the Protective A2T Mutation and Recessive A2V Familial Alzheimer’s Disease Mutation. ACS Chem. Neurosci. 2015, 6, 1732–1740. [DOI] [PMC free article] [PubMed] [Google Scholar]
- (61).Case DA et al. “AMBER 16”; University of California: San Francisco, 2016. [Google Scholar]
- (62).Essmann U; Perera L; Berkowitz ML; Darden T; Lee H; Pedersen LG A smooth particle mesh Ewald method. J. Chem. Phys. 1995, 103, 8577–8593. [Google Scholar]
- (63).Berendsen HJC; Postma JPM; van Gunsteren WF; Dinola A; Haak JR Molecular dynamics with coupling to an external bath. J. Chem. Phys. 1984, 81, 3684–3690. [Google Scholar]
- (64).Forester TR; Smith W SHAKE, rattle, and roll: Efficient constraint algorithms for linked rigid bodies. J. Comput. Chem. 1998, 19, 102–111. [Google Scholar]
- (65).Frishman D; Argos P Knowledge-based secondary structure assignment. Proteins: Structure, Function, and Genetics. 1995, 23, 566–579. [DOI] [PubMed] [Google Scholar]
- (66).Heinig M; Frishman D STRIDE: a Web server for secondary structure assignment from known atomic coordinates of proteins. Nucleic Acids Res. 2004, 32, W500–2. [DOI] [PMC free article] [PubMed] [Google Scholar]
- (67).Zanotto L; Heerdt G; Souza PCT; Araujo G; Skaf MS High performance collision cross section calculation-HPCCS. J. Comput. Chem. 2018, 39, 1675–1681. [DOI] [PubMed] [Google Scholar]
- (68).Eisenhaber F; Lijnzaad P; Argos P; Sander C; Scharf M The Double Cubic Lattice Method: Efficient Approaches to Numerical Integration of Surface Area and Volume and to Dot Surface Contouring of Molecular Assemblies. J. Comput. Chem. 1995, 16, 273–284. [Google Scholar]
- (69).Nguyen PH; Li MS; Derreumaux P Amyloid oligomer structure characterization from simulations: A general method. J. Chem. Phys. 2014, 140, 094105. [DOI] [PubMed] [Google Scholar]
Associated Data
This section collects any data citations, data availability statements, or supplementary materials included in this article.


