

Abstract
Dynamin-Related-Protein 1 (DRP1) critically regulates mitochondrial and peroxisomal fission in multicellular organisms. However, the impact of DRP1 on other organelles, especially its direct influence on ER functions remains largely unclear. Here, we report that DRP1 translocates to endoplasmic reticulum (ER) in response to β-adrenergic stimulation. To further investigate the function of DRP1 on ER-lipid droplet (LD) dynamics and the metabolic subsequences, we generated an adipose tissue-specific DRP1 knockout model (Adipo-Drp1flx/flx). We found that the LDs in adipose tissues of Adipo-Drp1flx/flx mice exhibited more unilocular morphology with larger sizes, and formed less multilocular structures upon cold exposure. Mechanistically, we discovered that abnormal LD morphology occurs because newly generated micro-LDs fail to dissociate from the ER due to DRP1 ablation. Conversely, the ER retention of LDs can be rescued by the overexpressed DRP1 in the adipocytes. The alteration of LD dynamics, combined with abnormal mitochondrial and autophagy functions in adipose tissue, ultimately lead to abnormalities in lipid metabolism in Adipo-Drp1flx/flx mice.
Keywords: energy expenditure, ER retention, LD budding, LD morphology, lipolysis
1 |. INTRODUCTION
Dynamin-related protein 1 (DRP1) is a member of the dynamin superfamily of proteins. It contains prototype dynamin family domains including a large GTPase region needed for vesicle budding.1,2 DRP1 is essential for embryonic development and synapse formation,3,4 and it also plays a central role in both mitochondrial and peroxisomal distribution and fission processes.5–9 A recent study further showed DRP1 alone exerts direct membrane fission function on mitochondria and peroxisomes without assistance of any other dynamins, demonstrating DRP1 possesses membrane constricting and tethering abilities.10 However, no reports define its role in the regulation of other organelles, such as the endoplasmic reticulum (ER) and ER-lipid droplet (LD) complex. Given that mitochondria and ER have physical communication via the mitochondria-fussed ER membrane, it is reasonable to assume that DRP1 plays an essential role in physiological and pathological processes, such as ER stress and energy metabolism on ER.11,12 To support the hypothesis, oligomers of DRP1 has been reported to distribute on ER.13 However, the signaling pathways that regulate ER translocalization of DRP1 and the potential function of ER-located DRP1 remain to be investigated.
LDs are organelles that formed and released from ER. They exist in most multicellular organisms and play key roles in energy metabolism.14 LDs are composed of a neutral lipid core mainly consisting of triglycerides (TG) and a phospholipid monolayer membrane surrounded by multiple proteins.14–16 LDs provide fuels for the essential cellular activities. Due to essential metabolic functions of the organelle, tremendous efforts have been made to understand LD biogenesis, composition, assembly, and its dynamic maintenance.17–19 Recent studies suggest LDs are highly dynamic and multiple protein components on the LD surface tightly regulate LD generation, degradation, and mobilization.16,18,20–23 Due to the critical metabolic functions of LDs, their life cycle receives significant attention.18 It is well accepted that LDs bud primarily from endoplasmic reticulum (ER).24 Therefore, the biogenesis of cytosolic LDs comprises important regulated steps including dissociation of neutral lipid droplets from ER.19 Even though some proteins have been identified to contribute to the budding of LDs from the ER membranes,25–33 other critical factors that govern dynamics of ER-LDs remain poorly characterized.18,33,34
Here, we demonstrate that DRP1 translocates onto ER in adipocytes in response to β-adrenergic stimulation. Protein Kinase A (PKA) pathway is responsible for the process. We further reveal that DRP1 facilitates LD budding from the ER, and hence, new cytosolic LD formation. Deficiency of DRP1 in adipose tissue causes ER retention of LDs, which triggers ER stress and abnormal autophagy. Lack of nascent LDs from ER leads to abnormal morphology of preexisting LDs in cytosol and impaired lipolysis in the DRP1-deficient adipocytes. These pathological changes, together with mitochondrial dysfunction in adipose tissue ultimately cause defective whole-body energy expenditure in Adipo-Drp1flx/flx mice.
2 |. MATERIALS AND METHODS
2.1 |. Animal
All the animal experiments were reviewed and approved by the Animal Welfare Committee of University of Texas Health Science Center at Houston (Animal protocol number: AWC-18-0057). Mice were housed in animal facility under 12-hour light-dark cycle at 22 ± 1°C. The mice had ad libitum access to water and regular chow diet, unless indicated otherwise. C57BL/6J (Stock 000664) and Adiponectin-Cre (Stock 010803) were purchased from The Jackson Laboratory. Drp1 floxed mouse (Drp1flx/flx) was described previously.3 Adipose tissues-specific DRP1 knockout (Adipo-Drp1flx/flx) mice were generated by crossing the lines of Adiponectin-Cre and Drp1flx/flx. For the cold exposure assay, male mice were housed individually in 6°C chamber without bedding and diets. The rectal temperatures were measured every 2 hours during the process.
2.2 |. Body composition
The total body mass, fat mass, and lean mass of mice were measured by an Echo 3-in-1 nuclear magnetic resonance Minispec magnetic resonance imaging (MRI) instrument (EchoMRI, Houston, TX).
2.3 |. Metabolic cage study
Indirect calorimetry analysis was achieved in TSE metabolic chambers (TSE Systems, Chesterfield, MO). Male mice were individually housed in chamber with ad libitum access to water and regular chow diet under 12-hour light/dark cycle. After acclimation in chambers for 1 day, the mice were injected with 1 mg/kg body weight of β3 agonist CL-316,243. Metabolic profiles, including O2 consumption (mL/kg/h), CO2 generation (mL/kg/h), heat generation (kcal/kg/h), respiratory exchange rate (RER; VCO2/VO2), food intake (g), and movements (counts), were continuously recorded before and after injection. The data of 3-hour period before and after injection were used for statistical analysis.
2.4 |. Cell culture
Adipose tissue-derived stromal vascular fraction (SVF) was isolated and cultured as described previously.35,36 Briefly, subcutaneous adipose tissue (sWAT) or brown adipose tissue (BAT) from male mice were dissected, minced, and then, transferred into 10 mL of digestion buffer (1 mg/mL of Collagenase/Dispase in Hank’s Balanced Salt Solution, 3 mM of CaCl2, pH 7.4) in 37°C water bath with gentle agitation for 1 hour. Then, the digestion solution was neutralized by 10 mL of DMEM and the digested tissues were strained through 70 μm strainer, followed by centrifuged at 500× g at 4°C for 15 minutes. The cell pellets were re-suspended in 2 mL of growth medium (DMEM supplemented with 10% of fetal bovine serum, 1× Antibiotic-Antimycotic, and 10 mM of HEPES), and plated in 6-well plates and cultured in a humidified atmosphere of 5% of CO2 at 37°C. After 48 hours, the cells were washed with warm PBS to remove hematocytes and cell debris and replenished with new growth medium. When growing to 70% confluence, the cells were split and re-plated into final experimental vessels. For adipocyte differentiation, the growth medium was changed into white adipocyte induction medium (growth medium with 1 M of dexamethasone, 5 g/mL of insulin, and 0.5 mM of 3-isobutyl-1- methylxanthine, 5 μM rosiglitazone, and 1 nM of 3,5,3′-triiodothyronine) for 2 days, and then, changed into differentiation medium (growth medium with 5 g/mL of insulin and 1 nM of 3,5,3′-triiodothyronine) for 5 more days. Mouse fibroblast 3T3–L1 cells were purchased from American Type Culture Collection (ATCC) and maintained in DEME supplemented with 10% of fetal calf serum and 1× Antibiotic-Antimycotic. When the 3T3–L1 cells were cultured to 100% confluence, the medium was replaced with white adipocyte induction medium for 2 days and differentiation medium for 5 more days as described above.
2.5 |. Lentivirus production and adipocyte infection
The lentivirus was produced and amplified as described previously.37 Briefly, a 10-cm dish of 80% confluent HEK293T cells were co-transfected with 8 μg of transfer plasmid(pLV-GFP or pLV-GFP-Drp1), 6 μg of psPAX2, and 4 μg of pMD2.G using 50 μL of iMFectin Poly DNA Transfection Reagent for 6 hours. Then, the medium was changed into virus collecting medium (DMEM with 10% of FBS and 1% of BSA) and harvested after incubation for 48 hours. The harvested medium was then centrifuged at 5000 rpm for 10 minutes at 4°C to pellet the cell debris, followed by filtering through the 0.45 μm low protein binding filter and concentrating by using Lenti-X Concentrator. The concentrated virus was re-suspended in PBS and stored in −80°C for future use. For adipocyte infection, the virus and polybrene (final concentration 8 μg/mL) were added into SVF cells upon day 2 induction for the white adipocyte differentiation. After 24 hours, the virus-containing medium was changed to normal differentiation medium and kept for 5 more days.
2.6 |. Endoplasmic reticulum (ER) extraction
ER was extracted following the manufacturer’s instruction (Sigma-Aldrich, ER0100). Briefly, 0.5 gram of adipose tissues were homogenized in 2 mL of 1× isotonic extraction buffer and sequentially centrifuged at speed of 1000× g to remove cell debris as well as nuclear, and then, centrifuged at 12 000× g to remove mitochondria. The clear supernatant fraction, together with the top lipid layer was carefully collected and subjected to ultracentrifuging at speed of 100 000× g for 1 hour to isolate ER. The supernatant was discarded and the ER pellet on the bottom was sufficiently suspended in 600 μL of isotonic extraction buffer and subjected to analysis.
2.7 |. Measurement of Oxygen Consumption Rate (OCR) by Seahorse
Oxygen consumption rates (OCR) of brown adipose tissue were measured at 37°C using a Seahorse XFe24 Analyzer (Agilent Technologies) as described previously.35 Briefly, brown adipose tissues were dissected immediately from the sacrificed mice, minced into small pieces, and kept in washing medium (DMEM with 25 mM of glucose, pH 7.4) until analysis. Approximately 5 mg tissues were placed into the well of Islet Capture Microplate (Agilent), covered with screen, and washed twice with assay medium (Seahorse base media with 1 mM of pyruvate, 2 mM of glutamine, and 25 mM of glucose). Immediately after washing, the tissues were incubated in 500 μL assay medium and transferred to Seahorse XFe24 to record the OCR at different time points. The following compounds with indicated doses were used to assess mitochondrial respiration function: 30 μM of oligomycin, 8 μM of carbonyl cyanide 4-(trifluoromethoxy) phenylhydrazone (FCCP), and a mixture of 5 μM of rotenone and 15 μM of antimycin A. The parameters including basal respiration, ATP generation, and proton leak were automatically calculated by the Seahorse Wave software.
2.8 |. Pulse-chase labeling of nascent LDs
For regular LD and/or ER staining, approximately 1 cubic millimeter adipose explants were collected immediately from the sacrificed mice and incubated in 96-well plates filled with 200 μL of incubation medium in a humidified atmosphere containing 5% of CO2 at 37°C. At indicated time points, ER-tracker Green (Thermo Fisher Scientific, Cat. # E34251, final working concentration of 1 μM) or BODIPY 493/503 (Thermo Fisher Scientific, Cat. #D3922, final working concentration of 5 μg/mL) was added to the medium (DMEM with 10 mM of HEPES), respectively. BODIPY-C12 has a chain-length approximately equivalent to that of an 18-carbon fatty acid, which has been broadly used for real-time tracking of lipid synthesis.38 To dynamically measure the uptake and storage of lipids into LDs, BODIPY 558/568-C12 (Thermo Fisher Scientific, Cat. #D3835, final working concentration of 5 μM) was applied for the immunofluorescent pulse-chase experiment. Specifically, explants were first incubated in the BODIPY-C12 containing-medium for 10 minutes. Then, the BODIPY-C12 was quickly removed. Upon washing with warm PBS three times, the tissues were incubated with the ER-tracker containing-medium for 1 or 2 more hours. For the pulse-chasing staining upon functional blocking of mitochondria, 1 mm3-sized explants were incubated in the medium containing BODIPY-C12, 5 μM of Rotenone (mitochondrial respiration complex I inhibitor), and 15 μM of Antimycin A (mitochondrial respiration complex III inhibitor) for 10 minutes. Then, the BODIPY-C12 was washed off and the tissues were incubated in the medium containing ER-tracker, 5 μM of Rotenone (mitochondrial respiration complex I inhibitor) and 15 μM of Antimycin A (mitochondrial respiration complex III inhibitor) for 2 hours. After washed for 3 times with PBS, the explants were fixed in 4% of paraformaldehyde for 30 minutes, and then, washed 3 times with PBS, followed by observation with Leica TCS SP5 Confocal Laser Scanning Microscope. Meanwhile, to confirm the functional blockage of mitochondria with the inhibitors, the oxygen consumption rate (ORC) of these explants were monitored by Seahorse XFe24 Analyzer (Agilent Technologies). The LD localization and LD-ER colocalization were visualized by confocal microscopy. The quantification analysis of the colocalization was obtained by analyzing the Pearson’s correlation coefficient (PCC) with COLOC 2 plugin software in Image J.39
2.9 |. Measurements of levels of glycerol, free fatty acids, and triglyceride
Glycerol levels in serum and tissues were measured by a kit following the manufacturer’s instruction (BioAssay Systems, Cat. #EGLY-200). Briefly, 10 μL of serum or 10 μL clear supernatant from 50 mg tissue samples homogenized in 200 μL of PBS were used for the analysis. Free fatty acid levels in serum and tissues were measured following the manufacturer’s instruction (BioAssay Systems, Cat. #EFFA-100). Briefly, 10 μL of serum or 10 μL clear supernatant from 50 mg tissue samples homogenized in 200 μL of PBS were used for the analysis. Triglyceride levels in ER fraction were measured following the manufacturer’s instruction (Abcam Cat. #65336). About 50 μL of ER fraction with 5% of NP-40 was used for analysis.
2.10 |. Quantitative-PCR (Q-PCR) analysis
Q-PCR analysis has been described previously.36 In brief, total RNAs were isolated using TRIzol reagent (Thermo Fisher Scientific, Cat. #15596026) and illustra RNAspin Mini Kit (GE Healthcare Life Sciences, Cat. #25050072). About 1 μg of total RNAs were reverse-transcribed into cDNAs with RevertAid Reverse Transcription Kit (Thermo Fisher Scientific, Cat. #K1691). Q-PCR was carried out on Bio-Rad CFX96 system (Bio-Rad Laboratories). Results were calculated using the 2−ΔΔCt method36 and normalized by endogenous 18s RNAs. The following primers are used: 18s-F: 5′-AAGTCCCTGCCCTTTGTACACA-3′, 18s-R: 5′-GATCCGAGGGCCTCACTAAAC-3′; Ucp1-F: 5′-CAACTTGGAGGAAGAGATACTGAACA T-3′, Ucp1-R: 5′-TTTGGTTGGTTTTATTC GTGGTC-3′20; Chop-F: 5′-CTCGCTCTCCAGATTC CAGTC-3′, Chop-R: 5′-CTTCATGCGTT GCTTCCCA-3′; Xbp1-s-F: 5′-GGTCTGCTGAGTCCG CAGCAG-3′, Xbp1-s-R: 5′-AGGCT TGGTGTATACATGG-3′.
2.11 |. Western blotting (WB) analysis
Preparation of tissue samples has been described previously.40 The protein samples were separated by SDS-gel, transferred onto methanol pre-wet-PVDF membranes. The membranes were rinsed with 1 X TBST and blocked with 5% of fat-free milk in 1 X TBST containing 0.1% of Tween-20, followed by being incubated with primary antibodies (containing 1% of fat-free milk) at 4°C overnight. After 3 times washing with 1XTBST, the blots were probed with IRDye 800 CW or 680 RD secondary antibodies (LI-COR) and visualized with Odyssey Imaging System (LI-COR). Equal loading was controlled by using anti-Tubulin or anti- β-Actin antibodies. ER fraction proteins were extracted with the Endoplasmic Reticulum Isolation Kit (Sigma) according to the manufacturer’s protocol. Equal loading was controlled by using anti-KDEL antibody. The following antibodies were used for WB analysis: DRP1 (abcam, ab18274), pDRP1 (Ser600/637) (Cell Signaling Technology, 4867), KDEL (abcam, ab12223), COXIV (Cell Signaling Technology, 4850), TOM20 (Cell Signaling Technology, 42406), PDI (Invitrogen, MA3–019), ERK1/2 (Cell Signaling Technology, 9102), PLIN3 (abcam, ab47639), PLIN1 (abcam, ab61682), BIP (ThermoFisher Scientific, PA1–014A), HSL (Cell Signaling Technology, 4107); pHSL (Ser660) (Cell Signaling Technology, 4126); ATGL (Santa Cruz Biotechnology, sc-36527), CGI58 (Santa Cruz Biotechnology, sc-365278), β-ACTIN (BD Biosciences, 61256), and UCP1 (abcam, ab10983).
2.12 |. Immunofluorescent (IF) histology
The preparation of paraffin slides was reported previously.36 The sections of sWAT and BAT were deparaffinized and permeabilized in PBS containing 0.2% of Triton X-100 for 10 minutes. After washing 3 times with PBS, the sections were incubated in sodium citrate buffer at 95°C for 30 minutes for antigen retrieval. Then, the sections were blocked with SEA BLOCK Blocking Buffer (Thermo Fisher Scientific, Cat. #37527) at room temperature for 1 hour and incubated with indicated primary antibodies (1:100 ~ 200 diluted in blocking buffer, refer to the WB analysis section for the antibody information) at 4°C overnight. After 3 time washing with 1 X PBST (PBS containing 0.1% of Tween 20), the sections were incubated with indicated fluorescent signal-conjugated secondary antibodies (1:100 diluted in blocking buffer) at room temperature for 1 hour. Then, the sections were washed with 1 X PBST 3 times and rinsed with double distilled water before mounted with ProLong Diamond Antifade Mountant (Thermo Fisher Scientific, Cat. #P36970) for imaging by confocal microscopy.
2.13 |. Statistical analysis
All data were represented as Mean ± SEM. Statistical analyses were performed by using Graph Pad Prism 8 software (Graph Pad Software Inc). An unpaired Student’s t test was used for statistical significance analysis when two groups were compared. One-way analysis of variance (ANOVA) was use for the comparisons among multiple groups. The statistical differences were analyzed by Student’s t test. A P-value less than .05 was considered to be statistically significant.
3 |. RESULTS
3.1 |. DRP1 translocates to ER and ER-LD interface in adipose tissue upon β-adrenergic stimulation
To investigate DRP1 recruitment onto ER upon cold stimulation, we purified ER fraction from the brown adipose tissue (BAT) of cold exposed mice and their littermate controls at room temperature. Western blotting (WB) revealed more DRP1 in ER fraction from the cold exposed mice (Figure 1A, top panel). More importantly, WB further indicated significant more pDRP1 (phosphorylated DRP1 at Serine 600) on ER (Figure 1A, second panel). The equal loadings were verified by the ER marker proteins, KDEL and PDI (protein disulfide isomerase) (Figure 1A). Quantification of the band densities for DRP1 and pDRP1 by Image J further confirmed the results (Figure 1B). No mitochondria proteins such as COXIV and TOM20, as well as cytoplasmic protein ERK1/2 were detected (Figure 1A), indicating that the ER fraction was purely isolated without contaminations of mitochondrial or cytoplasmic proteins. Of note, similar mitochondrial targeting by the pDRP1 has been reported previously.41 To identify the signaling pathway(s) that triggers the ER translocalization of DRP1, we treated the differentiated 3T3–L1 cells with isoproterenol (ISO) at the presence or absence of PKA-specific inhibitor PKI and detected the co-localization of DRP1 and ER marker protein KDEL. The immunofluorescent staining (IF) with anti-DRP1 antibody revealed that DRP1 formed puncta-structures and these puncta-structures exhibited increased co-localization with KDEL upon ISO treatment (Figure 1C, middle panel). Importantly, treatment by PKI significantly blocked the co-localization (Figure 1C, bottom panel). Pearson’s correlation coefficient (PCC) analysis for colocalization quantification performed in Image J further confirmed the results (Figure 1D).39 The IF staining on subcutaneous white adipose tissue (sWAT) of the cold exposed mice revealed similar ER targeting effect of DRP1 (Figure 1E). Intriguingly, in addition to ER, we further observed DRP1 co-localized with both KDEL and LD marker perilipin-1 (PLIN1) (arrows in Figure 1E), suggesting the translocalization of DRP1 at the interface of ER-LDs in response to cold stimulation. In summary, these data demonstrate that DRP1 is recruited to ER and exhibits unique localization on ER-LD interface upon β3-adrenergic stimulation. Further study on Immuno-Electron Microscopy with specific anti-DRP1 would be able to further confirm our findings about ER translocalization of DRP1.
FIGURE 1.
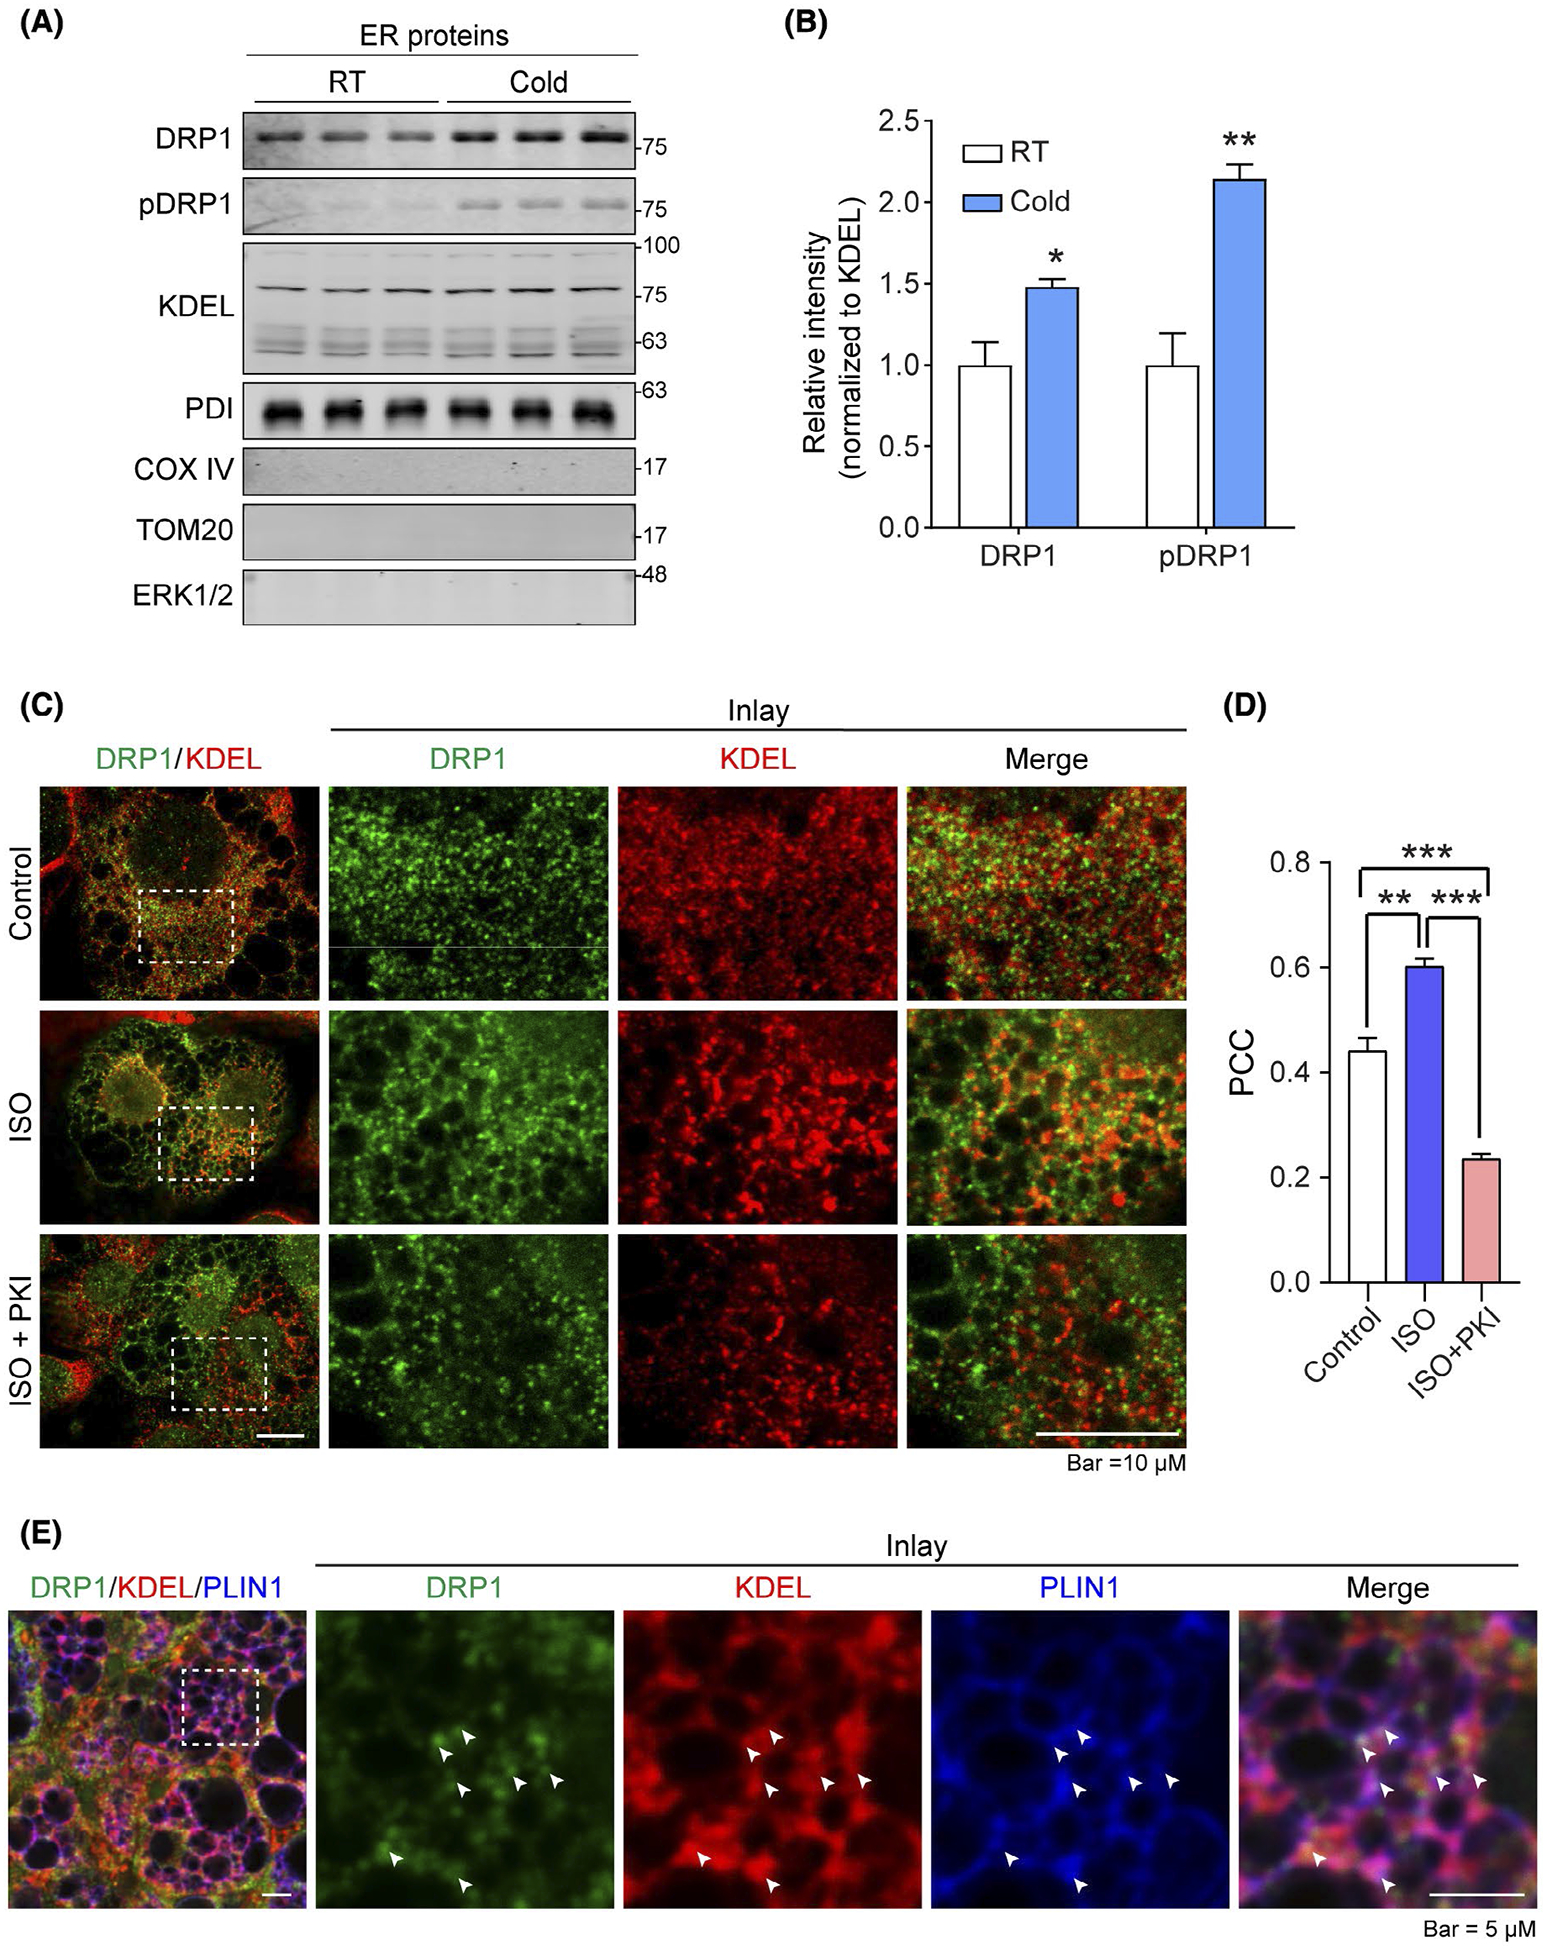
DRP1 translocates onto ER and ER-LD interface in adipose tissue upon β-adrenergic stimulation. A, Western blotting (WB) analysis of DRP1 and pDRP1 (at Ser600 in human, Ser616 in mouse) protein levels in endoplasmic reticulum (ER) fraction isolated from the brown adipose tissue (BAT) of cold exposed or control mice housed at room temperature (RT). KDEL and PDI (ER marker proteins) were used as loading control for ER fraction proteins. COX IV and TOM20 (mitochondrial proteins) were used to verify no mitochondrial contamination in the samples, ERK1/2 was used to verify no cytoplasmic protein contamination (n = 3 per group for each experiment, representative of three experiments). B, Quantification of band intensity for DRP1 and pDPR1 in (A). The data were normalized to the intensity of KDEL (n = 3, data are represented as mean ± SEM, Student’s t test, *P < .05, **P < .01). C, Co-immunofluorescence (IF) staining with anti-DRP1 and anti-KDEL antibodies in differentiated 3T3–L1 cells. The cells were treated with isoproterenol (ISO) at the presence or absence of PKA inhibitor PKI (Representative of 6 fields from one experiment, which was performed in triplicate). D, Pearson’s correlation coefficient (PCC) for colocalization of DRP1 and KDEL in (C) (n = 6, data are represented as mean ± SEM, One-way analysis of variance (ANOVA), **P < .01, ***P < .001). E, Co-IF staining with anti-DRP1, anti-KDEL, and anti-Perilipin-1 (PLIN1) (lipid droplet marker protein) antibodies in the subcutaneous white adipose tissue (sWAT) from cold exposed mice. Arrows indicate the merged signals (puncta with white color) of three channels of red, green, and blue (Representative of 6 fields, experiments were repeated for 3 times)
3.2 |. Adipose tissue-specific DRP1 knockout mice exhibit unusually large LDs in adipocytes
To investigate how DRP1 impacts ER, LDs, and other organelles in adipose tissue in vivo, we generated a conditional, adipocyte-specific DRP1 knockout mouse model (Adipo-Drp1flx/flx) by breeding the Drp1 floxed strain3 with the Adiponectin-Cre strain (Figure 2A). In the Adipo-Drp1flx/flx mice, DRP1 was efficiently ablated in different adipose tissues, including BAT and sWAT, but remained unchanged in other tissues, such as the liver (Figure 2B). Compared to their littermate controls, Adipo-Drp1flx/flx mice did not exhibit significant differences in body weight and body composition (Figure S1A,B). Based on data showing altered DRP1 localization upon β-adrenergic stimulation (refer to Figure 1), we cold-challenged Adipo-Drp1flx/flx mice at 6°C for 6 hours and harvested tissues for analyses. The BAT of Adipo-Drp1flx/flx mice exhibited a pale color with larger tissue-size when compared with the controls (Figure 2C, top panel). The WATs (subcutaneous and epididymal, sWAT and eWAT) of Adipo-Drp1flx/flx mice also showed pale color but the tissue sizes and tissue weights did not show dramatic differences from controls (Figure 2C, middle & bottom panels, Figure S1C). H&E staining indicated significantly larger and unilocular LDs in BAT of Adipo-Drp1flx/flx mice when compared with the controls (Figure 2D, left panels). Similar morphological differences were also found in sWAT but not in eWAT and liver (Figure 2D). Of note, multilocular LDs, which were frequently found in the BAT and sWAT of controls upon cold stimulation, were barely detectable in Adipo-Drp1flx/flx mice (Figure 2D). BODIPY staining revealed unilocular and larger LDs in the BAT of Adipo-Drp1flx/flx mice (Figure 2E). The quantitative analysis of the numbers and sizes further confirmed that the BAT of Adipo-Drp1flx/flx mice contained larger but less LDs (Figure 2F,G). No morphological difference was detected in the liver (Figure S1D,E). Of note, these morphological changes in the adipose tissues of Adipo-Drp1flx/flx mice were relatively mild in room temperature (RT) housing condition (Figure S1F,G).
FIGURE 2.
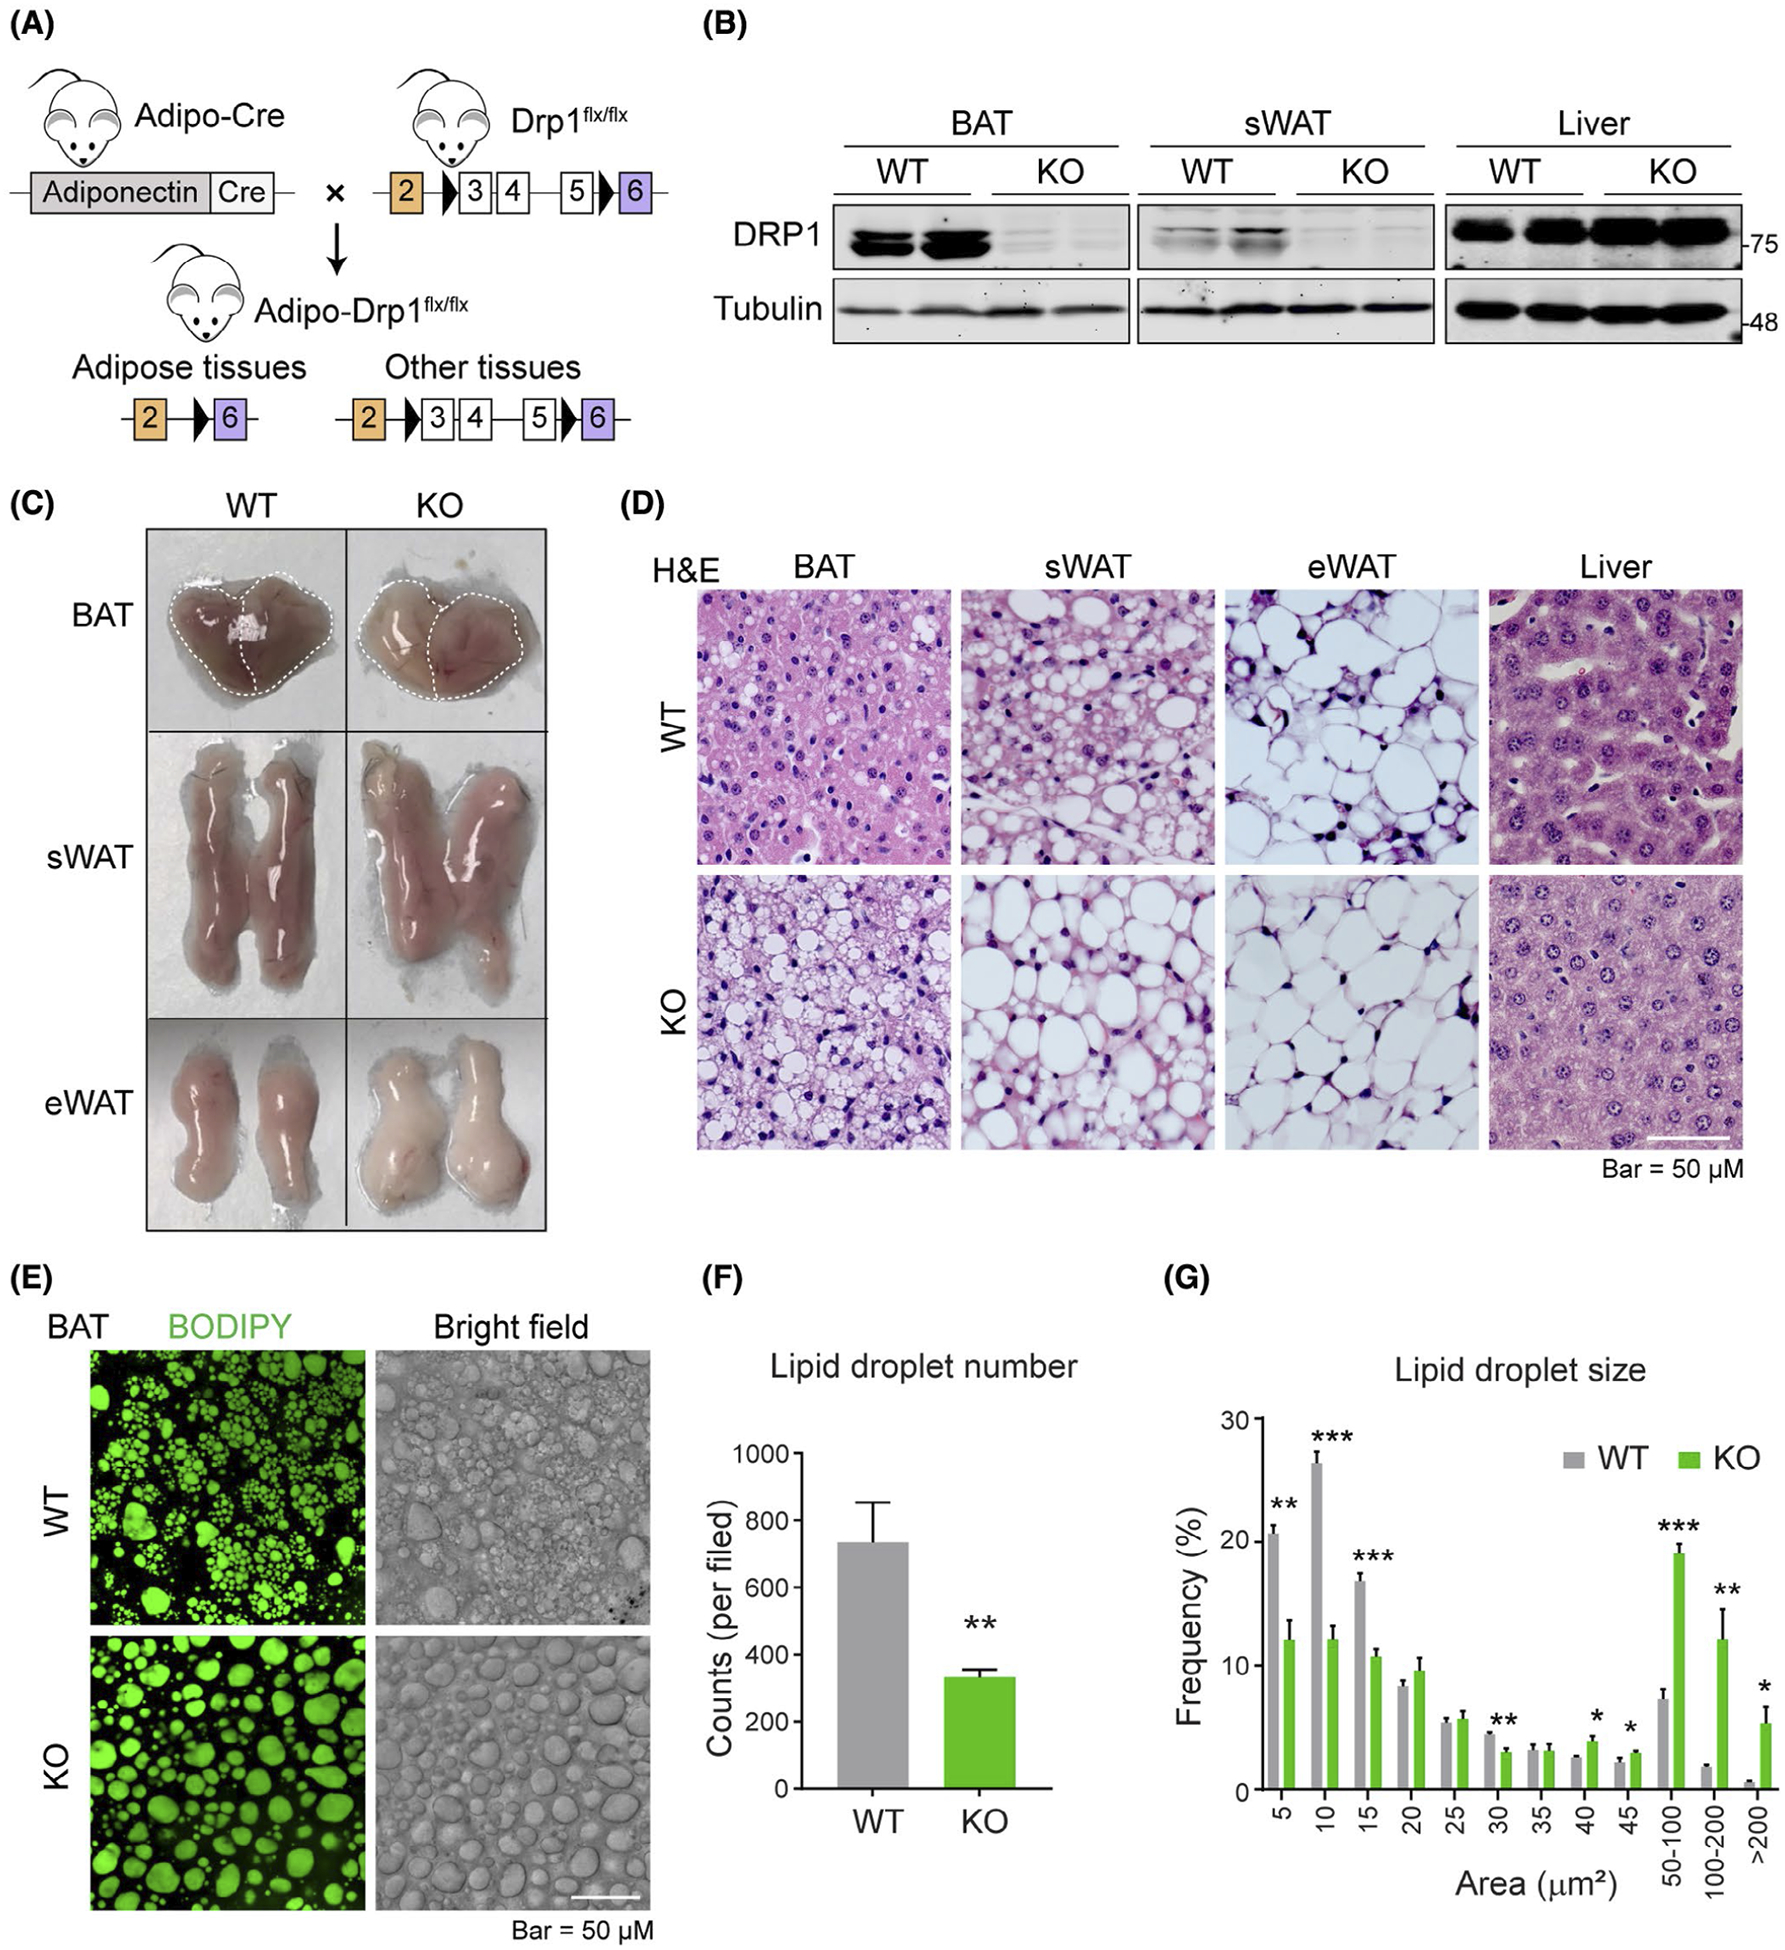
Adipose tissue-specific Drp1 knockout mice exhibit unusually large LDs in adipocytes upon cold exposure. A, Schematic representation of adipocyte-specific DRP1 knockout (Adipo-Drp1flx/flx) mouse model. B, Western blotting analysis of DRP1 and Tubulin protein levels in the brown adipose tissue (BAT), sWAT, and liver from Adipo-Drp1flx/flx mice (KO) and their littermate controls (WT). Tubulin was used as the loading control (n = 6 per group, the sample loaded in each lane contains pooled samples from three mice, representative of three trials).C, Images of the BAT, sWAT, and epididymal white adipose tissue (eWAT) from Adipo-Drp1flx/flx mice (KO) and their littermate controls (WT) after cold exposure (Representative of six mice). D, H&E staining for the BAT, sWAT, eWAT, and liver from Adipo-Drp1flx/flx and their littermate control mice after cold exposure (Representative of 5 fields of the samples from six mice per group). E, BODIPY staining of lipid droplets (LDs) and bright filed images in the BAT explants from Adipo-Drp1flx/flx mice and their littermate controls after cold exposure. F, Quantification of lipid droplet number in (E) (n = 5, data are represented as mean ± SEM, Student’s t test, **P < .01). G, Quantification and distribution of lipid droplet size in (E) (n = 5, data are represented as mean ± SEM, Student’s t test, *P < .05, **P < .01, ***P < .001)
3.3 |. Deficiency of DRP1 causes abnormal retention of nascent micro-LDs in ER in adipose tissue
Cytosolic LDs bud from ER monolayer leaflets.42–44 In order to study the effect of DRP1 on dynamics of LD formation in ER, we pulse-chased fresh sWAT explants from cold-exposed Adipo-Drp1flx/flx and control mice with fluorescent labeled long-chain fatty acid BODIPY-C12 (red)38 followed by co-staining with ER tracker (green) (Figure 3A). The results revealed significantly more micro florescent-fatty acid-incorporated LDs accumulated in the ER of sWAT from Adipo-Drp1flx/flx mice, as indicated by not only more yellow color in ER, but also more visible tiny red droplets in the merged bottom panel (Figure 3B). Arrows in the enlarged panel highlight this phenomenon (Figure 3B, quantification was shown in Figure 3C). A more dramatic difference between the groups was observed in an experiment with continuous chasing for 2 hours (Figure 3D–F). The ER retention of micro-LDs in the sWAT of Adipo-Drp1flx/flx mice was confirmed by higher magnification of the confocal images (Figure 3G). The arrows indicate the massive accumulation of micro-LDs in ER in the sWAT of Adipo-Drp1flx/flx mice (Figure 3G). Of note, we observed robust morphological changes of the ER in the sWAT of the knockout mice upon cold exposure, further suggesting the ER stress caused by LD retention.45 To rule out the mitochondrial effect on the LD retention in ER, the same experiment with BODIPY-C12 incubation was done with simultaneous inhibition of mitochondrial respiration by Rotenone and Antimycin A (Figure 3H). Interestingly, although mitochondrial respiration was efficiently inhibited in both groups as confirmed by Seahorse Assay (Figure 3I), the ER retention of LDs was still exclusively visible in the sWAT of Adipo-Drp1flx/flx mice, but not in the controls (Figure 3J, quantification was shown in Figure 3K), suggesting impaired mitochondrial function was not involved in the process.
FIGURE 3.
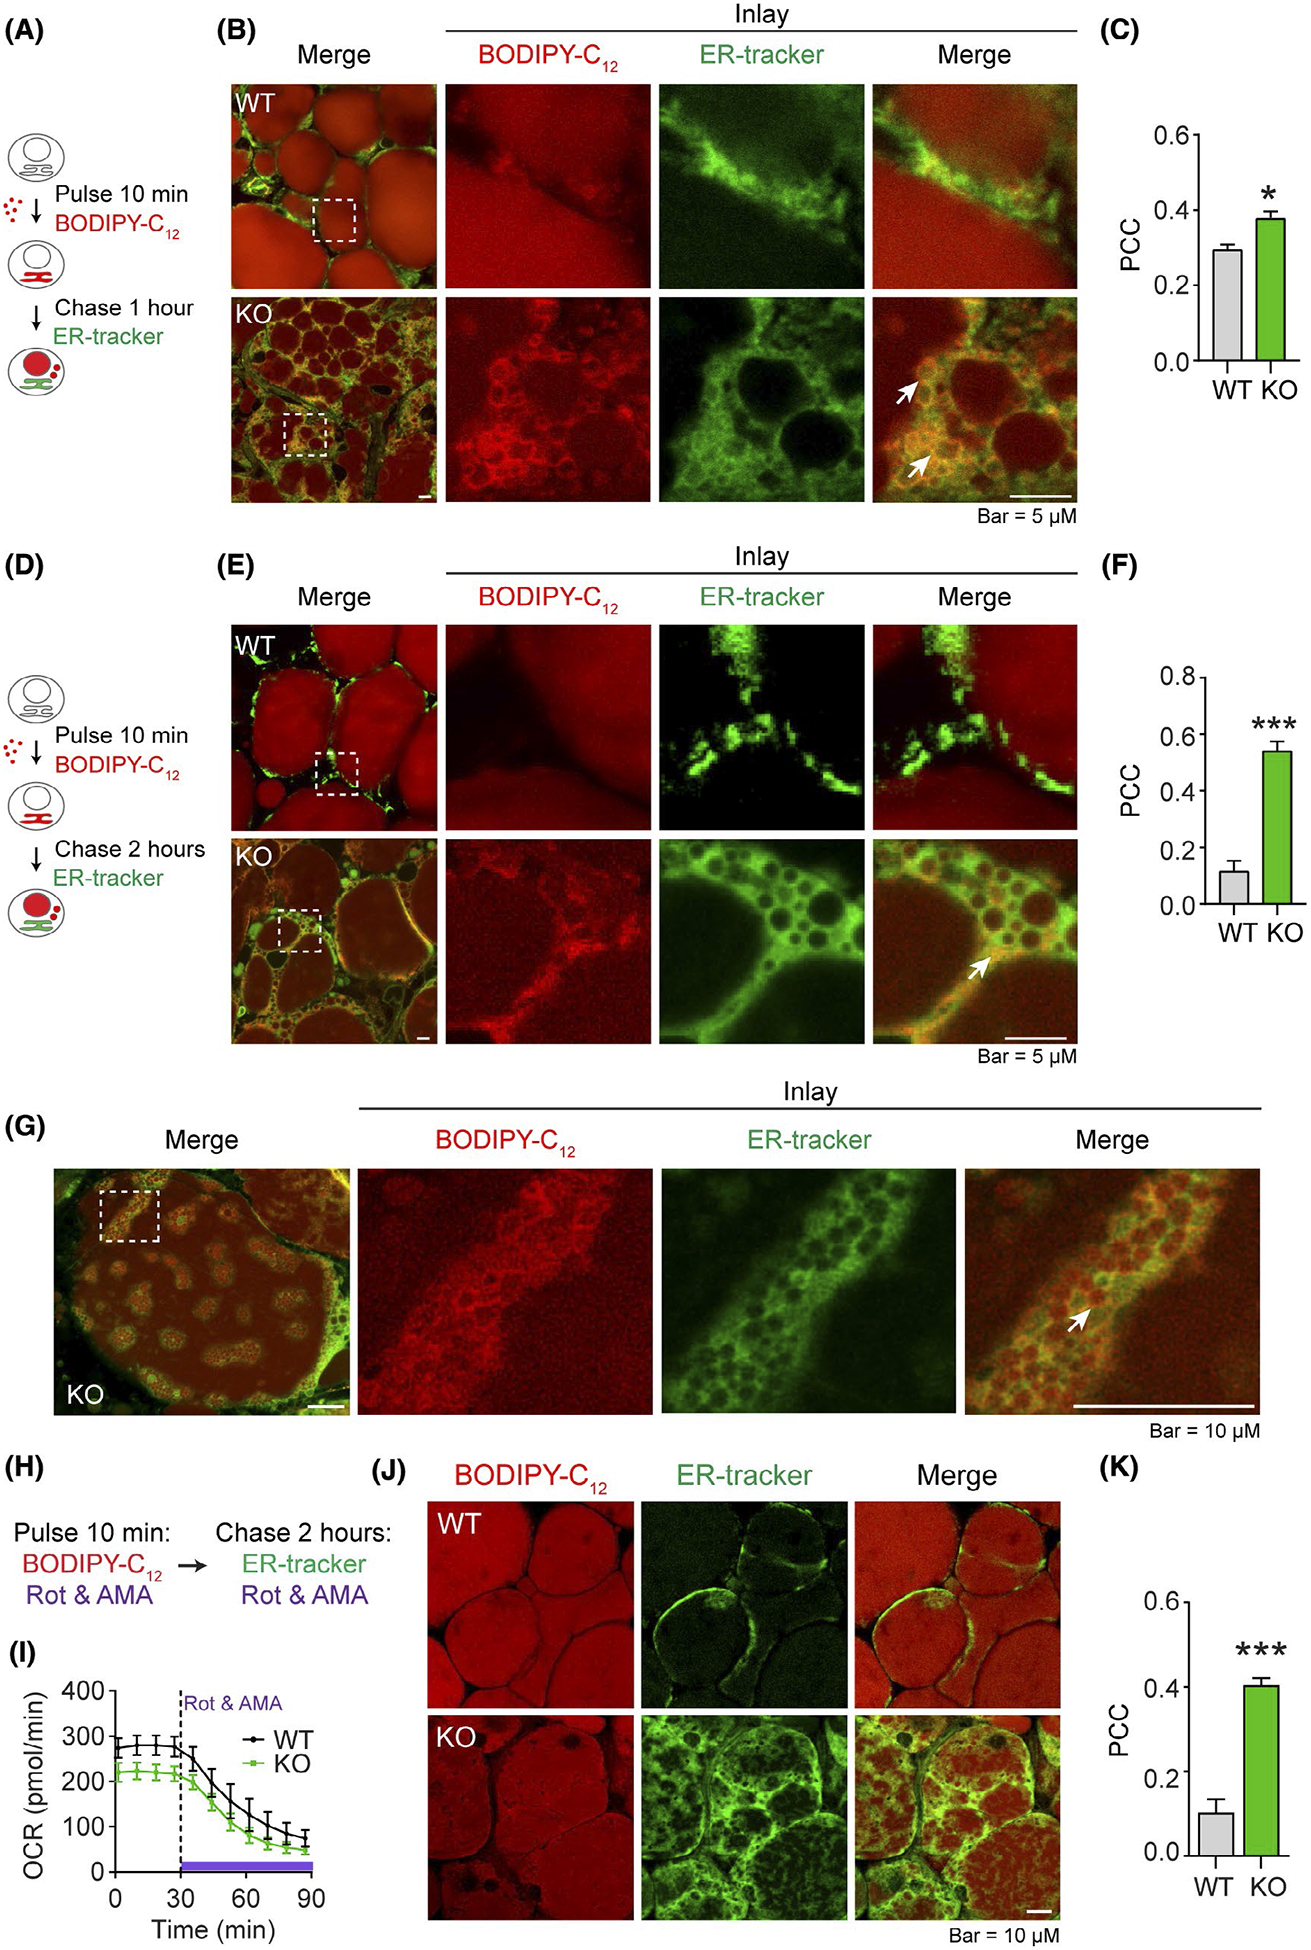
Deficiency of DRP1 causes abnormal retention of nascent micro-LDs in ER in adipose tissue. A, Pulse-chase Co-staining of BODIPY-C12 (red) and ER tracker (green) in the sWAT explants from Adipo-Drp1flx/flx mice (KO) and their littermate controls (WT) after cold exposure. Pulse-chase staining was applied as indicated: The fresh sWAT explants were incubated within BODIPY-C12 medium for 10 minutes (pulse-phase) followed by washing and incubated in BODIPY-C12 free medium for 1 hour (chase-phase). The explants were labeled with ER tracker simultaneously during the chase-phase. B, Co-staining images as described in (A). Arrows in the KO inlay merge panel indicate lipid retention (yellow signal). C, Pearson’s correlation coefficient (PCC) for colocalization of BODIPY-C12 and ER-tracker in (B) (Representative images of three trials are shown. The PCC of 5 fields were analyzed and presented as mean ± SEM, Student’s t test, *P < .05). D, Pulse-chase co-staining of BODIPY-C12 (red) and ER tracker (green) in the sWAT explants from Adipo-Drp1flx/flx mice and their littermate controls after cold exposure. The fresh sWAT explants were incubated within BODIPY-C12 medium for 10 minutes (pulse-phase) followed by incubation in BODIPY-C12 free medium for 2 hours (chase-phase). The explants were labeled with ER tracker simultaneously during the chase-phase. E, Co-staining images as described in (D). Arrows in the KO inlay merge panel indicate lipid retention (yellow signal). F, Pearson’s correlation coefficient (PCC) for colocalization of BODIPY-C12 and ER-tracker in (E) (Representative images of three trials are shown. The PCC of 5 fields were analyzed and represented as mean ± SEM, Student’s t test, ***P < .001). G, A highlighted co-staining images from Adipo-Drp1flx/flx mice of (E). H, Pulse-chase co-staining of BODIPY-C12 (red) and ER tracker (green) in the presence of mitochondrial respiration inhibitors in the sWAT explants from Adipo-Drp1flx/flx mice and their littermate controls after cold exposure. The explants were incubated with BODIPY-C12, rotenone, and Antimycin A for 10 minutes followed by incubation in BODIPY-C12 free medium containing ER-tracker, rotenone, and Antimycin A for 2 hour. I, Oxygen consumption rate (OCR) of the explants indicating the suppressed mitochondrial respiration after inhibitor treatment (n = 3, the data are represented as mean ± SEM. Rot: Rotenone, AMA: Antimycin A). J, Co-staining images as described in (I). K, Pearson’s correlation coefficient (PCC) for colocalization of BODIPY-C12 and ER-tracker in (J) (The PCC of 5 fields were analyzed and represented as mean ± SEM, Student’s t test, ***P < .001)
Previous studies demonstrated micro-LDs formed on the ER are surrounded by both perilipin-2 (PLIN2) and perilipin-3 (PLIN3) while the mature LDs are sealed predominantly by PLIN1.46,47 The newly formed LDs are released into cytosol where they merge with the preexisting LDs. We thus tracked the number of new LDs and cytosolic LDs by co-staining with anti-PLIN1 and anti-PLIN3 antibodies. The result showed significant amounts of micro-LDs with both stains (as indicated by the yellow color in the merged image) in the BAT of control mice upon cold stimulation, while no such effect was detected in Adipo-Drp1flx/flx mice (Figure 4A, quantification of the colocalization was shown in Figure 4B), suggesting less LD merging in the knockout adipocytes. WB result further revealed that level of PLIN2 was dramatically increased in ER fraction isolated from sWAT of Adipo-Drp1flx/flx mice (Figure 4C, quantification of band densities was shown in Figure 4D). Importantly, the Triacylglycerol (TAG) levels were also dramatically increased in ER (Figure 4E), indicating the extensive ER lipid retaining in Adipo-Drp1flx/flx mice. Similar ER retention effect of nascent micro-LDs was observed in the adipocytes differentiated from the stromal-vascular fraction (SVF) isolated from the sWAT of Adipo-Drp1flx/flx mice (Figures 4F and S2). Importantly, the retention can be rescued by overexpressing wild-type DRP1 (Figure 4F, bottom panel). Quantification of ER retention by Image J further confirmed the results (Figure 4G). Collectively, our results demonstrate deficiency of DRP1 leads to massive ER retention of nascent micro-LDs upon β-adrenergic stimulation.
FIGURE 4.
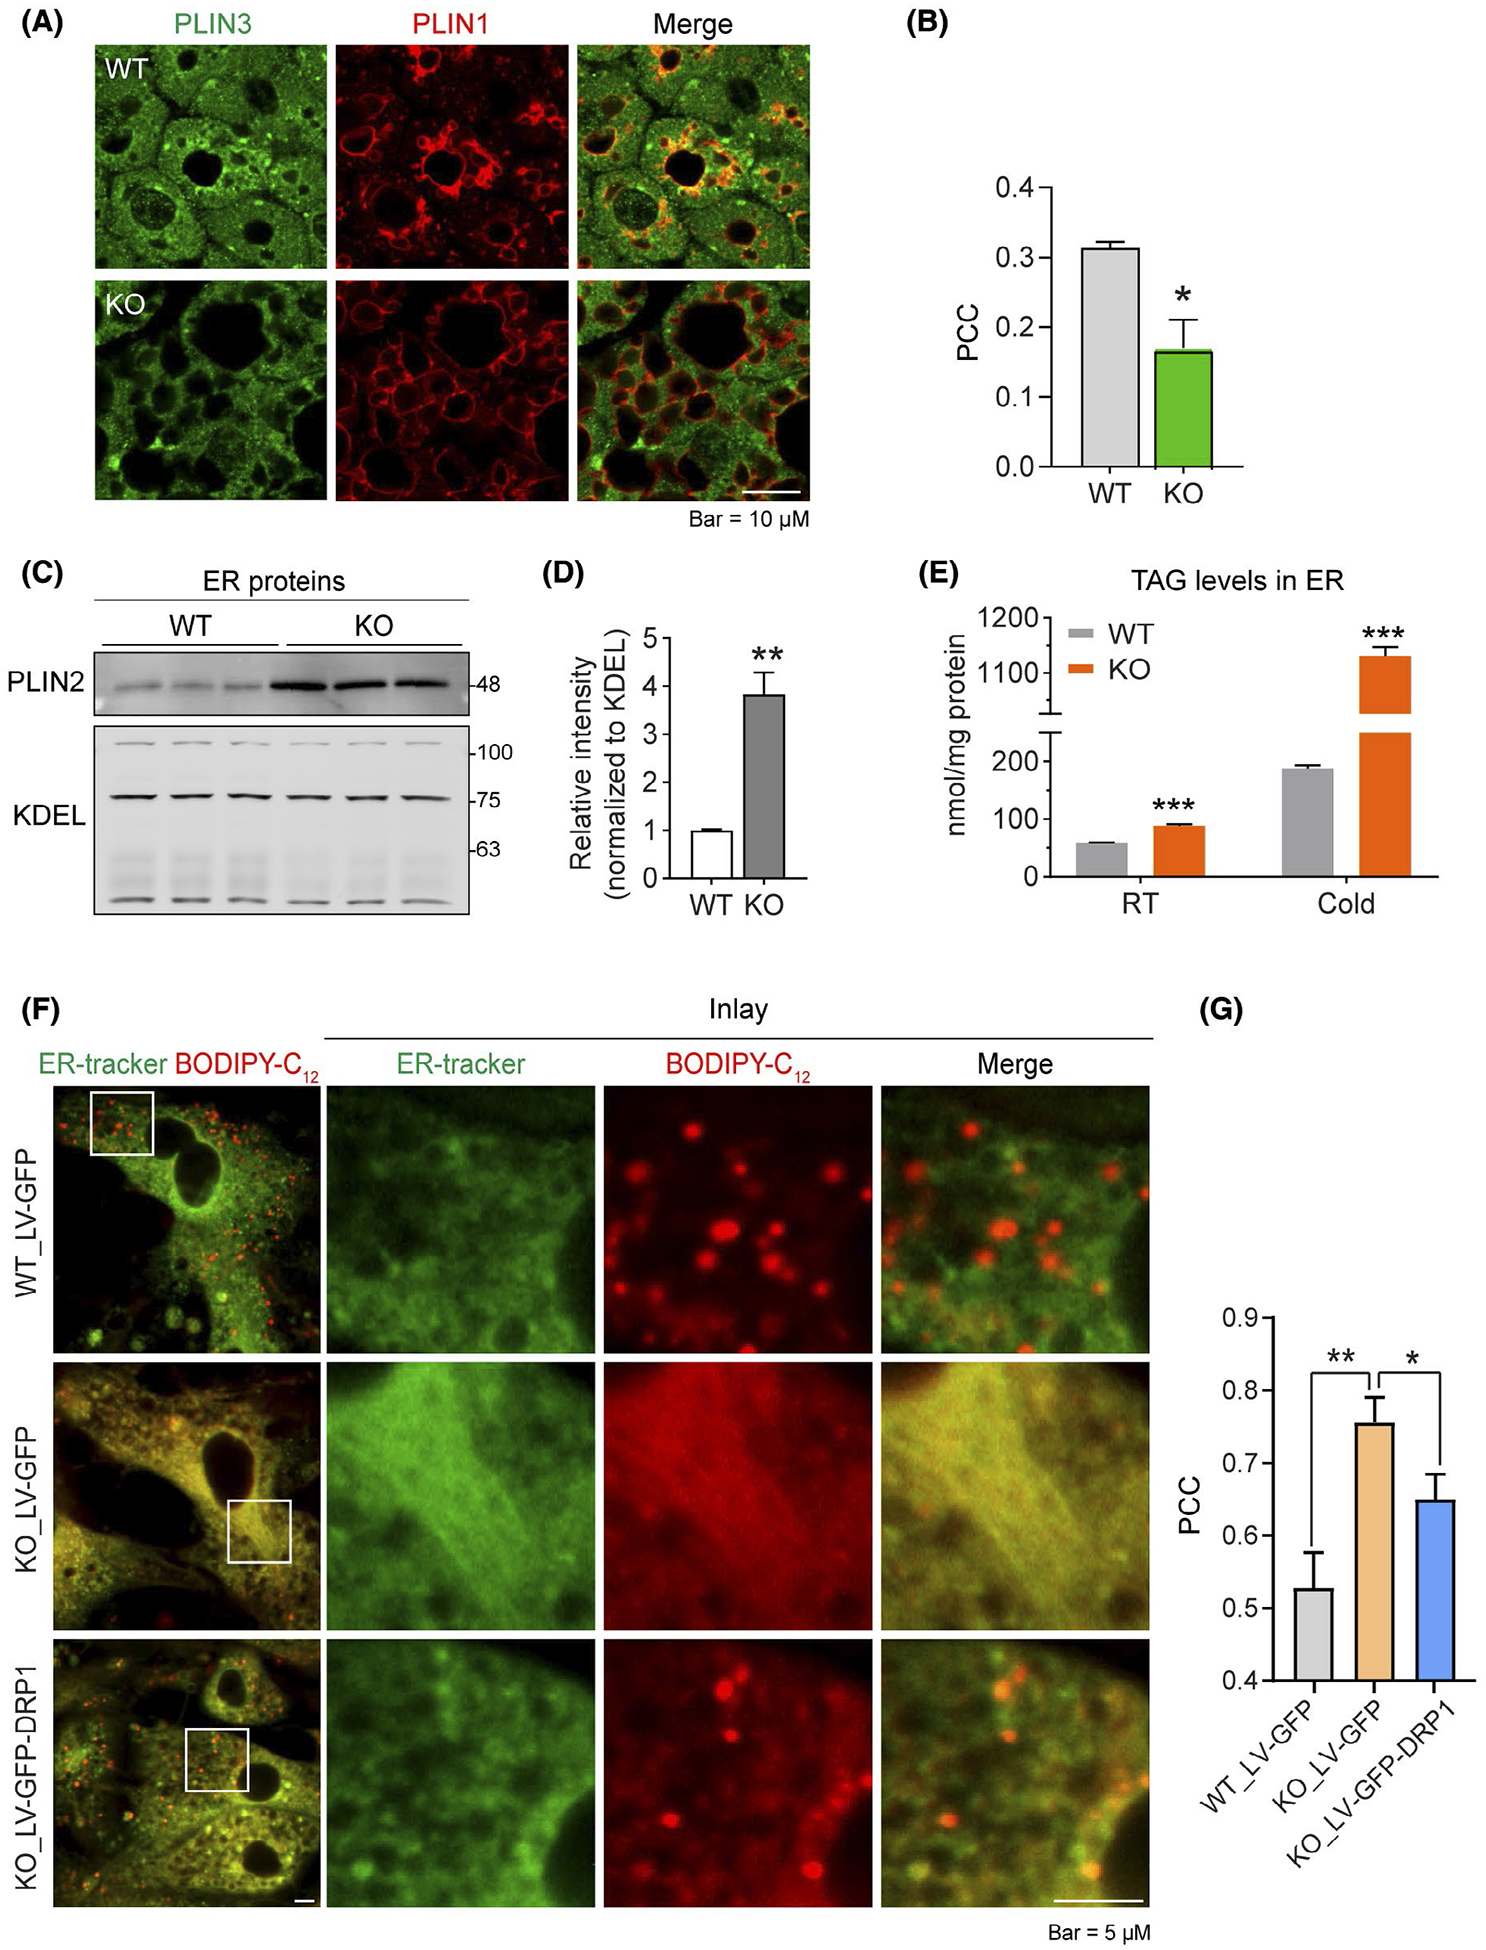
Deficiency of DRP1 causes abnormal retention of nascent micro-LDs in ER in adipose tissue. A, Co-IF staining with anti-Perilipin-3 (PLIN3, green) and anti-PLIN1 (red) antibodies in the BAT from Adipo-Drp1flx/flx mice and their littermate controls after cold exposure. Yellow signals in the merged panel indicate merging of the newly formed LDs with the preexisting LDs in the cytosol. B, Pearson’s correlation coefficient (PCC) for colocalization of PLIN3 and PLIN1 in (A) (Representative of three trials is shown. The PCC of 5 fields were analyzed and presented as mean ± SEM, Student’s t test, *P < .05). C, Western blotting analysis of PLIN2 and KDEL protein levels in ER fraction isolated from the BAT of Adipo-Drp1flx/flx mice and their littermate controls after cold exposure. D, Quantification of relative band intensity for PLIN2 (normalized to KDEL) in (C) (n = 3 per group for each experiment, representative of three trials is shown. The data are represented as mean ± SEM, Student’s t test, *P < .05). E, Triacylglycerol (TAG) levels in the ER fraction of the adipose tissues from Adipo-Drp1flx/flx mice and their littermate controls. TAG levels were normalized to protein concentration (n = 3 per group for each experiment, which were performed in triplicate, data are represented as mean ± SEM, Student’s t test, ***P < .001). F, Co-staining of BODIPY-C12 (red) and ER-tracker (green) in primary adipocytes differentiated from SVF of Adipo-Drp1flx/flx mice and their littermate controls. Cells were infected with lentivirus expressing GFP or DRP1-GFP during differentiation. The cells were stained with BODIPY-C12 for 10 minutes and chased in BODIPY-C12 free medium for 1 hour. The cells were stained with ER-tracker during the 1 hour chase phase. G, Pearson’s correlation coefficient (PCC) for the colocalization of BODIPY-C12 and ER-tracker in (F) (Representative of three trials are shown. The PCC of 5 fields were analyzed and represented as mean ± SEM, One-way analysis of variance (ANOVA), *P < .05, **P < .01, no significant difference between the first and the last group)
3.4 |. Deficiency of DRP1 triggers ER stress as well as abnormal mitochondria and autophagy in adipose tissue
We next detected whether the LD retention leads to other pathological changes in ER. Intriguingly, deficiency of DRP1 further induced ER stress, as indicated by increased levels of the ER stress marker protein BIP in the BAT of Adipo-Drp1flx/flx mice upon cold exposure (Figure 5A, quantification of the band density was shown in Figure 5B). Of note, the same changes were found even under the RT condition (Figure S3A). Gene expression profiling also suggests that ER stress gene Chop and Xbp1-s were also dramatically upregulated in the BAT of Adipo-Drp1flx/flx mice (Figure 5C).
FIGURE 5.

Deficiency of DRP1 triggers ER stress and autophagy in adipose tissue. A, Western blotting analysis of BIP (ER stress marker protein) and β-Actin (as loading control) protein levels in the BAT from Adipo-Drp1flx/flx mice and their littermate controls after cold exposure. B, Quantification of relative band intensity for BIP (normalized to β-Actin) in (A) (n = 6 per group, the sample loaded in each lane contains pooled samples from three mice, representative of three trials. The data are represented as mean ± SEM, Student’s t test, *P < .05). C, Q-PCR analysis of the mRNA levels for Chop and Splice-Xbp1s (Xbp1-s) (ER stress related genes) in the BAT from Adipo-Drp1flx/flx mice and their littermate controls after cold exposure (n = 5 per group, data are represented as mean ± SEM, Student’s t test, ***P < .001). D, IF staining with anti-LC3 antibody in the BAT from Adipo-Drp1flx/flx mice and their littermate controls after cold exposure (Representative of three trials are shown). E, Western blotting analysis of LC3-I/II and β-Actin protein levels in the BAT of Adipo-Drp1flx/flx mice and their littermate controls after cold exposure. F, Quantification of relative band intensity for LC3-II (normalized to β-Actin) in (E) (n = 6 per group, each lane contains pooled samples from three mice, representative of three trials. The data are represented as mean ± SEM, Student’s t test, *P < .05)
Since Drp1 plays essential roles in mitochondrial fission and their overall functions,2,8–10 we investigated the potential adverse effect of Drp1 deficiency on mitochondrial morphology and function in adipose tissues. Electron microscopy (EM) revealed that mitochondria in the BAT of Adipo-Drp1flx/flx mice were longer and larger in size (Figure S3B). Seahorse assay further revealed reduced oxygen consumption rate (OCR) in the BAT of Adipo-Drp1flx/flx mice at different time windows (Figure S3C,D), suggesting impaired mitochondria function upon Drp1 depletion. Abnormal mitochondria and ER-LDs might further induce pathologies associated with autophagy.48–51 We subsequently tested whether adipose tissues from Adipo-Drp1flx/flx mice exhibited compromised autophagosome accumulation. Intriguingly, IF staining with anti-LC3 (a marker of autophagosome) showed significantly more autophagosome formation (Figure 5D) in BAT of Adipo-Drp1flx/flx mice. LC3 immunoblotting further indicated dramatically increased total LC3 and LC3-II in the BAT of cold exposed Adipo-Drp1flx/flx mice (Figure 5E,F), confirming autophagosome formation in the tissue. Similar effect was also found at RT (Figure S3E). Taken together, our results clearly suggest that Drp1 deficiency in adipose tissue induces abnormal LD formation, ER stress, mitochondrial dysfunction, and autophagosome formation.
3.5 |. Adipose tissue-specific deletion of Drp1 causes decreased lipolysis and unhealthy adipocytes
Given DRP1 loss-of-function significantly affected the morphology of essential organelles including LDs, mitochondria, and ER, we sought to investigate the metabolic phenotype of Adipo-Drp1flx/flx mice. Analysis of hormone sensitive lipase (HSL) by WB indicated phosphorylated HSL levels were decreased, while the total HSL levels did not change significantly in the sWAT and BAT of Adipo-Drp1flx/flx mice upon cold exposure (Figure 6A,C). Protein levels of other lipolytic factors, such as ATGL, CGI58, and PLIN1 were also dramatically decreased or exhibited a trend of decrease (Figure 6A,C, quantification of the band densities were shown in Figure 6B,D, respectively). As the result, glycerol levels in circulation as well as in sWAT and BAT were significantly decreased (Figure 6E,F). Moreover, the free fatty acid level in BAT was also significantly decreased (Figure 6G). Interestingly, circulating levels of adiponectin were slightly but significantly decreased (Figure S4A, quantitation of the band densities was shown in Figure S4B), suggesting the existence of unhealthy adipocytes in the Adipo-Drp1flx/flx mice. Collectively, ablation of DRP1 in adipose tissue leads to decreased lipolysis and causes unhealthy adipocytes.
FIGURE 6.
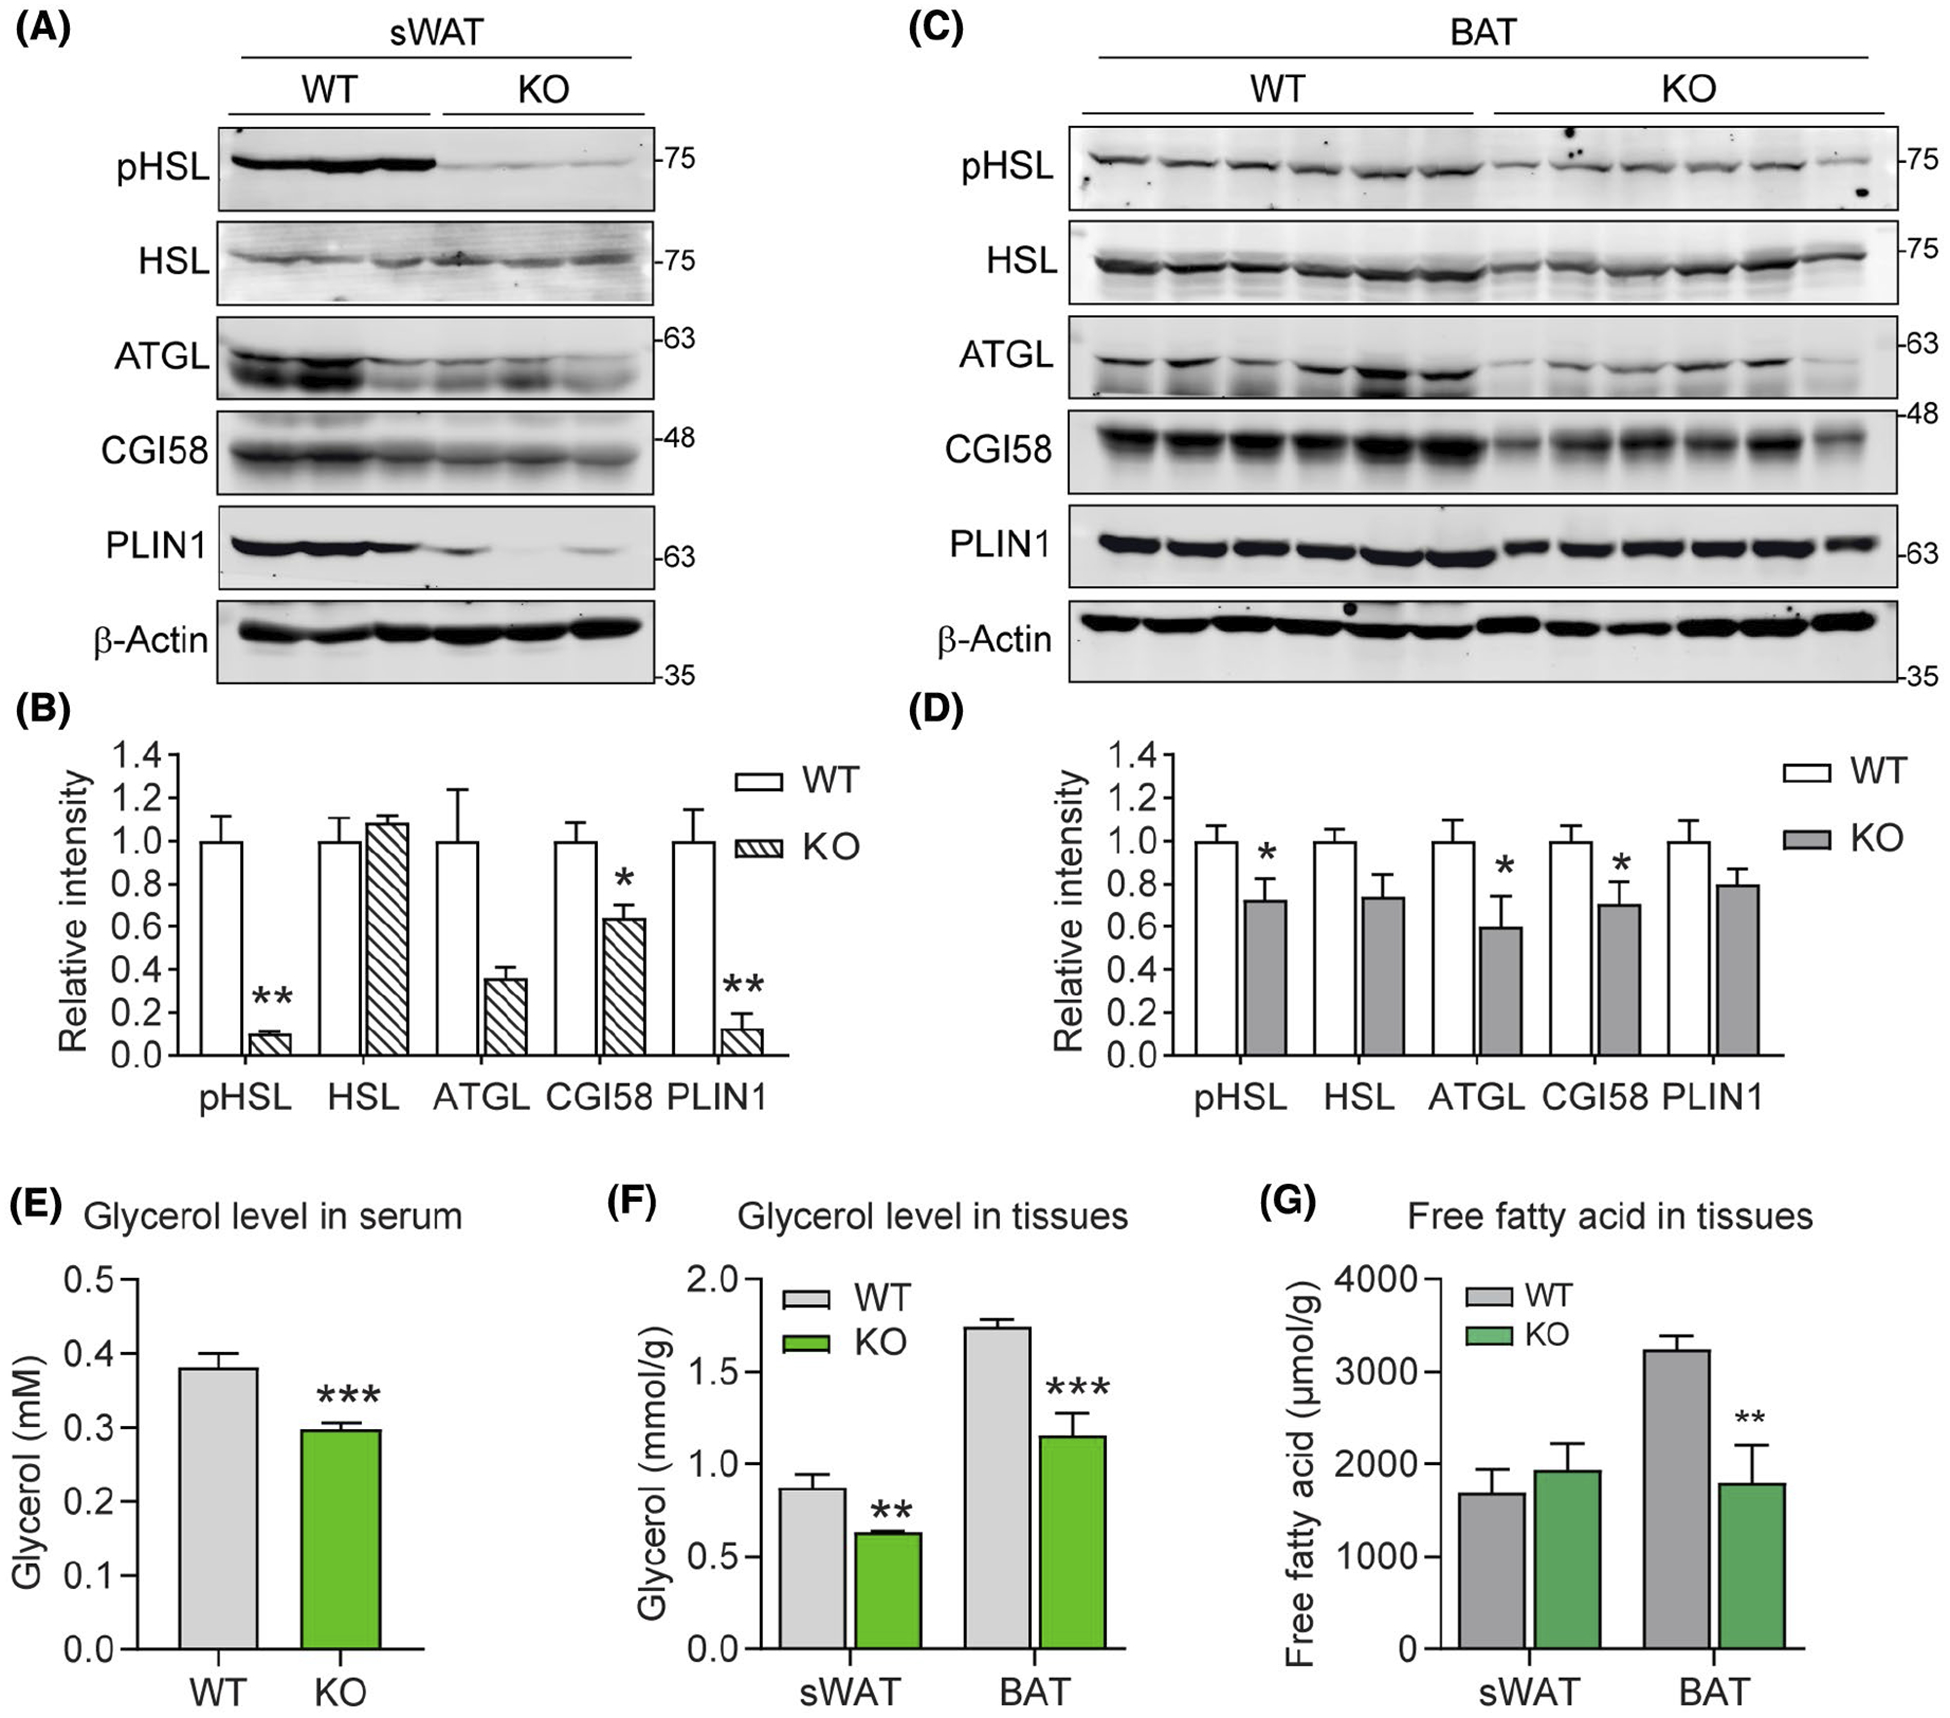
Adipose tissue-specific deletion of DRP1 causes decreased lipolysis and unhealthy adipocytes. A, Western blotting analysis of the protein levels for lipolysis-related proteins, including pHSL (Ser660), HSL, ATGL, CGI58, and PLIN1 in the sWAT from Adipo-Drp1flx/flx mice and their littermate controls after cold exposure. β-Actin is used as the loading control. B, Quantification of relative band intensity (normalized to β-Actin) in (A) (n = 6 per group, the sample loaded in each lane contains pooled samples from two mice, representative of three trials. The data are represented as mean ± SEM, Student’s t test, *P < .05, **P < .01). C, Western blotting (WB) analysis of the protein levels for lipolysis-related proteins, including pHSL (Ser660), HSL, ATGL, CGI58, and PLIN1 in the BAT from Adipo-Drp1flx/flx mice and their littermate controls after cold exposure. β-Actin is used as the loading control. D, Quantification of relative band intensity (normalized to β-Actin) in (C) (n = 6 per group, representative of three trials. The data are represented as mean ± SEM, Student’s t test, *P < .05). E, Glycerol levels in the serum of Adipo-Drp1flx/flx mice and their littermate controls after cold exposure (n = 6 per group, representative of three trials, data are represented as mean ± SEM, Student’s t test, ***P < .001). F, Glycerol levels in the sWAT and BAT from Adipo-Drp1flx/flx mice and their littermate controls after cold exposure (n = 6 per group, representative of three trials, data are represented as mean ± SEM., Student’s t test, **P < .01, ***P < .001). G, Free fatty acid (FFA) levels in the sWAT and BAT from Adipo-Drp1flx/flx mice and their littermate controls after cold exposure (n = 6 per group, representative of three trials, data are represented as mean ± SEM, Student’s t test, **P < .01)
3.6 |. Adipose tissue-specific deletion of Drp1 leads to impaired thermogenesis and decreased energy expenditure
Since lipolysis in adipose tissue is essential for systemic energy metabolism, we next determined the effects on thermogenic program in Adipo-Drp1flx/flx mice. WB revealed dramatically decreased UCP1 level in both BAT and sWAT (Figures 7A and S5A, quantification of the band densities were shown in Figures 7B and S5B, respectively). The result was further confirmed by IF with specific anti-UCP1 in BAT and sWAT (Figures 7C and S5C). As expected, the Adipo-Drp1flx/flx mice significantly lost the ability to defend their body temperature upon cold exposure (Figure 7D). Furthermore, indirect calorimetry studies revealed that Adipo-Drp1flx/flx mice exhibited resistance to β-adrenergic agonist CL-316,243 injection as reflected by lower O2 consumption (Figure 7E,F), lower CO2 production (Figure 7G,H) as well as decreased heat generation (Figure 7I,J). Of note, the RER showed no difference between the groups (Figure S5D,E). In summary, adipose tissue-specific knockout of Drp1 leads to impaired thermogenesis and significantly decreased energy expenditure.
FIGURE 7.
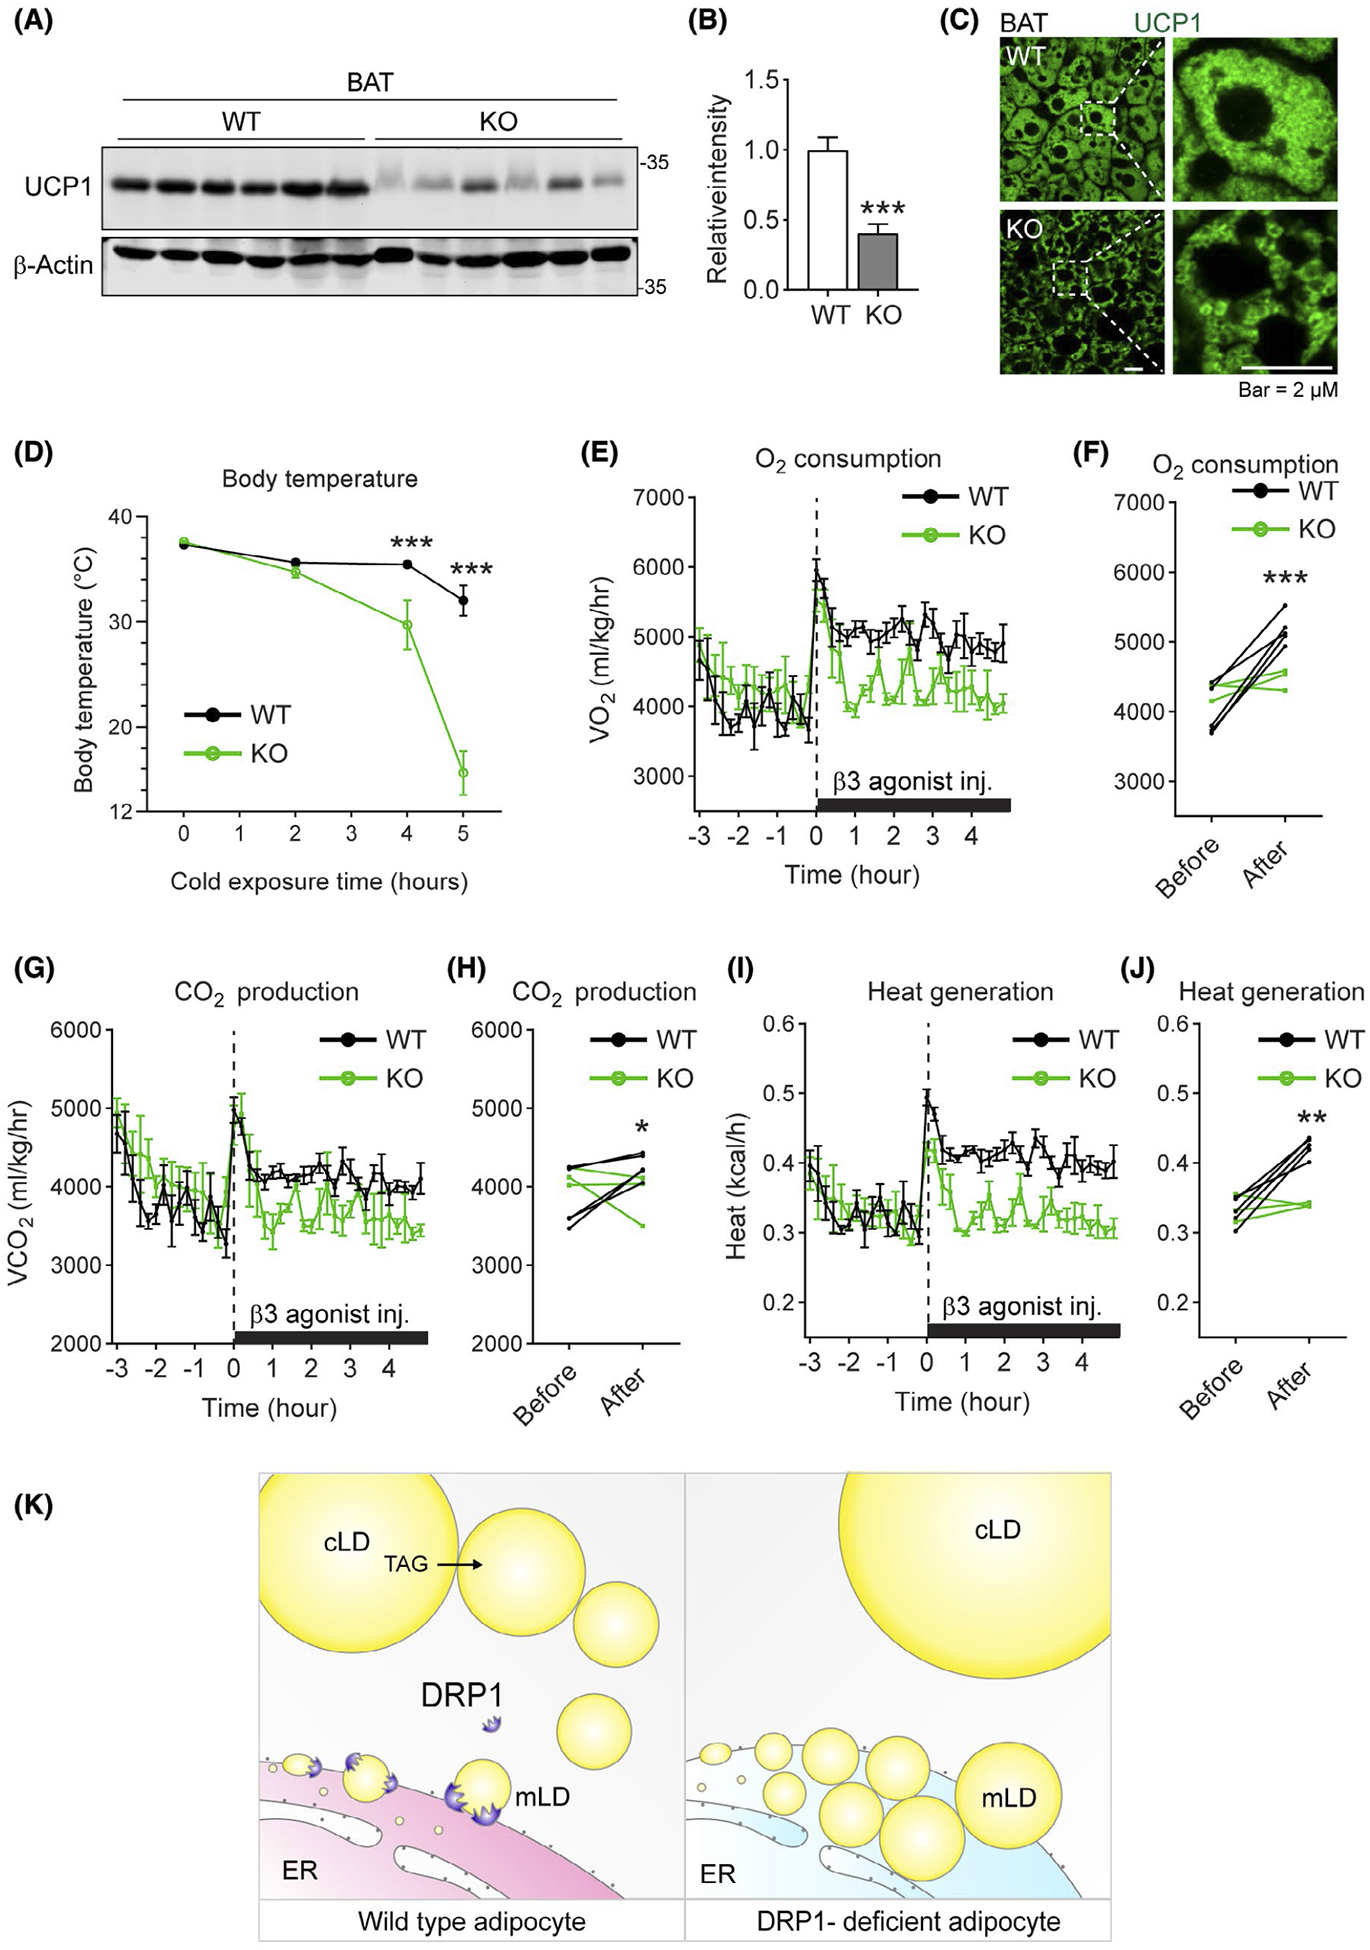
Adipose tissue-specific deletion of DRP1 leads to impaired thermogenesis and decreased energy expenditure. A, Western blotting (WB) analysis of UCP1 protein levels the BAT of Adipo-Drp1flx/flx mice and their littermate controls after cold exposure. B, Quantification of relative band intensity (normalized to β-Actin) in (A) (n = 6 per group, representative of three trials. The data are represented as mean ± SEM, Student’s t test, ***P < .001). C, IF staining with anti-UCP1 antibody in the BAT from Adipo-Drp1flx/flx mice and their littermate controls after cold exposure (Representative of three trials are shown). D, Body temperature of Adipo-Drp1flx/flx mice and their littermate controls during cold exposure at 6°C (n = 12 per group, data are represented as mean ± SEM, Student’s t test, ***P < .001). E, O2 consumption for indirect calorimetry analysis of Adipo-Drp1flx/flx mice and their littermate controls upon treatment of β3 agonist CL-316,243 (n = 3~5 per group, data are represented as mean ± SEM). F, The average of 3-hour O2 consumption before and after CL-316,243 treatment for each mouse is shown (n = 3~5, Student’s t test, ***P < .001). G, CO2 production for indirect calorimetry analysis of Adipo-Drp1flx/flx mice and their littermate controls upon treatment of β3 agonist CL-316,243 (n = 3~5 per group, data are represented as mean ± SEM). H, The average of 3-hour CO2 production before and after CL-316,243 treatment for each mouse is shown (n = 3~5, Student’s t test, *P < .05). I, Heat generation for indirect calorimetry analysis of Adipo-Drp1flx/flx mice and their littermate controls upon treatment of β3 agonist CL-316,243 (n = 3~5 per group, data are represented as mean ± SEM). J, The average of 3-hour heat generation before and after CL-316,243 treatment for each mouse is shown (n = 3~5, Student’s t test, **P < .01). K, Working model: based on the results, we propose the following working model: DRP1 may target ER-LD interface and facilitate the micro-LD dissociation from ER (left). The new LDs may physically contact the preexisting cytosolic LDs and share the neutral lipids with them. Deficiency of DRP1 in adipose tissue blocks proper dissociation of nascent micro-LDs from ER, which further causes abnormal accumulation of LDs in ER and hence ER stress. In the cytoplasm, due to lack of new small LDs, the preexisting LDs accumulate more neutral lipids, which eventually leads to larger unilocular LDs (right). cLD: cytosolic lipid droplet; mLD: micro lipid droplet. TAG: triacylglycerol
As the result of our study, we proposed the following working model (Figure 7K): In response to β-adrenergic stimulation, DRP1 is recruited to the ER and facilitates the nascent micro-LD dissociate from the ER (Figure 7K, left) through PKA activation. Subsequently, new LDs may physically contact the preexisting cytosolic LDs and share a neutral lipid pool. Deficiency of DRP1 in adipose tissue blocks the release of new micro-LDs from ER, which leads to abnormal accumulation of LDs in ER and ER stress. Meanwhile, in the cytoplasm, due to lack of new micro-LDs, the preexisting LDs accumulate more neutral lipids that further leads to larger unilocular LDs (Figure 7K, right).
4 |. DISCUSSION
As a key component of mitochondrial division factors, DRP1 has been extensively studied on cellular level in different tissues. However, its functions in adipose tissue remain unclear. Here, we report for the first time that DRP1 plays an essential role in energy balance in adipose tissue. Specifically, we found that DRP1 not only targets mitochondria to regulate their fissions, but also translocates onto ER surface in response to stimulation of β-adrenergic signaling. Of note, even though we conform that Drp1 exerts membrane fission capacity in mitochondria as previous report,10 we did not observe its direct fission function on cytosolic LDs (data not shown). By using a new adipose tissue-specific Drp1 knockout mouse model (Adipo-Drp1flx/flx), we report that lack of DRP1 in adipose tissue leads to not only abnormal mitochondria, but also the dysregulation of the dynamics of ER-LDs and autophagy. Combined, all of the dysfunctions on organelle level eventually cause impaired thermogenesis and energy expenditure in the whole-body. The observed deficiencies can be restored by re-expressing DRP1 in the knockout adipocytes.
Our study demonstrates an essential role of DRP1 in the dynamics of ER-LDs. Even though it has been well accepted that DRP1 exerts membrane fission capacity in mitochondria and peroxisomes,10,41 to date no reports have revealed its function on LD budding from ER. In this study, we found DRP1 targets ER and facilitate LD budding from ER. Our results further suggest that PKA-dependent phosphorylation on DRP1 Serine 600 might play critical role for the translocalization onto ER. Importantly, the same phosphorylation on Serine 600 by PKA has been found to cause DRP1 mitochondrial targeting where it exerts the fission function.41 Whether ER-targeted DRP1 exerts direct fission function on the nascent LDs needs further investigations. On the contrary, another dynamin family member Optic Atrophy 1(OPA1) has been reported to target LDs and function as an anchor to recruit PKA onto the droplets. The LD-associated PKA phosphorylates and activates classic lipases, which enhance lipolysis of the lipids.23 In our study, we found that deficiency of DRP1 in adipocytes leads to decreased lipolysis. It remains a possibility that DRP1 also possesses similar lipolytic function as OPA1 on cytosolic LDs via PKA pathway.
Mitochondria and ER have close contacts and the physical proximity has been demonstrated to be tied to lipid transfer on ER.52 At the meantime, ER has been shown to be required for the initiation of mitochondrial fission by DRP1.53 ER-associated proteins, such as Mff, Fis1, MiD49, and MiD51 function as receptors to mediate the process.13,54 A recent finding further demonstrates that ER-associated protein degradation (ERAD) regulates directly the dynamics of mitochondria.55 Here, we report that DRP1 translocates onto ER and facilitate dissociation of newly formed LDs from ER. Lack of DRP1 causes retention of newly formed LDs in ER. Meanwhile without proper function of DRP1, mitochondria also exhibited abnormal morphology and function. Our findings, together with aforementioned reports, raise an important question whether the DRP1 function on dynamics of ER-LDs is mitochondria-dependent or independent. Intriguingly, a previous study reveals that the dominant-negative DRP1 mutants pathologically alter the ER membrane structure.56 This finding supports a notion that DRP1 may directly regulate the dissociation of the LDs from ER via changing the dynamics of ER membrane. Nevertheless, the detailed mechanism governing the budding of micro-LDs from ER membranes warrants further studied. Moreover, the potential receptor(s) on ER for DRP1 recruitment in response to activation of PKA signaling need to be identified.
DRP1 plays an essential role in dynamics of mitochondrial division.6,57 A recent study further demonstrates that DRP1 has both membrane constricting and severing capabilities and functions independently on mitochondria fission.10 Here, we confirm its dominant effect on mitochondrial fission in adipocytes. Ablation of Drp1 leads to larger mitochondria with less numbers, suggesting a faulty fission process without DRP1. Seahorse results reveal a significant decrease of OCR, which are in line with the observed abnormal morphology of the mitochondria in the knockout adipocytes. The impaired mitochondrial morphology and function may partially explain the reason that the Adipo-Drp1flx/flx mice exhibited severely impaired thermogenesis and dramatically decreased energy expenditure.
Intriguingly, in addition to the adverse effects on fission of mitochondria and the dynamics of ER-LD that we report here, deletion of DRP1 also causes ER stress and dysregulation of autophagy in adipose tissue. We assume that the observed ER stress is induced directly by the accumulation of LDs in ER in the context of lack of DRP1. To support our hypothesis, previous studies revealed that accumulation of LDs always links to ER stress in mammals.58–61 The enhanced autophagosome formation that we observed might be triggered by both mitochondrial dysfunction and ER stress. Therefore, the systemically metabolic effects, including decreased lipolysis, impaired thermogenesis, and energy expenditure are a collective effect of all the dysregulations of the multiple organelles.
In conclusion, our study reveals the crucial roles of DRP1 in regulation of energy metabolism on the level of multiple organelles in adipose tissue and highlights the potential of DRP1 as a novel factor to treat obesity and obesity-related metabolic disorders.
Supplementary Material
ACKNOWLEDGMENTS
We thank our colleagues, particularly members in Dr Kolonin’s group at Center of Metabolic and Degenerative Diseases for technical support. We further thank Dr Hongyuan Yang at UNSW and Dr Pingsheng Liu at Chinese Academy of Sciences for the informative discussions and thoughtful suggestions. The authors would like to thank AFM SEM core in Houston Methodist Research Institute and High Resolution Electron Microscopy Facility at UT MD Anderson Cancer Center for the EM study. This study was supported by National Institute of Health (NIH) grant R01DK109001 (to KS), NIGMS grant R35GM122536 (to XC), USDA CRIS 3092-5-001-059, and AHA grant 18TPA34170539 (to QT), NIH grant GM123266 (to HS), NIH grant R01DK114356, and American Diabetes Association grant #1-18-IBS-105 (to SH), AHA grant 19TPA34910051 (to G.D), NIH grant AR075830 (to G.D) as well as NIH grant R01DK114037 (to K.L. Eckel-Mahan).
Funding information
NIH, Grant/Award Number: R01DK109001, GM123266, R01DK114356, AR075830 and R01DK114037; NIGMS, Grant/Award
Abbreviations:
- BAT
brown adipose tissue
- DRP1
dynamin-related-protein 1
- FFA
free fatty acids
- HSL
hormone sensitive lipase
- ISO
isoproterenol
- LD
lipid droplet
- ORC
oxygen consumption rate
- PCC
Pearson’s correlation coefficient
- PKI
PKA inhibitor
- PLIN
perilipin
- TG
triglyceride
- WAT
white adipose tissue
Footnotes
CONFLICT OF INTEREST
The authors declare no competing interests.
SUPPORTING INFORMATION
Additional Supporting Information may be found online in the Supporting Information section.
REFERENCES
- 1.Praefcke GJ, McMahon HT. The dynamin superfamily: universal membrane tubulation and fission molecules? Nat Rev Mol Cell Biol. 2004;5:133–147. [DOI] [PubMed] [Google Scholar]
- 2.Frohlich C, Grabiger S, Schwefel D, et al. Structural insights into oligomerization and mitochondrial remodelling of dynamin 1-like protein. EMBO J. 2013;32:1280–1292. [DOI] [PMC free article] [PubMed] [Google Scholar]
- 3.Wakabayashi J, Zhang Z, Wakabayashi N, et al. The dynamin-related GTPase Drp1 is required for embryonic and brain development in mice. J Cell Biol. 2009;186:805–816. [DOI] [PMC free article] [PubMed] [Google Scholar]
- 4.Ishihara N, Nomura M, Jofuku A, et al. Mitochondrial fission factor Drp1 is essential for embryonic development and synapse formation in mice. Nat Cell Biol. 2009;11:958–966. [DOI] [PubMed] [Google Scholar]
- 5.Tamura Y, Itoh K, Sesaki H. SnapShot: mitochondrial dynamics. Cell. 2011;145:1158–1158.e1. [DOI] [PMC free article] [PubMed] [Google Scholar]
- 6.Frank S, Gaume B, Bergmann-Leitner ES, et al. The role of dynamin-related protein 1, a mediator of mitochondrial fission, in apoptosis. Dev Cell. 2001;1:515–525. [DOI] [PubMed] [Google Scholar]
- 7.Koch A, Thiemann M, Grabenbauer M, Yoon Y, McNiven MA, Schrader M. Dynamin-like protein 1 is involved in peroxisomal fission. J Biol Chem. 2003;278:8597–8605. [DOI] [PubMed] [Google Scholar]
- 8.Labrousse AM, Zappaterra MD, Rube DA, van der Bliek AM. C. elegans dynamin-related protein DRP-1 controls severing of the mitochondrial outer membrane. Mol Cell. 1999;4:815–826. [DOI] [PubMed] [Google Scholar]
- 9.Smirnova E, Shurland DL, Ryazantsev SN, van der Bliek AM. A human dynamin-related protein controls the distribution of mitochondria. J Cell Biol. 1998;143:351–358. [DOI] [PMC free article] [PubMed] [Google Scholar]
- 10.Kamerkar SC, Kraus F, Sharpe AJ, Pucadyil TJ, Ryan MT. Dynamin-related protein 1 has membrane constricting and severing abilities sufficient for mitochondrial and peroxisomal fission. Nat Commun. 2018;9:5239. [DOI] [PMC free article] [PubMed] [Google Scholar]
- 11.Steffen J, Koehler CM. ER-mitochondria contacts: actin dynamics at the ER control mitochondrial fission via calcium release. J Cell Biol. 2018;217:15–17. [DOI] [PMC free article] [PubMed] [Google Scholar]
- 12.Wang L, Ishihara T, Ibayashi Y, et al. Disruption of mitochondrial fission in the liver protects mice from diet-induced obesity and metabolic deterioration. Diabetologia. 2015;58:2371–2380. [DOI] [PubMed] [Google Scholar]
- 13.Ji WK, Chakrabarti R, Fan X, Schoenfeld L, Strack S, Higgs HN. Receptor-mediated Drp1 oligomerization on endoplasmic reticulum. J Cell Biol. 2017;216:4123–4139. [DOI] [PMC free article] [PubMed] [Google Scholar]
- 14.Walther TC, Farese RV Jr. Lipid droplets and cellular lipid metabolism. Annu Rev Biochem. 2012;81:687–714. [DOI] [PMC free article] [PubMed] [Google Scholar]
- 15.Martin S, Parton RG. Lipid droplets: a unified view of a dynamic organelle. Nat Rev Mol Cell Biol. 2006;7:373–378. [DOI] [PubMed] [Google Scholar]
- 16.Xu S, Zhang X, Liu P. Lipid droplet proteins and metabolic diseases. Biochim Biophys Acta Mol Basis Dis. 2018;1864:1968–1983. [DOI] [PubMed] [Google Scholar]
- 17.Krahmer N, Farese RV Jr, Walther TC. Balancing the fat: lipid droplets and human disease. EMBO Mol Med. 2013;5:973–983. [DOI] [PMC free article] [PubMed] [Google Scholar]
- 18.Hashemi HF, Goodman JM. The life cycle of lipid droplets. Curr Opin Cell Biol. 2015;33:119–124. [DOI] [PMC free article] [PubMed] [Google Scholar]
- 19.Olzmann JA, Carvalho P. Dynamics and functions of lipid droplets. Nat Rev Mol Cell Biol. 2019;20:137–155. [DOI] [PMC free article] [PubMed] [Google Scholar]
- 20.Yang L, Li X, Tang H, Gao Z, Zhang K, Sun K. A unique role of carboxylesterase 3 (Ces3) in beta-adrenergic signaling stimulated thermogenesis. Diabetes. 2019;68:1178–1196. [DOI] [PMC free article] [PubMed] [Google Scholar]
- 21.Cermelli S, Guo Y, Gross SP, Welte MA. The lipid-droplet proteome reveals that droplets are a protein-storage depot. Curr Biol. 2006;16:1783–1795. [DOI] [PubMed] [Google Scholar]
- 22.Guo Y, Cordes KR, Farese RV Jr, Walther TC. Lipid droplets at a glance. J Cell Sci. 2009;122:749–752. [DOI] [PMC free article] [PubMed] [Google Scholar]
- 23.Pidoux G, Witczak O, Jarnaess E, et al. Optic atrophy 1 is an A-kinase anchoring protein on lipid droplets that mediates adrenergic control of lipolysis. EMBO J. 2011;30:4371–4386. [DOI] [PMC free article] [PubMed] [Google Scholar]
- 24.Hapala I, Marza E, Ferreira T. Is fat so bad? Modulation of endoplasmic reticulum stress by lipid droplet formation. Biol Cell. 2011;103:271–285. [DOI] [PubMed] [Google Scholar]
- 25.Datta S, Liu Y, Hariri H, Bowerman J, Henne WM. Cerebellar ataxia disease-associated Snx14 promotes lipid droplet growth at ER-droplet contacts. J Cell Biol. 2019;218:1335–1351. [DOI] [PMC free article] [PubMed] [Google Scholar]
- 26.Hariri H, Speer N, Bowerman J, et al. Mdm1 maintains endoplasmic reticulum homeostasis by spatially regulating lipid droplet biogenesis. J Cell Biol. 2019;218:1319–1334. [DOI] [PMC free article] [PubMed] [Google Scholar]
- 27.Schulze RJ, Weller SG, Schroeder B, et al. Lipid droplet break-down requires dynamin 2 for vesiculation of autolysosomal tubules in hepatocytes. J Cell Biol. 2013;203:315–326. [DOI] [PMC free article] [PubMed] [Google Scholar]
- 28.Xu D, Li Y, Wu L, et al. Rab18 promotes lipid droplet (LD) growth by tethering the ER to LDs through SNARE and NRZ interactions. J Cell Biol. 2018;217:975–995. [DOI] [PMC free article] [PubMed] [Google Scholar]
- 29.Gao M, Yang H. VPS13: a lipid transfer protein making contacts at multiple cellular locations. J Cell Biol. 2018;217:3322–3324. [DOI] [PMC free article] [PubMed] [Google Scholar]
- 30.Yan R, Qian H, Lukmantara I, et al. Human SEIPIN binds anionic phospholipids. Dev Cell. 2018;47:248–256.e4. [DOI] [PubMed] [Google Scholar]
- 31.Chung J, Wu X, Lambert TJ, Lai ZW, Walther TC, Farese RV Jr. LDAF1 and seipin form a lipid droplet assembly complex. Dev Cell. 2019;51:551–563.e7. [DOI] [PMC free article] [PubMed] [Google Scholar]
- 32.Fei W, Shui G, Gaeta B, et al. Fld1p, a functional homologue of human seipin, regulates the size of lipid droplets in yeast. J Cell Biol. 2008;180:473–482. [DOI] [PMC free article] [PubMed] [Google Scholar]
- 33.Gao M, Huang X, Song BL, Yang H. The biogenesis of lipid droplets: lipids take center stage. Prog Lipid Res. 2019;75:100989. [DOI] [PubMed] [Google Scholar]
- 34.Nguyen TB, Olzmann JA. Getting a handle on lipid droplets: Insights into ER-lipid droplet tethering. J Cell Biol. 2019;218:1089–1091. [DOI] [PMC free article] [PubMed] [Google Scholar]
- 35.Zhao Y, Li X, Yang L, et al. Transient overexpression of VEGF-A in adipose tissue promotes energy expenditure via activation of the sympathetic nervous system. Mol Cell Biol. 2018;38:e00242–18. [DOI] [PMC free article] [PubMed] [Google Scholar]
- 36.Zhao Y, Gu X, Zhang N, Kolonin MG, An Z, Sun K. Divergent functions of endotrophin on different cell populations in adipose tissue. Am J Physiol Endocrinol Metab. 2016;311:E952–E963. [DOI] [PMC free article] [PubMed] [Google Scholar]
- 37.Sanjana NE, Shalem O, Zhang F. Improved vectors and genome-wide libraries for CRISPR screening. Nat Methods. 2014;11:783–784. [DOI] [PMC free article] [PubMed] [Google Scholar]
- 38.Kolahi K, Louey S, Varlamov O, Thornburg K. Real-time tracking of BODIPY-C12 long-chain fatty acid in human term placenta reveals unique lipid dynamics in cytotrophoblast cells. PLoS ONE 2016;11:e0153522. [DOI] [PMC free article] [PubMed] [Google Scholar]
- 39.Adler J, Parmryd I. Quantifying colocalization by correlation: the Pearson correlation coefficient is superior to the Mander’s overlap coefficient. Cytometry A. 2010;77:733–742. [DOI] [PubMed] [Google Scholar]
- 40.Li X, Zhao Y, Chen C, et al. The critical role of MMP14 in adipose tissue remodeling during obesity. Mol Cell Biol 2020;40:e00564–19. [DOI] [PMC free article] [PubMed] [Google Scholar]
- 41.Wikstrom JD, Mahdaviani K, Liesa M, et al. Hormone-induced mitochondrial fission is utilized by brown adipocytes as an amplification pathway for energy expenditure. EMBO J. 2014;33:418–436. [DOI] [PMC free article] [PubMed] [Google Scholar]
- 42.Thiam AR, Foret L. The physics of lipid droplet nucleation, growth and budding. Biochim Biophys Acta. 2016;1861:715–722. [DOI] [PubMed] [Google Scholar]
- 43.Ohsaki Y, Soltysik K, Fujimoto T. The lipid droplet and the endoplasmic reticulum. Adv Exp Med Biol. 2017;997:111–120. [DOI] [PubMed] [Google Scholar]
- 44.Ohsaki Y, Cheng J, Suzuki M, Fujita A, Fujimoto T. Lipid droplets are arrested in the ER membrane by tight binding of lipidated apolipoprotein B-100. J Cell Sci. 2008;121:2415–2422. [DOI] [PubMed] [Google Scholar]
- 45.Gao G, Zhu C, Liu E, Nabi IR. Reticulon and CLIMP-63 regulate nanodomain organization of peripheral ER tubules. PLoS Biol 2019;17:e3000355. [DOI] [PMC free article] [PubMed] [Google Scholar]
- 46.Wolins NE, Quaynor BK, Skinner JR, Schoenfish MJ, Tzekov A, Bickel PE. S3–12, adipophilin, and TIP47 package lipid in adipocytes. J Biol Chem. 2005;280:19146–19155. [DOI] [PubMed] [Google Scholar]
- 47.Wolins NE, Skinner JR, Schoenfish MJ, Tzekov A, Bensch KG, Bickel PE. Adipocyte protein S3–12 coats nascent lipid droplets. J Biol Chem. 2003;278:37713–37721. [DOI] [PubMed] [Google Scholar]
- 48.Green DR, Galluzzi L, Kroemer G. Mitochondria and the autophagy-inflammation-cell death axis in organismal aging. Science 2011;333:1109–1112. [DOI] [PMC free article] [PubMed] [Google Scholar]
- 49.Jaishy B, Abel ED. Lipids, lysosomes, and autophagy. J Lipid Res 2016;57:1619–1635. [DOI] [PMC free article] [PubMed] [Google Scholar]
- 50.Sathyanarayan A, Mashek MT, Mashek DG. ATGL promotes autophagy/lipophagy via SIRT1 to control hepatic lipid droplet catabolism. Cell Rep. 2017;19:1–9. [DOI] [PMC free article] [PubMed] [Google Scholar]
- 51.Martinez-Lopez N, Garcia-Macia M, Sahu S, et al. Autophagy in the CNS and periphery coordinate lipophagy and lipolysis in the brown adipose tissue and liver. Cell Metab. 2016;23:113–127. [DOI] [PMC free article] [PubMed] [Google Scholar]
- 52.Kornmann B, Currie E, Collins SR, et al. An ER-mitochondria tethering complex revealed by a synthetic biology screen. Science 2009;325:477–481. [DOI] [PMC free article] [PubMed] [Google Scholar]
- 53.Friedman JR, Lackner LL, West M, DiBenedetto JR, Nunnari J, Voeltz GK. ER tubules mark sites of mitochondrial division. Science. 2011;334:358–362. [DOI] [PMC free article] [PubMed] [Google Scholar]
- 54.Bhattacharya A, Sun S, Wang H, et al. Hepatic Sel1L-Hrd1 ER-associated degradation (ERAD) manages FGF21 levels and systemic metabolism via CREBH. EMBO J. 2018;37:e99277. [DOI] [PMC free article] [PubMed] [Google Scholar]
- 55.Zhou Z, Torres M, Sha H, et al. Endoplasmic reticulum-associated degradation regulates mitochondrial dynamics in brown adipocytes. Science. 2020;368:54–60. [DOI] [PMC free article] [PubMed] [Google Scholar]
- 56.Pitts KR, Yoon Y, Krueger EW, McNiven MA. The dynamin-like protein DLP1 is essential for normal distribution and morphology of the endoplasmic reticulum and mitochondria in mammalian cells. Mol Biol Cell. 1999;10:4403–4417. [DOI] [PMC free article] [PubMed] [Google Scholar]
- 57.Youle RJ, van der Bliek AM. Mitochondrial fission, fusion, and stress. Science. 2012;337:1062–1065. [DOI] [PMC free article] [PubMed] [Google Scholar]
- 58.Ozcan U, Cao Q, Yilmaz E, et al. Endoplasmic reticulum stress links obesity, insulin action, and type 2 diabetes. Science. 2004;306:457–461. [DOI] [PubMed] [Google Scholar]
- 59.Oyadomari S, Harding HP, Zhang Y, Oyadomari M, Ron D. Dephosphorylation of translation initiation factor 2alpha enhances glucose tolerance and attenuates hepatosteatosis in mice. Cell Metab. 2008;7:520–532. [DOI] [PMC free article] [PubMed] [Google Scholar]
- 60.Fei W, Wang H, Fu X, Bielby C, Yang H. Conditions of endoplasmic reticulum stress stimulate lipid droplet formation in Saccharomyces cerevisiae. Biochem J. 2009;424:61–67. [DOI] [PubMed] [Google Scholar]
- 61.Rutkowski DT, Wu J, Back SH, et al. UPR pathways combine to prevent hepatic steatosis caused by ER stress-mediated suppression of transcriptional master regulators. Dev Cell. 2008;15:829–840. [DOI] [PMC free article] [PubMed] [Google Scholar]
Associated Data
This section collects any data citations, data availability statements, or supplementary materials included in this article.