Abstract
Editor’s Note.—Articles in the RadioGraphics Update section provide current knowledge to supplement or update information found in full-length articles previously published in RadioGraphics. Authors of the previously published article provide a brief synopsis that emphasizes important new information such as technological advances, revised imaging protocols, new clinical guidelines involving imaging, or updated classification schemes. Articles in this section are published solely online and are linked to the original article.
Introduction
Human coronaviruses are positive-sense RNA viruses belonging to the Coronaviridae family, and human coronavirus infections have become global concerns since the outbreak of severe acute respiratory syndrome coronavirus (SARS-CoV-1) in 2002–2003 and Middle East respiratory syndrome coronavirus (MERS-CoV) in 2012. Recently, a new coronavirus, novel coronavirus (2019-nCoV), which was initially identified in Wuhan, Hubei Province, China, in early December 2019, has rapidly spread worldwide and has been subsequently named severe acute respiratory syndrome coronavirus 2 (SARS-CoV-2). The disease caused by this organism is called coronavirus disease 2019 (COVID-19). The genetic sequences of this virus are at least 70% identical to those of SARS-CoV-1 and 50% similar to those of MERS-CoV, and it is the seventh member of the Coronaviridae family that can infect humans (1).
SARS-CoV-2 may have originated from horseshoe bats, a reservoir for SARS-CoV-1, and is responsible for rapid human-to-human transmission worldwide. As of 12:22 am GMT on April 8, 2020, a total of 1 428 428 confirmed cases of COVID-19 and 82 020 deaths across 184 countries have been reported (2). Respiratory symptoms such as fever, cough, and dyspnea are common, although the potential transmission of viruses by asymptomatic patients remains a problem. Approximately 20% of SARS-CoV-2 infections were reported as severe and the mortality rate was 3% (3). While droplet and contact transmission are the main modes of disease transmission, airborne transmission is also occasionally possible, consistent with the findings for SARS-CoV-1 and MERS-CoV infections. The incubation period of this virus ranges from 2 to 14 days. Early detection of SARS-CoV-2 infection and immediate isolation of those patients from the naive population are important steps to prevent an epidemic spread of the infection. In this updated review, we expand on the information presented in our 2018 article (4) and focus on the clinical features and chest CT findings of SARS-CoV-2 pneumonia to help radiologists detect the disease at its early stage.
Laboratory Tests
To prevent the spread of SARS-CoV-2 to health care workers or other patients, laboratory test sampling should be performed in a dedicated isolated location, where contact is strictly limited between others and patients with suspected SARS-CoV-2 infection. Most patients with SARS-CoV-2 infection have normal white blood cell and neutrophil counts, as well as a normal or reduced lymphocyte count (5). C-reactive protein and erythrocyte sedimentation rate (ESR) levels can be slightly high, but the procalcitonin level is usually normal. A high procalcitonin level indicates a bacterial coinfection.
A reverse transcription–polymerase chain reaction (RT-PCR) test of an upper respiratory tract specimen (obtained with nasopharyngeal swab and/or oropharyngeal swab) and/or sputum sample is the standard diagnostic tool for determining hospitalization and isolation of patients with SARS-CoV infection. However, the positivity rate for RT-PCR tests on throat samples is reportedly 59%–71% (6,7), possibly owing to a low viral load, specimen error, and/or laboratory error. Assays for the target sites of the virus genome (E gene, ORF1ab region [RNA-dependent RNA polymerase (RdRp) gene], and N gene) are performed as first-line, confirmatory, and additional confirmatory assays.
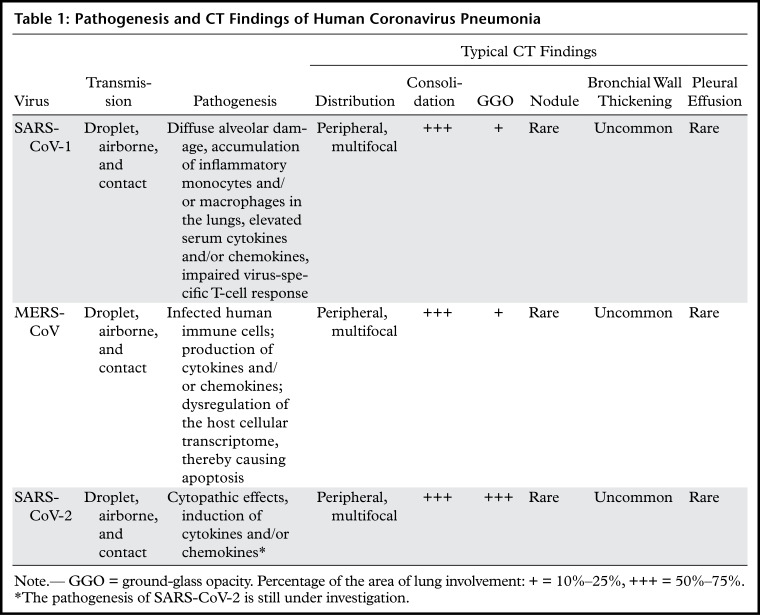
The pathogenesis of SARS-CoV-2 is still under investigation. In an in vitro study, SARS-CoV-2 inoculation into the human airway epithelial layers induced cytopathic effects (1). Angiotensin-converting enzyme 2 (ACE2) receptors on the surface of SARS-CoV-2 anchor onto the respiratory cells, as well as onto the pneumocytes present in the nasopharyngeal mucosa, and consequently induce viremia. High levels of plasma cytokines and chemokines were noted in severely ill patients infected with SARS-CoV-2 (Table 1) (8). These results suggest that an immunopathologic mechanism may be responsible for the progression of disease severity.
Table 1:
Pathogenesis and CT Findings of Human Coronavirus Pneumonia
Chest CT Findings
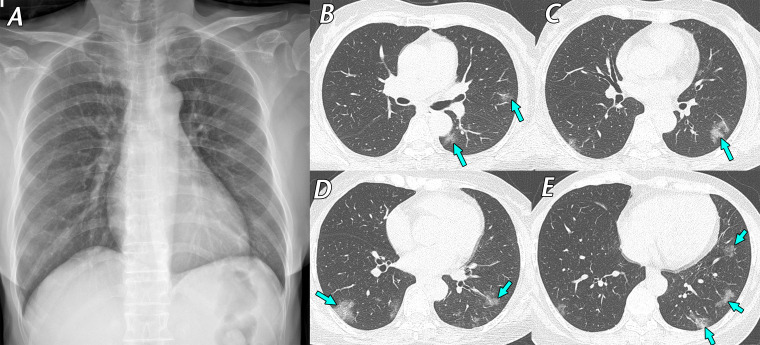
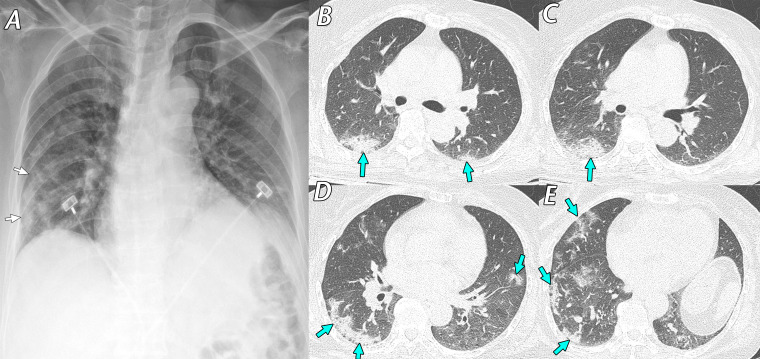
Chest radiographs may show bilateral infiltrates, but the findings may be nonspecific or normal (Fig 1) during the early stage of SARS-CoV-2 infection. CT findings of pneumonia caused by SARS-CoV-2 are similar to those findings of pneumonia caused by other human coronaviruses, which are characterized by ground-glass opacities and consolidations (4,9,10). Comparable with pneumonia caused by the two other coronaviruses, SARS-CoV-1 and MERS-CoV, the most common CT finding for SARS-CoV-2 pneumonia is ground-glass opacity (Figs 1, 2). A reversed halo sign is an uncommon CT feature but could be visualized in the early stage of SARS-CoV-2 pneumonia.
Figure 1.
Mild cough and dizziness 1 day before visiting a screening clinic in a 62-year-old woman with contact history with a confirmed SARS-CoV-2–infected patient 4 days earlier. RT-PCR test results were positive for SARS-CoV-2, and she was transferred to our hospital and admitted to a containment zone. Initial chest CT findings (not shown) were normal. A, Posteroanterior (PA) chest radiograph obtained 9 days after initial symptom onset shows no definite abnormality. B–E, Follow-up axial chest CT images obtained on the same day as the chest radiograph show multifocal ground-glass opacities (arrows), predominantly located in the peripheral areas of both lungs. After 13 days of conservative management, her respiratory symptoms ameliorated, and a negative RT-PCR test result for SARS-CoV-2 was obtained. RT-PCR was repeated twice to confirm this negative result.
Figure 2.
Mild cough and hemoptysis in a 64-year-old woman who was a caregiver in a hospital where SARS-CoV-2–infected patients were present. She underwent a screening test for SARS-CoV-2, and RT-PCR test results were positive. A, Anteroposterior supine chest radiograph obtained 7 days after symptom onset shows ill-defined consolidation (arrows) in the peripheral areas of the right middle to lower lung zones. B–E, Axial chest CT images obtained on the same day as the chest radiograph show irregular consolidation, with fine reticulation (arrows) in the peripheral subpleural areas of both the middle to lower lung zones, mainly in the right lung. She recovered within 14 days with conservative management and was discharged uneventfully after a negative RT-PCR test result.
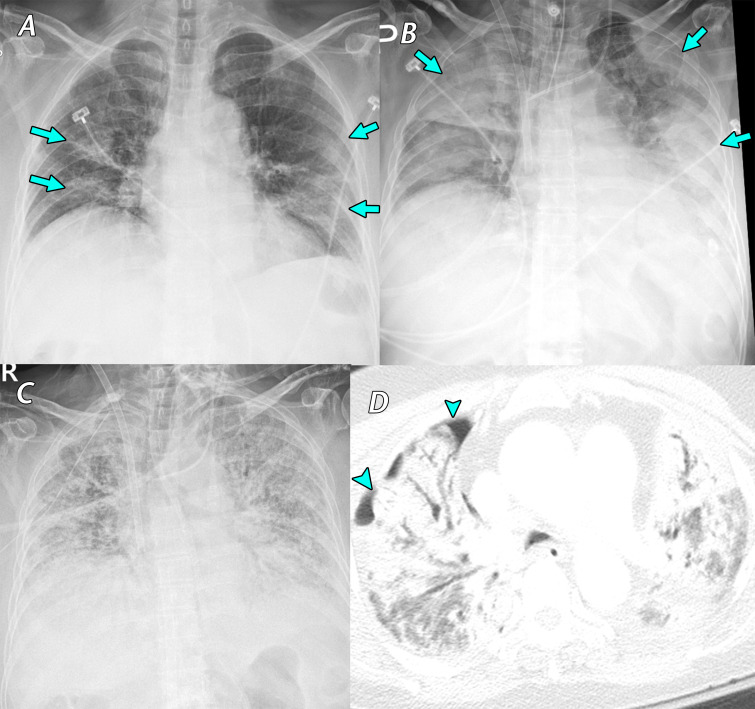
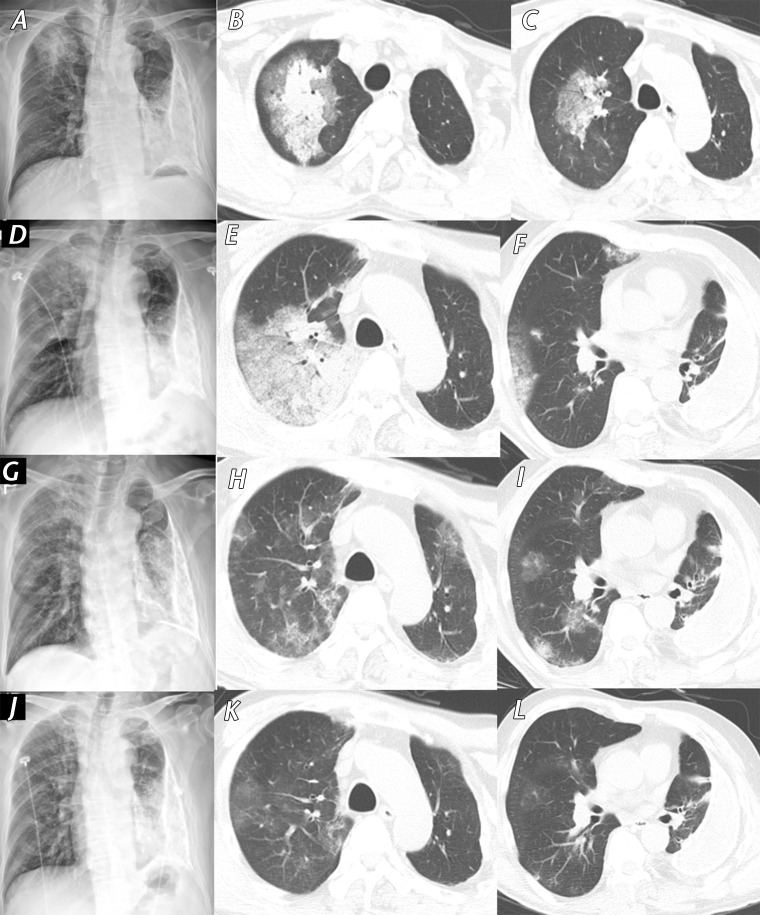
During the SARS-CoV-2 epidemic situation in China, the sensitivity of chest CT for identifying SARS-CoV-2 pneumonia cases has been reported to be 97% (95% confidence interval: 95%, 98%) (6). The high sensitivity of chest CT was considered in part a result of imaging patients who were at a relatively advanced stage of SARS-CoV-2 pneumonia. Consolidation is noted as the second most common finding during the first 11 days of symptom onset (11). Approximately half of the patients were diagnosed with multifocal ground-glass opacity and consolidation, and reticulation or nodules are rare (6). Serial follow-up chest CT can help indicate the evolution of the disease and help monitor therapeutic effects (12,13). Bilateral and peripheral ground-glass opacities are predominant patterns after symptom onset (11), and the extent of ground-glass opacity and consolidation occasionally manifesting as a “crazy-paving” pattern increases as the disease progresses and peaks at 6–11 days (12). Bilaterality was noted among 76% of cases 3–5 days after initial symptom onset (11,12). Severe cases manifest as acute respiratory distress syndrome, with diffuse haziness of the bilateral lungs (Fig 3). Images obtained in most patients (75%) who are in the recovery phase after 2 weeks from initial symptom onset show a gradual resolution of consolidation, with residual ground-glass opacity (Fig 4) (13).
Figure 3.
Fever, cough, sputum production, and anorexia for 1 week in a 77-year-old woman with asthma, which was managed daily with a long-acting β-agonist salmeterol and corticosteroid inhaler, who presented to a SARS-CoV-2 screening clinic. The test results confirmed SARS-CoV-2 infection, and the patient was transferred to a containment zone at our hospital. A, Anteroposterior chest radiograph obtained 14 days after symptom onset shows bilateral ill-defined ground-glass opacity and consolidation (arrows). B, C, Anteroposterior chest radiograph, B, obtained 19 days after symptom onset shows an increase in the extent of consolidation (arrows) after the patient’s symptoms worsened. Despite the use of extracorporeal membrane oxygenation (ECMO) in the intensive care unit, diffuse consolidation continued to increase until 4 weeks after the admission period, as depicted on the anteroposterior radiograph in C. D, Axial chest CT image obtained 5 weeks after symptom onset shows diffuse consolidation with air bronchogram and pneumothorax (arrowheads), clinically indicating acute respiratory distress syndrome. The patient died that day owing to sepsis and multiorgan failure.
Figure 4.
Fever and myalgia in a 61-year-old man with a history of chronic pleurisy 48 years earlier who presented to a SARS-CoV-2 screening clinic. He had attended a religious meeting where people with SARS-CoV-2 infection had been identified 14 days earlier. A, Initial PA chest radiograph (obtained 14 days after symptom onset) shows patchy consolidation in the right upper lung zone. B, C, Axial CT images obtained on the same day as the chest radiograph show patchy consolidation with surrounding ground-glass opacity in the central area of the right upper lobe. Note the calcified fibrothorax with chronic left pleural effusion in the left hemithorax. D–F, PA radiograph, D, and axial CT images, E, F, show that the extent of consolidation and ground-glass opacity increased over 3 days. After intensive conservative care, symptoms were relieved, and the extent of consolidation gradually decreased. G–I, Follow-up PA radiograph, G, and axial CT images, H,I, obtained after 7 days (24 days from symptom onset) show residual multifocal ground-glass opacity in both lungs. J–L, PA chest radiograph, J, and axial CT images, K, L, obtained before patient discharge (30 days from symptom onset) show almost complete resolution of ground-glass opacities in both lungs.
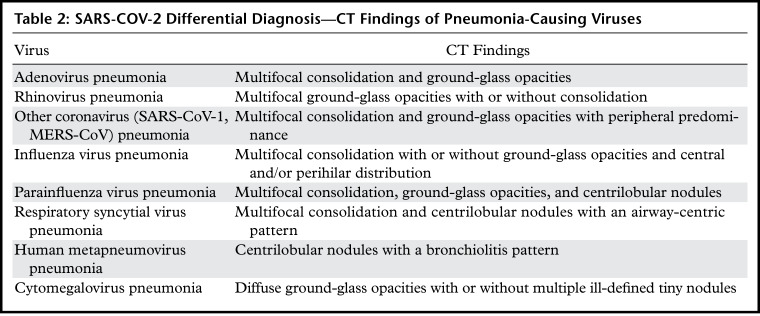
Although more than 70% of SARS-CoV-2 pneumonia cases exhibit typical CT findings, not every case of SARS-CoV-2 pneumonia is distinguishable from other types of viral pneumonia. Chest CT findings sometimes result in a false-positive diagnosis owing to overlapping CT manifestations. The differential diagnosis of SARS-CoV-2 pneumonia includes other pneumonia-causing viral pathogens, and their CT findings are briefly described in Table 2. Detailed CT findings and relevant images have been provided in a previous article (4).
Table 2:
SARS-COV-2 Differential Diagnosis—CT Findings of Pneumonia-Causing Viruses
A study involving the use of chest CT for differentiating SARS-CoV-2 pneumonia from other types of viral pneumonia found that radiologists who were blinded to RT-PCR results could correctly distinguish cases of SARS-CoV-2 infection with 67%–97% sensitivity (7). Peripheral distribution and ground-glass opacity were significantly noted characteristics of SARS-CoV-2 pneumonia, and fine reticular opacity and vascular thickening were also a more commonly noted pattern in half of the SARS-CoV-2 pneumonia cases, as opposed to other viral pneumonia cases. Pleural effusion and lymphadenopathy were uncommon.
As an initial laboratory test, a respiratory virus nucleic acid test is commonly performed to detect other common respiratory viruses such as adenovirus, parainfluenza virus, respiratory syncytial virus, and influenza virus. In addition, considering the potential false-negative results of laboratory tests and highly contagious nature of the viruses, chest CT could prove to be a fast diagnostic tool in combination with clinical manifestations for diagnosing SARS-CoV-2 infection. CT images are helpful to distinguish SARS-CoV-2 pneumonia in suspicious cases with initially negative molecular test results, and some of these cases could show positive results at repeat molecular testing during the follow-up monitoring period.
Role of Chest CT in the Diagnosis of SARS-CoV-2 Pneumonia
Chest CT is useful for diagnosis and establishing the next management strategies, including patient isolation. However, radiation exposure, the risk of the virus spreading to health care workers, medical costs, and the time required for disinfecting imaging examination rooms are considerable factors that make us consider the appropriateness of performing imaging. As droplet and contact transmissions are the main modes of spread for SARS-CoV-2, all patients with suspected SARS-CoV-2 infection who undergo radiologic imaging should be masked and imaged using a separated dedicated imaging machine. The imaging location should be disinfected after each imaging examination. Health care workers who manage patients with suspected SARS-CoV-2 infection should wear a medical mask and goggles, and the use of an isolation gown is recommended.
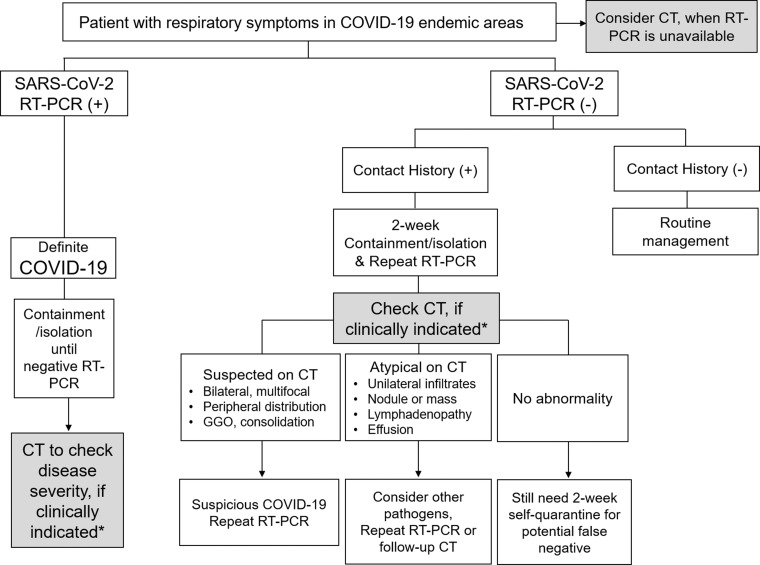
A multidisciplinary panel of experienced radiologists and pulmonologists from 10 countries suggested the utility of imaging within clinical scenarios representing community situations, medical resources, and various risk factors (14). On the basis of this suggestion and experience managing patients with COVID-19, we provide a brief clinical setting to show the use of chest CT to facilitate the diagnosis of SARS-CoV-2 pneumonia (Fig 5).
Figure 5.
Flow chart shows the role of chest CT to facilitate the diagnosis of SARS-CoV-2 pneumonia. (+) = positive, (−) = negative. *Clinical judgment of the use of chest CT is dependent on the patient risk factors related to COVID-19 and the availability of local medical resources. Patients with mild symptoms of COVID-19 without significant respiratory dysfunction do not require chest CT. Chest CT is considered in patients with moderate to severe symptoms with pulmonary dysfunction or damage.
For the management of patients with respiratory symptoms in endemic areas, an RT-PCR test is the primary diagnostic tool used for discriminating SARS-CoV-2–positive cases. After confirming SARS-CoV-2 infection, chest CT could be used to evaluate disease severity (Fig 5). Clinical judgment regarding the use of chest CT is dependent on the patient risk factors related to COVID-19, such as age greater than 65 years and any comorbidities.
The availability of local medical resources, including medical team members, personal protection devices, RT-PCR tests, hospital containment beds, and ventilators, has also affected the process of patient management. In the situation of significant medical resource constraints, a patient with mild symptoms of COVID-19 without significant respiratory dysfunction does not require chest CT examination.
Chest CT is considered in patients with moderate to severe symptoms with pulmonary dysfunction or damage. If a patient has contact history with a confirmed SARS-CoV-2–infected patient, chest CT could be performed as the next step for excluding a potential false-negative outcome from a negative RT-PCR test result. In cases with typical CT findings, bilateral ground-glass opacity, consolidation, and fine reticulation, SARS-CoV-2 infection is highly suspected. Therefore, a repeat RT-PCR test is warranted, even if the first RT-PCR test result was negative. In a case with atypical CT findings (Fig 4), there could be a probability of infection by other pathogens, but a repeat RT-PCR test or follow-up CT is still necessary, especially for patients with underlying comorbidities. The CT findings could be subtle during the early stage of infection.
If no abnormalities are detected on chest CT images, patients are still recommended to maintain a 2-week isolation period in their personal space or home to prevent community transmission owing to a potential false-negative result. In a scenario wherein RT-PCR tests for SARS-CoV-2 are unavailable, chest CT could be used as a screening tool for identifying potential patients with SARS-CoV-2 pneumonia.
In an endemic area, it is not only the management of a patient with respiratory symptoms that needs attention. Because an asymptomatic patient in the early stage of COVID-19 is also a source of infection transmission, taking a careful history and performing RT-PCR tests are necessary when radiologists incidentally detect imaging findings suggestive of COVID-19 at chest CT in routine practice.
Treatment
Although various trials for developing treatment strategies for SARS-CoV-2 infection are ongoing, there are no approved therapeutic drugs or vaccines for this disease to date. Patients with SARS-CoV-2 infection need to be isolated in a designated area to prevent further spread of the virus, and intensive care is critical for severely ill patients. Current management methods for SARS-CoV-2 pneumonia are based on optimal conservative care, including respiratory support. Similar to plasma transfusion used as treatment of MERS-CoV infection, the blood plasma of patients who recovered from SARS-CoV-2 infection, which contained neutralizing antibodies, was transfused in several patients with SARS-CoV-2 infection (15). However, further tests for the validation of this strategy are necessary.
Conclusion
Chest CT can be used as a rapid diagnostic tool in combination with clinical manifestations to diagnose SARS-CoV-2 infection.
All authors have disclosed no relevant relationships.
Abbreviations:
- COVID-19
- coronavirus disease 2019
- MERS-CoV
- Middle East respiratory syndrome coronavirus
- PA
- posteroanterior
- RT-PCR
- reverse transcription polymerase chain reaction
- SARS-CoV-1
- severe acute respiratory syndrome coronavirus
- SARS-CoV-2
- severe acute respiratory syndrome coronavirus 2
References
- 1.Zhu N, Zhang D, Wang W, et al. A novel coronavirus from patients with pneumonia in China, 2019. N Engl J Med 2020;382(8):727–733. [DOI] [PMC free article] [PubMed] [Google Scholar]
- 2.COVID-19 Map . COVID-19 Map. Johns Hopkins Coronavirus Resource Center. https://coronavirus.jhu.edu/map.html. Updated May 27, 2020. Accessed April 8, 2020. [Google Scholar]
- 3.Wang C, Horby PW, Hayden FG, Gao GF. A novel coronavirus outbreak of global health concern. Lancet 2020;395(10223):470–473. [DOI] [PMC free article] [PubMed] [Google Scholar]
- 4.Koo HJ, Lim S, Choe J, Choi SH, Sung H, Do KH. Radiographic and CT features of viral pneumonia. RadioGraphics 2018;38(3):719–739. [DOI] [PubMed] [Google Scholar]
- 5.Song F, Shi N, Shan F, et al. Emerging 2019 novel coronavirus (2019-nCoV) pneumonia. Radiology 2020;295(1):210–217. [DOI] [PMC free article] [PubMed] [Google Scholar]
- 6.Ai T, Yang Z, Hou H, et al. Correlation of chest CT and RT-PCR testing in coronavirus disease 2019 (COVID-19) in China: A report of 1014 cases. Radiology doi: 10.1148/radiol.2020200642. Published online February 26, 2020. Accessed April 8, 2020. [DOI] [PMC free article] [PubMed]
- 7.Bai HX, Hsieh B, Xiong Z, et al. Performance of radiologists in differentiating COVID-19 from viral pneumonia on chest CT. Radiology doi: 10.1148/radiol.2020200823. Published online March 10, 2020. Accessed April 8, 2020. [DOI] [PMC free article] [PubMed]
- 8.Huang C, Wang Y, Li X, et al. Clinical features of patients infected with 2019 novel coronavirus in Wuhan, China. Lancet 2020;395(10223):497–506 [Published correction appears in Lancet 2020;395(10223):496.]. [DOI] [PMC free article] [PubMed] [Google Scholar]
- 9.Antonio GE, Ooi CG, Wong KT, et al. Radiographic-clinical correlation in severe acute respiratory syndrome: study of 1373 patients in Hong Kong. Radiology 2005;237(3):1081–1090. [DOI] [PubMed] [Google Scholar]
- 10.Das KM, Lee EY, Enani MA, et al. CT correlation with outcomes in 15 patients with acute Middle East respiratory syndrome coronavirus. AJR Am J Roentgenol 2015;204(4):736–742. [DOI] [PubMed] [Google Scholar]
- 11.Wang Y, Dong C, Hu Y, et al. Temporal changes of CT findings in 90 patients with COVID-19 pneumonia: a longitudinal study. Radiology doi: 10.1148/radiol.2020200843. Published online March 19, 2020. Accessed April 8, 2020. [DOI] [PMC free article] [PubMed]
- 12.Bernheim A, Mei X, Huang M, et al. Chest CT findings in coronavirus disease-19 (COVID-19): relationship to duration of infection. Radiology doi: 10.1148/radiol.2020200463. Published online February 20, 2020. Accessed April 8, 2020. [DOI] [PMC free article] [PubMed]
- 13.Pan F, Ye T, Sun P, et al. Time course of lung changes on chest CT during recovery from 2019 novel coronavirus (COVID-19) pneumonia. Radiology doi: 10.1148/radiol.2020200370. Published online February 13, 2020. Accessed April 8, 2020. [DOI] [PMC free article] [PubMed]
- 14.Rubin GD, Ryerson CJ, Haramati LB, et al. The Role of Chest Imaging in Patient Management during the COVID-19 Pandemic: A Multinational Consensus Statement from the Fleischner Society. Radiology doi: 10.1148/radiol.2020201365. Published online April 7, 2020. Accessed April 8, 2020. [DOI] [PMC free article] [PubMed]
- 15.Shen C, Wang Z, Zhao F, et al. Treatment of 5 critically ill patients with COVID-19 with convalescent plasma. JAMA 2020;323(16):1582. [DOI] [PMC free article] [PubMed] [Google Scholar]


