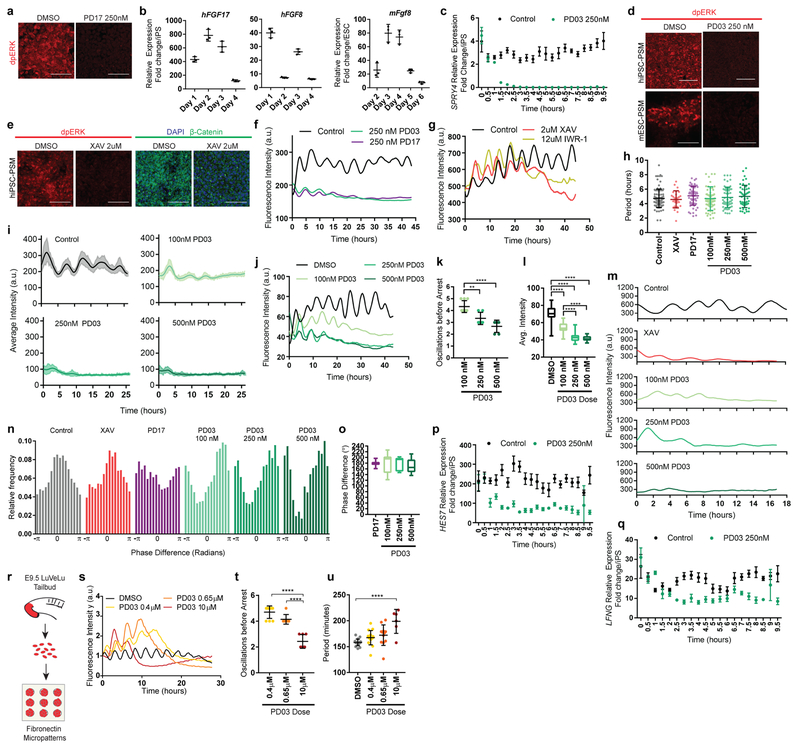
Extended data Figure 6.
a, Immunofluorescence staining for doubly phosphorylated ERK on Day 2 of differentiation following 3 hours of treatment with either DMSO (vehicle control) or the FGFR inhibitor PD173074 (250 nM). n=4 independent experiments b, Left: qRT-PCR for the FGF ligands FGF17 and FGF8 on days 1-4 of human iPSC differentiation. Relative expression shown as fold change relative to iPS (day 0). Mean ±SD n=3 Right: qRT-PCR for the FGF ligand Fgf8 on days 2-6 of mouse ESC differentiation. Relative expression shown as fold change relative to ESC (day 0). Mean ±SD. n=3 c, Time-course qRT-PCR for the FGF target gene SPRY4 in human iPSC-derived PSM cells during the 10 hours immediately following treatment with either vehicle control (DMSO) or 250nM PD03. Relative expression shown as fold change relative to ESC (day 0). Mean ±SD. n=3 d, Immunofluorescence staining for doubly phosphorylated ERK in human iPSC-derived PSM (top) or mESC-derived PSM (bottom) cells treated with either DMSO or PD03 (250 nM). n=4. e, Immunofluorescence staining for doubly phosphorylated ERK (left), β-catenin and nuclear stain (right) in human iPSC- derived PSM cells treated with vehicle control (DMSO) or 2μM XAV. n=4 independent experiments. Scale bar = 100μm. f, Representative examples of HES7-Achilles fluorescence intensity over the course of 45 hours in a small area of interest within human cultures treated with DMSO (vehicle control), the MAPK inhibitor PD0325901 (250nM), or the FGFR inhibitor PD173074 (250nM) in CLFBR medium. n=16 independent experiments. g, HES7-Achilles fluorescence intensity over the course of 45 hours in a small area of interest within human cultures treated with DMSO (vehicle control), 2μM XAV or 12μM IWR-1 in CLFBR medium. n=3 independent experiments. h, HES7-Achilles oscillatory period of individual cells treated with vehicle control (DMSO), 2μM XAV, 250nM PD17 or 100nM/250nM/500nM PD03 on day 2 of differentiation. Mean±SD. One-way ANOVA p values (ns): 0.9929, 0.4097, 0.9998, 0.9845, 0.7425. n=27 (XAV), n=48 (100nM PD03), n=57 (all others). i, Average fluorescence intensity profiles for automatically tracked individual HES7-Achilles human cells treated with vehicle control (DMSO) or increasing doses of PD03 (100nM, 250nM, 500nM) on day 2 of differentiation. Mean ± 95% CI. n=68 cells (Control), 45 cells (100nM), 35 cells (250nM), 36 cells (500nM). j, Representative examples of HES7-Achilles fluorescence intensity profiles in a small area of interest within human cultures treated with increasing doses of PD03 (100nM, 250 nM, 500nM) or vehicle control (DMSO). n=8 independent experiments. k, Number of HES7-Achilles oscillations before arrest in small areas of interest within cultures treated with increasing doses of PD03 (100nM, 250 nM, 500nM). One-way ANOVA:100nM vs. 250nM p=0.0042, 100nM vs. 500nM p=2.0e−5. n=6. l, Average HES7-Achilles fluorescence intensity over the course of the oscillatory regime (i.e. prior to the arrest of oscillations) in cells treated with either vehicle control (DMSO) or increasing doses of PD03 (100nM, 250 nM, 500nM). Middle hinge corresponds to median, lower and upper hinges correspond to 1st and 3rd quartiles, lower and upper whiskers correspond to minimum and maximum. One-way ANOVA: control vs. 100nM p= 6.7e−17, control vs. 250nM p=6.5e−21, control vs. 500nM p=1.9e−22, 100nM vs. 250nM p=1.1e−17, 100nM vs. 500nM p=2.5e−18. n=6 m, Representative Hes7-Achilles fluorescence intensity profiles for mESC-derived PSM cells treated with either vehicle control (DMSO), 2μM XAV or 100nM/250nM/500nM PD03. n=12 (control, XAV, 100nM PD03), n=10 (250nM, 500nM PD03). n, Histograms showing the instantaneous phase difference relative to control for individual cells treated with vehicle control (DMSO), 2μM XAV, 250nM PD17 or 100nM/250nM/500nM PD03. See “Phase shifts” in methods section for details. n fixed at 11,000 observations. o, Quantification of the average phase difference (degrees) for HES7-Achilles oscillations in cells treated with 250nM PD17 or 100nM/250nM/500nM PD03 relative to control (DMSO) cells. Middle hinge corresponds to median, lower and upper hinges correspond to 1st and 3rd quartiles, lower and upper whiskers correspond to minimum and maximum. n=13 (PD17), n=17 (100nM), n=7 (250nM), n=11 (500nM). p-q, Timelapse qRT-PCR for the cyclic genes HES7 (p) and LFNG (q) in human iPSC-derived PSM cells under control (DMSO) and 250nM PD03 conditions. Samples were taken every 30 minutes immediately following treatment. Relative expression shown as fold change relative to ESC (day 0). Mean ±SD. n=3. r, Outline of the experimental strategy used to assess the effect of FGF inhibition in primary mouse PSM cells carrying the LuVeLu reporter. The tailbud is dissected from E9.5 transgenic embryos and cells are dissociated for seeding on fibronectin micropatterns. Oscillations of the LuVeLu reporter are examined in each micropattern. s, LuVeLu fluorescence intensity profiles in mouse tailbud explant cells cultured on CYTOO micropatterns in CLFBR medium containing DMSO (vehicle control) or increasing doses of PD03 (0.4μM, 0.65μM, 10μM). n=2 independent experiments. t, Number of LuveLu oscillations before arrest in mouse tailbud explant cells cultured on CYTOO micropatterns treated with DMSO (vehicle control) or increasing doses of PD03 (0.4μM, 0.65μM, 10μM). Mean ±SD. One way ANOVA: 0.4μM vs. 0.65μM p=0.0642, 0.4μM vs. 10μM p=8.4e−9, 0.65μM vs. 10μM p=2.9e−6. n=10 micropatterns (0.4μM), n=7 micropatterns (0.65μM, 10μM) u, Average period of LuVeLu oscillations in mouse tailbud explant cells cultured on CYTOO micropatterns treated with DMSO (vehicle control) or increasing doses of PD03 (0.4μM, 0.65μM, 10μM). Mean ±SD. One way ANOVA: control vs. 0.4μM p=0.2785, control vs. 0.65μM p=0.0658, control vs. 10μM p=2.7e−6, 0.4μM vs. 0.65μM p=0.831, 0.4μM vs. 10μM p=3.05e−4, 0.65μM vs. 10μM p=4e−3 . n=18 micropatterns (DMSO), n=16 micropatterns (0.4μM), n=12 micropatterns (0.65μM), n=6 micropatterns (10μM).

