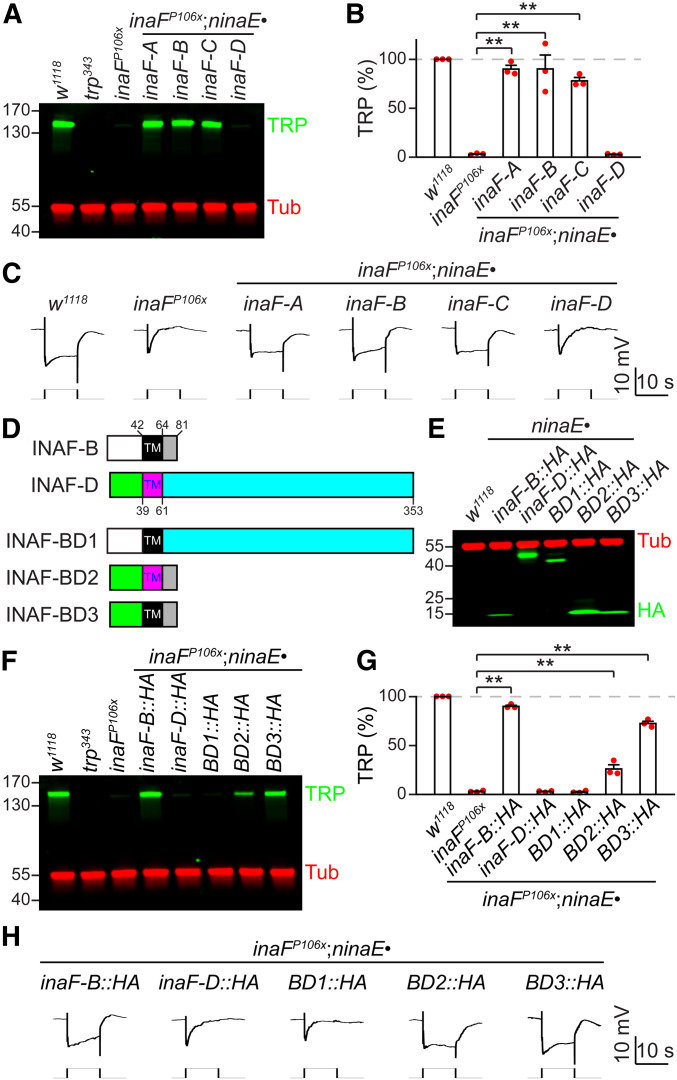
Figure 7.
Mapping domains in INAF-B critical for TRP expression. (A–C) Testing whether INAF-A, C, or D can substitute for INAF-B in R1-R6 cells. Each inaF coding region was expressed under the control of the ninaE promoter in an inaFP106xmutant background (inaFP106x;ninaE•inaF-A, B, C or D). (A) Head extracts were prepared from the indicated flies and a Western blot was probed with rabbit anti-TRP and mouse anti-tubulin (Tub, loading control). Protein size markers (kDa) are shown. (B) Quantification of the relative TRP level in the indicated flies, based on Western blot analyses represented in (A); n = 3. (C) ERG responses to orange light in the indicated flies; n ≥ 5 for each genotype. (D) Cartoons illustrating INAF-B/INAF-D chimeras. TM indicates the distinct single transmembrane segments in INAF-B and INAF-D. The numbers indicate amino acid residues. The white and green rectangles represent the N-termini of INAF-B and INAF-D. The gray and turquoise rectangles stand for the C-termini of INAF-B and INAF-D. (E) Western blot showing expression of INAF-B/INAF-D (BD) chimeras. Head extracts were prepared from flies expressing the indicated transgenes under control of the ninaE promoter, and fractionated by SDS-PAGE. The blot was probed with rabbit anti-HA (recognizes INAF-B::HA, INAF-D::HA and INAF-B/INAF-D: BD1, BD2 and BD3) and mouse anti-Tub. The positions of protein size markers (kDa) are indicated. (F–H) Determining the domain(s) in INAF-B essential for its function. (F) Head extracts were prepared from inaFP106x flies expressing the indicated inaF chimeric transgenes under control of the ninaE promoter, and fractionated by SDS-PAGE. A Western blot was probed with rabbit anti-TRP and mouse anti- Tub. The positions of protein size markers (kDa) are indicated. (G) Quantification of Western blot data represented in (F); n = 3. Error bars represent SEMs; **P < 0.01 (one-way ANOVA with Holm–Sidak post hoc analyses). (H) ERG responses to orange light in the indicated flies; n ≥ 5 for each genotype.

