

Abstract
Integrin-transmitted cellular forces have rich spatial dynamics and are vital to many cellular functions. To advance the sensitivity and spatial resolution of cellular force imaging, we developed force-activatable emitter reporting single molecular tension events and the associated cellular force nanoscopy (CFN). Immobilized on a surface, the emitters are initially dark (>99.8% quenching efficiency), providing a low fluorescence background despite the high coating density (>1000/μm2) required for sampling cellular force properly. The emitters fluoresce brightly once switched on by integrin tensions and can be switched off by photobleaching, enabling continuous real-time imaging of integrin molecular tensions in live cells. With multiple cycles of molecular tension imaging and localization, CFN reproduces cellular force images with 50 nm resolution. Applied to both migratory cells and stationary cells, CFN revealed ultra-narrow distribution of integrin tensions at the cell leading edge, and showed that force distribution in focal adhesions (FAs) is off-centered and FA size-dependent.
Cellular forces at the cell-matrix interface have been increasingly recognized as important mechanical signals regulating many cellular functions1–3 and physiological processes4, 5. Force transmission units such as focal adhesions (FAs) and podosomes have been shown to have ultra-fine structural features6–9, suggesting that cellular forces may have spatial dynamics at nanoscale. Previously, tremendous efforts have been made to visualize cellular force and improve the force imaging resolution. Cell traction force microscopies mapped cellular forces with resolution of microns10. Lately, surface-immobilized tension sensors convert force to fluorescence, enabling cellular force imaging at diffraction limit11–15. To break the limit, one apparent strategy is to image and localize integrin molecular tensions and reconstruct cellular force maps at ultra-resolution, similarly to the principle of molecular localization adopted in super-resolution light microscopies such as STORM16 and PALM17. However, it is highly challenging to image individual integrin tensions at sufficient sampling density with current fluorescent tension sensors. The main difficulty originates from the fact that the tension sensors have non-zero initial fluorescence but have to be densely immobilized on a surface (>1000/μm2) to probe cellular force at ultra-resolution, causing a high fluorescence background unsuitable for molecular tension imaging.
In this work, we developed a force-activatable emitter which is practically dark but fluoresce brightly once activated by molecular tension (Scheme 1), making it feasible to image and localize integrin molecular tensions with sufficient sampling density. Based on this emitter, we further developed Cellular Force Nanoscopy, termed CFN, for imaging cellular forces with 50 nm resolution. The main construct of a force-activatable emitter is a 18mer DNA/PNA (peptide nucleic acid18) hybrid duplex labeled with a blackhole quencher 2 (BHQ2), an Arg-Gly-Arp peptide (RGD)19 as a ligand targeting integrins20, a Cy5 dye, and a biotin for surface immobilization (Scheme 1). The Cy5 is quenched by the BHQ2 until the duplex is forcedly separated by an integrin-RGD-transmitted tension, which de-quenches the Cy5 and switches on the emitter. Compared to the original double-stranded DNA-based tension sensor15, the DNA/PNA hybrid is resistant to the degradation caused by DNases expressed by cells21, and enhances the fluorescence intensity of Cy5 dyes by two-fold (fig. S1) potentially due to protein-induced fluorescence enhancement22. Cy5 instead of Cy3 is used in the emitter because Cy5 is brighter and has shorter lifetime that facilitates emitter switch-off by photobleaching.
Scheme 1.
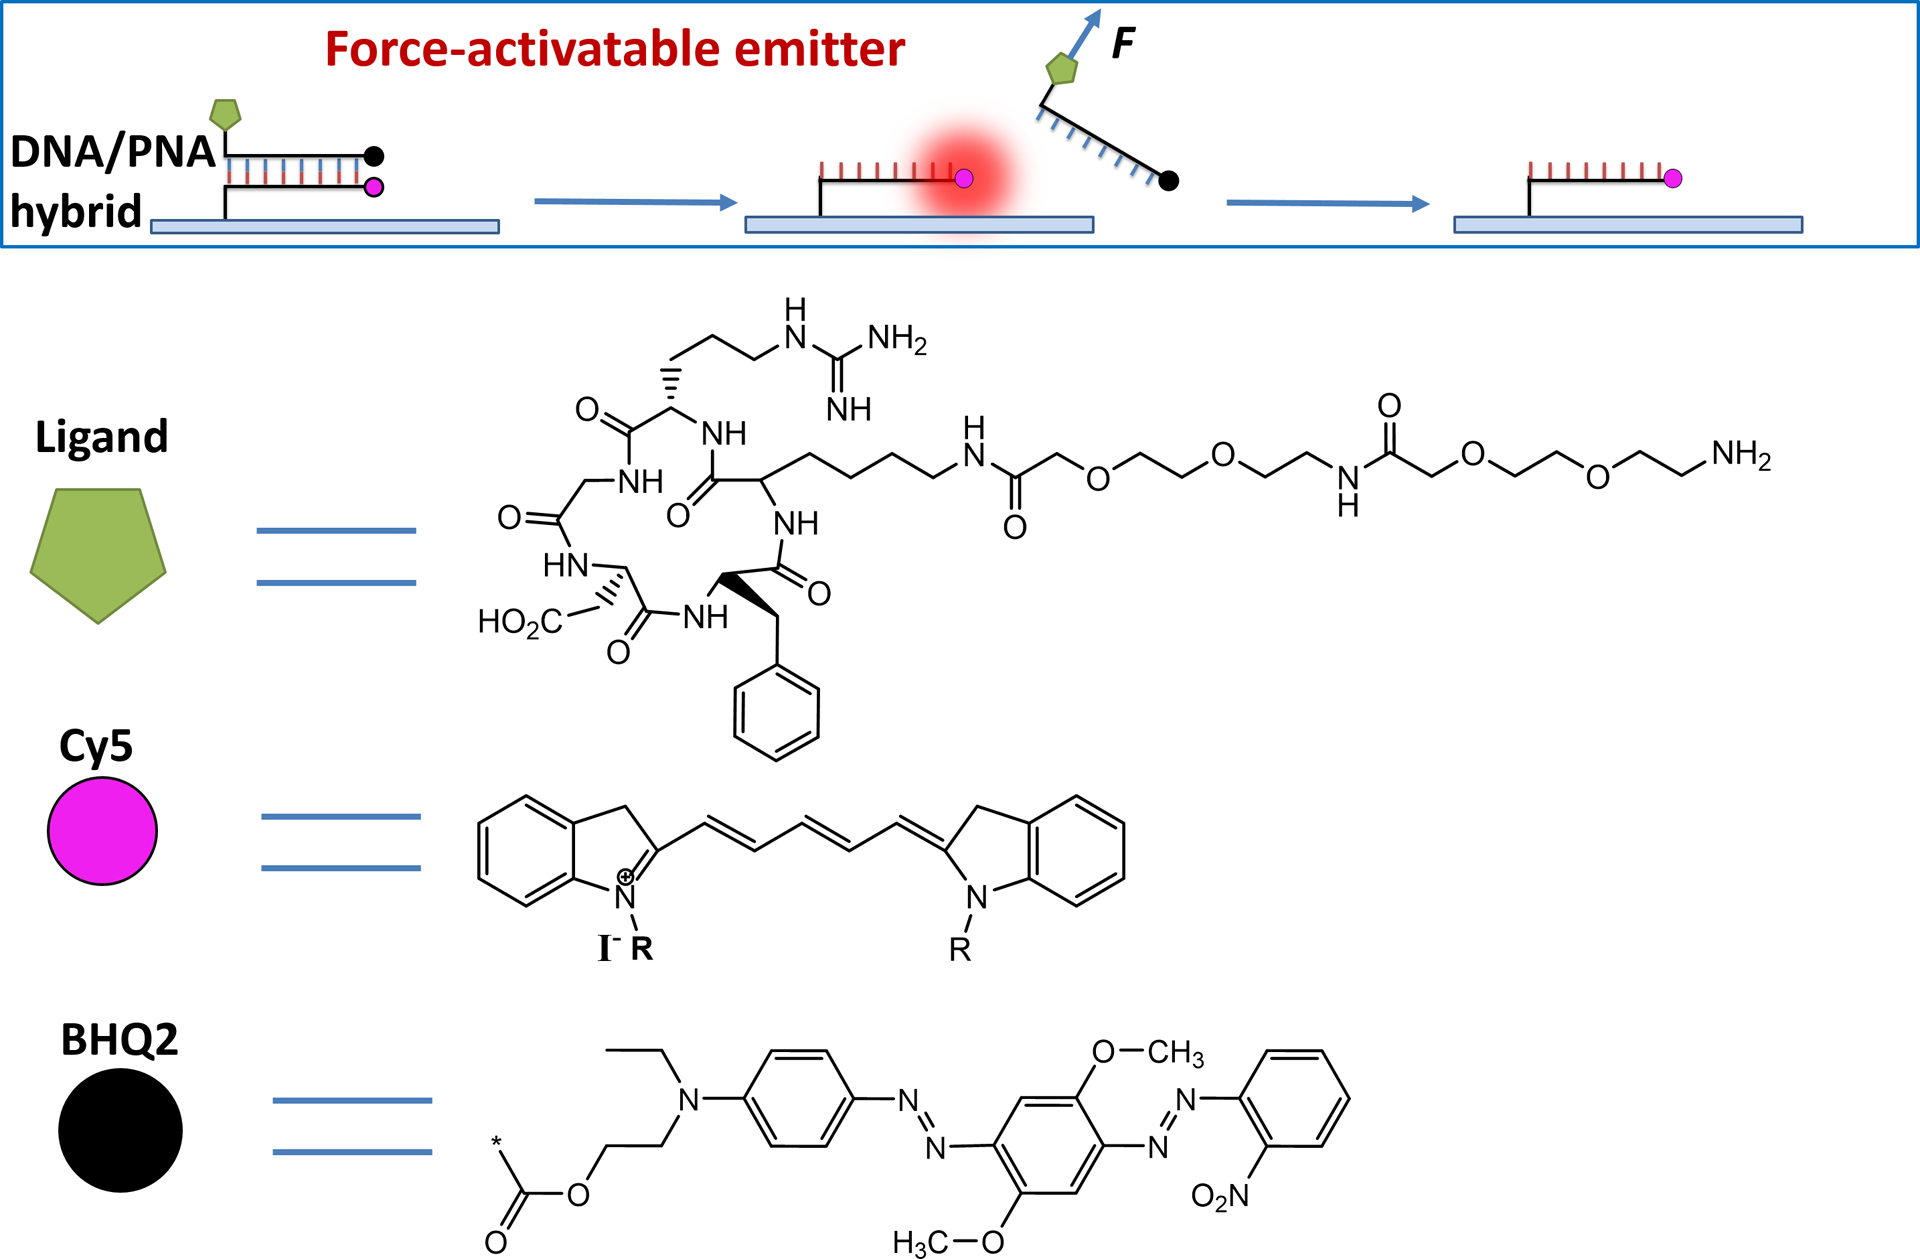
Schematics of force-activatable emitters.
During CFN imaging, the emitters are coated at a surface density >2000/μm2 (Fig. 1A, calibrated in fig. S2). On the emitter-coated surface, cells are plated and the integrin molecular tensions constituting cellular forces are continuously imaged by a TIRFM (total internal reflection fluorescence microscope). The initially dark emitters are switched on by local integrin tensions and imaged at the single molecule level. The activated emitters are switched off simply by photobleaching which naturally occurs during imaging and bleaches single Cy5s in 0.5–1 sec. Therefore, force-activatable emitters enable CFN by accomplishing the three standard steps in single molecule localization microscopy: Switch-on, imaging and switch-off (Fig. 1A). By imaging and localizing integrin molecular tensions in many frames, one achieves CFN by superposing tension locations in multiple frames to reconstruct cellular force images with high resolution (Fig 1A, fig. S3).
Fig. 1.
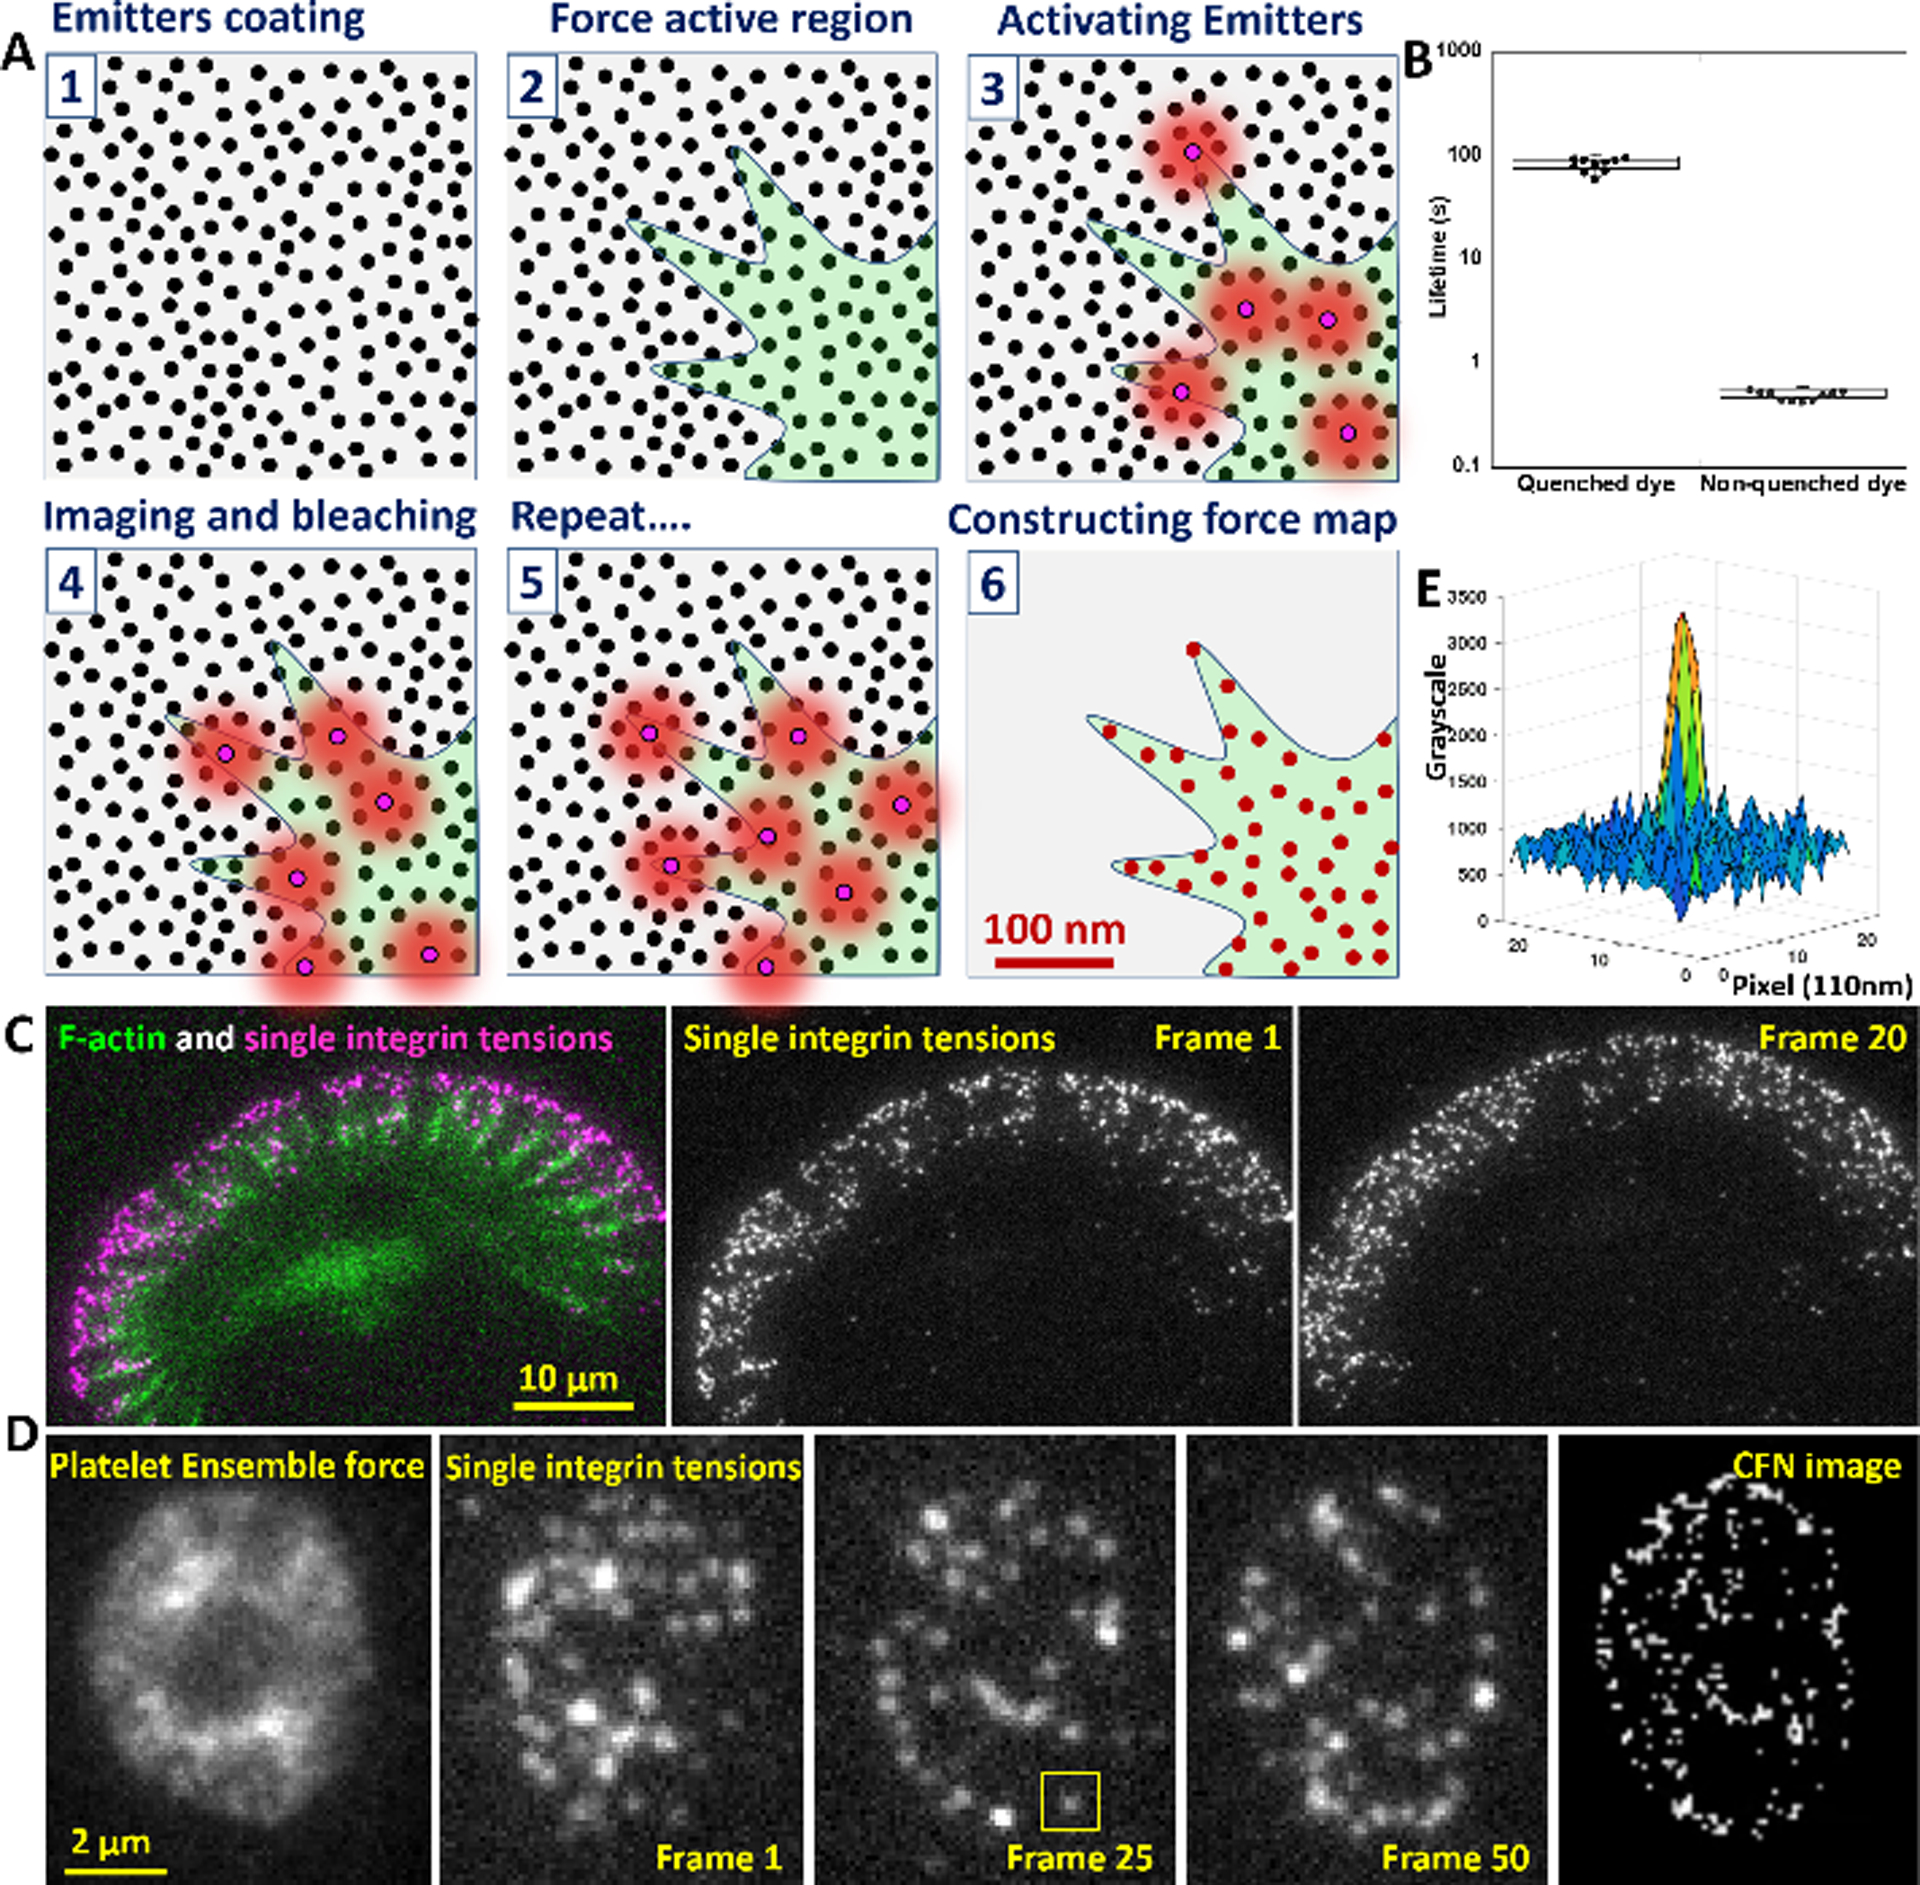
Principle of CFN and calibration of force-activatable emitter. (A) Emitters are coated on a surface at >2000/μm2 (step 1) to provide sufficient sampling density for cellular force (step 2). Emitters are sparsely switched on by local integrin tensions (step 3), imaged by a TIRFM and switched off by photobleaching (step 4). Multiple imaging cycles (step 5) and single molecule localization reconstructs a force map beyond the diffraction limit (Step 6). (B) The life time of Cy5 is extended by 120-fold in the proximity of a BHQ2 quencher, so that emitters prior to activation endure the switch-off process by photobleaching. (C) Demonstration of time-lapse imaging of integrin molecular tensions in a migrating keratocyte (Movie S1). (D) Ensemble force imaging and time-lapse imaging of integrin molecular tensions in a stationary platelet (Movie S3). (E) The grayscale map of an activated emitter (yellow squared region in Fig. 1D).
CFN becomes possible thanks to two previously unrecognized physics effects of a BHQ2-Cy5 pair. First, the BHQ2-Cy5 quenching efficiency in this emitter construct is >99.8% (calibrated in fig. S4), significantly higher than the previously known values calibrated with ensemble samples23. The strong quenching leads to low fluorescence background despite the high emitter surface density. Second, we found that a Cy5 near a BHQ2 becomes highly resistant to photobleaching, with its life time extended by 120-fold (Fig. 1B, fig. S5), likely because a BHQ2 absorbs the excitation light for Cy5, not the emission light from Cy5, therefore protecting Cy5 in the non-activated emitters from photobleaching during switch-off process.
We applied CFN to three distinct cell types: anucleate platelets, migratory keratocytes and stationary HeLa cells. In Fig. 1C and Movie S1, a keratocyte produced individual Cy5 fluorescent spots in a good density, showing an optimal switch-on rate. Photobleaching step analysis shows that >80% fluorescent spots are single Cy5s (fig. S6). The co-imaged F-actin is spatially correlated with Cy5 spots, suggesting that the emitters are likely switched on by cellular force originating from F-actin. To further confirm that the emitters were activated by integrin tensions, keratocytes were tested on emitters without integrin ligands that showed no emitter switch-on. (fig. S7 and Movie S2).
In Fig. 1D, 100 imaging frames of integrin molecular tensions were continuously acquired in a platelet. By localizing integrin tensions in each frame and superposing 20 frames into one, we obtained CFN images of the platelet (Movie S3). Compared to the rather homogeneous ensemble force image (Fig. 1D), CFN imaging resolved the inhomogeneity in the platelet force map.
We analyzed the precision of tension localization based on an activated emitter in Fig. 1D that was selected and displayed in Fig. 1E. The emitter image shows 11.3 signal-to-noise ratio (SNR) defined as the ratio between the peak fluorescence intensity of a dye in pixels and the standard deviation of the background noise. This leads to σ = 7.3 nm precision of single molecule localization (refer to supplementary text), and theoretic spatial resolution of 2.35σ = 17 nm for CFN.
Using CFN, we explored the ultra-fine force patterns in lamellipodia and FAs. In Fig. 2, integrin molecular tensions and F-actin dynamics of a migrating keratocyte were co-imaged with 100 frames across 50 seconds in real time (Fig. 2A, Movie S4). Integrin molecular tensions in all frames were localized and superposed to a CFN movie (20 frames per CFN image) (Fig. 2A). In the CFN movie, the force pattern under the lamellipodium consists of two distinct regions, with discrete radial streaks under the cell body, and a smooth and narrow line at the very cell front. Integrin tensions in streaks, colocalized with F-actin, are likely generated by actomyosin which is one of major force sources for integrin tensions24. We speculate that the integrin tensions in the front line are counteracting force supporting actin polymerization that pushes cell boundary forward at the leading edge. To verify above hypothesis, we inhibited actomyosin and actin polymerization with blebbistatin and cytochalasin D, respectively (Fig. 2B, Movies S5 and S6). Inhibiting actomyosin abolished integrin tensions in streaks, but not those in the front line. Oppositely, inhibiting actin polymerization abolished integrin tensions in the front line, but not those in streaks (Fig. 2C). These results suggest that integrins in the cell leading edge are under tension to support local actin polymerization. Their distribution is consistently narrow and can down to 50 nm (shown later in Fig. 4B), suggesting an ultrashort force transmission range from the cell front to local integrins.
Fig. 2.
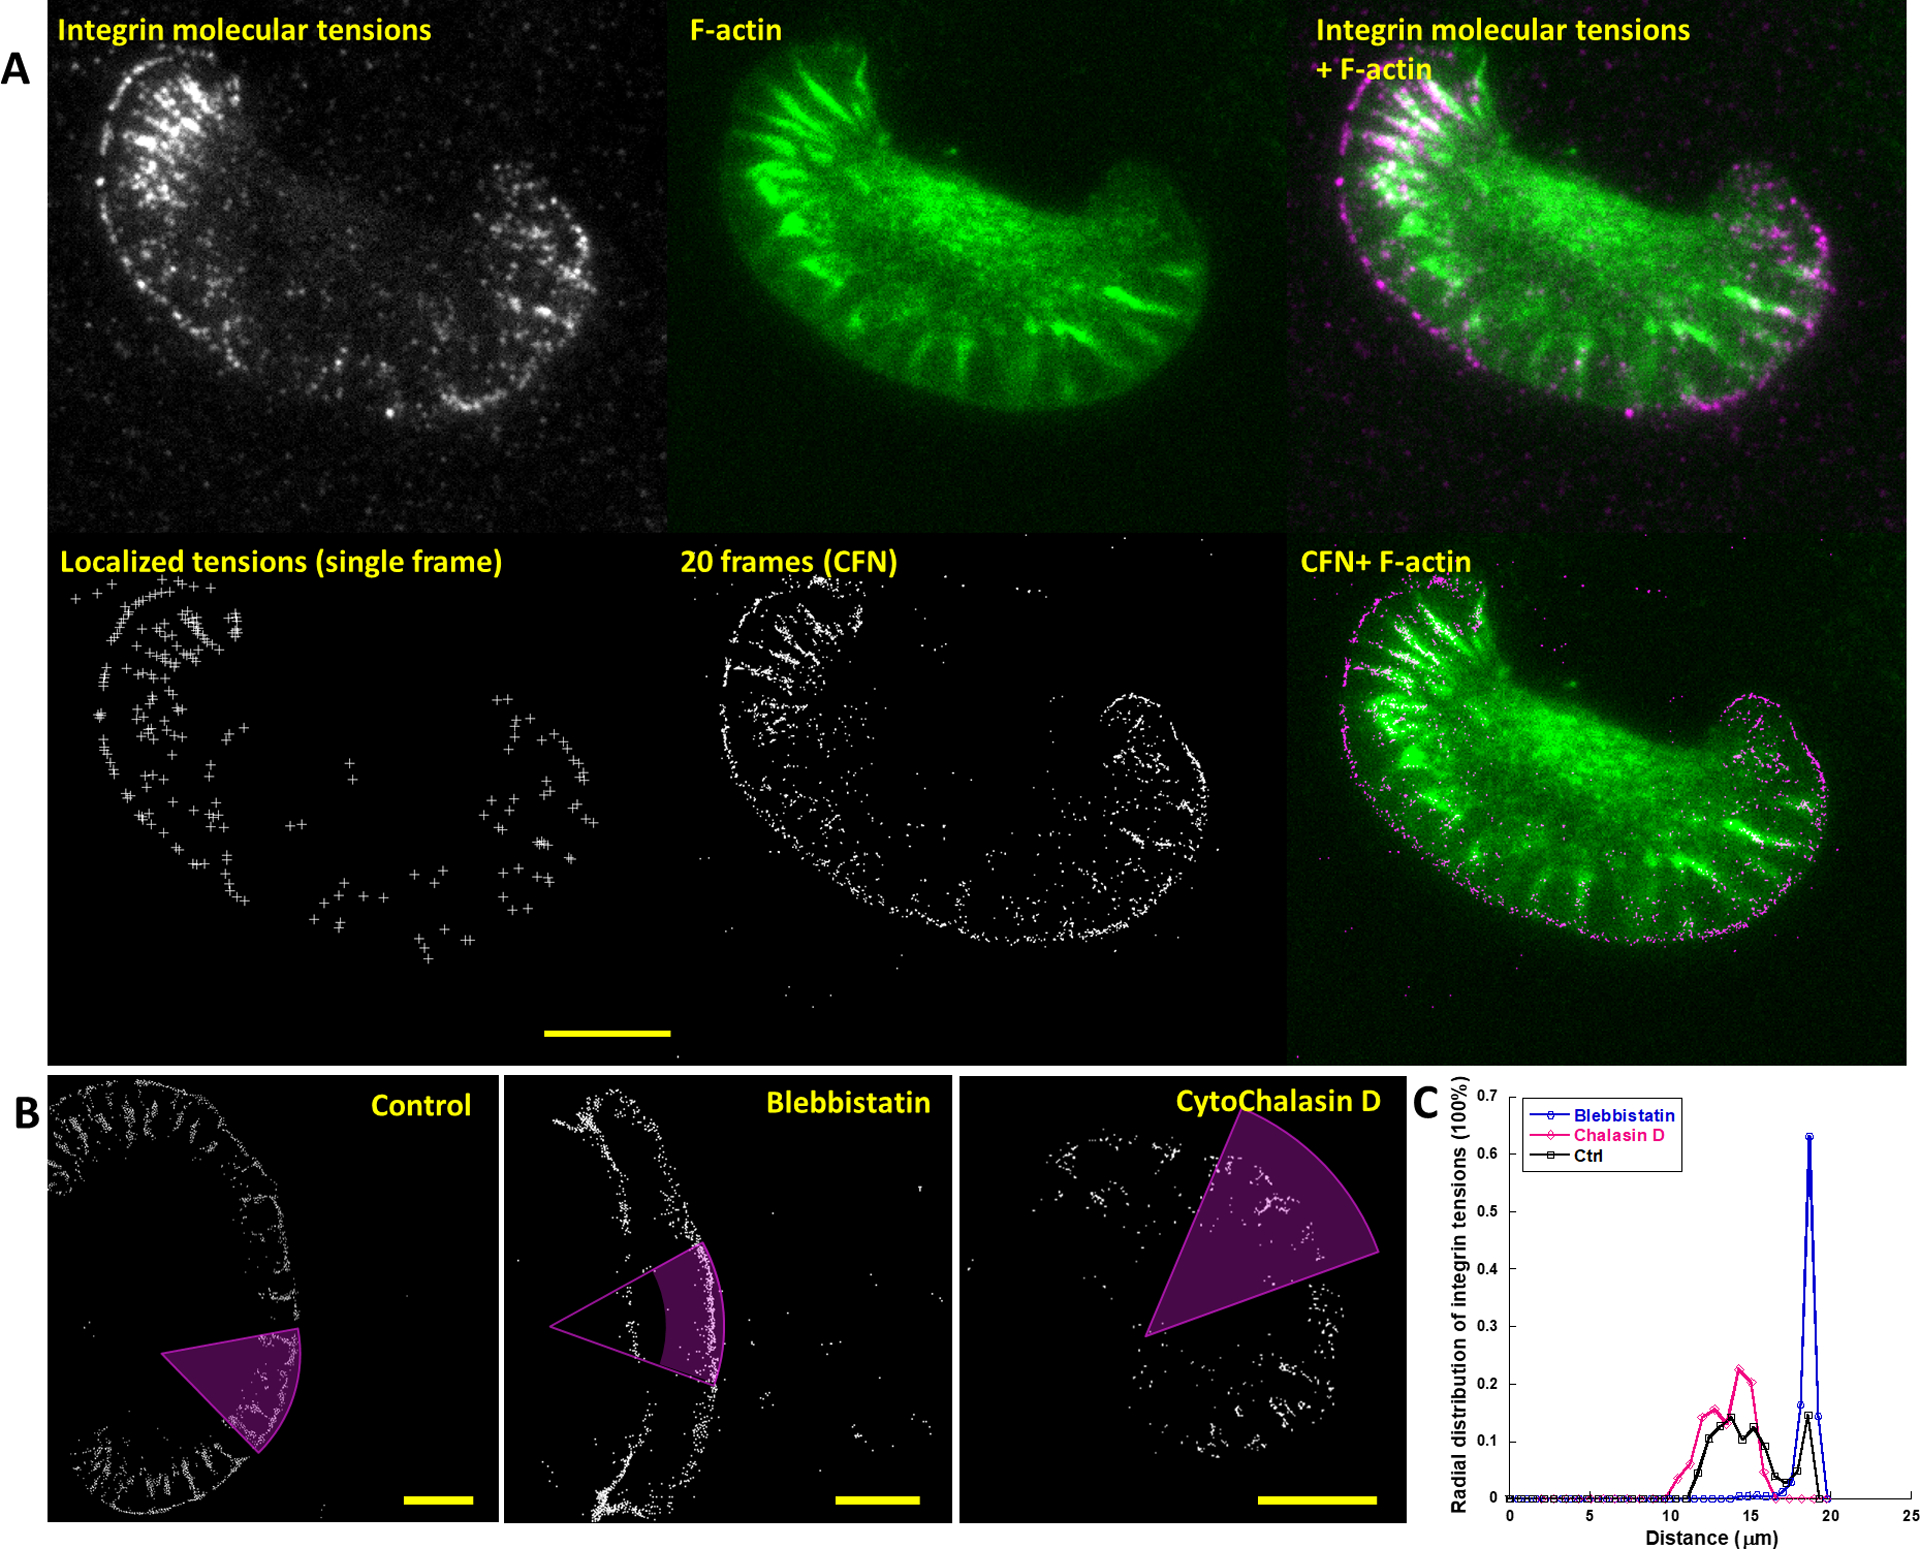
CFN imaging of integrin tensions under a lamellipodium in migrating keratocytes. (A) Single integrin tensions and F-actin were co-imaged (Movie S4). Molecular tensions were localized in each frame (lower left). Every 20 analyzed frames were superposed to a CFN image (lower middle), and merged with F-actin to show the force-structure relation at high resolution. The force pattern consists of a front-line region and streak regions co-localized with F-actin. (B) CFN images of keratocytes treated with: DMSO as control (left), 20 μM blebbistatin inhibiting myosin II and cytochalasin D inhibiting actin polymerization (Movies S5–S6). (C) Force distribution over the distance to the circular center of the magenta areas. Scale bar: 10 μm.
Fig. 4.
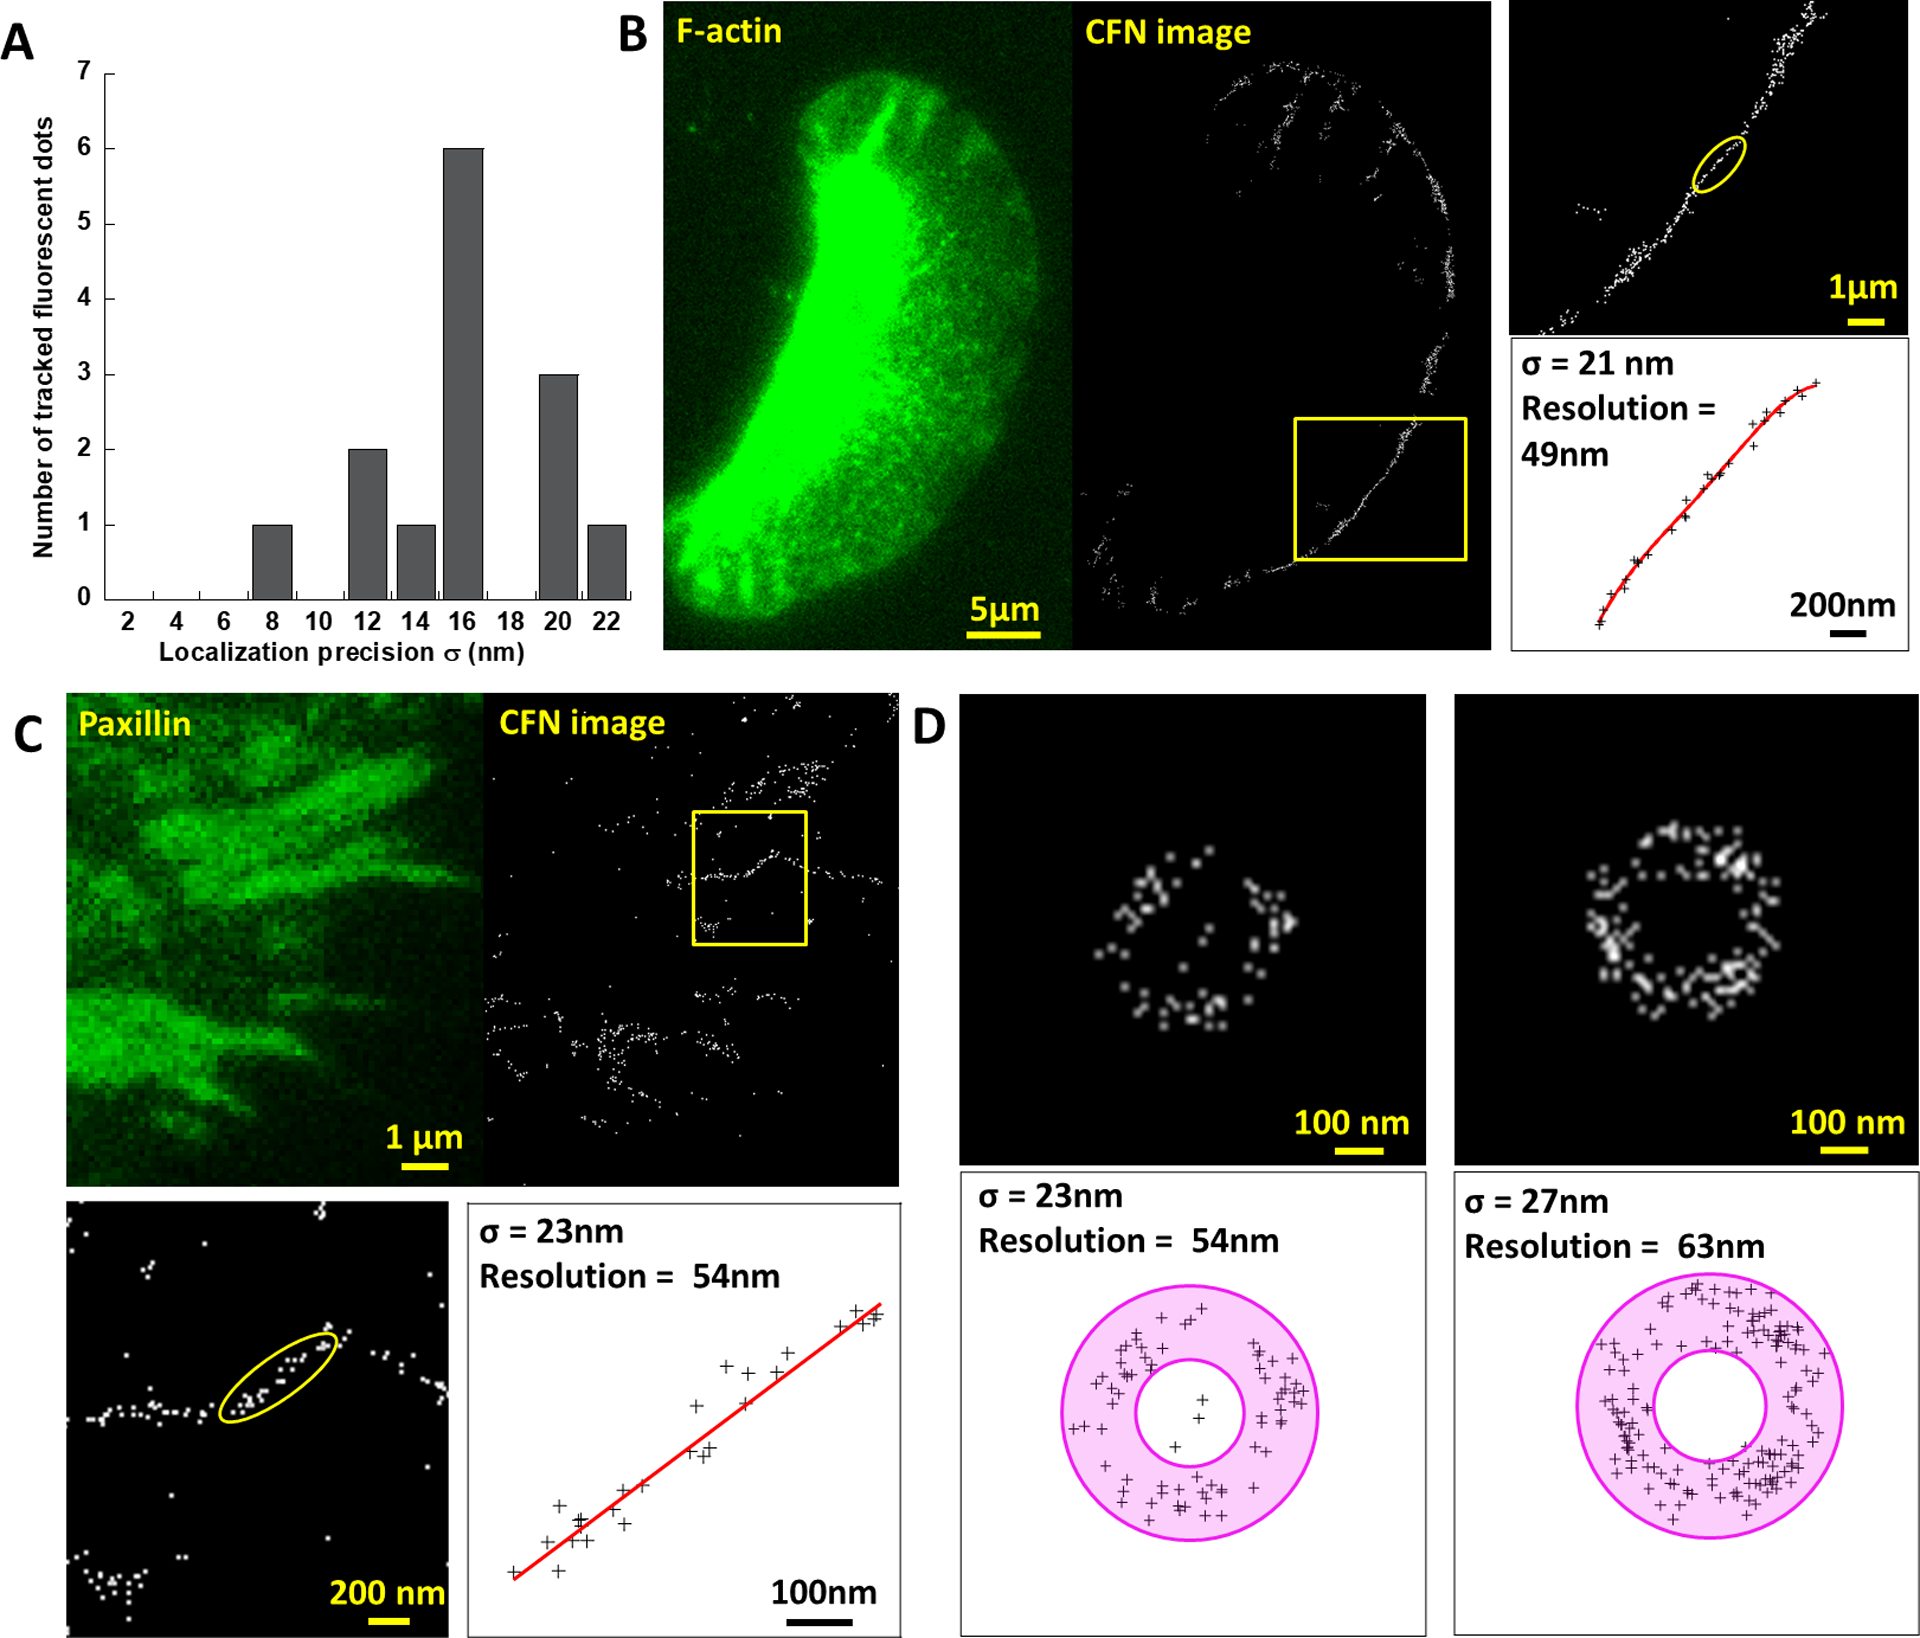
Calibration of CFN Resolution. (A) Single emitter tracking analysis yields 16±4 nm precision in localizing activated emitters. (B) 49 nm spatial resolution of CFN was calibrated on the basis of the ultra-narrow force distribution (yellow boxed) in a migration-impeded keratocyte (Movie S8). (C) 54 nm resolution of CFN was calibrated on an ultra-thin force pattern in a FA (Movie S9). (D) 50–60 nm resolution was calibrated on the basis of integrin tensions in circular patterns. σ was evaluated as the standard deviation of the distances of spots to the circle center.
Next, we applied CFN to study integrin tensions in FAs. Fig.3A shows a typical process of CFN imaging over FAs, co-imaged with integrin β3 marking FAs (Movie S7). The integrin tensions were consistently situated within FAs. Compared to the ensemble force images (fig. S8), CFN images of FAs showed that integrin tensions are not homogeneously distributed in FAs. In motile FAs, integrin tensions are preferentially situated at the leading regions of FAs (Fig. 3B and 3C), suggesting that cellular force is off-centered in FAs. We then analyzed the width of force distribution in FAs and found that it generally matches the structural width of FAs if the structural width is above 1 μm. Below 1 μm, however, integrin tensions could cluster in a thin line narrower than the FA width (Fig. 3D–3F), suggesting that FAs have mechanism to concentrate integrin tensions to a much narrower region.
Fig. 3.
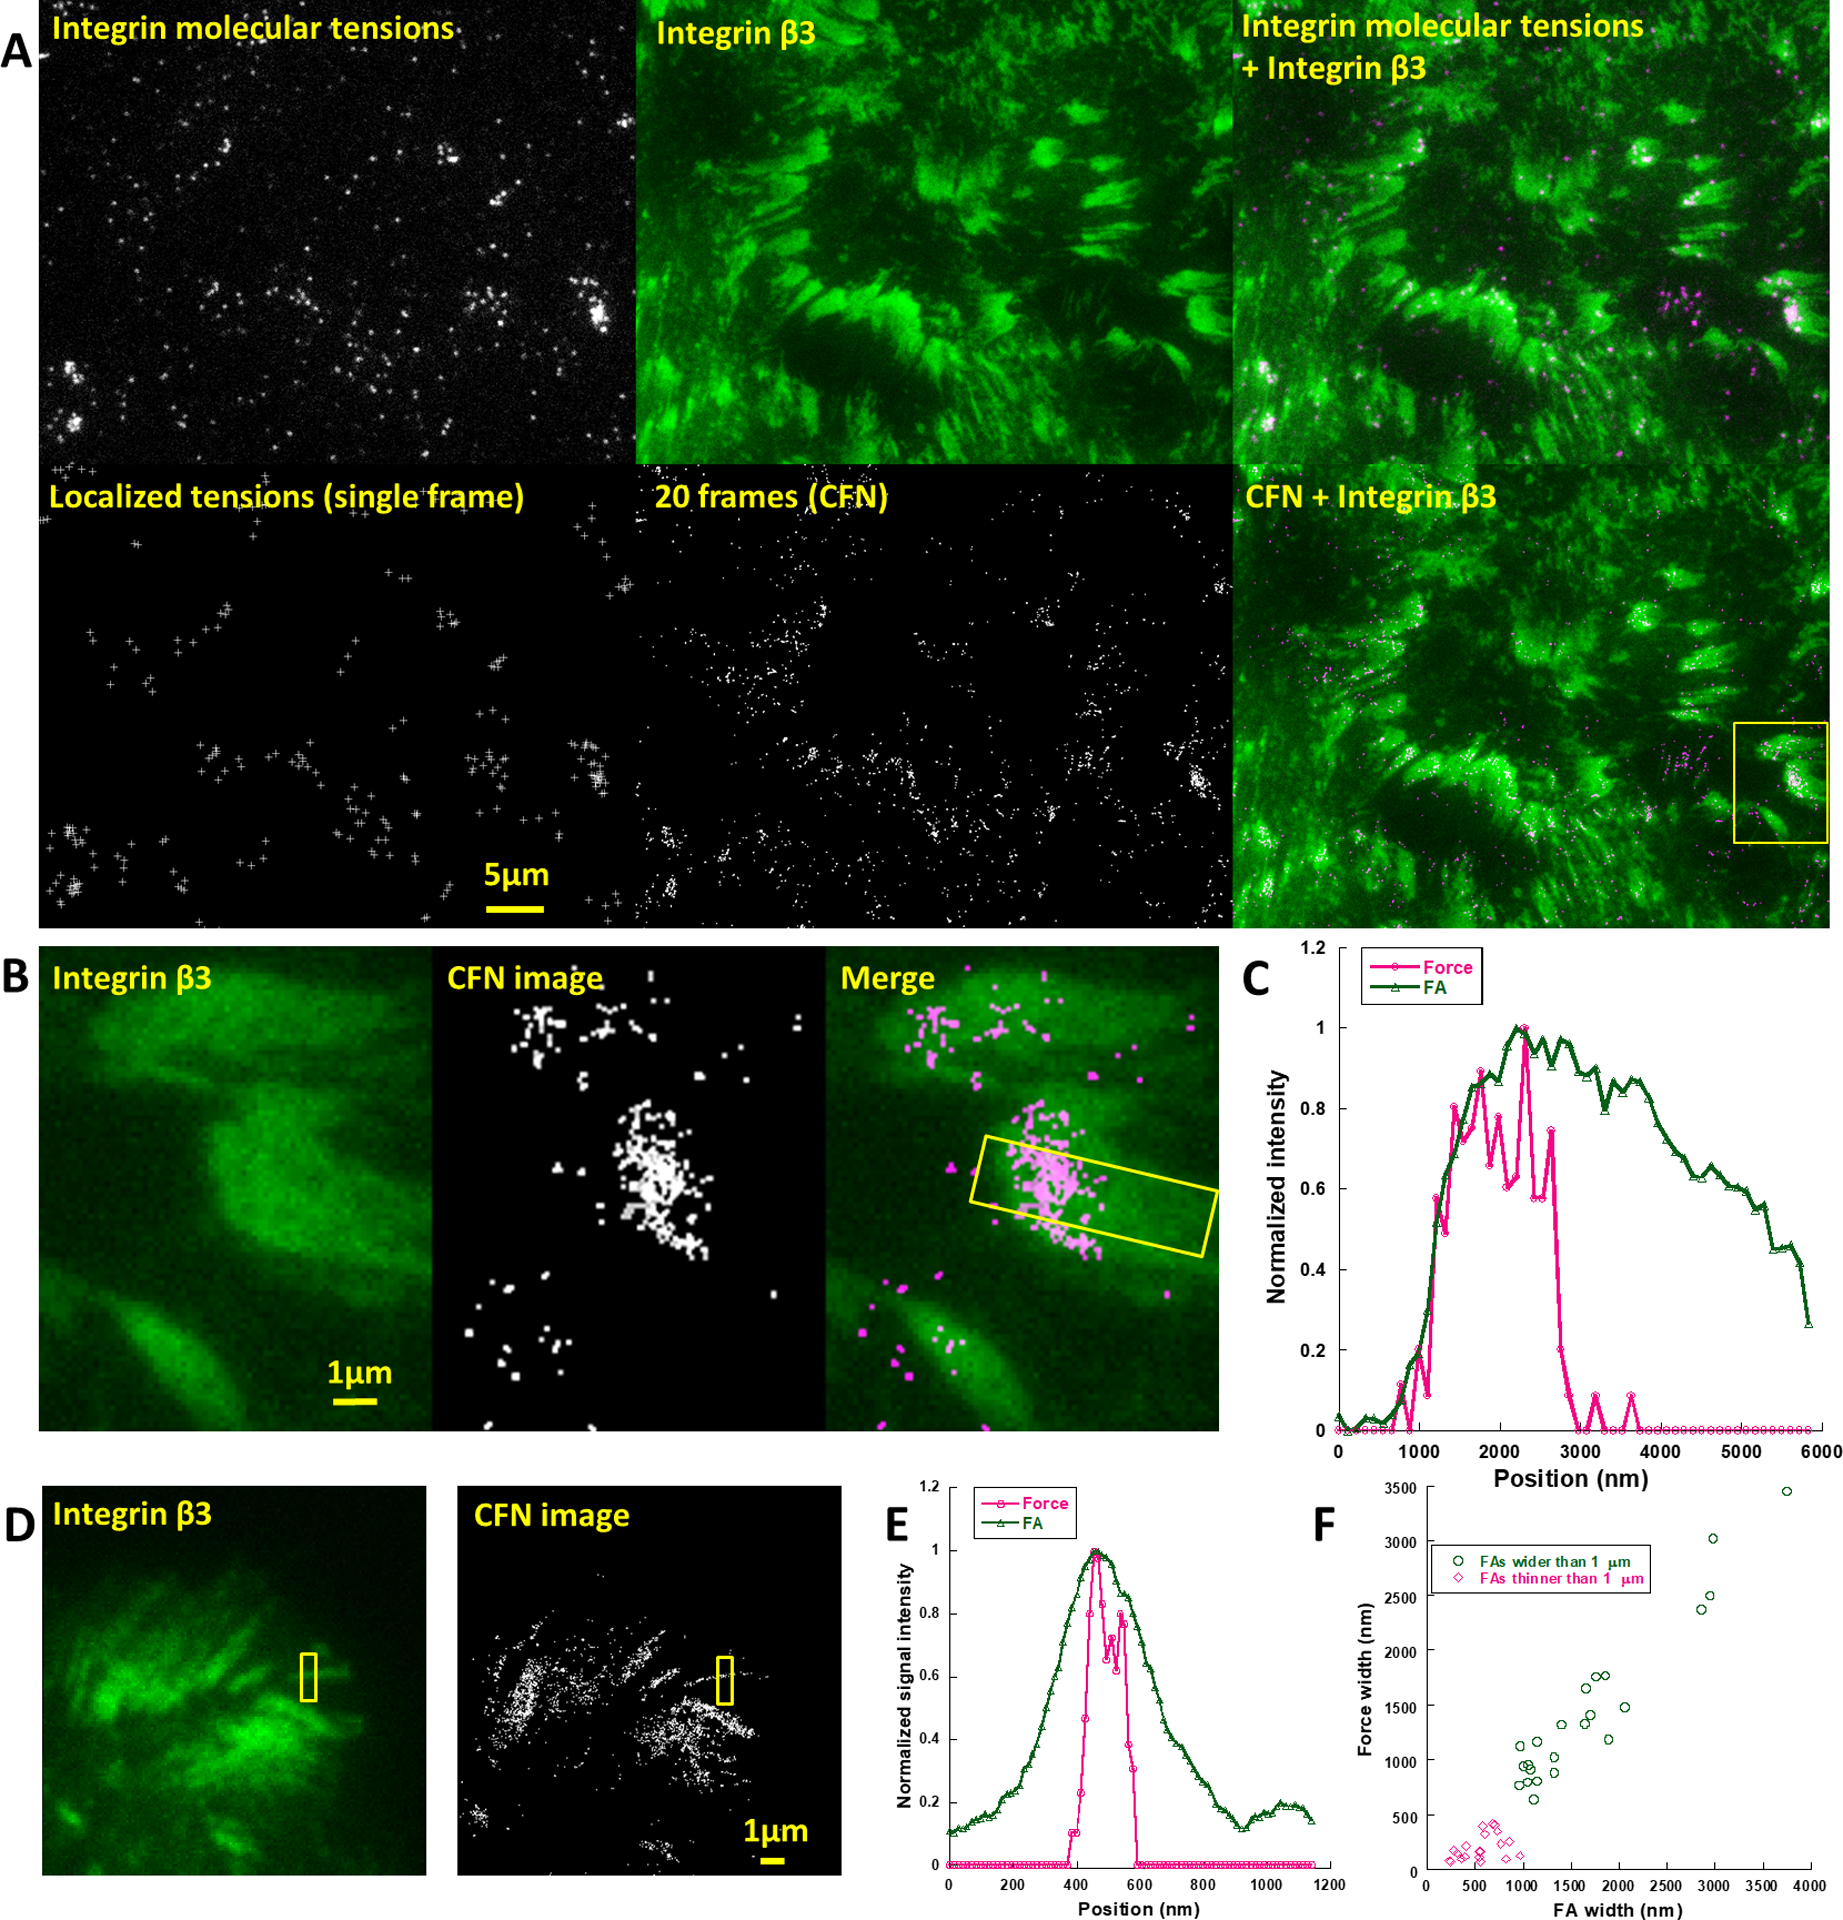
CFN images of force in focal adhesions. (A) Co-imaging of integrin molecular tensions and GFP-fused integrin β3 (Movie S7). (B) CFN image based on 20 frames (2 min) in a focal adhesion moving towards left. (C) Normalized curves of force and integrin distributions in the boxed region in (B) along longitudinal direction. (D) CFN images based on 100 frames (10 min) in FAs. (E) Lateral width analysis of the FA and force distribution in the boxed region in (D). (F) The lateral widths of FA and Force distribution in individual FAs.
At last, we evaluated the practical spatial resolution of CFN. First, we calibrated the precision of single molecule localization by tracking single surface-immobilized Cy5s across multiple frames and obtained ~16 nm precision σ (Fig. 4A, fig. S9). The spatial resolution of CFN is therefore predicted as 2.35σ = 38nm. Next, we evaluated the practical spatial resolution of CFN by calibrating ultra-fine force patterns produced by cells. In Movie S8, the keratocyte generated integrin tensions in the front line with a standard deviation σ = 21nm of the tension locations to a fitted curve (Fig. 4B), indicating that the spatial resolution of force imaging is finer than 2.35σ = 49nm. In HeLa cells, we constantly obtained integrin tensions situated in thin lines in narrow FAs (Movie S9), with 20~30 nm σ to the fitted lines, suggesting that the spatial resolution of CFN reaches 50 nm (Fig. 4C). In addition, we also observed some unique ring-shaped force patterns with a diameter of 200–300 nm out of FAs in HeLa cells (Fig. 4D). These forces may be produced by nascent FAs or endocytosis25. Although the source and mechanism of this type of forces await further investigation, we made use of these force patterns to calibrate the spatial resolution of CFN and obtained values around 50 nm (Fig. 4D).
In summary, we developed low-background force-activatable emitter to image single integrin tensions in live cells in real time. Based on molecular tension localization enabled by this emitter, we developed CFN for cellular force imaging in live cells with 50 nm resolution. CFN has been demonstrated to be a powerful and convenient tool that enables the study of cellular forces at nanoscale in live cells, bridging the resolution gap between cell structural imaging and cellular force imaging, and creating new possibilities for the study of cell mechanobiology.
Supplementary Material
ACKNOWLEDGMENT
We thank Dr. D. Levine for providing platelet samples. We appreciate the public availability of the single molecule localization code offered by X. Zhuang’s group.
Funding Sources
This work was supported by National Institute of General Medical Sciences (1R35GM128747) and National Science Foundation (1825724).
Footnotes
Supporting Information.
The authors declare no competing financial interest.
REFERENCES
- 1.Harburger DS; Calderwood DA, Integrin signalling at a glance. J Cell Sci 2009, 122 (2), 159–163. [DOI] [PMC free article] [PubMed] [Google Scholar]
- 2.Vogel V; Sheetz M, Local force and geometry sensing regulate cell functions. Nat Rev Mol Cell Biol 2006, 7 (4), 265–75. [DOI] [PubMed] [Google Scholar]
- 3.Wang JH; Thampatty BP, An introductory review of cell mechanobiology. Biomech Model Mechanobiol 2006, 5 (1), 1–16. [DOI] [PubMed] [Google Scholar]
- 4.Brugues A; Anon E; Conte V; Veldhuis JH; Gupta M; Colombelli J; Munoz JJ; Brodland GW; Ladoux B; Trepat X, Forces driving epithelial wound healing. Nat Phys 2014, 10 (9), 683–690. [DOI] [PMC free article] [PubMed] [Google Scholar]
- 5.Kumar S; Weaver VM, Mechanics, malignancy, and metastasis: the force journey of a tumor cell. Cancer Metastasis Rev 2009, 28 (1–2), 113–27. [DOI] [PMC free article] [PubMed] [Google Scholar]
- 6.Kanchanawong P; Shtengel G; Pasapera AM; Ramko EB; Davidson MW; Hess HF; Waterman CM, Nanoscale architecture of integrin-based cell adhesions. Nature 2010, 468 (7323), 580–4. [DOI] [PMC free article] [PubMed] [Google Scholar]
- 7.van den Dries K; Schwartz SL; Byars J; Meddens MB; Bolomini-Vittori M; Lidke DS; Figdor CG; Lidke KA; Cambi A, Dual-color superresolution microscopy reveals nanoscale organization of mechanosensory podosomes. Mol Biol Cell 2013, 24 (13), 2112–23. [DOI] [PMC free article] [PubMed] [Google Scholar]
- 8.Patla I; Volberg T; Elad N; Hirschfeld-Warneken V; Grashoff C; Fassler R; Spatz JP; Geiger B; Medalia O, Dissecting the molecular architecture of integrin adhesion sites by cryo-electron tomography. Nat Cell Biol 2010, 12 (9), 909–15. [DOI] [PubMed] [Google Scholar]
- 9.Rossier O; Octeau V; Sibarita JB; Leduc C; Tessier B; Nair D; Gatterdam V; Destaing O; Albiges-Rizo C; Tampe R; Cognet L; Choquet D; Lounis B; Giannone G, Integrins beta1 and beta3 exhibit distinct dynamic nanoscale organizations inside focal adhesions. Nat Cell Biol 2012, 14 (10), 1057–67. [DOI] [PubMed] [Google Scholar]
- 10.Polacheck WJ; Chen CS, Measuring cell-generated forces: a guide to the available tools. Nature Methods 2016, 13 (5), 415–423. [DOI] [PMC free article] [PubMed] [Google Scholar]
- 11.Morimatsu M; Mekhdjian AH; Adhikari AS; Dunn AR, Molecular Tension Sensors Report Forces Generated by Single Integrin Molecules in Living Cells. Nano Lett 2013, 13 (9), 3985–3989. [DOI] [PMC free article] [PubMed] [Google Scholar]
- 12.Wang X; Ha T, Defining single molecular forces required to activate integrin and notch signaling. Science 2013, 340 (6135), 991–4. [DOI] [PMC free article] [PubMed] [Google Scholar]
- 13.Zhang Y; Ge C; Zhu C; Salaita K, DNA-based digital tension probes reveal integrin forces during early cell adhesion. Nat Commun 2014, 5, 5167. [DOI] [PMC free article] [PubMed] [Google Scholar]
- 14.Blakely BL; Dumelin CE; Trappmann B; McGregor LM; Choi CK; Anthony PC; Duesterberg VK; Baker BM; Block SM; Liu DR; Chen CS, A DNA-based molecular probe for optically reporting cellular traction forces. Nat Methods 2014, 11 (12), 1229–32. [DOI] [PMC free article] [PubMed] [Google Scholar]
- 15.Wang YL; LeVine DN; Gannon M; Zhao YC; Sarkar A; Hoch B; Wang XF, Force-activatable biosensor enables single platelet force mapping directly by fluorescence imaging. Biosens Bioelectron 2018, 100, 192–200. [DOI] [PMC free article] [PubMed] [Google Scholar]
- 16.Rust MJ; Bates M; Zhuang X, Sub-diffraction-limit imaging by stochastic optical reconstruction microscopy (STORM). Nat Methods 2006, 3 (10), 793–5. [DOI] [PMC free article] [PubMed] [Google Scholar]
- 17.Betzig E; Patterson GH; Sougrat R; Lindwasser OW; Olenych S; Bonifacino JS; Davidson MW; Lippincott-Schwartz J; Hess HF, Imaging intracellular fluorescent proteins at nanometer resolution. Science 2006, 313 (5793), 1642–1645. [DOI] [PubMed] [Google Scholar]
- 18.Nielsen PE; Egholm M; Buchardt O, Peptide nucleic acid (PNA). A DNA mimic with a peptide backbone. Bioconjug Chem 1994, 5 (1), 3–7. [DOI] [PubMed] [Google Scholar]
- 19.Ruoslahti E, RGD and other recognition sequences for integrins. Annu Rev Cell Dev Biol 1996, 12, 697–715. [DOI] [PubMed] [Google Scholar]
- 20.Campbell ID; Humphries MJ, Integrin structure, activation, and interactions. Cold Spring Harb Perspect Biol 2011, 3 (3), . [DOI] [PMC free article] [PubMed] [Google Scholar]
- 21.Dean DA, Peptide nucleic acids: versatile tools for gene therapy strategies. Adv Drug Deliv Rev 2000, 44 (2–3), 81–95. [DOI] [PMC free article] [PubMed] [Google Scholar]
- 22.Hwang H; Myong S, Protein induced fluorescence enhancement (PIFE) for probing protein-nucleic acid interactions. Chem Soc Rev 2014, 43 (4), 1221–1229. [DOI] [PMC free article] [PubMed] [Google Scholar]
- 23.Marras SA; Kramer FR; Tyagi S, Efficiencies of fluorescence resonance energy transfer and contact-mediated quenching in oligonucleotide probes. Nucleic Acids Res 2002, 30 (21), e122. [DOI] [PMC free article] [PubMed] [Google Scholar]
- 24.Murrell M; Oakes PW; Lenz M; Gardel ML, Forcing cells into shape: the mechanics of actomyosin contractility. Nat Rev Mol Cell Bio 2015, 16 (8), 486–498. [DOI] [PMC free article] [PubMed] [Google Scholar]
- 25.Paul NR; Jacquemet G; Caswell PT, Endocytic Trafficking of Integrins in Cell Migration. Curr Biol 2015, 25 (22), R1092–105. [DOI] [PubMed] [Google Scholar]
Associated Data
This section collects any data citations, data availability statements, or supplementary materials included in this article.