

SUMMARY
Deficient DNA mismatch repair (dMMR) induces a hypermutator phenotype that can lead to tumorigenesis; however, the functional impact of the high mutation burden resulting from this phenotype remains poorly explored. Here, we demonstrate that dMMR-induced destabilizing mutations lead to proteome instability in dMMR tumors, resulting in an abundance of misfolded protein aggregates. To compensate, dMMR cells utilize a Nedd8-mediated degradation pathway to facilitate clearance of misfolded proteins. Blockade of this Nedd8 clearance pathway with MLN4924 causes accumulation of misfolded protein aggregates, ultimately inducing immunogenic cell death in dMMR cancer cells. To leverage this immunogenic cell death, we combined MLN4924 treatment with PD1 inhibition and found the combination was synergistic, significantly improving efficacy over either treatment alone.
eTOC Blurb
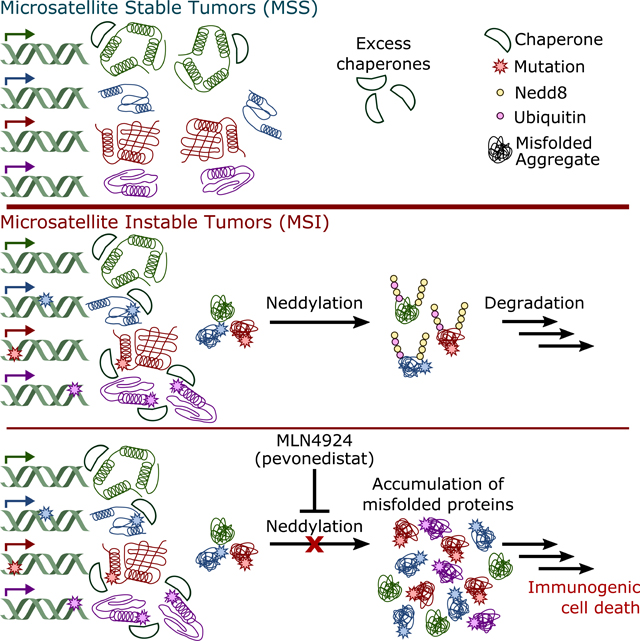
McGrail et. al. find that the abundance of destabilizing mutations in microsatellite instable (MSI) tumors causes proteome instability and accumulation of misfolded proteins. To compensate, MSI tumors rely on a Nedd8-mediated pathway to clear misfolded aggregates, which can be therapeutically targeted by MLN4924.
Graphical Abstract
INTRODUCTION
The creation of single base mismatches and short insertions and deletions (indels) of between 1–4 bases is common during DNA replication and is normally repaired via the DNA mismatch repair (MMR) pathway (Kunkel and Erie, 2005). Deficient DNA mismatch repair (dMMR) may be caused by germline or somatic mutations in mismatch repair genes (MLH1, MSH2, MSH3, MSH6, and PMS2), or through epigenetic silencing of MLH1 (Vilar and Gruber, 2010). Loss of MMR function induces a hypermutator phenotype, identified clinically by a genomic scar known as microsatellite instability (MSI). In 1997, the National Cancer Institute recommended a standardized panel of five microsatellite loci (the Bethesda Panel) to determine patient MSI status, which has since been expanded to include seven loci. Typically, patients displaying instability in more than 40% of microsatellites are categorized as MSI-high (MSI-H) or MSI. Patients with no markers are categorized as microsatellite stable (MSS), and those between MSI-high and MSS are categorized as MSI-low. It is uncertain if MSI-low patients represent a distinct physiological phenotype, though it appears those deemed MSI-low are most likely misclassified MSS patients (Murphy et al., 2006).
In the largest study to date, consisting of 11,080 patients across 39 cancer types, next generation sequencing identified MSI in 12 cancer types at a frequency of ≥1% of patients. The highest MSI prevalence was found in endometrial cancer (31.4%), followed by colorectal (19.7%) and gastric cancers (19.1%) (Bonneville et al., 2017). This is consistent with previous studies utilizing PCR-based approaches demonstrating MSI in approximately 30% of endometrial cancers (Getz et al., 2013), 15% of colorectal cancers (Muzny et al., 2012), and 20% of gastric cancers (Bass et al., 2014). Meta-analyses of early patient cohorts have previously suggested that MSI corresponds with a better prognosis for colorectal (cohorts from 1999–2009, median year 2005) (Guastadisegni et al., 2010) and gastric cancers (cohorts from 1998–2012, median year 2002) (Choi et al., 2014). Prognoses for MSI endometrial cancer patients were intermediate and similar to those of endometrioid patients, who fall between POLE mutant patients, who have the best prognoses, and serous-like tumors patients, who have the worst prognoses (Getz et al., 2013). However, more recent trials have failed to detect this difference in colorectal cancer, which may be due to advancing chemotherapeutic regimens that have improved outcomes in MSS patients (De La Chapelle and Hampel, 2010). Additionally, these studies indicated that MSI patients exhibit intrinsic resistance to chemotherapeutics, ultimately limiting patients’ therapeutic options and hindering their long-term survival (De La Chapelle and Hampel, 2010).
The recent emergence of immunotherapy has offered a new opportunity for the treatment of patients with MSI tumors. The dMMR/MSI hypermutator phenotype is thought to produce large numbers of immunogenic neoantigens that can be recognized by immune cells, leading to the approval of MSI status as a clinical biomarker for checkpoint immunotherapy, independent of tumor lineage. Although patients who benefit from immunotherapy often have robust, highly durable responses, more than 60% of patients with MSI tumors fail to respond to therapy with immune checkpoint blockade (ICB) (Lemery et al., 2017). Here, we sought to find alternative therapeutic vulnerabilities for dMMR/MSI patients to fully leverage this hypermutator phenotype and improve patient outcomes.
RESULTS
Gene-signature guided approaches identify MLN4924 as a novel therapeutic target in MSI cancers.
To directly analyze phenotypes associated with dMMR, we generated multiple isogenic model cell lines. First, we created individual, stable, isogeneic knock-down cell lines in the MMR intact KLE endometrial cancer cell line for each of four genes (MSH2MSH3, MSH6, or MLH1) that are essential for MMR using lentiviral short hairpin RNAs (shRNAs). Second, we deleted MSH2 from non-malignant MCF-10A cells using CRISPR, and finally, we re-expressed MLH1 in the dMMR colorectal cancer cell line HCT-116. Loss of protein expression was confirmed by western blot (Figure SIA), and functional MMR deficiency was confirmed using an in vitro repair assay (Figure SIB).
To generate a transcriptional signature representative of dMMR, we overlapped differentially expressed RNAs from isogenic cell line models with differentially expressed RNAs in MSI colorectal (COAD) and endometrial (UCEC) cancer cases from The Cancer Genome Atlas (TCGA) (Figure 1A, Table S1), considering only MSI-H cases as MSI. The resulting dMMR gene expression signature accurately predicted MSI status in independent testing sets of endometrial and colorectal cancer cases, as well as cases with gastric cancer (STAD) for an independent tumor lineage and in cancer cell lines (Figure 1B). Tumor lineages with lower MSI frequencies were pooled together, and our signature also showed good predictive accuracy in these patients (Figure S2A). Further analysis of the colorectal cohort indicated that most false-positive patients, that is MSS patients incorrectly classified as MSI, belonged to the consensus molecular subtype 1 (CMS1, Figure S2B), which is enriched for MSI patients and predicts worse survival upon relapse (Guinney et al., 2015).
Figure 1. Signature-guided therapy of mismatch repair deficient tumors.

(A) A mismatch repair deficiency gene expression signature was derived from the intersection between differentially expressed genes from isogenic cell lines with genetically induced dMMR and differentially expressed genes between MSS and MSI colorectal (COAD) and endometrial (UCEC) cancer cases from TCGA.
(B) Gene signature validation in an independent group of COAD and UCEC cancer cases, as well as independent gastric cancer cases (STAD), and pooled analysis of cell lines from all lineages.
(C) Prediction of drug responsiveness by dMMR gene epression signature in dMMR colorectal and endometrial cancer cell lines, where negative values indicate increased predicted sensitivity. Cross-validated in gastric cancer cell lines (right). Rank-sum test. Lines represent median ± s.d..
(D) Cell viability assay data plotted for isogenic MCF-10A and MCF-10A MSH2 KO cells, and a panel of 6 cell lines with endogenous differences in MMR function following MLN4924 treatment not included in the original prediction set. n = 3. Data are shown as mean ± s.d..
(E) In vivo treatment of MSI/dMMR and MSS xenografts with MLN4924. Mean ± s.e.m. Log-rank test.
See also Figures S1, S2, and Table S1.
This dMMR transcriptomic signature was then used to predict potential therapeutics for MSI endometrial and colorectal cancers per our previous study (McGrail et al., 2017). We identified the Nedd8 Activating Enzyme El (NAE) inhibitor MLN4924 (pevonedistat) in colorectal and endometrial cancer cell lines as a potential therapy to target MSI cancers, which was cross-validated in an independent set of gastric cancer cell lines (Figure 1C). This finding was corroborated in an independent screen of 122 colorectal cancer cell lines treated with MLN4924 (Figure S2C) (Picco et al., 2017), and in multiple lineages of cancer cell lines with lower MSI frequencies (Figure S2D). We experimentally validated MLN4924 sensitivity in vitro using an isogenic MCF-10A model system and an indepedent panel of endometrial and colorectal MSI and MSS cancer cell lines (Figure 1D). Sensitivity of MSI cell lines was also observed in 3-D soft agar assays (Figure S2E). Moreover, MSI colorectal cancer cells with acquired resistance to frontline chemotherapeutics maintained sensitivity to MLN4924 in both 2-D and 3-D culture (Figure S2F-G). Consistent with these in vitro results, we show that the growth of in vivo MSI tumor xenografts was potently inhibited by MLN4924 with negligible effects on MSS models (Figure 1E). Treatment and control mice had similar bodyweights, suggesting the treatment was well-tolerated (Figure S2H).
MSI cancer cells rely on neddylation to clear misfolded protein aggregates resulting from destabilizing mutations.
Neddylation controls the activity of cullin-RING ubiquitin ligases (CRLs), many of which control the degradation of key cell cycle proteins (Sarantopoulos et al., 2016). This led to the suggestion that MLN4924 may induce toxicity by inducing an S-phase defect leading to DNA re-replication, culminating in accumulation of S-phase cells and cells with ≥4N DNA (Soucy et al., 2009). Consistent with this idea, we observed a depletion of cells in G0/G1 following MLN4924 treatment, but this effect was not specific for MSI cancer cells, suggesting that this is not the primary mechanism of toxicity in dMMR cells (Figure 2A, S3A). Likewise, we saw no differential accumulation of canonical CRL protein targets when comparing MSS and MSI cancer cell lines (Figure S3B-F).
Figure 2. Mutations in MSI/dMMR tumors produce destabilized proteins.

(A) Cell cycle analysis of cells treated with 1 μM MLN4924 or DMSO (control) for 24 hours (left, plotted as mean ± s.d.) and quantification of cells in G0/G1 in MSS and MSI cancer cell lines (right, dots represent individual cell lines, lines represent average of those cell lines). Two-way ANOVA.
(B) Thermodynamic modeling of mutations in MSS SW948, MSI HCT-116, and MCF-10A MSH2 KO cells. A higher ΔΔG indicates greater protein destabilization. The shaded region depicts mutations that are significantly destabilizing. The percentage (and raw number) of destabilizing mutations identified in each cell line is indicated. Line indicates median.
(C) Absolute number of destabilizing mutations profiled across MSS and MSI cancer cell lines.
(D) Percentage of mutations that are destabilizing across MSS and MSI cancer cell lines.
(E) In silico simulation of mutational signatures and modeling of resulting protein structures, n = 50 simulations per signature; Dunn’s post-hoc test, p values relative to Signature 6. Unless otherwise noted, data are shown as median ± interquartile range; rank-sum test.
See also Figure S3.
In addition to canonical roles regulating CRLs, non-canonical neddylation can also be induced by external stressors that disturb protein homeostasis, such as heat shock or proteasome inhibition (Leidecker et al., 2012). We hypothesized that the dMMR mutational process may alter protein homeostasis due to an increase in destabilized mutant proteins/misfolded protein aggregates that rely on neddylation to be cleared from cells. In support of hypothesis, we found that exposure to the proteasome inhibitor bortezomib and ubiquitination inhibitor MLN7243 both preferentially targeted dMMR cells (Figure S3G-I), indicating an increased dependency on the ability to clear proteins. To test the hypothesis that MLN4924 sensitivity may be related to an accumulation of misfolded mutant proteins altering protein homeostasis, we first analyzed how mutations in dMMR/MSI cancer cells alter protein stability by computational modeling. For proteins with crystal structures, we modeled how mutations from MSI HCT-116 cells and MSS SW948 colorectal cancer cell lines altered protein stability using FoldX (Schymkowitz et al., 2005), where positive a change in free energy of folding (AAG) indicates destabilization. We found that MSI HCT-116 cells exhibit both increased absolute numbers of destabilizing mutations compared with MSS SW948 cells, and a higher relative fraction of destabilizing mutations (Figure 2B). To determine whether dMMR can lead directly to the generation of protein destabilizing mutations, we performed whole exome sequencing on our MCF-10A MSH2 KO cells. MCF-10A is a non-tumorigenic cell line that is largely genomically stable (Yoon et al., 2002), so the majority of mutations detected should be attributable to the MSH2 deletion. We found that the frequency of destabilizing mutations generated following MSH2 KO in MCF-10A cells was similar to that observed in HCT-116 (Figure 2B). Expanding this analysis to include a larger panel of MSI/MSS cell lines, we found that MSI cell lines generally had both a larger number (Figure 2C) and greater fraction of destabilizing mutations (Figure 2D). In silico simulation of cancer mutational processes from previously defined mutational signatures (Alexandrov et al., 2013) showed that the dMMR mutational process is inherently predisposed to generating destabilizing mutations, suggesting that these results are not due to selective pressure (Figure 2E). Notably, the percentage of mutations found to be destabilizing in our MCF-10A isogenic cell line (44%, Figure 2B) closely mirrored the theoretical value from these computational simulations (48%, Figure 2E).
Protein stability can be experimentally quantified by assessing thermal stability, which relies on the capacity of more stable proteins to withstand higher temperatures before unfolding and precipitating out of solution, known as the Cellular Thermal Shift Assay (CETSA) (Molina et al., 2013). Analysis of deposited thermal stability data (Tan et al., 2018) indicated that the proteins mutated in MSI HCT-116 cells were significantly less stable than their wild-type counterparts in other analyzed cell lines (Figure 3A). To experimentally explore the role of destabilizing mutations in the sensitivity of MSI cancer cells to the neddylation inhibitor MLN4924, we generated a panel of mutant and wild-type expression vectors bearing mutations observed in dMMR cancer cells. Next, we validated the in silico protein modeling of protein destabilization by assessing the difference in thermal stability between mutant and wild-type constructs, as shown in Figure 3B for the destabilizing pxSP87S mutation. Performing this analysis on a panel of mutant proteins demonstrated strong agreement with the in silico modeling: mutations predicted to be destabilizing demonstrated a significantly larger decrease in protein stability compared to neutral mutations (Figure 3C, S4A, S4B).
Figure 3. Destabilized mutant proteins are neddylated in MSI tumor cells to promote clearance of misfolded protein aggregates.

(A) Comparison of protein thermal stability of HCT-116 mutant proteins compared to their wild-type counterparts, n = 723. Rank-sum test. Line indicates median, top and bottom indicates maximum and minimum values.
(B) Protein stability was measured by CETSA for wild-type (WT) and highly destabilized P87S-mutant PTS. Representative western blot shown below.
(C) Protein stability for a panel of mutant proteins predicted to either be destabilizing or to have a neutral effect on protein stability, as described in 3B. Decreased protein stability is indicated by a negative change in the area under the melt curve (AAUC).
(D) Western blot showing soluble (S) and insoluble protein fractions (P) for WT, H80Y, and P99R BLVRA mutants following 24 hour treatment with either MLN4924 or DMSO control. BLVRA-long and BLVRA-short indicate long and short exposure times. HMW, high molecular weight.
(E) Quantification of HMW BLVRA from BLVRA-long as shown in 3D relative to soluble actin.
(F) Quantification of BLVRA taken from BLVRA-short normalized to actin as shown in 3D.
(G) Representative images of dual immunofluorescence staining of FLAG-tagged BLVRA variants (red), Nedd8 (green), and nuclear DAPI (blue) following pre-extraction of soluble protein. Scale bar = 10 μm.
(H) Quantification of relative number of BLVRA+ cells from images as shown in 3G.
(I) Representative images of dual immunofluorescence staining of FLAG-tagged PTS variants (red), Nedd8 (green), and nuclear DAPI (blue) following pre-extraction of soluble protein. Scale bar = 10 μm.
(J) Western blot following denaturing immunoprecipitation of Nedd8 from cells treated for 24 hours with DMSO (vehicle), MLN4924 (NAEi) or MLN7243 (UBAli) showing co-immunoprecipitation of FLAG-tagged, destabilized P87S mutant PTS. IN, Input; IgG, non-specific IgG; IP, anti-Nedd8.
(K) Western blot following denaturing immunoprecipitation of FLAG-tagged destabilized P87S mutant PTS probed with anti-Nedd8 antibodies from cells treated for 24 hours with DMSO MLN4924 (NAEi) or MLN7243 (UBAli) IN, Input; IgG, non-specific IgG; IP, anti-FLAG antibody.
Unless otherwise noted data are shown as mean ± s.e.m..; Holm-Sidak post-hoc test.
See also Figure S4.
Even before heating to facilitate protein unfolding, many destabilized mutant proteins were already highly insoluble despite high solublity of their wild-type counterparts, suggesting they are predominately misfolded natively. As shown for two distinct destabilizing mutations of BLVRA, although wild-type BLVRA was readily solubilized, the vast majority of the destabilized mutant protein was insoluble (Figure 3D). A high-molecular weight (HMW) form was observed primarily in the insoluble fraction of lysates from cells expressing the mutant proteins, and was reduced following MLN4924 treatment (Figure 3D,E). MLN4924 treatment also led to an accumulation of unmodified destabilized mutant proteins, suggesting neddylation is required for their proper clearance (Figure 3D,F). Immunofluorescence microscopy following pre-extraction readily detected co-localization of insoluble destabilized mutant BLVRA with Nedd8 (Figure 3G). In contrast to the mutant protein, wild-type BLVRA was nearly undetectable indicating it was almost completely extracted from the cells, despite being more highly expressed (Figure 3F,H). Co-localization of insoluble mutant BLVRA and Nedd8 was abrogated following MLN4924 treatment, with mutant BLVRA staining becoming stronger and more diffuse whereas the now soluble free Nedd8 was completely extracted (Figure 3G). We obtained similar results with the pxSP87S mutant (Figure 3I).
Prior reports have suggested that this stress-induced neddylation is dependent on ubiquitin activating enzyme (UBA1/UAE) instead of NAE (Leidecker et al., 2012). To test if the observed neddylation of destabilized mutant proteins were covalently modified with Nedd8 in vivo in an NAE/MLN4924-dependent manner, we performed denaturing immunoprecipitation with anti-Nedd8 in cells transfected with FLAG-tagged pxSP87S in the presence of MLN4924, the UBA1 inhibitor MLN7343, or mock DMSO treatment. Western blotting of immunoprecipiated compounds revealed isolation of HMW form of pxSP87S in both mock DMSO and MLN7243 treated samples, but not those treated with MLN4924 (Figure 3J). Reciprocal immunoprecipitation experiments yielded similar results (Figure 3K), suggesting that the HMW PTSP87S species results from neddylation mediated by NAE and can be blocked with MLN4924. In both contexts, not only did UBA1 inhibition fail to prevent the observed neddylation, it also led to a modest increase in the levels of the observed conjugated form, possibly due to preventing ubiquitin-mediated clearance. The difference observed in our system and previous reports (Leidecker et al., 2012) may be due to cell line differences, differences in the degree of stress activation, or a combination thereof. Taken together, these experiments indicate that neddylation facilitates clearance of destabilized proteins in MSI cancer cells and can be inhibited with MLN4924.
Next, we sought to evaluate whether the abundance of these destabilized proteins activated stress-induced neddylation more globally. A characteristic of stress-induced neddylation is the co-conjugation of ubiquitin and Nedd8 (Leidecker et al., 2012). Covalent co-conjugation was observed by western blotting following denaturing immunoprecipitation of either ubiquitin or Nedd8 from MSI HCT-116 cells, and was reversed by treatment with MLN4924 (Figure 4A-B). To test if MLN4924 treatment prevented clearance of misfolded protein aggregates, we isolated insoluble aggregates, which were detected by western blotting for ubiquitinated substrates (Hjerpe et al., 2016). We found that MCF10A MSH2 KO cells had higher baseline levels of insoluble ubiquitinated aggregates that control MCF10A cells, which was further exacerbated by treatment with MLN4924 (Figure 4C-D). Similar results were obtained using a panel of MSI and MSS cell lines, with higher endogenous levels that were increased by MLN4924 (Figure 4E, S5A). No change in insoluble ubiquitinated aggregates was observed in MSS cell lines after treatment with MLN4924. Additional analysis of misfolded protein aggregates also showed a high degree of neddylation in MSI cancer cells, but not MSS cancer cells (Figure S5B). To determine which E3 ligase was ubiquinating these aggregates, we screened a panel of E3 ligase candidates previously implicated in ubiquitination of protein aggregates (Kevei et al., 2017) and identified three (E6-AP/UBE3A, HectH9/HUWE1, CH\P/STUB 1) that inhibited aggregate ubiquitination by 20% or more (Figure S5C-L). Immunofluorescence microscopy revealed that aggregates positive for both Nedd8 and ubiquitin existed predominately as cytoplasmic granules (Figure 4F). Upon treatment with MLN4924, aggregates ceased to be neddylated, and the now soluble unconjugated Nedd8 was completely extracted. In contrast, we observed an accumulation in the insoluble ubiquitinated substrates. These experiments indicate that dMMR causes mutations that induce protein destabilization, and these destabilized mutant proteins can be neddylated to facilitate their clearance and support protein homeostasis.
Figure 4. MSI cancer cells activate the Nedd8 stress pathway in order to clear insoluble misfolded protein aggregates.

(A) Co-immunopreciptation of neddylated and ubiquitinated proteins is blocked in HCT-116 following MLN4924 treatment. HCT-116 pEYFP-C3-HA-Ubiquitin (HA-Ubiq.) or WT cells were subject to anti-HA denaturing immunoprecipitation, and then probed with anti-Nedd8.
(B) HCT-116 cells expressing pEYFP-C3-HA-Ubiquitin were treated with MLN4924 and subject to anti-Nedd8 denaturing immunoprecipitation. Resulting precipitates and input were probed with anti-HA.
(C) Analysis of insoluble ubiquitinated aggregates. Isogenic dMMR cell lines were treated with MLN4924 or DMSO before fractionation into soluble (S) and insoluble pellet (P) fractions and probing ubiquitin by western blotting.
(D) Quantification of relative fraction of misfolded/aggregated ubiquitinated proteins as shown in 4C determined by dividing the total integrated ubiquitin signal from the insoluble pellet (P) by the total integrated ubiquitin signal from the soluble (S) fraction for each condition.
(E) Analysis as described in 4C-D performed for a panel of MSS and MSI cell lines.
(F) Visualization of co-localized EYFP-Ubiquitin (green), Nedd8 (red), and nuclear DAPI (blue) in insoluble aggregates in HCT-116 cells following pre-extraction. Amplified region indicated by boxed area. Scale bar = 10 μm.
For all plots, data is shown as mean ± s.e.m; Two-way ANOVA with Holm-Sidak post-hoc test.
See also Figure S5.
Destabilization of MSI cancer proteomes drives sensitivity to MLN4924.
Tumors often upregulate protein chaperones to compensate for increases in protein synthesis and accumulation of mutated proteins (Whitesell and Lindquist, 2005). If mutant protein levels are sufficient to saturate molecular chaperone networks in dMMR/MSI tumors, then they might further tax global proteome stability, including folding of non-mutated proteins. Indeed, whole-proteome thermal stability analysis indicated that MSI HCT-116 cells had a less stable proteome than the matched MSS colorectal cancer cell line SW948 (Figure 5A). Analysis of additional cell lines indicated that proteome instability is an inherent feature of MSI cancers (Figure 5B). Proteome destabilization was recapitulated in our isogenic MCF-10A MSH2 KO cells, suggesting a causal relationship (Figure 5C-D). To ensure proteome instability was not an artifact of extended cell culture, we examined a panel of colorectal cancer patient-derived xenografts (PDXs) (Figure 5E-F) and primary endometrial cancer patient samples (Figure 5G-H), which both exhibited decreased proteome stability in MSI tumors compared to MSS tumors.
Figure 5. MSI/dMMR tumors exhibit whole-proteome instability.

(A) Whole proteome thermal stability curve for the MSI HCT-116 and the MSS SW948 colorectal cancer cell lines with the change in area under the curve (ΔAUC) indicated, where a negative ΔAUC indicates decreased proteome stability.
(B) Area under the thermal melt curve for MSS and MSI cell lines as described in 5A. n = 4 cell lines per group.
(C) Whole proteome thermal stability for WT and MCF-10A MSH2 KO cells.
(D) AUC values for isogenic MCF-10A thermal stability curves in 5C.
(E) Whole proteome thermal stability for n = 2 MSS (blue) and n = 3 MSI (red) colorectal cancer PDX models.
(F) AUC values for PDX thermal stability curves in 5E.
(G) Whole proteome thermal stability curves for MSS and MSI primary endometrial cancer patient samples.
(H) AUC values for the patient sample thermal stability curves in 5G.
Unless otherwise noted, data are shown as mean ± s.d..; n = 3; two-sided Student’s t-test.
To ascertain whether proteome stability was causally linked to MLN4924 sensitivity, we artificially induced proteome destabilization in MSS cell lines with sub-lethal dosages of pharmacological agents including: thapsigargin, which inhibits SERCA to inhibit chaperone activity; MG132, a proteasome inhibitor; and HSP70 and HSP90 inhibitors. All treatments decreased proteome stability in MSS colorectal and endometrial cancer cell lines (Figure 6A), which corresponded with an increased sensitivity to MLN4924 (Figure 6B).
Figure 6. Proteome instability is linked with sensitivity to MLN4924.

(A) Pharmacological induction of proteome destabilization in the following 24 hours of treatment with the indicated agents, as determined by CETSA.
(B) Relative viability of cells treated as in 5A after incubation with MLN4924 for 72 hours, normalized to treatment with specified inhibitor alone.
(C) Change in chaperone binding between wild-type and mutant proteins based on whether a mutation has neutral or destabilizing effects on protein stability. Rank-sum test. Dot indicates mean value; top and bottom of violin indicate maximum and minimum values.
(D) Violin plots depicting HSPA8 gene expression in MSS and MSI colorectal and endometrial cancers. White dots indicate medians, and boxes indicate interquartile ranges, whiskers determined by Tukey’s method; top and bottom of violin indicate maximum and minimum values.
(E) Western blot showing expression of Hsc70 (HSPA8) in MSI endometrial (MFE-296) and colorectal (HCT-116) cell lines expressing either empty vector (CTRL) or ectopic HSPA8.
(F) Proteome stability determined by CETSA for MSI cell lines in 6E.
(G) Viability of cells described in 6E after a 72 hour treatment with MLN4924.
(H) Correlation between protein stability (CETSA AUC) and MLN4924 drug response from 6A-B, F-G. Values were normalized to the average of each cell line. Inset values indicate Pearson’s correlation (r); n = 14.
Unless otherwise noted, data represent the mean ± s.e.m.; n = 3; Holm-Sidak post-hoc test.
Previous work analyzing proteome homeostasis has shown that chaperone overexpression can alleviate toxicity due to overexpression aggregation-prone proteins (Satyal et al., 2000). To further demonstrate causal association between MSI proteome instability and MLN4924 sensitivity, we hypothesized that we could apply this paradigm to MSI cancer cells to promote proteome stability and reverse the observed MLN4924 sensitivity. Previously, we quantified binding between a panel of molecular chaperones and various mutated proteins (Sahni et al., 2015). Further analysis indicated that Hsc70 (encoded by the HSPA8 gene) selectively binds destabilizing mutations (Figure 6C), and is overexpressed in MSI tumors relative to MSS tumors of the same origin (Figure 6D). Thus, we hypothesized that Hsc70 expression may enable cells to compensate for an abundance of destabilized proteins. In MSI colorectal and endometrial cancer cell lines, we found that HSPA8 overexpression (Figure 6E) both increased proteome stability (Figure 6F) and mitigated MLN4924 sensitivity (Figure 6G). The ability to manipulate MLN4924 sensitivity by tuning proteome stability strongly implies a causal relationship, exhibited by the strong correlation upon compiling all modifiers of proteome stability utilized (Figure 6H).
MLN4924 induces immunogenic cell death in MSI tumors and can be potentiated by immunotherapy.
Due to the observed accumulation of misfolded proteins, we hypothesized that MLN4924 may induce endoplasmic reticulum (ER) stress/the unfolded protein response (UPR), resulting in immunogenic cell death (ICD) (Galluzzi et al., 2017). Western blot analysis revealed ER stress marker activation following MLN4924 treatment (Figure 7A). We also observed transcriptional upregulation of key ER stress/UPR genes in MSI, but not MSS, cell lines following MLN4924 treatment (Figure S6A). To analyze ICD resulting from the accumulation of misfolded proteins, we generated two syngeneic models. For a model of murine MSI colorectal cancer, we used CRISPR-mediated genome editing to delete Msh2 from the CT26 colorectal cancer cell line (Figure S6B). For endometrial cancer, there are no murine models that can be used in an immunocompetent setting. An MMR-intact endometrial cell line was isolated from a previously described tumor model (Kim et al., 2010). Deletion of Msh2 has previously been utilized to generated dMMR/MSI colorectal tumors when targeted to villin-expressing cells (Kucherlapati et al., 2010). For a murine endometrial dMMR model, we instead deleted Msh2 in progesterone receptor-expressing cells and isolated a cell line from a resulting tumor, denoted as “21B”. Upon reinjection into syngeneic C57/B16 mice, 21B cells formed carcinomas with histology consistent with human disease (Figure S6C). The 21B cell line showed loss of PTEN, which occurs in 90% of human MSI endometrial tumors (Getz et al., 2013) (Figure S6D-E), was MSI by PCR analysis (Figure S6F), exhibited an increase in our dMMR gene expression score (Figure S6G), and functional loss of MMR capability (Figure S6H), all indicating that 21B can serve as a model for MSI endometrial cancer.
Figure 7. MLN4924 induces immunogenic cell death.

(A) Western blot analysis of specific ER stress/UPR markers following a 24-hour treatment with the specified concentrations of MLN4924.
(B) Mean fluorescence intensity of cell surface calreticulin (CRT) in HCT-116 and the Msh2 null 2IB cell line, following a 24-hour treatment with the specified drugs as determined by flow cytometry.
(C) Media ATP concentration following a 24-hour treatment with the specified drugs.
(D) Heat map of cytokine ELISA array intensity values following a 24-hour treatment with MLN4924.
(E) Cytotoxic T cell (CTL) cytokine score, defined by levels of CCL5, CXCL9, and CXCL10, as determined by ELISA. Student’s t-test.
(F) Migration of peripheral blood mononuclear cells (PBMCs) towards conditioned media from MSI cancer cell lines treated with either DMSO or MLN4924.
(G) Antitumor vaccination study design. Mice were inoculated with cisplatin-treated tumor cells, MLN4924-treated tumor cells, or with a PBS sham control. After 7 days, blood was drawn and mice were re-challenged with viable 21B cells.
(H) Detection of in vivo antibody production against 21B tumor cells detected by probing 21B lysates with serum from the mice described in 7G. Each lane represents serum from a single mouse.
(I) In vivo generation of antibodies against 21B cells were quantified from band intensities in 71. Mean ± s.d.; dots represent individual mice.
(J) Kaplan-Meier Plot showing time to tumor incidence rates following re-challenge in mice from 6G. Log-rank test; n = 10 mice per arm.
Unless otherwise noted, data represent the mean ± s.e.m.; n = 3; Holm-Sidak post-hoc test.
See also Figures S6 and S7.
To test for ICD, we treated cells with MLN4924 or a combination of 5-fluorouracil (5-FU) and oxaliplatin. The combination of 5-FU and oxaliplatin induces ICD (Galluzzi et al., 2017), and is a frontline treatment for colorectal cancer, with similar regimens used for treatment of endometrial cancer. In both HCT-116 and 21B cells, ICD was observed following MLN4924 treatment, as indicated by induction of surface calreticulin expression (Figures 7B and S7A) and by ATP release (Figure 7C). This induction of ICD by MLN4924 was specific to MSI cancer cells (Figure S7B-C). In addition to the increase in surface calreticulin expression, there was also a modest increase in expression of antigen presentation machinery as indicated by surface levels of both β2-microglobulin and HLA (Figure S7D-E). Furthermore, treatment of MSI models with MLN4924 increased the expression of multiple inflammatory soluble factors (Figure 7D), with increased total cytokines associated with cytotoxic T-cell recruitment (McGrail et al., 2018a) (Figure 7E). Consistent with increased cytokine production, significantly more immune cells migrated towards conditioned media from MSI tumor cell lines treated with MLN4924 compared to those treated with a DMSO vehicle control (Figure 7F). To confirm that MLN4924 induces ICD, we treated 21B cells with MLN4924 and injected them as an anti-tumor vaccine into immunocompetent C57/B16 mice. As controls, we also injected non-immunogenic cisplatin-treated cells (Kepp et al., 2014) and performed a PBS-alone sham injection (Figure 7G). By day 7, circulating tumor antibodies were detected at higher levels in mice immunized with MLN4924-treated cells than mice injected with either cisplatin-treated cells or PBS (Figure 7H-I). Moreover, immunization with MLN4924-treated cells significantly decreased tumor incidence upon re-challenge with viable 21B cells compared to mice immunized with either cisplatin-treated cells or PBS (Figure 7J).
Based on the observed immunogenic cell death and immune cell recruitment, we hypothesized that MLN4924 may potentiate immune checkpoint therapy. In preliminary studies comparing MLN4924 treatment schedules, 5 on/2 off showed maximal growth inhibition, but could limit the ability to detect the efficacy of combination therapy. MLN4924 treatment with either the 2 on/5 off schedule originally used (Figure 1E) or treatment on days 1 and 3 both demonstrated a reduction in growth that was amenable to the study of combination therapy (Figure S8A). To maximize the amount of time cells could potentially undergo ER stress/ICD, MLN4924 treatment on days 1 and 3 was chosen. Following treatment of Msh2-null 2IB tumors with anti-PD1, MLN4924, or combination thereof, anti-PDl failed to significantly reduce tumor growth, whereas MLN4924 monotherapy produced significant tumor growth inhibition (Figure 8A). Critically, the combination of anti-PDl and MLN4924 markedly and significantly decreased tumor growth compared to monotherapy with either MLN4924 or anti-PDl, exhibiting synergistic activity with a combination index (Cl) of 0.61±0.13. Mouse weights modestly increased throughout the treatment course, consistent with the combination being well-tolerated (Figure S8B). Interestingly, even within this genetically homogenous cohort (inbred mouse strain, same cell line injected into all mice), we observed a larger coefficient of variation (CV) in the aPDl treated arm (CV = 46 ± 6%), than the vehicle control, MLN4924 monotherapy, or combination treatment arms (CVs of 26 ± 4%, 25 ± 3%, and 21 ± 3%, respectively). We validated this treatment strategy using CT26 colon carcinoma cells following Msh2 deletion, but with a dose of anti-PDl of 100 μg/mouse to enable detection of combination efficacy in this immunogenic cell line (Hossain et al., 2018). Strikingly, in this model, 6/10 mice treated with combination therapy had a complete response, compared to only 2/10 mice treated in either monotherapy arm (Cl = 0.6±0.17, Figure 8B, S8C). The efficacy of this combination appeared dependent on dMMR, as complete responses were not observed, regardless of treatment, when using parental CT26 cells with intact Msh2 (Figure S8D).
Figure 8. MLN4924 is potentiated by immune checkpoint blockade.

(A) Growth curves for mouse tumors derived from the dMMR 21B mouse cell line treated with MLN4924 (days 1 and 3), anti-PDl (days 1,3,5), or a combination thereof was initiated on day 0. CI = combination index. Data represent the mean ± s.e.m.; n = 8 mice per group.
(B) Survival curves for the dMMR CT26 Msh2 KO-C29 mouse cell line treated per 8A. Treatment was initiated at day 0 and stopped on day 28. Log-rank p values. Inset p values: PD1 vs. vehicle (blue); MLN4924 vs. vehicle (red); combination vs. vehicle (green), n = 10 mice per group.
(C) Representative images taken from each of the four treatment arms in the 21B endometrial cancer model combination study as described in 8A. Veh., vehicle. Nuclei (blue), CD3 (red), CD4 (green), CD8 (magenta), FoxP3 (yellow). Scale bar = 100 μm.
(D-G) Quantification of the cell populations as shown in 8C. P values relative to control (IgG+vehicle treated mice) are shown in color above each individual treatment condition. Additional comparisons between treatment arms are indicated by bars. Populations were analyzed as (D) CD3+CD8+, (E) CD3 CD4 FoxP3−, (F) CD3 CD4 FoxP3−, and (G) the ratio of conventional CD4 T cells to Regulatory T Cells. Boxes representes median with interquartile range, whiskers represent range; n = 5 mice per group.
(H) Representative images as in 8C but with nuclei (blue), CDllc (red), F4/80 (green), and CD31 (magenta) Scale bar =100 μm.
(I-K) Quantification of images as shown in 8H. P values relative to control (IgG+vehicle treated mice) are shown in color above each individual treatment condition. Additional comparisons between treatment arms are indicated by bars. Populations analyzed were (I) percent of area positive for CD31, (J) percent of area positive for macrophage F4/80, and (K) dendritic cells as indicated by CDllc+. Boxes representes median with interquartile range, whiskers represent range; n = 5 mice per group.
Unless otherwise noted significance determined by Holm-Sidak post-hoc test.
See also Figure S8.
We next sought to understand how this combination therapeutic strategy altered the tumor immune microenvironment using multispectral imaging. We first used a T cell focused panel staining for CD3, CD4, CD8, and FoxP3 (Figure 8C). The number of cytotoxic T cells increased in both monotherapy arms, and increased even further in the combination therapy arm (Figure 8D). The number of conventional CD4+ T cells increased following MLN4924, but not PD1 monotherapy, and combination treatment led to a significant increase over either monotherapy (Figure 8E). Although anti-PDl reduced the number of regulatory T cells (Tregs), tumors treated with MLN4924 showed less Tregs than those treated with anti-PDl with no further benefit observed by combination, suggesting MLN4924 drives reduction of Tregs (Figure 8F). Nonetheless, the ratio of conventional CD4+ T cells to Tregs was increased in the combination arm relative to either monotherapy arm (Figure 8G). Our second panel of antibodies detected vascularization (CD31) and myeloid (F4/80, CD1 lc) cell markers (Figure 8H). We did not detect changes in vascularization (Figure 8I) or macrophage recruitment (Figure 8J). Monotherapy with MLN4924, but not anti-PDl, significantly increased dendritic cells, which was further excerbated by combination with anti-PDl (Figure 8K).
Finally, to test whether ER Stress/UPR might play a role in patient responses, we performed an exploratory analysis of MSI cancer patients treated with anti-PDl. Although the analysis was under-powered due to limited sample size, we detected a trend toward better response in patients with higher UPR gene expression scores, defined by the genes that were up-regulated in MSI cancer cells following MLN4924 treatment (p = 0.02, Figure S8E). Similarly, UPR gene expression scores also had prognostic value for overall survival in MSI endometrial (Figure S8F) and MSI colorectal (Figure S8G) cancer patients.
DISCUSSION
Although treatment of dMMR/MSI cancers with immunotherapy has led to robust and durable responses in a subset of patients, approximately 60% of patients fail to respond to immunotherapy (Lemery et al., 2017). Moreover, dMMR/MSI cancers exhibit intrinsic resistance to chemotherapeutics, limiting treatment options for these patients (De La Chapelle and Hampel, 2010). This study shows that dMMR/MSI tumors exhibit whole-proteome instability associated with a large burden of destabilizing mutations. Together, these factors lead to Nedd8-dependent clearance of misfolded proteins, which can be blocked with the Nedd8 Activating Enzyme El inhibitor MLN4924. Upon treatment with MLN4924, dMMR/MSI tumors accumulated misfolded proteins, which activated the unfolded protein response, and ultimately induced immunogenic cell death, which we leveraged by combination with immune checkpoint inhibition to achieve potent synergistic activity.
In our MSI endometrial cancer model, anti-PDl alone was insufficient to reduce tumor growth, suggesting it may serve as a good model for MSI patients who will not benefit from immunotherapy alone. The more homogenous response resulting from the combination of MLN4924 and checkpoint blockade inhibition might increase the number of patients who would show clinical therapeutic benefit, in particular those who may be unresponsive to ICB monotherapy as we observed with the 21B model. Moreover, as 21B cells dying following treatment with MLN4924 generated circulating antibodies, the MLN4924/anti-PDl combination therapy may stimulate more highly durable responses than can be achieved by immunotherapy alone. To maximize this benefit, future studies optimizing combination therapies should be performed. Optimization may include dose scheduling, and comparing the activities of different immune checkpoint blockade inhibitors (e.g. anti-CTLA4 and anti-PDl) that have been shown to act by different mechanisms (Wei et al., 2017).
Numerous studies have linked high mutation burdens with immunotherapy responses across diverse lineages, including melanoma (Van Allen et al., 2015), small-cell lung cancer (Hellmann et al., 2018a), non-small-cell lung cancer (Hellmann et al., 2018b), and gastric cancer (Kim et al., 2018). These successes have led to efforts to use either mutational load (Goodman et al., 2017; Hellmann et al., 2018c) or MSI status (Le et al., 2017) as clinical biomarkers for immunotherapy response, regardless of cancer lineage. These efforts are largely predicated on the idea that this large mutation burden will produce neoantigens that are recognized by the immune system, allowing for tumor clearance by cytotoxic lymphocytes (Schumacher and Schreiber, 2015). Although these highly-mutated cancers do show increased response rates, the rates rarely exceed 50%. Le and colleagues found enrichment of intratumoral CD8 staining in MSI patients who clinically benefited from immunotherapy compared to those with progressive disease (Le et al., 2017). The increase in CD8+ cytotoxic T cell infiltration that we observed upon MLN4924 treatment likely contributes to the combination’s synergistic activity. These effects were likely compounded by increased levels of conventional CD4 T cells, which are required for immunotherapy response (Alspach et al., 2019), as well as suppression of regulatory T cells and accumulation of dendritic cells.
Another interesting possibility is that high mutational burden might induce an immunogenic phenotype independent of the generated neoantigens. We hypothesize that proteome instability increases the inherent immunogenicity of high-mutation tumors. This might occur through stimulation of ER stress, the unfolded protein response, or a mechanism that is yet to be identified. This effect could then be potentiated by treatment with MLN4924 to further heighten the immunogenicity of MSI tumor cells. Indeed, exploratory analysis of MSI cancer patients treated with pembrolizumab, an anti-PDl immunotherapy, showed a positive relationship between higher UPR scores and complete response. Future studies identifying how Nedd8-mediated protein degradation alters the presentation of potential neoantigens will be informative.
Here, we focused on MSI status as it is currently used as an attribute for inclusion criteria associated with immunotherapy-based clinical trials across tumor lineages. However, expansion of our observations to other “MSI-like” phenotypes such as POLE hyper-mutators, and the CMS1, MSI-like subtype of colorectal cancer (Guinney et al., 2015) may warrant further investigation. Indeed, the transcriptional signature of dMMR/MSI that we identified was highly correlated with the CMS1 subtype. Performing in silico protein stability modeling of patient mutations from whole exome sequencing may serve as a broader response biomarker. Furthermore, the efficacy of dual MLN4924/immunotherapy treatment may extend beyond high-mutation burden cancers. Protein folding chaperones can contribute to tumor survival by helping to stabilize the proteome regardless of mutational burden, leading to the development of specific heat shock protein inhibitors with therapeutic potential (Whitesell and Lindquist, 2005). Proteotoxic stress, an emerging hallmark of cancer (Luo et al., 2009) can be induced by the expression of a single oncogene (Denoyelle et al., 2006). Analyzing levels of patient proteotoxic stress, or directly measuring a patient’s proteome stability status through thermal stability assays may also provide tools to define biomarkers predicting therapeutic response agnostic to mutational burden. In conclusion, targeting proteome instability to enhance tumor immunogenicity may provide a promising treatment avenue maximizing the number of patients who can achieve robust therapeutic responses to immunotherapy.
STAR METHODS
LEAD CONTACT AND MATERIALS AVAILABILITY
Further information and requests for resources and software should be directed to and will be fulfilled by the Lead Contact, Shiaw-Yih Lin (sylin@mdanderson.org).
EXPERIMENTAL MODEL AND SUBJECT DETAILS
Animal studies and models.
All experiments involving animals were approved by the Institutional Animal Care and Use Committee of the MD Anderson Cancer Center. Balb/C, C57BL/6, and NCI nude mouse strain Crl:NU(NCr)-Foxnnu/nu were obtained from Charles River. C57BL/6; Msh2loxP/loxP and NOD.Cg-Prkdcscid I12rgtm1Wjl/SzJ (NSG) mice were from obtained from Jackson Labs. C57BL/6; Pgr-Cre (Soyal et al., 2005) and Lox-stop-lox KrasG12D; PtenloxP/loxP (Kim et al., 2010) were acquired from the authors. Studies were initiated when mice were aged 8–10 weeks. Mice were randomized at the beginning of all studies. For studies with endometrial cancers, all female mice were used. For studies with colorectal cancers, mice were half female and half male.
Primary endometrial patient samples.
Primary tissue samples were isolated from patients during standard of care visits at MD Anderson with informed patient consent. MSI status was determined by IHC for four mismatch repair enzymes (MLH1, MSH2, MSH6, and PMS2) by the MD Anderson Clinical Pathology Department. Informed, written consent was obtained prior to collection and use of patient samples and all procedures were approved by the Institutional Review Board of the MD Anderson Cancer Center.
Patient-derived xenografts.
Patient-derived xenografts (PDXs) were established as previously described (Katsiampoura et al., 2017). In brief, ~50 mm3 tumor fragments were engrafted into flanks of NOD.Cg-Prkdcscid I12rtm1Wjl/SzJ (NSG) mice from Jackson laboratory. Established tumors were expanded by serial passage in NSG mice. All tumors used in this study were from early (<5) passage PDX samples. MSI status was determined by immunohistochemistry (IHC) for four mismatch repair enzymes (MLH1, MSH2, MSH6, and PMS2) by the MD Anderson Clinical Pathology Department. Informed, written consent was obtained prior to collection and use of patient samples and all procedures were approved by the Institutional Review Board of the MD Anderson Cancer Center.
Cell lines.
Table S2 describes the culturing conditions for each cell line used in this study. Cells were cultured at 37°C in humidified 95% air/5% CO2 and regularly evaluated for mycoplasma contamination. Cells were either purchased from ATCC, the MD Anderson Characterized Cell Line Core, ZenBio, or obtained from collaborators. STR profiling at the MD Anderson Characterized Cell Line Core was used to confirm human cell line identities.
METHOD DETAILS
shRNA knockdown, CRISPR knockout, and MLH1 re-expression.
Mission shRNA Lentiviral particles, namely clones TRCN0000078543 (MSH6), TRCN0000298603 (MSH6), TRCN0000010384 (MSH2), TRCN0000039670 (MSH2), TRCN0000084059 (MSH3), TRCN0000084062 (MSH3), TRCN0000288641 (MLH1), TRCN0000288642 (MLH1), and Mission shRNA Non-Target Control Transduction Particles were purchased from Sigma Aldrich. KLE cells were transfected with a MOI of 5, according to the manufacturer’s protocol, and pooled clones per lentivirus were selected in puromycin to yield polyclonal populations of cells. CT-26 Msh2KO mouse cells were generated by the Institution’s CRISPR Core Facility (Supplementary Figure S6B). Briefly, two guide RNA (gRNA) sequences (gRNAl: CGGCGACTTTTACACGGCGC and gRNA2: CGTGATCAAGTACATGGGGC) were used, and the bi-allelic deletions in MSH2 mRNA/genomic DNA were confirmed by sequencing the positive clones. HCT116 MLHl+/− was acquired from Horizon Discovery Limited (catalog ID HD 104–006) and used for re-expression experiments.
MMR activity assay.
The bacteriophage heteroduplex used in this study contained a single GT mismatch and a strand break 5’ to the mismatch. This was produced by digesting M13mpl8-UKY1 dsDNA with Bgll and then hybridizing it with M13mpl8-UKY2 ssDNA. The mismatched substrate was prepared, and the in vitro DNA mismatch repair assay was performed as previously detailed (Gu et al., 2012) with minor modifications. As per the manufacturer’s protocol, nuclear extracts of cells were obtained using a NE-PER Nuclear and Cytoplasmic Extraction Reagents Kit (Thermo Scientific). Nuclear extract purity was assessed via western blotting using anti-histone H3 and β-tubulin antibodies (Cell Signaling). One μg of purified heteroduplex substrate was incubated with each nuclear extract. DNA was then purified and digested with Nsil, and BseRl and analyzed on agarose gels. Unrepaired substrates migrated as a single, large DNA fragment, whereas repaired substrates migrated as two smaller fragments (Gu et al., 2012).
RNA isolation and transcriptome profiling.
Total RNA from KLE expressing shRNAs targeting MSH2, MSH6, MSH3, MLH1, or a scrambled control was extracted in biological triplicates using an RNeasy Mini Kit, per the manufacturer’s instructions (Qiagen). Equimolar concentrations of total RNA were processed for hybridization to HumanHT-12 v4 Expression BeadChips per the manufacturer’s instructions (Illumina). The Institutional High Throughput Genotyping Core scanned the Beadchips using an Illumina HiScan reader. Microarray data were initially processed and normalized in Genome Studio (Illumina, v2011.1.0.24550) before exporting for further analysis.
Whole exome sequencing and analysis.
MCF10A MSH2 KO cells were cultured for 105 population doublings. Genomic DNA was extracted from these cells and the parent cells using NucleoSpin DNA RapidLyze (Macherey-Nagel, #740100) with RNase A treatment and dissolved in lx TE. Exome libraries were prepared using the Agilent SureSelectXT2 Human All Exon V6 Kit and sequenced at a depth of 100x with paired-end 2× 150bp reads on the Illumina HiSeq platform. The quality scores of the reads were re-calibrated using the BaseRecalibrator tool from GATK (v4.1.2) (Van der Auwera et al., 2013). The reads were aligned using BWA-MEM (vO.7.17) (Li, 2013) to human genome assembly hg38. Various GATK additional tools were used for quality control, variant calling, and filtering: cross-contamination was assessed using CalculateContamination; oxoG artifact level was determined to be negligible using CollectSequencingArtifactMetrics. Subsequently, somatic mutations were called using Mutect2 using the parental sample as the control, and variants were filtered using FilterMutectCalls and SelectVariants.
Signature generation.
Level 4 microarray gene expression data for UCEC and COAD was acquired through the TCGA data portal, along with patient MSI status. Thresholds for p values were set at 0.05 (UCEC) and 0.005 (COAD) to define candidate genes, retaining only those genes that showed consistent differential expression with a coefficient determined by the average fold change in both cohorts. To generate the final MSI signature, this list was further refined by selecting those genes that were differentially regulated in at least 2 model cell lines, where at least 1 instance was from the KLE panel of knockdown cell lines and when both instances were neither MSH2 depleted nor MLH1 dysregulated.
Signature validation.
Level 4 RNA-seq gene expression data was acquired through the TCGA data portal, along with corresponding MSI statuses for UCEC, COAD, and STAD. UCEC and COAD patients included in the training data set were excluded from this analysis. MSI statuses for other lineages were obtained from the Hause data set (Hause et al., 2016). Cell line gene expression data was obtained through CCLE (Barretina et al., 2012), and their corresponding MSI statuses through COSMIC/GDSC (Yang et al., 2013). For patient samples, signature scores were calculated by multiplying the signature coefficient of each gene by the z-normalized expression value of each sample, and then by normalizing the value to the sum of the absolute values of the signature coefficients. Cell lines were analyzed analogously, but with log2-transformed, quantile normalized values from microarray quantification. All analyses, including receiver-operating characteristic curves, were performed in MATLAB.
Drug prediction and databases used.
The dMMR signature score was calculated for endometrial and colorectal cancer cell lines from CCLE’s gene expression data, and then used to predict therapeutic compounds that target dMMR as previously described (McGrail et al., 2017). Briefly, cell lines were bifurcated into dMMR-high (signature z-score > 1.0) and dMMR-low (signature z-score < −1) scores, and their differential sensitivities were determined based on CTRPv2 drug response data using area under the drug response curve as a sensitivity metric (Seashore-Ludlow et al., 2015). Cell lines used for experimental validation were not included in initial computation prediction analysis. Additional MLN4924 sensitivty data for 122 colorectal cancer cell lines treated with MLN4924 was obtained from the publication’s supplemental data (Picco et al., 2017), and sensitivity calculated as area under the curve the drug response curve.
Proliferation assays.
Cell lines were treated with different concentrations of MLN4924 (Selleck Chemicals), MLN7243 (Chemie Tek), bortezomib (Selleck Chemicals), or a DMSO vehicle control in technical duplicates. After 3 days, viability assays were performed using PrestoBlue (Invitrogen) and a Tecan plate reader. After subtracting the media blank, viability was calculated following normalization to the DMSO vehicle control. Values represent an average of 3 independent experiments.
Anchorage-independent growth.
The MSS colorectal cancer cell line SW948 and either parental MSI HCT-116 colorectal cancer cells or MSI HCT-116 cells that are resistant to 5-FU (5FUR) or oxaliplatin (OXR) were grown in three-dimensional cultures as previously described (Kajiwara et al., 2008), with minor modifications. Cells (3×10 ) were allowed to form colonies in 6-well plates for 7 days, and then were treated with 1 μM MLN4924 (Selleck Chemicals) or DMSO for 14 days. Colonies were stained with 0.5 mL crystal violet/25% methanol, per well, for 1 hour, with rocking, and washed with PBS prior to visualization and imaging.
Western blotting.
Cells were lysed in either RIPA buffer or urea buffer (8 M urea, 150 mM P-mercaptoethanol, and 50 mM Tris/HCl, pH 7.5), and cleared by centrifugation (14,000 ref for 15 minutes at 4°C). Protein concentration was determined using either the bicinchoninic acid assay (BCA) or Bradford (BioRad) method. Proteins were separated by gel electrophoresis and transferred to either nitrocellulose (BioRad) or polyvinylidene difluoride membranes, and then probed with the desired antibodies.
Cell cycle analysis.
Cells were treated with 1 μM MLN4924 (Selleck Chemicals) for 24 hours, harvested, and then fixed in 70% ice-cold ethanol overnight. The following day, cells were washed in PBS and stained with 20 μg/mL propidium iodide (Calbiochem) in PBS containing 400 μg/mL RNase A (Invitrogen) for 20 minutes before analysis by flow cytometry. Data were processed using FlowJo (vl 0.6.1).
Mutant protein stability modeling.
Changes in protein stability, determined as the ΔΔG value for each mutation, where higher ΔΔG values indicated more destabilization, were calculated using FoldX software (Schymkowitz et al., 2005). High-quality (>95% sequence identity) crystal structures were obtained from RSCB PDB (Berman et al., 2000) (www.rcsb.org. Table S3). Mutations were called from GDSC (Yang et al., 2013). For comparing the absolute number of destabilizing mutations, ΔΔG values were down-sampled such that all represented samples had equivalent fractions of mutations. All calculated ΔΔG values were used for determining fraction of destabilizing mutations, defined as changes in ΔΔG values that were 1.25 fold above the standard error of FoldX predictions (2.1 kJ/mol ) (Broom et al., 2017).
In silico mutation simulations.
Exome mutations were sampled from 1 of 30 mutational signatures (retrieved from COSMIC) using the sampling importance resampling algorithm (without replacement). The exome was defined as the set of all coding sequences in GENCODE v27 (GRCh38), and for each gene the transcript with the longest coding sequence was defined as the canonical transcript. To draw one mutation from a target mutational signature: 1) a transcript was sampled from the exome uniformly; 2) a coding exon of the transcript was sampled uniformly; 3) a position within the exon was sampled uniformly; and 4) one of three possible alternative nucleotides was sampled uniformly. The probability of drawing a particular mutation under this uniform sampling scheme is given by q = (1 /G) (1 /Rg) (1 /Ng,r) (1/3), where G is the number of genes, Rg is the number of coding exon regions in a gene g, and Ng,r is the number of nucleotides within the region r of gene g. Next, the weight for each sampled mutation was calculated as w = p/q, where p is the mutation probability from the target mutational signature based on the trinucleotide context. Finally, the weights across all mutations were normalized to sum to 1, and the initially sampled set of mutations was re-sampled (without replacement) using the normalized weights in order to realize a sample of a set of mutations from the target mutational signature. As a quality control, the mutation spectrum of each sample was compared against the target mutational signature. Any sample having a Jensen-Shannon divergence of ≥ 0.05 (or cosine similarity of ≤ 0.85) was rejected and re-sampled so as to ensure that each sample recapitulated the target mutational signature.
Chaperone binding analysis.
Mutant protein binding data were obtained from our previous study (Sahni et al., 2015). Binding effects were initially analyzed as the correlation between alteration in chaperone binding and the mutation’s ΔΔG value as determined in FoldX. For classification into neutral or destabilizing mutations, destabilizing mutations were considered as 1.25 fold above the standard error of FoldX predictions (2.1 kJ/mol) (Broom et al., 2017).
Analysis of public thermal shift data.
Raw thermal stability data was from Tan (Tan et al., 2018), and mutation profiles for HCT-116, MCF7, and A375 cells were acquired from the GDSC database (Yang et al., 2013). The area under the thermal melt curve was calculated for mutant proteins in HCT-116 cells, and the average value for the corresponding WT genes was taken from MCF7 and A375 cells.
Generation of FLAG-tagged mutant constructs.
For a given mutation, PCR cloning consisted of two “primary PCRs” to generate gene fragments, and one “fusion PCR” to obtain the mutated open reading frame (ORF). For the primary PCRs, two universal primers, Tag 1-Ml 3 F (5’-GGCAGACGTGCCTCACTACTCCCAGTCACGA-CGTTGTAAAACG-3’) and Tag2-M13R (5’-CTGAGCTTGACGCATTGCTAGTGTCTCAA-AATCTCTGATGTTAC-3’), and two ORF-specific internal forward and reverse primers were employed. The two universal primers allowed the preservation of the Gateway att recombination sites on both ends of the ORF. The mutation-specific primers, MutF and MutR, encompassing the desired single nucleotide change, were designed to have an overlapping region of ~40 base pairs. The two ORF fragments flanking the mutation of a disease gene were amplified using the primer pair Tagl-M13F and MutR, and the primer pair Tag2-M13R and MutF, respectively. For the fusion PCR, the two primary PCR fragments were annealed together and amplified using the primer pair Tagl (5’-GGCAGACGTGCCTCACTACT-3’) and Tag2 (5’-CTGAGCTTGACGCATTGCTA-3’) to generate the mutation allele. The final product was a full-length ORF harboring the desired mutation. To create Flag-tagged expression clones, we transferred all WT and mutant allele clones by Gateway LR recombination into a mammalian expression vector containing a C-terminal 3xFLAG-V5 tag, a gift from Mikko Taipale (pcDNA3.1-ccdB-3xFLAG-V5, Addgene plasmid # 87063)(Taipale et al., 2012). The resulting LR products were transformed into bacteria (DH5a-TlR) and colonies were selected for ampicillin resistance. Four independent colonies per mutant ORF were isolated, and the inserts verified by PCR amplification and sequencing. All generated vectors are listed in the Key Resources Table.
KEY RESOURCES TABLE
| REAGENT or RESOURCE | SOURCE | IDENTIFIER |
|---|---|---|
| Antibodies | ||
| Nedd18 (Poly) | Cell Signaling | Cat# 2745; RRID: AB 10695300 |
| Rabbit IgG Control (Poly) | Cell Signaling | Cat# 2729; RRID: AB 1031062 |
| HA (6E2) | Cell Signaling | Cat# 2367; RRID: AB 10691311 |
| FLAG (M2) | Sigma | Cat# F3165; RRID: AB 259529 |
| Mouse IgG Control (Poly) | Sigma | Cat# 12-371; RRID: AB 145840 |
| Phospho-IRE1 alpha (Poly) | Invitrogen | Cat# PA1-16927; RRID: AB 2262241 |
| Ubiquitin (P4D1) | Santa Cruz | Cat# sc-8017; RRID: AB 628423 |
| ATF4 (EPR18111) | Abeam | Cat# ab184909; RRID: AB 2819059 |
| CHOP (L63F7) | Cell Signaling | Cat# 2895; RRID: AB 2089254 |
| MSH2 (D24B5) | Cell Signaling | Cat# 2017P; RRID: AB 2235387 |
| MSH3 (Poly) | BD | Cat# 611390; RRID: AB 398912 |
| MSH6 (Poly) | BD | Cat# 610918; RRID: AB 398233 |
| MLH1 (4C9C7) | Cell Signaling | Cat# 3515; RRID: AB 2145615 |
| HSC70 (Poly) | GeneTex | Cat# GTX101144; RRID: AB 1240971 |
| ERK(1/2) (137F5) | Cell Signaling | Cat# 4695S; RRID: AB 390779 |
| Actin (AC-15) | Sigma | Cat# A3854; RRID: AB 262011 |
| Tubulin (EPR13478(B)) | Abeam | Cat# ab185067; RRID: AB 2819060 |
| Histone H3 (D1H2) | Cell Signaling | Cat# 4499; RRID: AB 10544537 |
| CHIP/STUB1 (Poly) | Invitrogen | Cat# PA1-015; RRID: AB 2271290 |
| E6-AP (E6AP-330) | Sigma-Aldrich | Cat# E8655; RRID: AB 261956 |
| HectH9/HUWE1 (AX81) | Sigma-Aldrich | Cat# MAB10003; RRID: AB 827578 |
| p21 (12D1) | Cell Signaling | Cat# 2947; RRID: AB 823586 |
| NRF2(D1Z9C) | Cell Signaling | Cat# 12721; RRID: AB 2715528 |
| CDT1 (D10F11) | Cell Signaling | Cat# 8064; RRID: AB 10896851 |
| p27 (Y236) | Abeam | Cat# ab32034; RRID: AB 2244732 |
| CD3ε (D4V8L) | Cell Signaling | Cat# 99940; RRID: AB 2755035 |
| CD4 (D7D2Z) | Cell Signaling | Cat# 25229; RRID: AB 2798898 |
| F0XP3 (D6084) | Cell Signaling | Cat# 12653; RRID: AB 2797979 |
| CD8 (D4W2Z) | Cell Signaling | Cat# 98941; RRID: AB 2756376 |
| CD11c (D1V9Y) | Cell Signaling | Cat# 97585; RRID: AB 2800282 |
| F4/80 (D2S9R) | Cell Signaling | Cat# 70076; RRID: AB 2799771 |
| CD31 (D8V9E) | Cell Signaling | Cat# 77699; RRID: AB 2722705 |
| Calreticulin-AlexaFluor647 (EPR3924) | Abeam | Cat# ab196159; RRID: AB 2819061 |
| Rabbit lgG-AlexaFluor648 (EPR25A) | Abeam | Cat# ab199093; RRID: AB 2818935 |
| Rabbit IgG Control (Poly) | Cell Signaling | Cat# 3452; RRID: AB 10695811 |
| FITC B2M (B2M-01) | ThermoFisher | Cat# A15737; RRID: AB 10762969 |
| PE-Cy7 HLA-ABC (W6/32) | ThermoFisher | Cat# 25-9983-42; RRID: AB 2573570 |
| PE-Cy7 mouse lgG2K (Poly) | ThermoFisher | Cat# 25-4724-81; RRID: AB 470203 |
| FITC mouse lgG2a (Poly) | ThermoFisher | Cat# PA5-33239; RRID: AB 2550654 |
| Anti-Rabbit AlexaFluor488 (Poly) | Invitrogen | Cat# A-11034; RRID: AB 2576217 |
| Anti-Rabbit AlexaFluor594 (Poly) | Invitrogen | Cat# A-11012; RRID: AB 141359 |
| Anti-Mouse AlexaFluor594 (Poly) | Invitrogen | Cat# A-11005; RRID: AB 141372 |
| GolnVivo PD1 (29F1A12) | Biolegend | Cat# 135236; RRID: AB 2616837 |
| GolnVivo Rat IgG Control | Biolegend | Cat# 400559; RRID: AB 2819062 |
| Bacterial and Virus Strains | ||
| DH5α | Thermo Fisher Scientific | Cat#18258012 |
| DH10B | Thermo Fisher Scientific | Cat#18297010 |
| Biological Samples | ||
| Endometrial cancer patient samples | This study | N/A |
| Colorectal Cancer PDXs | (Katsiampoura et al., 2017) | N/A |
| Chemicals, Peptides, and Recombinant Proteins | ||
| MLN4924 | Selleck Chemicals | Cat# S7109 |
| MLN4924 | MedChem Express | Cat# HY-70062 |
| Cisplatin | Sigma | Cat# 232120 |
| Oxaliplatin | Selleck Chemicals | Cat# S1224 |
| 5-Fluorouracil | Selleck Chemicals | Cat# S1209 |
| Camptothecin | Sigma | Cat# C9911 |
| Thapsigargin | Enzo Life Sciences | Cat# BML-PE180-0001 |
| VER-155008 | Selleck Chemicals | Cat# S7751 |
| AUY-922 | Selleck Chemicals | Cat# S1069 |
| MG-132 | Sigma | Cat# C2211 |
| MLN7243 | Chemie Tek | Cat# CT-M7243 |
| Bortezomib | Selleck Chemicals | Cat# S10135MG |
| TrypLE Express | Invitrogen | Cat# 12605010 |
| Bgll | New England Biolabs | Cat# R0144S |
| Nsil | New England Biolabs | Cat# R0127S |
| BseR1 | New England Biolabs | Cat# R0581S |
| Critical Commercial Assays | ||
| Lipofectamine 3000 | Thermo Fisher Scientific | Cat# L3000015 |
| PrestoBlue | Thermo Fisher Scientific | Cat# A13262 |
| GeneJET Plasmid miniprep Kit | Thermo Fisher Scientific | Cat# K0502 |
| RNeasy Mini Kit | Qiagen | Cat #74106 |
| HumanHT-12 v4 Expression BeadChips | Illumina | Cat# 15011997 |
| iScript cDNA Synthesis Kit | BioRad | Cat# 1708891 |
| SYBR Select Master Mix | Applied Biosystems | Cat# 4472908 |
| NE-PER Nuclear and Cytoplasmic Extraction Reagents | Thermo Fisher Scientific | Cat# 78833 |
| Arcturus PicoPure DNA Extraction kit | Invitrogen | Cat# KIT0103 |
| ATP determination kit | Invitrogen | Cat# A22066 |
| NucleoSpin DNA RapidLyze | Macherey-Nagel | Cat# 740100 |
| Human XL Cytokine Array kit | R&D Systems | Cat# ARY022 |
| Mouse Cytokine Array Panel A | R&D Systems | Cat# ARY006 |
| SureSelectXT2 Human All Exon V6 Kit | Agilent | Cat# 5190-8872 |
| Opal 4-color IHC Kit | Perkin Elmer | Cat# NEL794001KT |
| ATP determination kit | Thermo Fisher Scientific | Cat# A22066 |
| Deposited Data | ||
| Microarray Transcriptome Data | This Paper | GSE119667 |
| RNAseq Transcriptome Data | This Paper | GSE119648 |
| Whole Exome Sequencing | This Paper | PRJNA587789 |
| TCGA Patient Data | TCGA Consortium | https://portal.gdc.cancer.gov/ |
| COSMIC/GDSC | (Yang et al., 2013) | https://www.cancerrxgene.org/ |
| CCLE | (Barretina et al., 2012) | https://portals.broadinstitute.org/ccle |
| CTRPv2 | (Seashore-Ludlow et al., 2015) | https://portals.broadinstitute.org/ctrp/ |
| Whole Proteome Thermal Stability Data | (Tan et al., 2018) | N/A |
| Additional colorectal cancer MLN4924 treatment data | (Picco et al., 2017) | N/A |
| Mutant protein binding data | (Sahni et al., 2015) | N/A |
| Protein crystal structure PDB files | RCSBPDB | http://www.rcsb.org, Table S3 |
| MSI patients treated with anti-PD1 | (Kim et al., 2018) | PRJEB25780 |
| Experimental Models: Cell Lines | ||
| MFE-296 | Sigma | Cat# 98031101-1VL |
| MFE-280 | Sigma | Cat# 98050131-1VL |
| KLE | ATCC | Cat# CRL-1622 |
| RL95-2 | ATCC | Cat# CRL-1671 |
| HCT-116 | MD Anderson CCLC | N/A |
| HCT116/5FUR | MD Anderson CCLC | N/A |
| HCT116/OXR | MD Anderson CCLC | N/A |
| HCT116 MLH1+/− | Horizon Discovery Limited | Cat# HD 104-006 |
| HCT116 pEYFP-C3-HA-Ubiquitin | This paper | N/A |
| RKO | MD Anderson CCLC | N/A |
| RKO/5FUR | MD Anderson CCLC | N/A |
| RKO/OXR | MD Anderson CCLC | N/A |
| HT-29 | MD Anderson CCLC | N/A |
| SW948 | ATCC | Cat# CRL-237 |
| 21B | This paper | N/A |
| MEC.PK | This paper | N/A |
| CT26 | MD Anderson CCLC | N/A |
| CT26 Msh2 KO-C19 | This paper | N/A |
| CT26 Msh2 KO-C29 | This paper | N/A |
| MCF-10A | ATCC | Cat# CRL-10317 |
| MCF-10A MSH2 KO | This paper | N/A |
| Peripheral blood mononuclear cells (PBMCs) | ZenBio | Cat# SER-PBMC-P-F |
| Experimental Models: Organisms/Strains | ||
| Balb/C Mice | Charles River | Strain Code: 028 |
| C57BL/6 | Charles River | Strain Code: 493 |
| NCI nude mouse strain Crl:NU(NCr)-Foxnnu/nu | Charles River | Strain Code: 490 |
| C57BL/6; Pgr-Cre | (Soyal et al., 2005) | N/A |
| C57BL/6; Msh2loxp/loxp | Jackson Labs | Stock No: 016231 |
| NOD.Cg-Prkdcscid Il2rgtm1Wjl/SzJ (NSG) mice | Jackosn Labs | Stock No: 005557 |
| Lox-stop-lox KrasG12D; PtenloxP/loxP | (Kim et al., 2010) | N/A |
| Oligonucleotides | ||
| HUWE1 siRNAI | Sigma | SASI_Hs02_00358777 |
| HUWE1 SiRNA2 | Sigma | SASI_Hs01_00101505 |
| NEDD4 siRNAI | Sigma | SASI_Hs01_00011348 |
| NEDD4 siRNA2 | Sigma | SASI Hs02 00340989 |
| NEDD4L siRNAI | Sigma | SASI_Hs01_00172292 |
| NEDD4L siRNA2 | Sigma | SASI_Hs01_00172293 |
| PRKN siRNAI | Sigma | SASI_Hs01_00041567 |
| PRKN siRNA2 | Sigma | SASI_Hs01_00041569 |
| RNF126 siRNAI | Sigma | SASI_Hs01_00212700 |
| RNF126 siRNA2 | Sigma | SASI_Hs01_00212701 |
| STUB1 siRNAI | Sigma | SASI_Hs01_00183572 |
| STUB1 siRNA2 | Sigma | SASI_Hs01_00183573 |
| SYVN1 siRNAI | Sigma | SASI_Hs01_00064900 |
| SYVN1 siRNA2 | Sigma | SASI_Hs01_00064902 |
| UBE3A siRNAI | Sigma | SASI_Hs01_00220607 |
| UBE3A siRNA2 | Sigma | SASI_Hs02_00302604 |
| UBE3B siRNAI | Sigma | SASI_Hs01_00090706 |
| UBE3B siRNA2 | Sigma | SASI_Hs02_00362756 |
| UBE3C siRNAI | Sigma | SASI_Hs01_00194874 |
| UBE3C siRNA2 | Sigma | SASI_Hs01_00194875 |
| UBQLN2 siRNAI | Sigma | SASI_Hs01_00115238 |
| UBQLN2 siRNA2 | Sigma | SASI_Hs01_00115239 |
| UBR1 siRNAI | Sigma | SASI_Hs02_00368829 |
| UBR1 siRNA2 | Sigma | SASI_Hs01_00102297 |
| UBR2 siRNAI | Sigma | SASI_Hs01_00131879 |
| UBR2 siRNA2 | Sigma | SASI_Hs01_00131883 |
| HSPA5 Forward Primer: 5’-TGTTCAACCAATTATCAGCAAACTC-3’ | Sigma | Custom synthesized |
| HSPA5 Reverse Primer: 5’-TTCTGCTGTATCCTCTTCACCAGT-3’ | Sigma | Custom synthesized |
| DDIT3 Forward Primer: 5’-AGAACCAGGAAACGGAAACAGA-3’ | Sigma | Custom synthesized |
| DDIT3 Reverse Primer: 5’-TCTCCTTCATGCGCTGCTTT-3’ | Sigma | Custom synthesized |
| sXBP1 Forward Primer: 5’-CTGAGTCCGAATCAGGTGCAG-3’ | Sigma | Custom synthesized |
| sXBP1 Reverse Primer: 5’-ATCCATGGGGAGATGTTCTGG-3’ | Sigma | Custom synthesized |
| B2M Forward Primer: 5’-ATCCATCCGACATTGAAGTT-3’ | Sigma | Custom synthesized |
| B2M Reverse Primer: 5’-GGCAGGCATACTCATCTTTT-3’ | Sigma | Custom synthesized |
| Universal Tag1-M13 Forward Primer (5’-GGCAGACGTGCCTCACTACTCCCAGTCACGA-CGTTGTAAAACG-3’) | Sigma | Custom synthesized |
| Universal Tag2-M13 Reverse Primer (5’-CTGAGCTTGACGCATTGCTAGTGTCTCAA-AATCTCTGATGTTAC-3’) | Sigma | Custom synthesized |
| Tag1 Fusion Primer (5’-GGCAGACGTGCCTCACTACT-3’) | Sigma | Custom synthesized |
| Tag 2 Fusion Primer (5’-CTGAGCTTGACGCATTGCTA-3’) | Sigma | Custom synthesized |
| Mouse Msh2 gRNA1 (5’-CGGCGACTTTTACACGGCGC-3’) | Sigma | Custom synthesized |
| Mouse Msh2 gRNA2 (5’-CGTGATCAAGTACATGGGGC-3’) | Sigma | Custom synthesized |
| Recombinant DNA | ||
| pEYFP-C3-HA-Ubiquitin | Gift from Michael Mancini (Addgene) | Cat #28236 |
| pLOC Control Viral Particles | MD Anderson Cancer Center Functional Genomics Core (Dharmacon) | N/A |
| pLOC HSPA8 Viral Particles | MD Anderson Cancer Center Functional Genomics Core (Dharmacon) | Dharmacon ORF ID PLOHS_100003775) |
| Mission MSH6 shRNA Lentiviral particles | Sigma | TRCN0000078543 |
| Mission MSH6 shRNA Lentiviral particles | Sigma | TRCN0000298603 |
| Mission MSH2 shRNA Lentiviral particles | Sigma | TRCN0000010384 |
| Mission MSH2 shRNA Lentiviral particles | Sigma | TRCN0000039670 |
| Mission MSH3 shRNA Lentiviral particles | Sigma | TRCN0000084059 |
| Mission MSH3 shRNA Lentiviral particles | Sigma | TRCN0000084062 |
| Mission MLH1 shRNA Lentiviral particles | Sigma | TRCN0000288641 |
| Mission MLH1 shRNA Lentiviral particles | Sigma | TRCN0000288642 |
| Mission shRNA Control Lentiviral particles | Sigma | SHC002 |
| pcDNA3.1-ccdB-3xFLAG-V5 | Gift from Mikko Taipale (Addgene) | Cat #87063 |
| M13mp18-UKY1 | (Gu et al., 2012) | Gift from Guo-Min Li |
| M13mp18-UKY2 | (Gu et al., 2012) | Gift from Guo-Min Li |
| pcDNA3.1-ccdB-3xFLAG-V5 AHSP WT | This Paper | N/A |
| pcDNA3.1-ccdB-3xFLAG-V5 AHSP c.212G>A | This Paper | N/A |
| pcDNA3.1-ccdB-3xFLAG-V5 ATOX1 WT | This Paper | N/A |
| pcDNA3.1-ccdB-3xFLAG-V5 AT0X1 c.121T>C | This Paper | N/A |
| pcDNA3.1-ccdB-3xFLAG-V5 AT0X1 C.610T | This Paper | N/A |
| pcDNA3.1-ccdB-3xFLAG-V5 BLVRAWT | This Paper | N/A |
| pcDNA3.1-ccdB-3xFLAG-V5 BLVRA c.238C>T | This Paper | N/A |
| pcDNA3.1-ccdB-3xFLAG-V5 BLVRA c.296C>G | This Paper | N/A |
| pcDNA3.1-ccdB-3xFLAG-V5 DYNLL1 WT | This Paper | N/A |
| pcDNA3.1-ccdB-3xFLAG-V5 DYNLL1 c.263C>T | This Paper | N/A |
| pcDNA3.1-ccdB-3xFLAG-V5 EX0SC7 WT | This Paper | N/A |
| pcDNA3.1-ccdB-3xFLAG-V5 EX0SC7 c.370C>A | This Paper | N/A |
| pcDNA3.1-ccdB-3xFLAG-V5 HNMT WT | This Paper | N/A |
| pcDNA3.1-ccdB-3xFLAG-V5 HNMT c.514G>T | This Paper | N/A |
| pcDNA3.1-ccdB-3xFLAG-V5 PLN WT | This Paper | N/A |
| pcDNA3.1-ccdB-3xFLAG-V5 PLN c.62C>T | This Paper | N/A |
| pcDNA3.1-ccdB-3xFLAG-V5 PTS WT | This Paper | N/A |
| pcDNA3.1-ccdB-3xFLAG-V5 PTS c.259C>T | This Paper | N/A |
| pcDNA3.1-ccdB-3xFLAG-V5 S100A1 WT | This Paper | N/A |
| pcDNA3.1-ccdB-3xFLAG-V5 S100A1 c.166G>T | This Paper | N/A |
| pcDNA3.1-ccdB-3xFLAG-V5 S100A1 c.112C>A | This Paper | N/A |
| pcDNA3.1-ccdB-3xFLAG-V5 S100A4 WT | This Paper | N/A |
| pcDNA3.1-ccdB-3xFLAG-V5 S100A4 c.197G>T | This Paper | N/A |
| pcDNA3.1-ccdB-3xFLAG-V5 SF3B5 WT | This Paper | N/A |
| pcDNA3.1-ccdB-3xFLAG-V5 SF3B5 c.130A>T | This Paper | N/A |
| pcDNA3.1-ccdB-3xFLAG-V5 SUPT4H1 WT | This Paper | N/A |
| pcDNA3.1-ccdB-3xFLAG-V5 SUPT4H1 c.37C>A | This Paper | N/A |
| pcDNA3.1-ccdB-3xFLAG-V5 TIMM 10 WT | This Paper | N/A |
| pcDNA3.1-ccdB-3xFLAG-V5 TIMM 10 c.56C>T | This Paper | N/A |
| Software and Algorithms | ||
| ImageJ | NIH | https://imagej.nih.gov/ij/ |
| Matlab 2019a | Mathworks | https://www.mathworks.com/ |
| FlowJo v10.6.1 | FlowJo, LLC | https://www.flowjo.com/ |
| GraphPad Prism 8 | GraphPad | https://www.graphpad.com/ |
| FoldX | (Schymkowitz et al., 2005) | http://foldxsuite.crg.eu/ |
| NIS-Elements Advanced Research | Nikon | https://www.microscope.healthcare.nikon.com/ |
| Peak Scanner v1 | Thermo Fisher Scientific | Cat#: 4381867 |
| Genome Studio v2011.1.0.24550 | lllumina | https://www.illumina.com/ |
| GATK (v4.1.2) | (Van der Auwera et al., 2013) | https://software.broadinstitute.org/gatk/ |
| BWA-MEM (vO.7.17) | (Li, 2013) | https://github.eom/lh3/bwa |
| Vectra in Form v2 | Perkin Elmer | N/A |
| R V3.6.1 | The R Foundation | https://www.r-project.org/ |
| ggplot2 v3.2.1 | (Wickham, 2016) | https://ggplot2.tidyverse.org/ |
| Other | ||
Cellular thermal shift assays for protein stability and transient transfections.
Protein stability was measured by thermal shift assays, in which less stable proteins denature at lower temperatures resulting in loss of solubility (Molina et al., 2013). For these assays, 106 cells were suspended in 1 mL of PBS supplemented with 2× protease inhibitors, and lysed by 3 freeze-thaw cycles in liquid nitrogen. For analysis of PDXs and primary patient samples, a tumor fragment was pulverized with a dounce homogenizer, drawn through a 21G needle, and then filtered through a 70 μm filter before further lysis by freeze-thawing as above. Lysates were cleared by centrifugation (14,000 ref for 30 minutes at 4°C), and divided into eight 100 μL aliquots, which were then heated in a gradient thermocycler at 37, 38.7, 41.6, 46.4, 52.1, 56.7, 59.9, or 62°C for 10 minutes. Lysates were then cleared again by centrifugation (14,000 ref for 30 minutes at 4°C) and the resulting supernatants recovered. For whole proteome analysis, supernatant protein concentrations were measured by BCA. For analysis of mutant protein stability, HCT-116 cells were transfected with FLAG-tagged WT or mutant constructs using Lipofectamine 3000, per the manufacturer’s instructions. Relative protein levels were assessed by dot-blotting and probing with an anti-FLAG antibody (Sigma anti-FLAG M2). As thermal melting curves were not uniformly sigmoidal and did not always reach 50% denaturation, it was difficult to determine an accurate melting temperature (Tm). Therefore, protein stability was characterized by calculating the area under the melt curve (AUC), with higher values indicating higher protein stability.
Insoluble ubiquitin aggregates and cell fractionation.
Isolation of insoluble ubiquitin aggregates was performed as described (Hjerpe et al., 2016) with minor modifications. Cells were harvested by trypsinization either under normal growth conditions, or following 24 hour treatment with 1 μM MLN4924 (Selleck Chemicals) or vehicle control (DMSO). In some experiments, 24 hours prior to drug treatment cells were transfected with siRNA (Sigma) using Lipofectamine 3000 per manufacturer’s instructions. Product numbers for siRNAs used are given in the Key Resources Table. Cells were sheared by passage through a 23G needle in stringent lysis buffer (25 mM Tris, 150 mM NaCl, 1% NP-40, and 1% sodium deoxycholate supplemented with 2x protease inhibitors) for 15 minutes on ice. Lysates were cleared by centrifugation (14,000 ref for 15 minutes at 4°C) and the supernatants transferred to a new tube. Pellets were washed 3x in cold PBS supplemented with 0.1% Triton X-100 and 2x protease inhibitors. Protein concentrations for soluble fractions were determined by BCA. Insoluble pellets were dissolved in Laemmli sample buffer. Soluble fraction volumes were adjusted to the same protein concentration. Finally, equal volumes of supernatant/insoluble fraction were loaded onto 8% polyacrylamide SDS-PAGE gels prior to separation by electrophoresis and subsequent western blotting. Relative amounts of aggregated ubiquitin or Nedd8 were determined in ImageJ by comparing the ubiquitin signal intensity of the insoluble to soluble fractions. For analysis of FLAG-tagged BLVRA variants, the above protocol was followed except the lysis buffer also contained 0.1% SDS and proteins were separated on a 10% gel before probing for FLAG.
Generation of HCT-116 cells with stable pEYFP-C3-HA-Ubiquitin or HSPA8 overexpression.
For HSPA8 overexpression, precision LentiORF viral particles from the pLOC vector (Dharmacon) were obtained from the MD Anderson Cancer Center Functional Genomics core facility. Cells were infected at an MOI of 40 in the presence of 8 μg/mL hexadimethrene bromide. Stable cells were selected in puromycin for further study. pEYFP-C3-HA-Ubiquitin was a gift from Michael Mancini (Addgene plasmid # 28236) (Stenoien et al., 2002). For stable expression of pEYFP-C3-HA-Ubiquitin, plasmid DNA was isolated using the GeneJET Plasmid miniprep Kit (Thermo Scientific) and then cells were transfected using Lipofectamine 3000, both per manufacturer’s instructions. Stable cells were selected in G418 for further study.
Immunofluorescence microscopy and image quantification.
For dual staining FLAG-tagged constructs and Nedd8, HCT-116 cells were transfected with desired constructs and treated with either DMSO, 1 μM MLN4924 (Selleck Chemicals), or 100 nM MLN7243 24 hours later, then incubated for an additional 24 hours. Cells were either directly fixed in neutral buffered formalin or pre-extracted in hypotonic stripping buffer (10mM HEPES, 1% Triton XI00, 10mM NaCl, 3mM MgC12, pH 7.4) prior to fixation. Cells were permabilized with 1% Triton X100 + 0.1% SDS, blocked in normal horse serum, and then stained overnight in anti-FLAG M2 (Sigma) and anti-Nedd8 (Cell Signaling) at 4°C. The following day, secondary antibodies anti-rabbit AlexaFluor 488 and anti-mouse AlexaFluor 594 were incubated for 1 hour at room temperature. For visualization of ubiquitin and Nedd8, the same procedure was followed except using HCT-116 cells stably expressing pEYFP-C3-HA-Ubiquitin and using anti-rabbit AlexaFluor 594 for detection of Nedd8. To quantify fraction of positive cells, a semi-automated MATLAB (R2019a) algorithm was utilized to automatically segment nuclei as described (McGrail et al., 2018b), and then number of cells positive for BLVRA were counted manually for each image.
Denaturing Immunoprecipitation.
Following treatment with DMSO, 1 μM MLN4924 (Selleck Chemicals), or 100 nM MLN7243 for 24 hours, cells were harvested by trypsinization, washed with PBS, and lysed in buffer DLB (50 mM Tris-Cl and 2% SDS with 5 mM DTT and protease inhibitors added fresh) with rotation for 20 minutes at 4°C. DNA was sheared by sonication to reduce viscosity. Samples were heated at 95°C for 10 minutes. Lysates were cleared by centrifugation, and then diluted 20-fold in DNB (50 mM Tris-Cl, 150 mM NaCl, 5 mM EDTA, 1% NP-40, and 0.5% sodium dodecyl sulfate with fresh protease inhibitors). Lysates were pre-cleared with protein A/G beads (Santa Cruz), and then incubated overnight with desired antibodies or corresponding IgG controls at 4°C with rotation. The following day lysates were incubated with protein A/G beads 4°C with rotation for 2 hours, washed extensively in DNB, and eluted by boiling in 2x Laemmli sample buffer.
Pharmacological proteome destabilization.
Pharmacological proteome destabilization of MSS cell lines was accomplished by treatment with 1 μM thapsigargin (Enzo), 1 μM VER-155008 (HSP70i) (Selleckchem), 1 μM AUY-922 (HSP90i) (Selleckchem), or with 500 nM MG-132 (Selleckchem). Concentrations were selected that resulted in no more than 10% loss of viability. For thermal stability assays, cells were treated for 24 hours with the specified inhibitors or with DMSO as a control. For viability experiments, cells were treated with the specified inhibitors together with serially diluted MLN4924 (Selleck Chemicals) or with a DMSO vehicle control for 3 days. Viability was normalized to treatment with the destabilizing agent.
qRT-PCR
Cells were treated as desired before isolating RNA with an RNeasy Mini Kit (Qiagen) and cDNA synthesis with iScript (BioRad). Gene expression was detected using Sybr Select MasterMix (Applied Biosystems), and normalized to B2M internal control.
ATP release assay.
Cells (5×10⁵) were seeded in 6-well plates and allowed to adhere overnight. The following day, wells were treated with MLN4924 (Selleck Chemicals, 0.1 μM or 1.0 μM), camptothecin (10 μM) (Selleckchem), cisplatin (10 μM) (Selleckchem), a combination of 100 μM 5-fluorouracil (5-FU; Selleckchem) and 10 μM oxaliplatin (Selleckchem), or with the DMSO solvent control for 24 hours. Supernatants were harvested, cells cleared by centrifugation, and ATP quantified using the Invitrogen Molecular Probes ATP determination kit per the manufacturer’s instructions.
Flow cytometry for surface calreticulin and MHC quantification.
Cells were prepared as described for the ATP release assay and then harvested with TrypLE Express (Invitrogen). Cells were washed with cold FACS buffer (PBS with 2% FBS, 2 mM EDTA), followed by resuspension of 106 cells in 100 μL cold FACS buffer. For surface calreticulin analysis, each sample was stained with 0.75 μg rabbit anti-calreticulin (clone EPR3924, ABCAM) or with the relevant IgG control for 40 minutes on ice. For surface MHC analysis, cells were stained with 0.5 μg mouse PE-Cy7 anti-HLA-ABC (clone W6/32, ThermoScientific) and 5 μg mouse FITC anti-B2M (clone B2M-01, ThermoScientific) or IgG controls (PE-Cy7 mouse IgG2κ and FITC mouse IgG2a, ThermoScientific). After washing thrice with cold FACS buffer, cells were analyzed by flow cytometry. Values are reported as relative fluorescence intensity normalized to DMSO after the subtraction of IgG signal as background. Cells were gated by FSC-H vs FSC-A for singlets and FSC-A vs SSC-A for size as shown in Supplementary Figure 7A. Single color controls were used for compensation. All analysis was performed in FlowJo (vlO.6.1).
Quantification of soluble factors by ELISA.
HCT-116, MFE-296, CT-26 Msh2 KO, and 21B Msh2-null cells were seeded at 5×l05 cells in 6-well tissue culture plates and allowed to adhere overnight. Cells were then treated with either 1 μM MLN4924 or DMSO (control) in 2 mL of growth medium for 24 hours. The supernatants were collected, and the particulates removed by centrifugation. A Human XL Cytokine Array kit (R&D Systems) was used for HCT-116 and MFE-296 cells, whereas a Mouse Cytokine Array Panel A (R&D Systems) measured cytokine secretion from CT-26 Msh2 KO, and 21B Msh2-null cells. Samples were prepared and the ELISAs were processed in accordance with the manufacturer’s instructions. After reference spot normalization, duplicate spots were averaged, followed by subtraction of an averaged background signal. Fold changes between corresponding signals of MLN4924-treated versus DMSO-treated arrays per cell line were calculated. Cytokines represented in both human and mouse arrays were log2-transformed and subjected to unsupervised clustering.
Immune cell migration assay.
Peripheral blood mononuclear cells were acquired from ZenBio and used to perform transwell migration assays as previously described (McGrail et al., 2018a), with minor modifications. Cells were pre-treated for 12 hours with 1 μM MLN4924 or DMSO (control) in growth media, washed l× in serum-free medium, and then cultured in serum-free medium containing MLN4924 or DMSO for an additional 24 hours before harvesting the medium. Supernatants from DMSO-treated cells were supplemented with MLN4924 to mitigate any confounding effects of residual drug.
MLN4924 monotherapy xenograft studies.
Tumor cells were injected subcutaneously into the flank of 8–10 week old, athymic, NCI nude mouse strain NCr-nu/nu (Charles River). For HCT116 xenograft studies 1×10⁶ cells were injected, but 2×10⁶ cells were used for all other cell lines. Female mice were used for endometrial cancer xenograft experiments. For colorectal cancer studies, 50% of the mice were male and 50% were female. When tumors reached approximately 150 mm3, calculated as (length × width2)/2, mice were randomized to treatment [60 mg/kg MLN4924 (MedChem Express) dissolved in 10% β-cyclodextrin (pH 6.5; Sigma)], or vehicle control arms. All treatments were injected intraperitoneally. Mice were treated twice weekly on the 1st and 2nd day of the week. Tumor sizes and mouse weights were monitored over the course of treatment. Most mouse measurements were performed by investigators blinded to treatment group.
Generation of the Msh2-null 21B cell line and MEC.PK cell line.
A small piece of uterine tumor (approximately 3 mm2) was dissected from each of two Msh2 conditional knock out mice (C57B1/6; Pgr-Cre; Msh2loxP/loxP). The tumor tissue was minced finely and placed into culture. Cells were fed with DMEM supplemented with 10% fetal calf serum in the presence of antibiotics and antimycotics. Initially, fibroblasts were regularly removed using a sterile glass rod, allowing the epithelial cancer cells to establish. Colonies of cancer cells were sub-cloned and expanded. Once established, epithelial cells were passaged more than 50 times to ensure cell line viability and homogeneity. Equivalent procedures were followed for MEC.PK, but using the Pgr-Cre to drive deletion of Pten and expression of oncogenic Kras as previously described (Kim et al., 2010).
Characterization of the Msh2-null 21B cell line.
Loss of Msh2 protein was confirmed by western blotting of cell line lysates. In order to verify growth in immunocompetent mice, two million cells were injected intraperitoneally into 8 week old female C57BL/6 mice. Mice injected with Msh2-null 21B cells were euthanized at 6 weeks, at which time 100% of mice (5/5) had developed large, firm abdominal tumors. Hematoxylin and eosin staining was used to verify histological similarity to human disease. Total RNA was extracted in biological triplicates using an RNeasy Mini Kit, per the manufacturer’s instructions (Qiagen). Library preparation and RNA sequencing was performed at the MD Anderson Sequencing and Microarray Facility. RNA-seq quantification was performed using Kallisto v0.43 (Bray et al., 2016). MMR functional activity was performed as described above. Microsatellite instability (MSI) status was analyzed using tissue from the Pgr-Cre; Msh2loxP/loxP Msh2 KO mouse of origin. Normal or tumor tissue was macrodissected from 10 μm FFPE sections and DNA was isolated using an Arcturus PicoPure DNA Extraction kit (Thermo Fisher Scientific, Vilnius, Lithuania). A panel of 6 microsatellite markers (mBat-24, mBat-26, mBat-30, mBat-37, mBat-59, mBat-64) were evaluated, as described (Bacher et al., 2005). PCR products were analyzed on an ABI Prism Genescan platform by the MD Anderson Sequencing and Microarray Facility and Peak Scanner vl software (Thermo Fisher Scientific). Using a six marker panel, the criteria for MSI-H is as follows: MSS (0% markers showing MSI), MSI-L (1–29% of markers have MSI), and MSI-H (30% or more of the markers tested have MSI). The original 21B mouse tumor used to generate the 21B cell line was positive for 4/6 markers (66%) compared to normal tissue from the mouse of origin, resulting in a MSI-H status.
Antitumor vaccination and endogenous antibody detection.
Mouse immunization with dying tumor cells was performed as described to detect immunogenic cell death (Kepp et al., 2014; Obeid et al., 2007). The 21B Msh2-null cell line was treated for 24 hours with 1 μM MLN4924 or with 10 μM cisplatin, and then 2×10⁶ cells were inoculated subcutaneously in the flank of 8–10-week-old female C57/B16 mice (Charles River) (n=10 per group). An additional 10 mice were sham-injected with PBS alone (no exposure to tumor cells). Seven days later, blood was drawn and then 5×10⁵ 21B cells were injected into the opposite flank. Serum was isolated for detection of antibodies against the 21B cell line (Moynihan et al., 2016). Lysates (60 μg) of 21B cells were separated by electrophoresis on 8% polyacrylamide gels, transferred to nitrocellulose membranes, blocked in milk, and then probed with mouse serum at a 1:200 dilution in 5% BSA, overnight at 4°C. The following day, membranes were washed and probed with horseradish peroxidase (HRP) conjugated α-mouse IgG. A control without serum was included to control for any endogenous antibody production. Both membranes were probed simultaneously to ensure equal exposure times.
Immunocompetent mouse tumor study.
The 21B Msh2-null cell line was injected subcutaneously into the right flank of 8-week-old female C57/B16 mice at 5×10⁵ cells per mouse. The CT26 Msh2 KO and CT26 parental cell lines were injected into equal numbers of male and female 8-week-old Balb\C mice at 1×10⁶ and 1×10⁵ cells per mouse, respectively. After tumors had reached ~150 mm, mice were randomized and treatments were initiated. MLN4924 (MedChem Express, 60 mg/kg) or 10% β-cyclodextrin vehicle control was administered on on days 1 and 3. Anti-PDl (GoInVivo clone 29F1A12; Biolegend) or IgG control (GoInVivo clone RTK2758; Biolegend) were administered on days 1, 3, and 5. Mice with 21B tumors were treated with 250 μg per mouse of anti-PDl or IgG control. Mice with CT26 or CT26 Msh2 KO tumors were treated with 100 μg per mouse of anti-PDl or IgG control. Treatment with respective controls, monotherapies, or combination therapy was continued for four weeks at which point treatment was stopped. Complete responses were defined as no tumor re-growth 6 months after therapy cessation.
Tissue multispectral staining and image quantification.
Slides were stained using Opal 4-color IHC Kit (NEL794001KT) from Perkin Elmer along with primary antibodies from Cell Signaling Technology for CD3 (clone D4V8L), CD4 (clone D7D2Z), FoxP3 (clone D608R), CD8 (clone D4W2Z), CDllc (clone D1V9Y), F4/80 (clone D2S9R), and CD31 (clone D8V9E). Formalin-fixed paraffin embedded tissues were sectioned, deparaffinized in xylene, and rehydrated through an ethanol gradient. Microwave treatment was applied to perform antigen retrieval, quench endogenous peroxidases, and remove antibodies from earlier staining procedures. Perkin Elmer AR6 Antigen retrieval buffer (pH 6) was used for all antibodies. The slides were scanned with the VECTRA image scanning system (Perkin Elmer), and signals were unmixed into a composite image with Vectra inForm software. For each tumor model, 5 independent tumors were imaged with at least 10 images per slide from arbitrary fields of view. Images showing significant necrosis were not used for analysis. Final quantification was performed using custom MATLAB scripts.
Analysis of UPR Activation in patients with MSI tumors treated with anti-PDl.
Gene expression, MSI status, and patient response to anti-PDl were acquired from Kim et. al. (PRJEB25780) (Kim et al., 2018). The average z-normalized expression of CHOP (DDIT3), XBP1 (XBP1), and BiP (HSPA5) was taken as UPR gene expression score. Relationship between UPR score and reponse (PD/PR/CR) was evaluated using Jonckheere trend test.
QUANTIFICATION AND STATISTICAL ANALYSIS
Statistics.
Significance for normally distributed data was determined by Student’s t-test (two groups) or by ANOVA with appropriate post-hoc tests. For data that was not normally distributed, a rank-sum test (two groups) or a Kruskal-Wallis test with an appropriate post-hoc test was used. Survival data was quantified by log-rank test. Statistical comparisons were performed either in Matlab R2019a or GraphPad Prism 8.
DATA AND SOFTWARE AVAILABILITY
Microarray transcriptome data from dMMR model cell lines was deposited under GSE119667 and RNAseq transcriptome data for mouse cell lines was deposited under GSE119648. Whole exome sequencing data are deposited under PRJNA5 87789. Level 4 RNA-seq gene expression data was acquired through the TCGA data portal, along with corresponding MSI statuses for UCEC, COAD, and STAD. Cell line gene expression data was obtained through CCLE (Barretina et al., 2012). Mutational signatures, as well as cell line MSI statuses and mutation calls were obtained through COSMIC/GDSC (Yang et al., 2013). Drug sensitivity data was acquired obtained from CTRPv2 (Seashore-Ludlow et al., 2015). Additional MLN4924 sensitivty data for 122 colorectal cancer cell lines treated with MLN4924 was obtained from the publication’s supplemental data (Picco et al., 2017). Raw thermal stability data was from Tan (Tan et al., 2018), and mutation profiles for HCT-116, MCF7, and A375 cells were acquired from GDSC (Yang et al., 2013). Mutant protein binding data were obtained from our previous study (Sahni et al., 2015). High-quality (>95% sequence identity) crystal structures were obtained from RSCB PDB (Berman et al., 2000) (Table S3, www.rcsb.org)
Supplementary Material
Highlights.
Abundant destabilizing mutations lead to proteome instability in MSI cancers
MSI cancers rely on Nedd8-mediated clearance of destabilized/misfolded proteins
Inhibiting neddylation with MLN4924 induces immunogenic cell death
Potentiating MLN4924 therapy’s immunogenicity with anti-PDl provides potent synergy
SIGNIFICANCE.
The MMR deficient hypermutator phenotype, commonly diagnosed by microsatellite instability (MSI), accounts for a significant fraction of endometrial, colorectal, and gastric tumors. MMR deficient/MSI cancers display resistance to chemotherapeutic regimens and only a subset responds to immunotherapy, leaving a large patient population with few treatment options. Here, we identify proteome instability as a novel therapeutic vulnerability in MSI tumors. Importantly, targeting proteome instability through MLN4924 treatment enhances the immunogenicity of MSI tumors, leading to therapeutic potentiation when combined with PD1 inhibition, even in tumors that show minimal response to anti-PDl monotherapy. Therefore, combining MLN4924 therapy with immune checkpoint blockade may maximize the depth and duration of clinical responses in MSI patients.
ACKNOWLEDGEMENTS
Funding was provided by T32CA186892 to D.J.M., R01 CA218287 to S-Y.L, a Developmental Research Program grant to S-Y.L under the MD Anderson Uterine Cancer Specialized Programs of Research Excellence (SPORE) in Uterine Cancer (P50CA098258, Pis K.H.L. and R.B.), D.J.H.S. is supported by a training fellowship from the Gulf Coast Consortia, on the Computational Cancer Biology Training Program (CPRIT Grant No. RP170593), N.S. is a CPRIT Scholar in Cancer Research with funding from the Cancer Prevention and Research Institute of Texas (CPRIT) New Investigator Grant RR160021 and Alfred P. Sloan Research Fellowship FG-2018-10723, as well as U01CA217842 (PI G.B.M.). Funding to M.S.Y. was provided by R01 CA216103 and the Roberta Detz Endometrial Cancer Research Grant from the Foundation for Women’s Cancer. We thank Yiling Lu, M.D., for ensuring that the cell lines used in this publication were appropriately authenticated and mycoplasma-free, Guo-Min Li, Ph.D, UT Southwestern for providing us with the bacteriophages used in the MMR functional assays, and Briana Dennehey, Ph.D., for critically reading and editing the manuscript. We are grateful to many MD Anderson Cancer Center core facilities funded by grant CAO 16672: the Functional Genomics Core (shRNA and ORFeome Core) for reagents and technical assistance, the Characterized Cell Line Core for STR DNA fingerprinting, the Sequencing and Microarray Facility (SMF) for transcriptome analysis, the High Throughput Genotyping Core for scanning Illumina BeadChips, the CRISPR Core for cell line generation, and the Research Animal Support Facility. The results here are in whole or part based upon data generated by the TCGA Research Network: http://cancergenome.nih.gov/.
G.B.M. consults with AstraZeneca, ImmunoMET, Ionis, Nuevolution, PDX bio, Signalchem, Symphogen, and Tarveda, has stock options with Catena Pharmaceuticals, ImmunoMet, SignalChem, Spindle Top Ventures, and Tarveda, sponsored research from AstraZeneca, Immunomet, Pfizer, Nanostring, and Tesaro, travel support from Chrysallis Bio, and has licensed technology to Nanostring and Myriad Genetics.
Footnotes
DECLARATION OF INTERESTS
No other authors declare competing interests.
Publisher's Disclaimer: This is a PDF file of an unedited manuscript that has been accepted for publication. As a service to our customers we are providing this early version of the manuscript. The manuscript will undergo copyediting, typesetting, and review of the resulting proof before it is published in its final form. Please note that during the production process errors may be discovered which could affect the content, and all legal disclaimers that apply to the journal pertain.
REFERENCES
- Alexandrov LB, Nik-Zainal S, Wedge DC, Aparicio S.a J.R., Behjati S, Biankin AV, Bignell GR, Bolli N, Borg A, Borresen-Dale A-L, et al. (2013). Signatures of mutational processes in human cancer. Nature 500, 415–421. [DOI] [PMC free article] [PubMed] [Google Scholar]
- Van Allen EM, Miao D, Schilling B, Shukla SA, Blank C, Zimmer L, Sucker A, Hillen U, Geukes Foppen MH, Goldinger SM, et al. (2015). Genomic correlates of response to CTLA-4 blockade in metastatic melanoma. Science (80-,). 350, 207–211. [DOI] [PMC free article] [PubMed] [Google Scholar]
- Alspach E, Lussier DM, Miceli AP, Kizhvatov I, DuPage M, Luoma AM, Meng W, Lichti CF, Esaulova E, Vomund AN, et al. (2019). MHC-II neoantigens shape tumour immunity and response to immunotherapy. Nature 574. [DOI] [PMC free article] [PubMed] [Google Scholar]
- Van der Auwera GA, Carneiro MO, Hartl C, Poplin R, del Angel G, Levy-Moonshine A, Jordan T, Shakir K, Roazen D, Thibault J, et al. (2013). From fastQ data to high-confidence variant calls: The genome analysis toolkit best practices pipeline. Curr. Protoc. Bioinforma 43, 11.10.1–11.10.33. [DOI] [PMC free article] [PubMed] [Google Scholar]
- Bacher JW, Abdel Megid WM, Kent-First MG, and Halberg RB. (2005). Use of mononucleotide repeat markers for detection of microsatellite instability in mouse tumors. Mol. Carcinog 44, 285–292. [DOI] [PubMed] [Google Scholar]
- Barretina J, Caponigro G, Stransky N, Venkatesan K, Margolin A.a, Kim S, Wilson CJ, Lehár J, Kryukov GV, Sonkin D, et al. (2012). The Cancer Cell Line Encyclopedia enables predictive modelling of anticancer drug sensitivity Supp. Nature 483, 603–607. [DOI] [PMC free article] [PubMed] [Google Scholar]
- Bass AJ, Thorsson V, Shmulevich I, Reynolds SM, Miller M, Bernard B, Hinoue T, Laird PW, Curtis C, Shen H, et al. (2014). Comprehensive molecular characterization of gastric adenocarcinoma. Nature 513, 202–209. [DOI] [PMC free article] [PubMed] [Google Scholar]
- Berman HM, Westbrook J, Feng Z, Gilliland G, Bhat TN, Weissig H, Shindyalov IN, and Bourne PE (2000). The Protein Data Bank. Nucleic Acids Res. 28, 235–242. [DOI] [PMC free article] [PubMed] [Google Scholar]
- Bonneville R, Krook MA, Kautto EA, Miya J, Wing MR, Chen H-Z, Reeser JW, Yu L, and Roychowdhury S. (2017). Landscape of Microsatellite Instability Across 39 Cancer Types. JCO Precis. Oncol 1–15. [DOI] [PMC free article] [PubMed] [Google Scholar]
- Bray NL, Pimentel H, Melsted P, and Pachter L. (2016). Near-optimal probabilistic RNA-seq quantification. Nat. Biotechnol 34, 525–527. [DOI] [PubMed] [Google Scholar]
- Broom A, Jacobi Z, Trainor K, and Meiering EM (2017). Computational tools help improve protein stability but with a solubility tradeoff. J. Biol. Chem 292, 14349–14361. [DOI] [PMC free article] [PubMed] [Google Scholar]
- Choi YY, Bae JM, An JY, Kwon IG, Cho I, Shin HB, Eiji T, Aburahmah M, Kim H Il, Cheong JH., et al. (2014). Is microsatellite instability a prognostic marker in gastric cancer?: A systematic review with meta-analysis. J. Surg. Oncol 110, 129–135. [DOI] [PubMed] [Google Scholar]
- Denoyelle C, Abou-Rjaily G, Bezrookove V, Verhaegen M, Johnson TM, Fullen DR, Pointer JN, Gruber SB, Su LD, Nikiforov MA, et al. (2006). Anti-oncogenic role of the endoplasmic reticulum differentially activated by mutations in the MAPK pathway. Nat. Cell Biol 8, 1053–1063. [DOI] [PubMed] [Google Scholar]
- Galluzzi L, Buqué A, Kepp O, Zitvogel L, and Kroemer G. (2017). Immunogenic cell death in cancer and infectious disease. Nat. Rev. Immunol 17, 97–111. [DOI] [PubMed] [Google Scholar]
- Getz G, Gabriel SB, Cibulskis K, Lander E, Sivachenko A, Sougnez C, Lawrence M, Kandoth C, Dooling D, Fulton R, et al. (2013). Integrated genomic characterization of endometrial carcinoma. Nature 497, 67–73. [DOI] [PMC free article] [PubMed] [Google Scholar]
- Goodman AM, Kato S, Bazhenova L, Patel SP, Frampton GM, Miller V, Stephens PJ, Daniels GA, and Kurzrock R. (2017). Tumor Mutational Burden as an Independent Predictor of Response to Immunotherapy in Diverse Cancers. Mol. Cancer Ther 16, molcanther.0386.2017. [DOI] [PMC free article] [PubMed] [Google Scholar]
- Gu L, Ensor CM, and Li G-M (2012). In vitro DNA mismatch repair in human cells. Methods Mol. Biol 920, 135–147. [DOI] [PubMed] [Google Scholar]
- Guastadisegni C, Colafranceschi M, Ottini L, and Dogliotti E. (2010). Microsatellite instability as a marker of prognosis and response to therapy: A meta-analysis of colorectal cancer survival data. Eur. J. Cancer 46, 2788–2798. [DOI] [PubMed] [Google Scholar]
- Guinney J, Dienstmann R, Wang X, deReynies A, Schlicker A, Soneson C, Marisa L, Roepman P, Nyamundanda G, Angelino P, et al. (2015). The consensus molecular subtypes of colorectal cancer. Nat. Med 21, 1350–1356. [DOI] [PMC free article] [PubMed] [Google Scholar]
- Hause RJ, Pritchard CC, Shendure J, and Salipante SJ (2016). Classification and characterization of microsatellite instability across 18 cancer types. Nat. Med 22. [DOI] [PubMed] [Google Scholar]
- Hellmann MD, Callahan MK, Awad MM, Calvo E, Ascierto PA, Atmaca A, Rizvi NA, Hirsch FR, Selvaggi G, Szustakowski JD, et al. (2018a). Tumor Mutational Burden and Efficacy of Nivolumab Monotherapy and in Combination with Ipilimumab in Small-Cell Lung Cancer. Cancer Cell 33, 853–861.e4. [DOI] [PMC free article] [PubMed] [Google Scholar]
- Hellmann MD, Nathanson T, Rizvi H, Creelan BC, Sanchez-Vega F, Ahuja A, Ni A, Novik JB, Mangarin LMB, Abu-Akeel M, et al. (2018b). Genomic Features of Response to Combination Immunotherapy in Patients with Advanced Non-Small-Cell Lung Cancer. Cancer Cell 33, 843–852.e4. [DOI] [PMC free article] [PubMed] [Google Scholar]
- Hellmann MD, Ciuleanu T-E, Pluzanski A, Lee JS, Otterson GA, Audigier-Valette C, Minenza E, Linardou H, Burgers S, Salman P, et al. (2018c). Nivolumab plus Ipilimumab in Lung Cancer with a High Tumor Mutational Burden. N. Engl. J. Med 378, NEJMoal801946. [DOI] [PMC free article] [PubMed] [Google Scholar]
- Hjerpe R, Bett JS, Keuss MJ, Knebel A, Marchesi F, Kurz T, Hjerpe R, Bett JS, Keuss MJ, Solovyova A, et al. (2016). UBQLN2 Mediates Autophagy-Independent Protein Aggregate Clearance by the Proteasome Article UBQLN2 Mediates Autophagy-Independent Protein Aggregate Clearance by the Proteasome. Cell 166, 1–15. [DOI] [PMC free article] [PubMed] [Google Scholar]
- Hossain DMS, Javaid S, Cai M, Zhang C, Sawant A, Hinton M, Sathe M, Grein J, Blumenschein W, Pinheiro EM, et al. (2018). Dinaciclib induces immunogenic cell death and enhances anti-PDl–mediated tumor suppression. J. Clin. Invest 128, 644–654. [DOI] [PMC free article] [PubMed] [Google Scholar]
- Kajiwara Y, Panchabhai S, and Levin VA (2008). A New Preclinical 3-Dimensional Agarose Colony Formation Assay. Technol. Cancer Res. Treat 7, 329–334. [DOI] [PubMed] [Google Scholar]
- Katsiampoura A, Raghav K, Jiang Z-Q, Menter DG, Varkaris A, Morelli MP, Manuel S, Wu J, Sorokin AV, Rizi BS, et al. (2017). Modeling of Patient-Derived Xenografts in Colorectal Cancer. Mol. Cancer Ther 16, 1435–1442. [DOI] [PMC free article] [PubMed] [Google Scholar]
- Kepp O, Senovilla L, and Vitale I. (2014). Consensus guidelines for the detection of immunogenic cell death. Oncoimmunology 3, e955691. [DOI] [PMC free article] [PubMed] [Google Scholar]
- Kevei É, Pokrzywa W, and Hoppe T. (2017). Repair or destruction—an intimate liaison between ubiquitin ligases and molecular chaperones in proteostasis. FEBS Lett. 591, 2616–2635. [DOI] [PMC free article] [PubMed] [Google Scholar]
- Kim ST, Cristescu R, Bass AJ, Kim K-M., Odegaard JI, Kim K, Liu XQ, Sher X, Jung H, Lee M, et al. (2018). Comprehensive molecular characterization of clinical responses to PD-1 inhibition in metastatic gastric cancer. Nat. Med 24. [DOI] [PubMed] [Google Scholar]
- Kim TH, Wang J, Lee KY, Franco HL, Broaddus RR, Lydon JP, Jeong J-W, and DeMayo FJ (2010). The Synergistic Effect of Conditional Ren Loss and Oncogenic K-ras Mutation on Endometrial Cancer Development Occurs via Decreased Progesterone Receptor Action. J. Oncol 2010, 1–9. [DOI] [PMC free article] [PubMed] [Google Scholar]
- Kucherlapati MH, Lee K, Nguyen AA, Clark AB, Hou H, Rosulek A, Li H, Yang K, Fan K, Lipkin M, et al. (2010). An Msh2 Conditional Knockout Mouse for Studying Intestinal Cancer and Testing Anticancer Agents. Gastroenterology 138, 993–1002.el. [DOI] [PMC free article] [PubMed] [Google Scholar]
- Kunkel TA, and Erie D A. (2005). DNA MISMATCH REPAIR. Annu. Rev. Biochem 74, 681–710. [DOI] [PubMed] [Google Scholar]
- De La Chapelle A, and Hampel H. (2010). Clinical relevance of microsatellite instability in colorectal cancer. J. Clin. Oncol 28, 3380–3387. [DOI] [PMC free article] [PubMed] [Google Scholar]
- Le DT, Durham JN, Smith KN, Wang H, Bartlett BR, Aulakh LK, Lu S, Kemberling H, Wilt C, Luber BS, et al. (2017). Mismatch repair deficiency predicts response of solid tumors to PD-1 blockade. Science 357, 409–413. [DOI] [PMC free article] [PubMed] [Google Scholar]
- Leidecker O, Matic I, Mahata B, Pion E, and Xirodimas DP (2012). The ubiquitin El enzyme Ubel mediates NEDD8 activation under diverse stress conditions. Cell Cycle 11, 1142–1150. [DOI] [PubMed] [Google Scholar]
- Lemery S, Keegan P, and Pazdur R. (2017). First FDA Approval Agnostic of Cancer Site — When a Biomarker Defines the Indication. N. Engl. J. Med 377, 1409–1412. [DOI] [PubMed] [Google Scholar]
- Li H. (2013). Aligning sequence reads, clone sequences and assembly contigs with BWA-MEM. ArXiv. [Google Scholar]
- Luo J, Solimini NL, andElledge SJ (2009). Principles of Cancer Therapy: Oncogene and Non-oncogene Addiction. Cell 136, 823–837. [DOI] [PMC free article] [PubMed] [Google Scholar]
- McGrail DJ, Lin CC-J, Garnett J, Liu Q, Mo W, Dai H, Lu Y, Yu Q, Ju Z, Yin J, et al. (2017). Improved prediction of PARP inhibitor response and identification of synergizing agents through use of a novel gene expression signature generation algorithm. Npj Syst. Biol. Appl 3, 8. [DOI] [PMC free article] [PubMed] [Google Scholar]
- McGrail DJ, Federico L, Li Y, Dai H, Lu Y, Mills GB, Yi S, Lin S-Y, and Sahni N. (2018a). Multi-omics analysis reveals neoantigen-independent immune cell infiltration in copy-number driven cancers. Nat. Commun 9, 1317. [DOI] [PMC free article] [PubMed] [Google Scholar]
- McGrail DJ, Lin CCJ, Dai H, Mo W, Li Y, Stephan C, Davies P, Lu Z, Mills GB, Lee JS, et al. (2018b). Defective Replication Stress Response Is Inherently Linked to the Cancer Stem Cell Phenotype. Cell Rep. 23, 2095–2106. [DOI] [PubMed] [Google Scholar]
- Molina DM, Jafari R, Ignatushchenko M, Seki T, Larsson EA, Dan C, Sreekumar L, Cao Y, and Nordlund P. (2013). Monitoring Drug Target Engagement in Cells and Tissues Using the Cellular Thermal Shift Assay. Science (80-,). 341, 84–87. [DOI] [PubMed] [Google Scholar]
- Moynihan KD, Opel CF, Szeto GL, Tzeng A, Zhu EF, Engreitz JM, Williams RT, Rakhra K, Zhang MH, Rothschilds AM, et al. (2016). Eradication of large established tumors in mice by combination immunotherapy that engages innate and adaptive immune responses. Nat. Med 22, 1402–1410. [DOI] [PMC free article] [PubMed] [Google Scholar]
- Murphy KM, Zhang S, Geiger T, Hafez MJ, Bacher J, Berg KD, and Eshleman JR (2006). Comparison of the microsatellite instability analysis system and the Bethesda panel for the determination of microsatellite instability in colorectal cancers. J. Mol. Diagnostics 8, 305–311. [DOI] [PMC free article] [PubMed] [Google Scholar]
- Muzny DM, Bainbridge MN, Chang K, Dinh HH, Drummond JA, Fowler G, Kovar CL, Lewis LR, Morgan MB, Newsham IF, et al. (2012). Comprehensive molecular characterization of human colon and rectal cancer. Nature 487, 330–337. [DOI] [PMC free article] [PubMed] [Google Scholar]
- Obeid M, Tesniere A, Ghiringhelli F, Fimia GM, Apetoh L, Perfettini JL, Castedo M, Mignot G, Panaretakis T, Casares N, et al. (2007). Calreticulin exposure dictates the immunogenicity of cancer cell death. Nat. Med 13, 54–61. [DOI] [PubMed] [Google Scholar]
- Picco G, Petti C, Sassi F, Grillone K, Migliardi G, Rossi T, Isella C, Di Nicolantonio F, Sarotto I, Sapino A, et al. (2017). Efficacy of NEDD8 Pathway Inhibition in Preclinical Models of Poorly Differentiated, Clinically Aggressive Colorectal Cancer. J. Natl. Cancer Inst 109, djw209. [DOI] [PubMed] [Google Scholar]
- Sahni N, Yi S, Taipale M, Fuxman Bass JI, Coulombe-Huntington J, Yang F, Peng J, Weile J, Karras GI, Wang Y, et al. (2015). Widespread Macromolecular Interaction Perturbations in Human Genetic Disorders. Cell 161, 647–660. [DOI] [PMC free article] [PubMed] [Google Scholar]
- Sarantopoulos J, Shapiro GI, Cohen RB, Clark JW, Kauh JS, Weiss GJ, Cleary JM, Mahalingam D, Pickard MD, Faessel HM, et al. (2016). Phase i Study of the investigational nedd8-activating enzyme inhibitor pevonedistat (TAK-924/MLN4924) in patients with advanced solid tumors. Clin. Cancer Res 22, 847–857. [DOI] [PubMed] [Google Scholar]
- Satyal SH, Schmidt E, Kitagawa K, Sondheimer N, Lindquist S, Kramer JM, and Morimoto RI (2000). Polyglutamine aggregates alter protein folding homeostasis in Caenorhabditis elegans. Proc. Natl. Acad. Sei. U. S. A 97, 5750–5755. [DOI] [PMC free article] [PubMed] [Google Scholar]
- Schumacher TN, and Schreiber RD. (2015). Neoantigens in cancer immunotherapy. Science (80-,). 348, 69–74. [DOI] [PubMed] [Google Scholar]
- Schymkowitz J, Borg J, Stricher F, Nys R, Rousseau F, and Serrano L. (2005). The FoldX web server: an online force field. Nucleic Acids Res. 33, W382–8. [DOI] [PMC free article] [PubMed] [Google Scholar]
- Seashore-Ludlow B, Rees MG, Cheah JH, Coko M, Price EV, Coletti ME, Jones V, Bodycombe NE, Soule CK, Gould J, et al. (2015). Harnessing connectivity in a large-scale small-molecule sensitivity dataset. Cancer Discov. 5, 1210–1223. [DOI] [PMC free article] [PubMed] [Google Scholar]
- Soucy TA, Smith PG, Milhollen MA, Berger AJ, Gavin JM, Adhikari S, Brownell JE, Burke KE, Cardin DP, Critchley S, et al. (2009). An inhibitor of NEDD8-activating enzyme as a new approach to treat cancer. Nature 458, 732–736. [DOI] [PubMed] [Google Scholar]
- Soyal SM, Mukherjee A, Lee KY-S, Li J, Li H, DeMayo FJ, and Lydon JP (2005). Cre-mediated recombination in cell lineages that express the progesterone receptor. Genesis 41, 58–66. [DOI] [PubMed] [Google Scholar]
- Stenoien DL, Mielke M, and Mancini MA (2002). Intranuclear ataxinl inclusions contain both fast- and slow-exchanging components. Nat. Cell Biol 4, 806–810. [DOI] [PubMed] [Google Scholar]
- Taipale M, Krykbaeva I, Koeva M, Kayatekin C, Westover KD, Karras GI, and Lindquist S. (2012). Quantitative Analysis of Hsp90-Client Interactions Reveals Principles of Substrate Recognition. Cell 150, 987–1001. [DOI] [PMC free article] [PubMed] [Google Scholar]
- Tan CSH, Go KD, Bisteau X, Dai L, Yong CH, Prabhu N, Ozturk MB, Lim YT, Sreekumar L, Lengqvist J, et al. (2018). Thermal proximity coaggregation for system-wide profiling of protein complex dynamics in cells. Science (80-,). 359, 1170–1177. [DOI] [PubMed] [Google Scholar]
- Vilar E, and Gruber SB (2010). Microsatellite instability in colorectal cancer-the stable evidence. Nat Rev Clin Oncol 7, 153–162. [DOI] [PMC free article] [PubMed] [Google Scholar]
- Wei SC, Levine JH, Cogdill AP, Zhao Y, Anang NAAS, Andrews MC, Sharma P, Wang J, Wargo JA, Pe’er D, et al. (2017). Distinct Cellular Mechanisms Underlie Anti-CTLA-4 and Anti-PD-1 Checkpoint Blockade. Cell 170, 1120–1133.el7. [DOI] [PMC free article] [PubMed] [Google Scholar]
- Whitesell L, and Lindquist SL (2005). HSP90 and the chaperoning of cancer. Nat. Rev. Cancer 5, 761–772. [DOI] [PubMed] [Google Scholar]
- Wickham H. (2016). ggplot2: Elegant Graphics for Data Analysis. Springer-Verlag New York; (Springer-Verlag New York). [Google Scholar]
- Yang W, Soares J, Greninger P, Edelman EJ, Lightfoot H, Forbes S, Bindal N, Beare D, Smith JA, Thompson IR, et al. (2013). Genomics of Drug Sensitivity in Cancer (GDSC): A resource for therapeutic biomarker discovery in cancer cells. Nucleic Acids Res. 41, 955–961. [DOI] [PMC free article] [PubMed] [Google Scholar]
- Yoon DS, Wersto RP, Zhou W, Chrest FJ, Garrett ES, Kyu Kwon T, and Gabrielson E. (2002). Variable levels of chromosomal instability and mitotic spindle checkpoint defects in breast cancer. Am. J. Pathol 161, 391–397. [DOI] [PMC free article] [PubMed] [Google Scholar]
Associated Data
This section collects any data citations, data availability statements, or supplementary materials included in this article.
Supplementary Materials
Data Availability Statement
Microarray transcriptome data from dMMR model cell lines was deposited under GSE119667 and RNAseq transcriptome data for mouse cell lines was deposited under GSE119648. Whole exome sequencing data are deposited under PRJNA5 87789. Level 4 RNA-seq gene expression data was acquired through the TCGA data portal, along with corresponding MSI statuses for UCEC, COAD, and STAD. Cell line gene expression data was obtained through CCLE (Barretina et al., 2012). Mutational signatures, as well as cell line MSI statuses and mutation calls were obtained through COSMIC/GDSC (Yang et al., 2013). Drug sensitivity data was acquired obtained from CTRPv2 (Seashore-Ludlow et al., 2015). Additional MLN4924 sensitivty data for 122 colorectal cancer cell lines treated with MLN4924 was obtained from the publication’s supplemental data (Picco et al., 2017). Raw thermal stability data was from Tan (Tan et al., 2018), and mutation profiles for HCT-116, MCF7, and A375 cells were acquired from GDSC (Yang et al., 2013). Mutant protein binding data were obtained from our previous study (Sahni et al., 2015). High-quality (>95% sequence identity) crystal structures were obtained from RSCB PDB (Berman et al., 2000) (Table S3, www.rcsb.org)