Supplemental Digital Content is available in the text
Keywords: comorbidities, demographics, health insurance, obesity
Abstract
We evaluated the statewide burden of obesity and its complications among government and state funded programs (Medicare and Medicaid) and commercial insurance.
We calculated the prevalence of obesity and the prevalence of relevant comorbidities among different demographic groups and based on health insurance, among adults (18–65 years old) who visited a statewide health network in the state of Rhode Island, in 2017.
The overall prevalence of obesity among 74,089 individuals was 38.88% [Asians 16.77%, Whites 37.49%, Hispanics 44.23%, and Blacks 48.44%]. Medicare or Medicaid beneficiaries were 26% and 27%, respectively, more likely to have obesity than those who had commercial insurance (Odds Ratio:1.26, 95% confidence interval [CI]:1.20–1.32; Odds Ratio:1.27, 95%CI:1.22–1.32). Moreover, Medicaid and Medicare beneficiaries with obesity had a higher prevalence of diabetes compared with privately insured with obesity (10.58% and 10.44% vs 4.45%). Medicare beneficiaries with obesity had a statistically higher prevalence of ischemic heart disease (4.34%, 95%CI: 3.77–4.91) than privately insured (3.21%, 95%CI: 2.94–3.47).
Based on statewide data among 18 to 65 years old adults, Medicare and Medicaid provide health coverage to 40% of individuals with obesity and 46% of those with the obesity-related comorbidities and complications. State and federal health care programs need to support and expand obesity-related services and coverage.
1. Introduction
The prevalence of obesity has nearly tripled the last decades worldwide, with an estimate of 1.9 billion adults being overweight.[1] Although obesity was a major burden in high-income countries, it has now become a pandemic.[1] During 2017 to 2018 in the US alone, the age-adjusted prevalence of obesity was about 42.4% among adults with the highest prevalence among those aged between 40 and 59 years.[2] It is projected that by 2030, 1 in 2 American adults will have obesity with all states having an adult obesity prevalence of at least 35%.[3] Also, obesity is associated with comorbidities, including diabetes,[4] ischemic heart disease,[5] hypertension,[6] atrial fibrillation,[7] and dyslipidemia,[8] as well as with increased health needs[9] and medical costs.[10]
The aggregate medical costs of obesity are estimated to be more than $200 billion annually,[11] and Medicare and Medicaid pay for nearly half of the direct medical costs of obesity.[10] Medicare provides health coverage to those over 65 years old and to individuals under 65 years who have a disability, while Medicaid provides health coverage to low income individuals.[12] Medicare is fully funded by the federal government, while Medicaid is cofinanced by the states and at 23.16% to 50% by the federal government.[13]
The association of obesity with low-income populations has been highlighted in several studies.[14] However, the present study focuses specifically on the association of health care insurance with obesity and obesity-related comorbidities. Low income populations in the US have limited access to commercial insurance and are uninsured or are beneficiaries of Medicare and Medicaid. As the accessibility to healthcare is limited for economic minorities, their health burdens are increased. Prevention and intervention strategies could help reduce the obesity burden in low income populations and decrease the incidence of obesity related comorbidities.
The aim of this study was to utilize the electronic medical record database of the largest health care network in Rhode Island (RI), in order to evaluate the burden of obesity and obesity-related comorbidities on individuals, based on health insurance coverage (Medicare, Medicaid, or commercial) and demographic characteristics.
2. Method
2.1. Data extraction
The study was approved by the Rhode Island Hospital Institutional Review Board (IRB #009018) in 2019, and data were collected from 3 hospitals that belong to the largest statewide hospital network in RI, for the year 2017. This cross-sectional study was performed in line with the STROBE (Strengthening the Reporting of Observational Studies in Epidemiology) statement.[15] In this study we included adult individuals between 18 and 65 years old. Body mass index (BMI) scores, International Classification of Diseases (ICD)-10 visit diagnosis, zip code and demographic characteristics such as gender, age, race, and ethnicity, and type of health care insurance (Medicaid, Medicare, or commercial) were included in the data collected. All private health insurances were aggregated into a commercial coverage group, while Medicaid and Medicare coverage remained in separate groups. Medicaid is a free or low-cost health coverage for people who fulfill low income criteria and aged between 19 and 65 years.[12] Medicare is available for people older than 65 years old, but also for younger people with disabilities or people with end stage renal disease, who need dialysis or transplant.[12] Visits from pregnant women (ICD-10 codes O00-O9A) and subjects with missing data were excluded for our analysis and all data were de-identified.
2.2. Prevalence of obesity and obesity-related comorbidities
Obesity was defined based on the World Health Organization (WHO) definition of BMI ≥30 kg/m2.[16] We stratified the sample using the following age groups: 18 to 35, 35 to 50, 50 to 65 years, and all estimates were age-adjusted unless otherwise specified. The overall age-adjusted prevalence of obesity was calculated for the study population, using the direct standardization method.[17] The study population was then sub-grouped based on race and ethnicity, gender, age, and type of health insurance. We examined diabetes, hypertension and ischemic heart disease as obesity-related comorbidities, as these were the most frequently reported visit diagnoses in our sample. We also calculated the prevalence of the above obesity-associated complications among Medicare, Medicaid, and commercially insured and we examined the differences among gender, race, and age by insurance type.
2.3. Association of obesity with demographics
A multivariate logistic regression was implemented to estimate odds ratios and examine the association of obesity with the above demographics and comorbidities. We also sub-grouped the study population based on race and performed a sub-analysis per group to examine the differences between each race. Statistical analysis was performed using Stata/SE 15 (StataCorp, College Station, TX). The significance level was set at P < .05.
2.4. Correlation of prevalence of obesity with insurance
Pearson correlation was performed to evaluate the relationship between obesity and health care insurance. We created choropleth maps, in ArcGIS Pro 2.2.0 (ESRI, Redlands, CA), to visualize the prevalence of obesity and the distribution of the different types of health insurance, in RI. First, we converted zip codes to Zip Code Tabulation Areas (ZCTAs), using the crosswalk provided by the UDS Mapper,[18] and then we calculated the prevalence of obesity by ZCTA. ZCTAs are generalized representations of the USPS zip codes[19] and were developed by the U.S. Census Bureau.
3. Results
3.1. Sample and overall demographic data
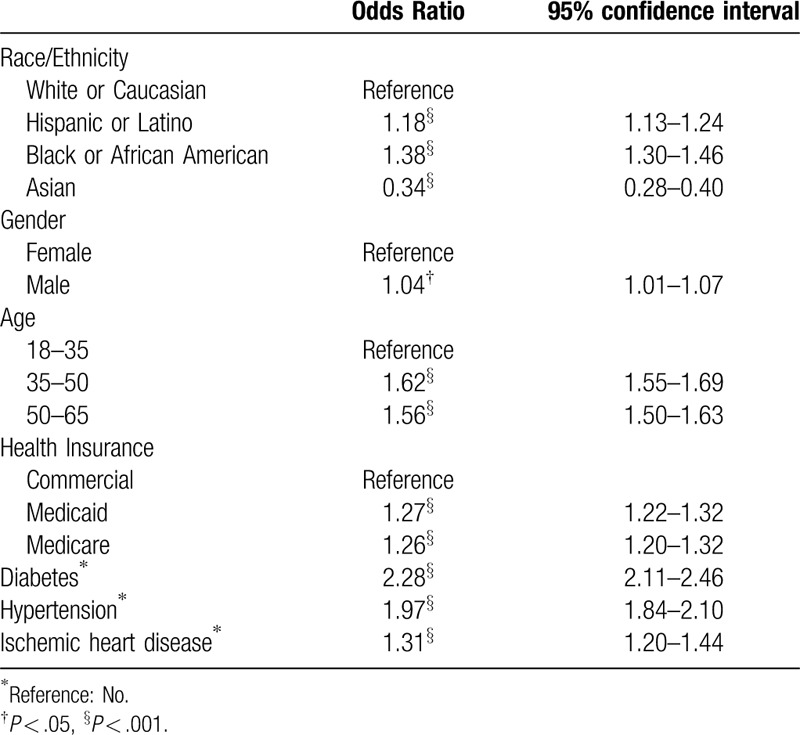
In total, 74,089 subjects with a mean BMI of 29.34 (standard deviation [SD]: 7.21, range: 10.77–95.94) were included in this analysis. Individuals with obesity had a mean BMI of 36.41 (SD: 6.06), compared to a mean BMI of 24.84 (SD: 3.13) for the individuals without obesity. We calculated the overall adjusted prevalence of obesity (38.88%) and detailed study population characteristics are given in Table 1. Hispanic and Black individuals had a statistically significant higher obesity prevalence than White and Asian (Table 1). Compared to White subjects, Black and Hispanics were 38% and 18%, respectively, more likely to have obesity (Odds Ratio [OR]:1.38, 95% confidence interval [CI]:1.30–1.46; OR:1.18, 95% CI:1.13–1.24), while Asians were 66% less likely (OR:0.34, 95% CI:0.28–0.40) (Table 2). Although the overall prevalence of obesity was higher among men than women (40.60%, 95% CI: 40.00–41.20 vs 37.85%, 95% CI: 37.42–38.28), Black and Hispanic men were less likely to have obesity than Black and Hispanic women (OR:0.55, 95% CI:0.49–0.61; OR:0.82, 95% CI:0.75–0.89, respectively) (see Table S1, Supplemental Content, which shows the association of demographic and obesity-related comorbidities by race/ethnicity).
Table 1.
Study population characteristics, 2017.
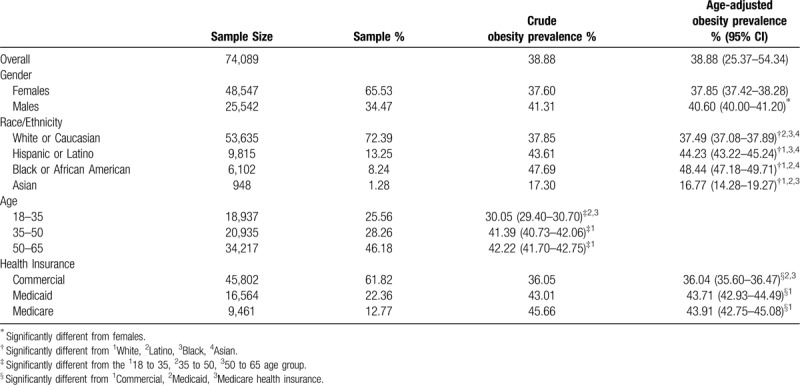
Table 2.
Association of demographics and obesity-related comorbidities.
3.2. Demographic data based on health insurance coverage
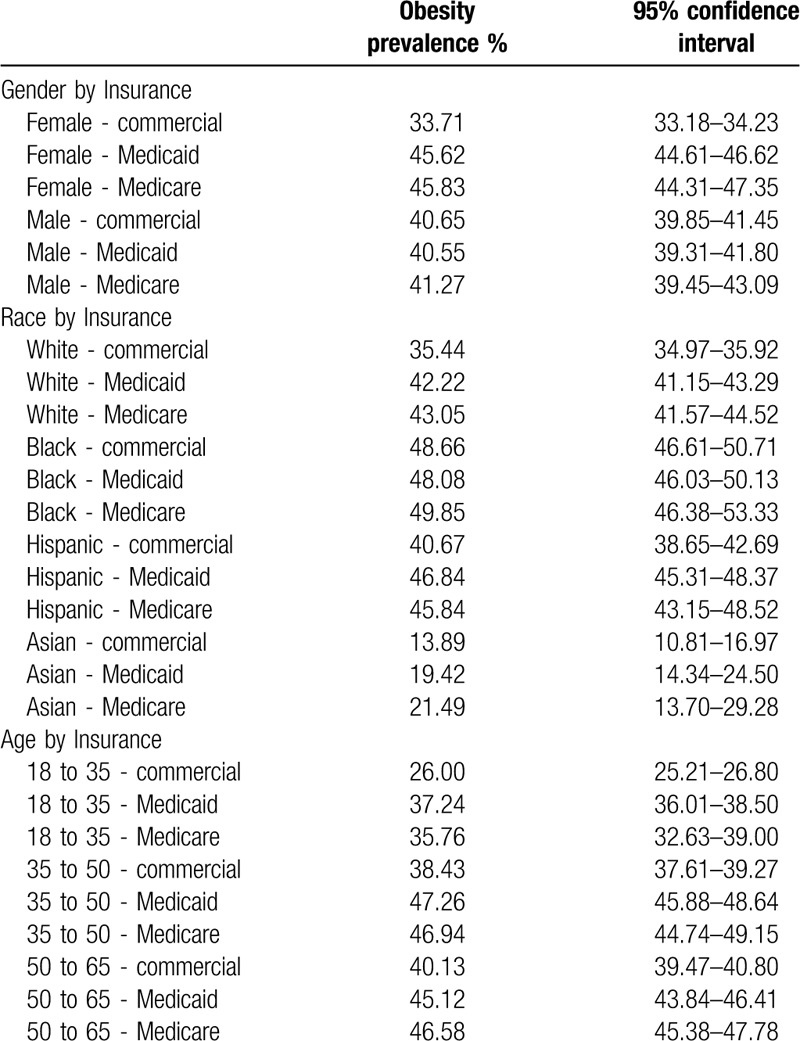
Medicaid and Medicare provided health coverage to 39.73% of individuals with obesity. The prevalence of obesity among subjects with commercial insurance was 36.04% (95% CI: 35.60–36.47), while subjects with Medicaid and Medicare coverage had a higher prevalence of 43.71% and 43.91%, respectively (95% CI: 42.93–44.49; 95% CI: 42.75–45.08). As shown in Table 2, individuals with Medicaid or Medicare were 27% or 26%, respectively, more likely to have obesity compared with individuals with commercial health insurance (OR:1.27, 95% CI:1.22–1.32; OR:1.26, 95% CI:1.0–1.32, respectively). However, when subgrouping by race, obesity was not associated with health insurance among Black and Asians (see Table S1, Supplemental Content). Also, in Table 3, we present the prevalence of obesity according to demographic characteristics by health insurance. The differences were statistically significant among women, Whites, Hispanics, and among all age groups.
Table 3.
Prevalence of obesity by demographics and health insurance.
3.3. Geolocation of distribution of health insurance and obesity
In order to further evaluate the association between health insurance and obesity, we examined whether the prevalence of obesity was correlated with the distribution of each health insurance depending on geolocation. The Pearson correlation results showed that there was a moderate negative association between the prevalence of obesity and commercial insurance (r = −0.4718, P < .001), a strong positive association with Medicaid (r = 0.5166, P < .001), and a small positive association with Medicare (r = 0.2394, P = .0360). In Figure 1, the darker color represents a higher prevalence of obesity by zip code, while a bigger shape of circle represents a greater proportion of (a) commercial, (b) Medicaid, and (c) Medicare health insurance coverage. Interestingly, areas with high prevalence of obesity had a high percentage of individuals with Medicaid and a low percentage of individuals with commercial insurance.
Figure 1.
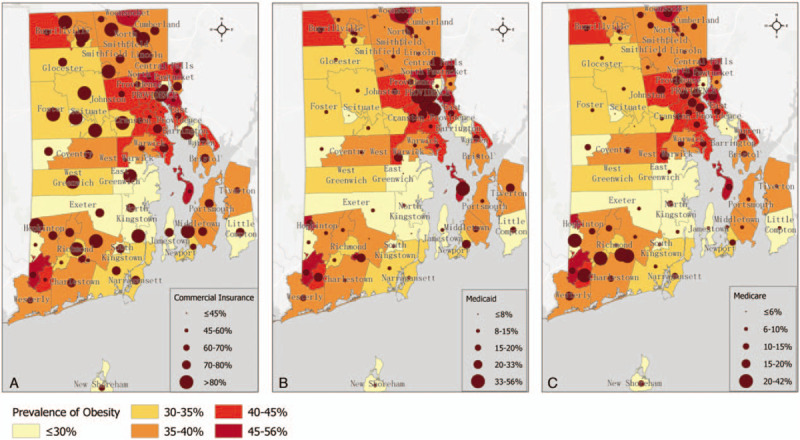
Choropleth map of the age-adjusted prevalence of obesity among adults and the distribution of the (A) commercial health insurance, (B) Medicaid and (C) Medicare, at the Zip Code Tabulation Area level in Rhode Island.
3.4. Association of obesity with comorbidities (overall and based on health insurance)
We examined the association of obesity with major obesity-related comorbidities: diabetes, hypertension, and ischemic heart disease in our overall sample. We found that individuals with a diagnosis of diabetes were 2.28 times more likely to have obesity compared with subjects without a diagnosis of diabetes (OR:2.28, 95% CI:2.11–2.46), with the highest odd ratio among Asians (OR:4.02, 95% CI:2.17–7.45). The prevalence of obesity was 60.56% among people with diabetes and 37.86% among people without (Table 4). Individuals with a diagnosis of hypertension were more likely to have obesity (OR:1.97, 95% CI:1.84–2.10), compared with individuals without hypertension, independently of race and the prevalence of obesity was 61.66% among people with hypertension and 37.83% among people without hypertension. The prevalence of obesity was 49.65% among people with ischemic heart disease and 38.66% among people without (Table 4) and when subgrouping by race, obesity was associated with ischemic heart disease only among Whites (OR:1.31, 95% CI:1.18–1.43) (see Table S1, Supplemental Content).
Table 4.
Prevalence of obesity by comorbidities and health insurance.
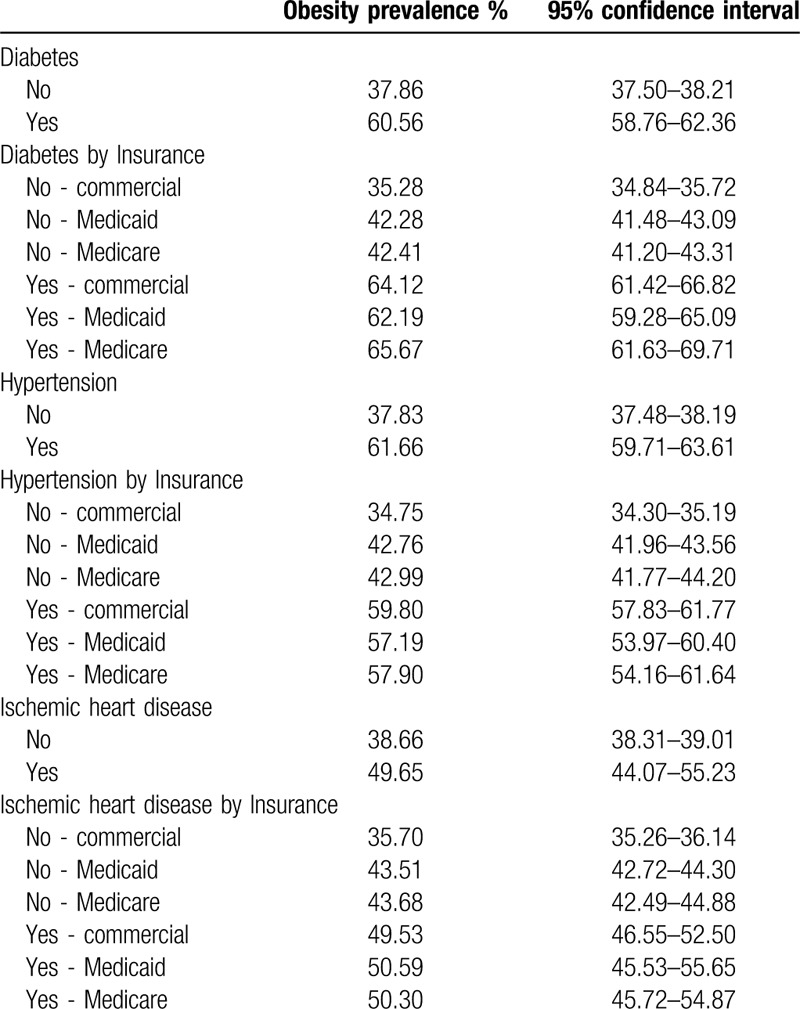
When looking at the prevalence of obesity by obesity-related comorbidities and health insurance, we found that people with commercial health insurance without any of the examined comorbidities had a statistically significant lower prevalence of obesity than individuals with Medicaid or Medicare, but the differences were not statistically significant among people with obesity-related comorbidities (Table 4).
3.5. Prevalence of diabetes, hypertension, and ischemic heart disease among individuals with obesity based on health insurance coverage
Then, we evaluated we detail the association of obesity-related comorbidities and complications, separately, among individuals with obesity based on health insurance coverage (Table 5). Overall, we found that the prevalence of comorbidities was 16.39% (95% CI: 15.98–16.81) among individuals with obesity and 8.41% (95% CI: 8.15–8.67) among those without obesity. Importantly, Medicaid and Medicare provide health insurance to 46.47% of individuals with obesity and obesity-related comorbidities and complications.
Table 5.
Prevalence of obesity-related comorbidities among individuals with obesity and different health insurance coverage.
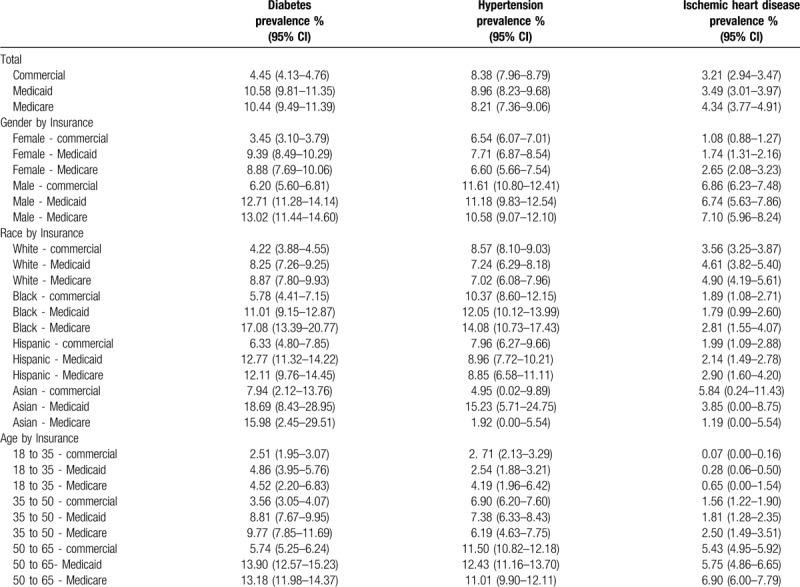
Looking at diabetes, individuals with commercial insurance had a statistically lower prevalence (4.45%, 95% CI: 4.13–4.76), compared to beneficiaries of Medicare and Medicaid with obesity. Among individuals with obesity and Medicare coverage, the prevalence of diabetes was 10.44% (95% CI: 9.49–11.39) and 10.58% among individuals with obesity and Medicaid (95% CI: 9.81–11.35). Among beneficiaries of Medicaid with obesity, men had a higher prevalence of diabetes than women, Black and Hispanics had a higher prevalence than Whites and the prevalence was increasing with age.
The prevalence of hypertension among individuals with obesity was independent of health insurance. However, we found that men with obesity had a higher prevalence of hypertension than women (Table 5). Among beneficiaries of Medicaid with obesity, Black had a higher prevalence of hypertension than Whites (12.05%, 95% CI:10.12–13.99 vs 7.24%, 95% CI:6.29–8.18), and people between 50 and 65 years old had the highest prevalence (12.43%, 95% CI:11.16–13.70), while those between 18 and 35 years the lowest (2.54%, 95% CI:1.88–3.21).
Medicare beneficiaries with obesity had a statistically higher prevalence of ischemic heart disease than the privately insured (4.34%, 95% CI: 3.77–4.91 vs 3.21%, 95% CI:2.94–3.47). Among women with obesity, those with commercial insurance had a lower prevalence of ischemic heart disease (1.08%, 95% CI:0.88–1.27) compared to those with Medicaid and Medicaid (1.74%, 95% CI:1.31–2.16 and 2.65%, 95% CI:2.08–3.23). Also, White Medicare beneficiaries with obesity had a higher prevalence of ischemic heart disease compared with White commercially insured with obesity (4.90%, 95% CI: 4.19–5.61 vs 3.56%, 95% CI:3.25–3.87). The prevalence of ischemic heart disease was higher between men with obesity than women with obesity, and was higher between Whites than Black and Hispanics.
4. Discussion
Expanding Medicaid services to provide treatment for obesity could be cost effective[20] and Medicare programs, such as the BieneStar intensive behavior therapy, can help weight loss.[21] Therefore, a core element of the Center for Medicare and Medicaid Services (CMS) is to offer weight screening and counseling services for healthy eating and physical activity.[22] We evaluated the impact of obesity between federal and state programs (Medicare and Medicaid) and commercial insurance in adults 18 to 65 years old. Interestingly, those insured by Medicare and Medicaid have greater odds of having obesity compared to those under commercial insurance.
Overall, in our statewide sample of over 74,000 individuals, almost 1 in 2 individuals with Medicaid or Medicare had obesity. Medicaid and Medicare are funded by the states and the federal government and beneficiaries of these insurance plans are people who fulfill low-income criteria. Studies have shown that individuals with low-income tend to have higher prevalence of obesity.[14] Moreover, when we examined the relation of obesity and health insurance in space, we identified a strong positive correlation between areas with high prevalence of obesity and high proportion of individuals on Medicaid. In 2013, Medicaid paid 8% to 23% of costs for nonelderly adults with severe obesity[20] and states have investigated innovative ways to improve access to obesity-related services for Medicaid beneficiaries.[23] For example, among Medicaid beneficiaries who enrolled into the Weight Watchers program, 1 in 5 lost a clinically significant amount of weight (i.e., 5% or more of initial body weight) with those who attended multiple meetings more likely to lose weight.[24]
In some states, Medicaid covers obesity treatment, such as nutritional consultation, weight loss medications, and bariatric surgery,[13,25] while a new protocol for intensive behavioral therapy has been made available for practitioners.[26] It is reasonable for statewide interventions to focus on specific areas and the use of geographic information system can help identify areas where obesity rates are high and allows for the formulation of focused strategies to prevent and manage obesity.[27] For example, a sense of community supports individuals engaging with one another to offer needed social support for activities such as exercise and healthy eating.[28] The use of community settings such as community centers, parks, places of worship, grocery stores, and schools can assist in achieving sustainability while simultaneously meeting the objective of creating culturally-tailored interventions.[29] For Medicare beneficiaries, a recent study shows that expansion of health insurance for combating obesity among elderly Medicare beneficiaries could lead to 23 billion in savings over 10 years.[30] A more local-level approach could increase the uptake of weight loss programs, such as intensive behavioral therapy, and this practice could also apply to all Medicare and Medicaid beneficiaries as well.
Understanding the demographic characteristics of obesity can also help tailor interventions. A key finding from our study highlights the documented excess burden of obesity in ethnic groups such as Blacks and Hispanics. Obesity has disproportionally affected racial minority groups, with Hispanics and non-Hispanic Black having higher odds of obesity and obesity-related diseases.[31] Although obesity rates are lower in Asians in comparison with other ethnic groups in the US, it has also become an epidemic.[32] The age-adjusted prevalence of obesity in non-Hispanic Black and Hispanics in RI was 49% and 44%, respectively, which is similar to national estimates.[2] Within these two groups, women were more likely have obesity when compared to men. In this regard, targeted interventions that offer a sense of community and social support for these ethnic groups may be proven of benefit.[33] Moreover, interventions such as family involvement can improve reduction of body weight for both non-Hispanic Black and Hispanics in intervention settings.[34] Since the built environment can play a major role on an individual's health behavior choices,[35,36] interventions aiming to promote access to physical activity and healthy diet among groups with higher prevalence of obesity are needed.[37]
Obesity-related diseases lead to increased use of health services.[9] Previous studies have shown that patients with obesity had a higher mean of primary care visits compared with patients without obesity,[38] which is associated with increased health care costs.[10] However, the association of obesity and obesity-related complications in individuals with Medicaid and Medicare coverage is less well studied. Although the burden of comorbidities after bariatric surgeries among Medicaid, Medicare and privately insured patients with obesity has been documented,[39] there is insufficient literature on the association of obesity and obesity-related comorbidities with health care insurance status. Staiano et al,[40] found that among adolescents those with Medicaid were more likely to have elevated blood pressure than those with commercial insurance. Also, Tyrrell et al,[41] examined 33 obesity-related medical conditions among people with obesity and found that Medicare beneficiaries had the highest prevalence of obesity-related comorbidities. We explored the association of specific medical conditions with obesity such as diabetes, hypertension, and ischemic heart disease. Our results indicate that people with any of these conditions irrespective of age or gender, had higher prevalence of obesity compared to people without the respective medical conditions.
Also, we found that Medicaid and Medicare beneficiaries with obesity had a statistically significant higher prevalence of diabetes compared with commercially insured. This finding further underscores the burden that obesity puts on noncommercial insurance. Reducing weight can help in improving quality of life and weight loss has been associated with reduction of mortality among those living with diabetes[42] and improving access to such health care services is particularly important for those on Medicaid and Medicare.
The generalizability of our findings should be considered. In this regard, our sample seems representative. Our estimate is similar to the nationwide prevalence of obesity reported in 2017 to 2018,[2] but greater than the prevalence of obesity estimated for RI in 2017 by the Centers of Disease Control and Prevention.[43] Importantly, the sample size of our study increases the external validity of our model and make our findings more robust. Age-adjusted prevalence of obesity in RI among adults between 18 and 65 years of age who sought medical care was estimated to be nearly 40%. Based on Centers of Disease Control and Prevention data, the age-adjusted prevalence of adult obesity in 2017 for the state of RI was 30%.[43] Notably, we included only adult subjects younger than 65 years old, to minimize nonindicative BMI values, as studies have shown that in certain populations, such as the elderly, the diagnostic accuracy of BMI is poor.[44] Also, despite the shortcomings of administrative data, a strength of using data extracted from the largest health care system in RI is that it enabled us to calculate more accurate estimates of the prevalence of obesity at the individual level, compared with data from aggregate databases. Moreover, processing data from a large sample of health records leads to more reliable results compared to self-report data, according to studies that have shown that both men and women tend to over-report their height and under-report their weight.[45]
In addition to these considerations for the generalization of our findings, the main limitation of this study is that since this is a cross-sectional study, causality cannot be tested. Also, we used ICD-10 codes to categorize individuals with diabetes, hypertension or ischemic heart disease, rather than questionnaires like most studies. Finally, even though BMI is widely used to study obesity is not an ideal indicator of obesity,[46] and using electronic health records, there is a possibility of bias towards individuals seeking healthcare.
5. Conclusion
This statewide analysis supports that obesity contributes to the understanding of how factors, such as health insurance, race, and ethnicity, are associated with obesity and obesity-associated medical comorbidities. Moreover, we found that Medicare and Medicaid provide health coverage to 40% of individuals with obesity and to 45% of individuals with obesity-related comorbidities and complications. Because obesity is a major public health issue, it is important to identify the factors associated with increased obesity rates in order to design better public health intervention strategies, such as culturally-tailored interventions that are sustainable, and can ensure long-term weight management for ethnic populations. Also, Medicare and Medicaid policies should extend preventive measures and treatments against obesity and reducing the burden of obesity and obesity-related conditions.
Author contributions
EKM, GB, FS, EF, MK, and EM conceptualized and designed the study, and participated in data interpretation. EKM and FS participated in data collection and extraction, prepared tables and figures and performed the statistical analysis. EKM, GB, FS, EF, and MK drafted the initial manuscript. EKM, SCM, and EM edited the initial manuscript. EM reviewed and revised the manuscript. All authors read and approved the final manuscript as submitted and agreed to be accountable for all aspects of the work in ensuring that questions related to the accuracy or integrity of any part of the work are appropriately investigated and resolved.
Supplementary Material
Footnotes
Abbreviations: BMI = Body Mass Index, CI = confidence interval, ICD = International Classification of Diseases, OR = Odds Ratio, RI = Rhode Island, SD = standard deviation, ZCTA = Zip Code Tabulation Area.
How to cite this article: Mylona EK, Benitez G, Shehadeh F, Fleury E, Mylonakis SC, Kalligeros M, Mylonakis E. The association of obesity with health insurance coverage and demographic characteristics: a statewide cross-sectional study. Medicine. 2020;99:27(e21016).
The study was approved by the Rhode Island Hospital IRB.
The authors received no financial support for the research authorship, and/or publication of this article.
The authors have no conflicts of interests to disclose.
Supplemental Digital Content is available for this article.
The datasets generated during and/or analyzed during the current study are not publicly available, but are available from the corresponding author on reasonable request.
References
- [1].Obesity and overweight. 2020; https://www.who.int/news-room/fact-sheets/detail/obesity-and-overweight. Accessed April 29, 2020. [Google Scholar]
- [2].Hales CM, Carroll MD, Fryar CD, et al. Prevalence of obesity and severe obesity among adults: United States, 2017–2018. NCHS Data Brief 2020;288:1–8. [PubMed] [Google Scholar]
- [3].Ward ZJ, Bleich SN, Cradock AL, et al. Projected U. S. state-level prevalence of adult obesity and severe obesity. N Engl J Med 2019;381:2440–50. [DOI] [PubMed] [Google Scholar]
- [4].Clinical Guidelines on the Identification, Evaluation, and Treatment of Overweight and Obesity in Adults–The Evidence Report. National Institutes of Health. Obes Res 1998;6: Suppl 2: 51S–209S. [PubMed] [Google Scholar]
- [5].Wilson PW, D’Agostino RB, Sullivan L, et al. Overweight and obesity as determinants of cardiovascular risk: the Framingham experience. Arch Intern Med 2002;162:1867–72. [DOI] [PubMed] [Google Scholar]
- [6].Landsberg L, Aronne LJ, Beilin LJ, et al. Obesity-related hypertension: pathogenesis, cardiovascular risk, and treatment--a position paper of the Obesity Society and The American Society of Hypertension. Obesity (Silver Spring) 2013;21:8–24. [DOI] [PubMed] [Google Scholar]
- [7].Gaman M-A, Dobrica E-C, Pascu EG, et al. Cardio metabolic risk factors for atrial fibrillation in type 2 diabetes mellitus: focus on hypertension, metabolic syndrome and obesity. J Mind Med Sci 2019;6:157–61. [Google Scholar]
- [8].Epingeac ME, Gaman MA, Diaconu CC, et al. The evaluation of oxidative stress levels in obesity. Rev Chim Bucharest (Original Edition) 2019;70:2241–4. [Google Scholar]
- [9].Quesenberry CP, Jr, Caan B, Jacobson A. Obesity, health services use, and health care costs among members of a health maintenance organization. Arch Intern Med 1998;158:466–72. [DOI] [PubMed] [Google Scholar]
- [10].Finkelstein EA, Trogdon JG, Cohen JW, et al. Annual medical spending attributable to obesity: payer-and service-specific estimates. Health Aff (Millwood) 2009;28:w822–831. [DOI] [PubMed] [Google Scholar]
- [11].Cawley J, Meyerhoefer C. The medical care costs of obesity: an instrumental variables approach. J Health Econ 2012;31:219–30. [DOI] [PubMed] [Google Scholar]
- [12].HHS.gov. What is the difference between Medicare and Medicaid? 2015; https://www.hhs.gov/answers/medicare-and-medicaid/what-is-the-difference-between-medicare-medicaid/index.html. Accessed July 9, 2019. [Google Scholar]
- [13].Jannah N, Hild J, Gallagher C, et al. Coverage for obesity prevention and treatment services: analysis of Medicaid and state employee health insurance programs. Obesity (Silver Spring) 2018;26:1834–40. [DOI] [PubMed] [Google Scholar]
- [14].Singh GK, Kogan MD, Van Dyck PC, et al. Racial/ethnic, socioeconomic, and behavioral determinants of childhood and adolescent obesity in the United States: analyzing independent and joint associations. Ann Epidemiol 2008;18:682–95. [DOI] [PubMed] [Google Scholar]
- [15].von Elm E, Altman DG, Egger M, et al. The Strengthening the Reporting of Observational Studies in Epidemiology (STROBE) statement: guidelines for reporting observational studies. Lancet 2007;370:1453–7. [DOI] [PubMed] [Google Scholar]
- [16].WHO. Obesity. https://www.who.int/topics/obesity/en/. Accessed February 1, 2019. [Google Scholar]
- [17].Stata. Direct and indirect standardization. https://www.stata.com/manuals13/rdstdize.pdf. Accessed July 18, 2019. [Google Scholar]
- [18].Mapper U. ZIP Code to ZCTA Crosswalk. 2018; https://www.udsmapper.org/zcta-crosswalk.cfm. Accessed July 12, 2019. [Google Scholar]
- [19].Bureau USC. ZIP Code Tabulation Areas. https://www.census.gov/programs-surveys/geography/guidance/geo-areas/zctas.html. Accessed July 12, 2019. [Google Scholar]
- [20].Wang YC, Pamplin J, Long MW, et al. Severe obesity in adults cost state Medicaid programs nearly $8 billion In 2013. Health Aff (Millwood) 2015;34:1923–31. [DOI] [PubMed] [Google Scholar]
- [21].Trevino RP, Pina C, Fuentes JC, et al. Evaluation of Medicare's intensive behavioral therapy for obesity: the BieneStar experience. Am J Prev Med 2018;54:497–502. [DOI] [PubMed] [Google Scholar]
- [22].CMS.gov. Decision Memo for Intensive Behavioral Therapy for Obesity (CAG00423N). https://www.cms.gov/medicare-coverage-database/details/nca-decision-memo.aspx?&NcaName=Intensive%20Behavioral%20Therapy%20for%20Obesity&bc=ACAAAAAAIAAA&NCAId=253. Accessed January 14, 2020. [Google Scholar]
- [23].Services CfMaM. Reducing Obesity. https://www.medicaid.gov/medicaid/quality-of-care/improvement-initiatives/reducing-obesity/index.html. Accessed Dec 31, 2019. [Google Scholar]
- [24].Mitchell NS, Ellison MC, Hill JO, et al. Evaluation of the effectiveness of making Weight Watchers available to Tennessee Medicaid (TennCare) recipients. J Gen Intern Med 2013;28:12–7. [DOI] [PMC free article] [PubMed] [Google Scholar]
- [25].Lee JS, Sheer JL, Lopez N, et al. Coverage of obesity treatment: a state-by-state analysis of Medicaid and state insurance laws. Public Health Rep 2010;125:596–604. [DOI] [PMC free article] [PubMed] [Google Scholar]
- [26].Wadden TA, Tsai AG, Tronieri JS. A protocol to deliver Intensive Behavioral Therapy (IBT) for obesity in primary care settings: the MODEL-IBT Program. Obesity (Silver Spring) 2019;27:1562–6. [DOI] [PMC free article] [PubMed] [Google Scholar]
- [27].Clarke B, Swinburn B, Sacks G. The application of theories of the policy process to obesity prevention: a systematic review and meta-synthesis. BMC Public Health 2016;16:1084. [DOI] [PMC free article] [PubMed] [Google Scholar]
- [28].Haughton CF, Silfee VJ, Wang ML, et al. Racial/ethnic representation in lifestyle weight loss intervention studies in the United States: a systematic review. Prev Med Rep 2018;9:131–7. [DOI] [PMC free article] [PubMed] [Google Scholar]
- [29].Perez LG, Arredondo EM, Elder JP, et al. Evidence-based obesity treatment interventions for Latino adults in the U.S.: a systematic review. Am J Prev Med 2013;44:550–60. [DOI] [PMC free article] [PubMed] [Google Scholar]
- [30].Chen F, Su W, Ramasamy A, et al. Ten-year Medicare budget impact of increased coverage for anti-obesity intervention. J Med Econ 2019;22:1096–104. [DOI] [PubMed] [Google Scholar]
- [31].Zhang H, Rodriguez-Monguio R. Racial disparities in the risk of developing obesity-related diseases: a cross-sectional study. Ethn Dis 2012;22:308–16. [PubMed] [Google Scholar]
- [32].Gad MM, Gaman MA, Saad AM, et al. Temporal trends of incidence and mortality in Asian-Americans with pancreatic adenocarcinoma: an epidemiological study. Ann Gastroenterol 2020;33:210–8. [DOI] [PMC free article] [PubMed] [Google Scholar]
- [33].Martyn-Nemeth PA, Vitale GA, Cowger DR. A culturally focused exercise program in Hispanic adults with type 2 diabetes: a pilot study. Diabetes Educ 2010;36:258–67. [DOI] [PubMed] [Google Scholar]
- [34].Seo DC, Sa J. A meta-analysis of psycho-behavioral obesity interventions among US multiethnic and minority adults. Prev Med 2008;47:573–82. [DOI] [PubMed] [Google Scholar]
- [35].Zhang H, Yin L. A meta-analysis of the literature on the association of the social and built environment with obesity: identifying factors in need of more in-depth research. Am J Health Promot 2019;33:792–805. [DOI] [PubMed] [Google Scholar]
- [36].Mylona EK, Shehadeh F, Fleury E, et al. Neighborhood-level analysis on the impact of accessibility to fast food and open green spaces on the prevalence of obesity. Am J Med 2019;133:340–6. [DOI] [PubMed] [Google Scholar]
- [37].Kerksick C, Thomas A, Campbell B, et al. Effects of a popular exercise and weight loss program on weight loss, body composition, energy expenditure and health in obese women. Nutr Metab (Lond) 2009;6:23. [DOI] [PMC free article] [PubMed] [Google Scholar]
- [38].Rao R, Jessica B. When more is better: impact of primary care office visits on severe obesity. Gen Med (Los Angeles) 2016;4:2. [Google Scholar]
- [39].Davis M, Gomez J, Sheck C, et al. Variation in weight and obesity comorbidities after open Roux-en-Y Gastric bypass by health insurance: Medicaid vs Medicare vs private vs self-pay in 4225 bariatric outcomes longitudinal database patients. JAMA Surg 2017;152:105–9. [DOI] [PubMed] [Google Scholar]
- [40].Staiano AE, Morrell M, Hsia DS, et al. The burden of obesity, elevated blood pressure, and diabetes in uninsured and underinsured adolescents. Metab Syndr Relat Disord 2016;14:437–41. [DOI] [PMC free article] [PubMed] [Google Scholar]
- [41].Tyrrell J, Blair KM, Slotman GJ. Health insurance does matter: clinically significant variation in obesity-related diagnoses between insurance types in 83,059 morbidly obese patients. Adv Obes Weight Manag Control 2018;8:178–83. [Google Scholar]
- [42].Williamson DF, Thompson TJ, Thun M, et al. Intentional weight loss and mortality among overweight individuals with diabetes. Diabetes Care 2000;23:1499–504. [DOI] [PubMed] [Google Scholar]
- [43].Centers for Disease Control and Prevention NCfCDPaHP, Division of Population Health BRFSS Prevalence & Trends Data [online]. 2015; https://www.cdc.gov/brfss/brfssprevalence/. Accessed Oct 22, 2019. [Google Scholar]
- [44].Batsis JA, Mackenzie TA, Bartels SJ, et al. Diagnostic accuracy of body mass index to identify obesity in older adults: NHANES 1999–2004. Int J Obes (Lond) 2016;40:761–7. [DOI] [PMC free article] [PubMed] [Google Scholar]
- [45].Connor Gorber S, Tremblay M, Moher D, et al. A comparison of direct vs. self-report measures for assessing height, weight and body mass index: a systematic review. Obes Rev 2007;8:307–26. [DOI] [PubMed] [Google Scholar]
- [46].Adab P, Pallan M, Whincup PH. Is BMI the best measure of obesity? BMJ 2018;360:k1274. [DOI] [PubMed] [Google Scholar]
Associated Data
This section collects any data citations, data availability statements, or supplementary materials included in this article.


