Abstract
To determine the value of 3T magnetic resonance imaging (MRI) texture analysis in differentiating high- from low-grade soft-tissue sarcoma.
Forty-two patients with soft-tissue sarcomas who underwent 3T MRI were analyzed. Qualitative and texture analysis were performed on T1-, T2- and fat-suppressed contrast-enhanced (CE) T1-weighted images. Various features of qualitative and texture analysis were compared between high- and low-grade sarcoma. Areas under the receiver operating characteristic curves (AUC) were calculated for texture features. Multivariate logistic regression analysis was used to analyze the value of qualitative and texture analysis.
There were 11 low- and 31 high-grade sarcomas. Among qualitative features, signal intensity on T1-weighted images, tumor margin on T2-weighted images, tumor margin on fat-suppressed CE T1-weighted images and peritumoral enhancement were significantly different between high- and low-grade sarcomas. Among texture features, T2 mean, T1 SD, CE T1 skewness, CE T1 mean, CE T1 difference variance and CE T1 contrast were significantly different between high- and low-grade sarcomas. The AUCs of the above texture features were > 0.7: T2 mean, .710 (95% confidence interval [CI] .543–.876); CE T1 mean, .768 (.590–.947); T1 SD, .730 (.554–.906); CE T1 skewness, .751 (.586–.916); CE T1 difference variance, .721 (.536–.907); and CE T1 contrast, .727 (.530–.924). The multivariate logistic regression model of both qualitative and texture features had numerically higher AUC than those of only qualitative or texture features.
Texture analysis at 3T MRI may provide additional diagnostic value to the qualitative MRI imaging features for the differentiation of high- and low-grade sarcomas.
Keywords: magnetic resonance imaging, neoplasm grading, sarcoma, soft tissue neoplasms
1. Introduction
Soft-tissue sarcomas are heterogeneous malignant neoplasms, and tumor histological grade, size, margin, stage, and patient age, among others, have been reported to be prognostic factors. Among these, histological grade is one of the most important.[1,2] Histological grade is determined by pathological analysis of surgically obtained specimens and is based on mitotic count, differentiation, and necrosis.[3] However, predicting tumor grade before surgery is critical because high-grade sarcomas usually require neoadjuvant chemotherapy.[4]
MRI is a tool for preoperatively diagnosing and grading soft-tissue sarcomas and determining tumor extent.[5–7] There have been studies investigating the prediction of soft-tissue sarcoma grade using MRI features.[8,9]
Texture analysis is one such new technique for analyzing images as a part of radiomics, and can be used to quantitatively analyze tumoral heterogeneity, which arises from various causes, such as cellularity, angiogenesis, extravascular extracellular matrix or areas of necrosis, and has implications for tumor prognosis.[10,11] Using various mathematical methods, texture analysis evaluates the gray-scale intensity and spatial relationship of pixels for assessing tumoral heterogeneity.[10] Texture analysis has been studied to predict tumor stage and survival in various cancers,[12–16] differentiate benign from malignant lesions in breast,[17,18] and to predict treatment response in various other cancers.[19–21] To our knowledge, however, there have been a small number of studies [22–24] investigating whether texture analysis based on 3T preoperative MRI can predict the grade of soft-tissue sarcomas.
Thus, we hypothesized that texture analysis, which provides information about tumoral heterogeneity, may be useful in predicting the grade of soft-tissue sarcomas. The purpose of this study was to determine the value of 3T MRI texture analysis for differentiating high-grade from low-grade soft-tissue sarcomas.
2. Methods
2.1. Patient population
The institutional review board approved this retrospective study. It was performed in accordance with procedures complied with HIPAA guidelines. The requirement for written informed consent was waived by the institutional review board due to its retrospective nature. Between June 2010 and December 2017, 108 patients were referred for surveillance of soft-tissue sarcoma at the authors’ institute. Inclusion criteria were as follows: patients who underwent preoperative 3T MRI, and who underwent definite histopathologic confirmation including tumor grade after surgery. Patients treated with preoperative chemotherapy or radiation therapy, had poor image quality, small (< 1 cm) lesion, unavailable contrast-enhance (CE) images, diagnosed only by biopsy, inappropriate pathological findings from the surgical specimen for assessment of tumor grade, and software technical error, were excluded (Fig. 1). Forty-two patients with soft-tissue sarcomas, who underwent 3T MRI, including CE imaging, and were pathologically graded after surgery, were ultimately included in this study.
Figure 1.
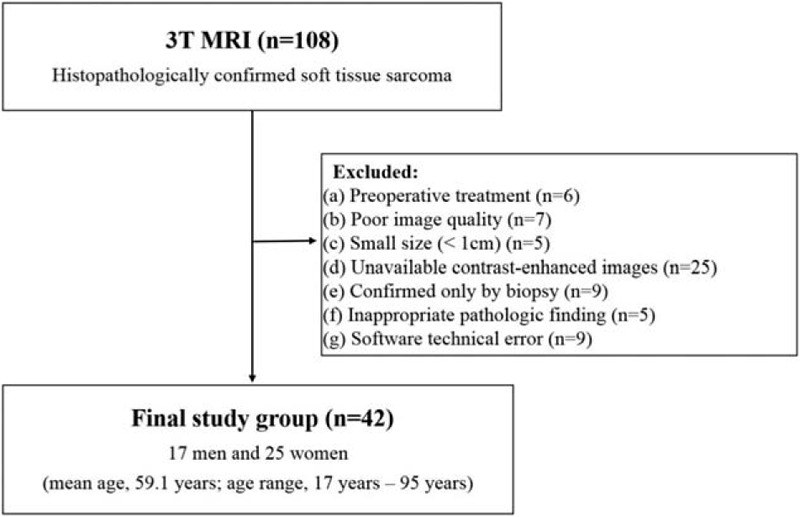
Flow diagram of the study.
2.2. MRI protocols
MR examinations were performed using a 3T MRI unit (MAGNETOM Verio; Siemens Healthineers, Erlangen, Germany). The MRI protocols included longitudinal fat-suppressed T2-weighted turbo spin-echo (TSE) imaging, axial T1-weighted TSE imaging, and axial T2-weighted TSE imaging with and without fat-suppression. After contrast material injection, longitudinal and axial fat-suppressed T1-weighted images were acquired. The acquisition parameters were as follows: field of view, 100 to 280 mm2; matrix size, 512 x 216; slice thickness, 3 to 10 mm; intersection gap, 0 mm; TR, 680 to 870/4000-5600 msec; TE, 11 to 21/63 to 83 msec; turbo fator, 3/13; and number of excitations, 1.
2.3. Qualitative analysis of conventional MRI
Conventional MRI was reviewed by a musculoskeletal radiologist (J.H.H, 3 years’ experience of musculoskeletal radiology). The reader was blinded to the histologic grade of the tumors. The following qualitative MRI features were assessed: size, tumor location, signal intensity, signal intensity heterogeneity and tumor margin on T1- and T2-weighted images, peritumoral high signal intensity on T2-weighted images, enhancement appearance, tumor margin on fat suppressed CE T1-weighted images, peritumoral enhancement, cortex extension and marrow extension.
2.4. MRI texture analysis
Axial T1- and T2-weighted images and fat-suppressed CE T1-weighted images were obtained from the picture archiving and communication system (PACS) and loaded into prototype software (Multiparametric Analysis, Siemens Healthineers, Erlangen, Germany) for co-registration, lesion segmentation, and texture analysis. A musculoskeletal radiologist (J.H.H, 3 years’ experience in musculoskeletal radiology), who was blinded to clinical information and the pathology report, reviewed the MR images on the PACS and drew regions of interest (ROI) of soft-tissue sarcomas using the post-processing workstation. On multiple slices, an ROI was drawn to include the entire tumor to the maximum extent possible on CE T1-weighted images. T1- and T2-weighted images were spatially registered with fat-suppressed CE T1-weighted images using deformable registration. Thus, ROIs were co-localized on all axial images. To avoid partial-volume effects, tumor margins were not included. After drawing an ROI, the volume of interest (VOI) in the tumor was automatically calculated using the workstation. And then, texture analysis was performed.
In our study, statistical based texture analysis was performed. The statistical based technique generates several subsets of texture features, such as first-order statistics, from the histogram of signal intensities in the segmented VOI and second-order statistics, also known as the gray-level co-occurrence matrix (GLCM). Texture analysis, including first- and second-order statistics, was performed using the Multiparametric Analysis prototype software. Mean intensity, standard deviation (SD), skewness, and kurtosis were derived from the image histogram, and difference entropy, difference variance, contrast, and entropy were derived from the GLCM.
2.5. Pathological analysis
One pathologist (C.K.J, 17 years’ experience in musculoskeletal pathology) assessed the tumor grade based on pathology findings from surgical specimens obtained from the institution. The pathologist was blinded to the MRI findings. Tumors were graded according to the French Federation of Comprehensive Cancer Centers system.[25] Tumor grade was classified into 1 of 3 groups: grade 1, grade 2, and grade 3.
2.6. Statistical analysis
The pathological findings were used as the standard of reference. Tumor grades 2 and 3 were combined as high-grade for statistical analysis. Qualitative MRI features of low- and high-grade sarcomas were compared using Chi-squared test. Texture features were compared between high- and low-grade soft-tissue sarcomas using the Mann–Whitney U test. The areas under the receiver operating characteristic curves (AUC) for texture features were calculated to evaluate the diagnostic performance of each feature. Multivariate logistic regression analysis was conducted using features of qualitative and texture analysis which were significant in univariate analysis to analyze the diagnostic performance to predict tumor grade. The sensitivity and specificity of each multivariate model was calculated based on the cut-off value with highest Youden index. Statistical analysis was performed using SPSS version 19 (IBM Corporation, Armonk, NY); P < .05 was considered to be statistically significant.
3. Results
3.1. Patients
Forty-two patients (mean age, 59.1 years [range, 17–95 years]) were included in this study. There were 17 men (mean age, 56.3 years [range, 17–95 years]) and 25 women (mean age, 61 years [range, 23–84 years]). Among the 42 soft-tissue sarcomas, 11 lesions were grade 1, 8 were grade 2, and 23 were grade 3 on histopathology. The mean age of each group was 65.5 ± 11.2 and 56.8 ± 21.1 years for low- and high-grade sarcoma, respectively (P value = .206). The female proportion was 81.8% and 51.6% for low and high grade sarcoma, respectively (P value = .151). Table 1 shows the histopathologic types and grades of the included soft tissue sarcomas. The histological types of the included soft-tissue sarcomas included: undifferentiated pleomorphic sarcoma (n = 6), liposarcoma (n = 16, 9 low grade), myxofibrosarcoma (n = 5, 1 low grade), leiomyosarcoma (n = 3), malignant peripheral nerve sheath tumor (n = 3), synovial sarcoma (n = 2), rhabdomyosarcoma (n = 2), Ewing sarcoma (n = 1), angiosarcoma (n = 1), fibromyxoid sarcoma (n = 1, low grade), clear cell sarcoma (n = 1), and fibrosarcoma (n = 1).
Table 1.
Histopathologic types and grades of soft tissue sarcomas.

The mean interval from MRI to surgical resection was 9.2 days (range, 1–37 days).
3.2. Qualitative analysis of conventional MRI
Qualitative MRI features are summarized in Table 2. High-grade sarcomas were more likely to have poorly-defined margin on T2- (23/31 [74.2%] vs 3/11 [27.3%], P = .011) and fat-suppressed CE T1-weighted images (25/31 [80.6%] vs 3/11 [27.3%], P = .002). Peritumoral enhancement was more common in high- than low-grade sarcoma (25/31 [80.6%] vs 4/11 [36.4%], P = .019). Lesion hyperintensity on T1-weighted images was more frequently encountered in low- than high-grade sarcoma (8/11 [72.7%] vs 10/31 [32.3%], P = .033).
Table 2.
Qualitative imaging features of high- and low-grade soft tissue sarcomas.
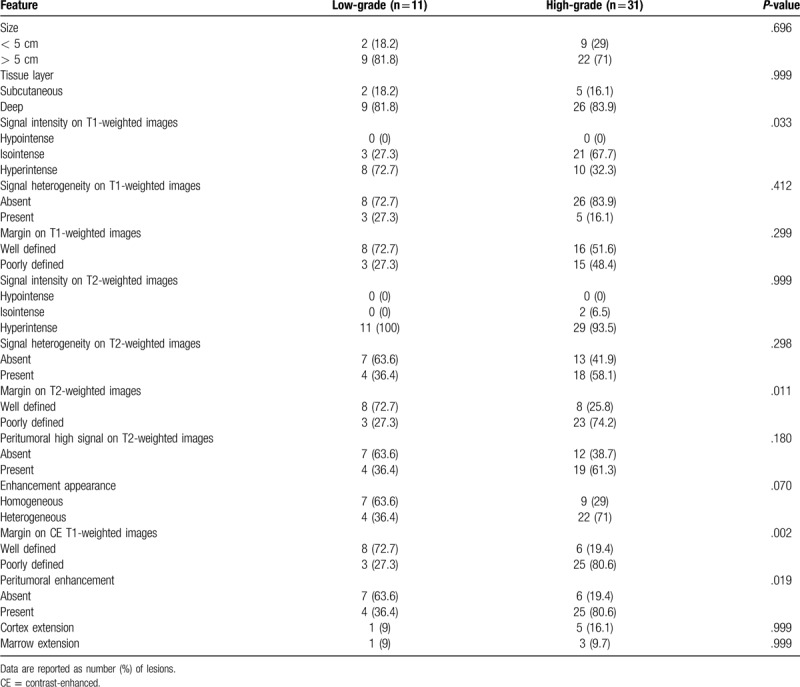
The sensitivity and specificity of qualitative features which showed significant difference between high- and low-grade sarcomas were as follows: 67.7% and 72.7% for hyperintensity on T1-weighted images; 74.2% and 72.7% for poorly-defined margin on T2-weighted images; 80.6% and 72.7% for poorly-defined margin on CE T1-weighted images; and 80.6% and 63.6% for peritumoral enhancement. The sensitivity and specificity of poorly-defined margin on CE T1-weighted images was the highest.
3.3. MRI texture analysis
Texture features based on histogram and GLCM are summarized in Table 3. Among the texture features based on histogram, T2 mean, CE T1 mean, T1 SD, and CE T1 skewness revealed significant differences: T2 mean, T1 SD and CE T1 skewness were significantly lower in high-grade than in low-grade sarcomas (655.0 ± 235.3 vs 850.0 ± 258.9, P = .041; 93.2 ± 65.6 vs 142.9 ± 66.3, P = .025; and .058 ± .679 vs .631 ± .570, P = .014, respectively). On the other hand, CE T1 mean values were significantly higher in high-grade than in low-grade sarcomas (649.2 ± 312.2 vs 385.9 ± 220.1, P = .009). In texture features based on GLCM, CE T1 difference variance and CE T1 contrast demonstrated significant differences, which were higher in high-grade than in low-grade sarcomas (.239 ± .086 vs .175 ± .064, P = .031; .430 ± .130 vs .354 ± .162, P = .027). Differences in other features did not reach statistical significance. Figures 2–4 show MRI findings and these texture features of soft tissue sarcoma in grade 1, 2, and 3.
Table 3.
Comparison of texture features of T1, T2, and contrast-enhanced T1 images between low-grade and high-grade soft tissue sarcomas.
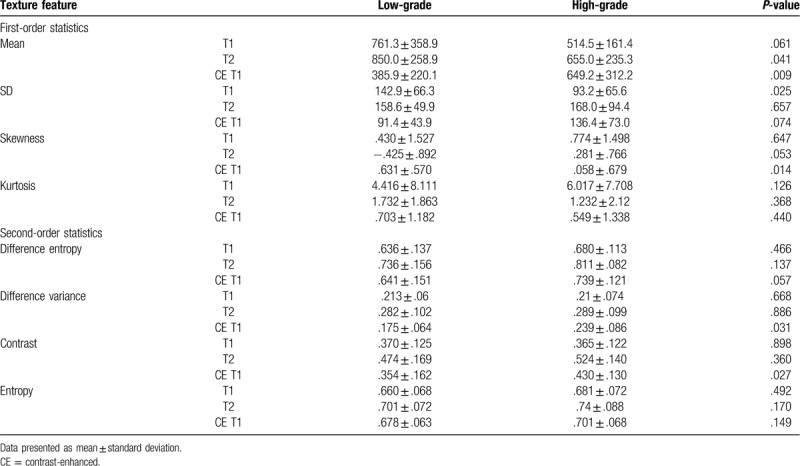
Figure 2.
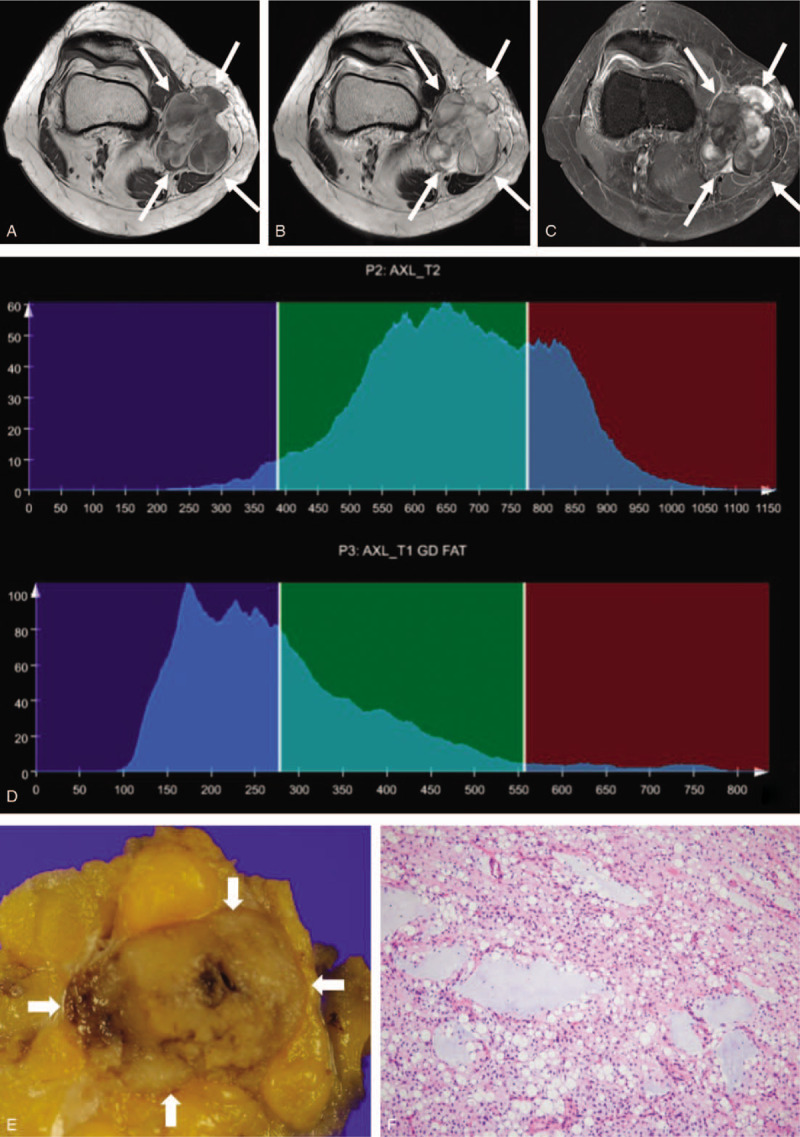
A 50-year-old woman with myxoid liposarcoma, grade 1. A mass with a lobulated margin in the medial side of knee is hypointense on axial T1-weighted imaging (a), heterogeneously hyperintense on axial T2-weighted imaging (b) and exhibits heterogeneous enhancement on axial fat-suppressed contrast-enhanced T1-weighted imaging (c). Whole-tumor T2 (upper) and contrast-enhanced (CE) T1 (lower) histograms (d) reveal negative T2 skewness (–0.104) and high CE T1 skewness (1.345). Texture features were high T1 standard deviation (108) and low CE T1 difference variance (0.176). These findings suggest low-grade sarcoma. (e) Grossly, the tumor is well circumscribed and shows gelatinous, tan-yellow cut surface. (f) In this microscopic image (hematoxylin-eosin stain; original magnification, x100), the tumor of low cellularity is composed of small spindled or ovoid non-lipogenic tumor cells with scant cytoplasm and lipoblasts in background of abundant myxoid stroma and arborizing capillary vasculature.
Figure 4.
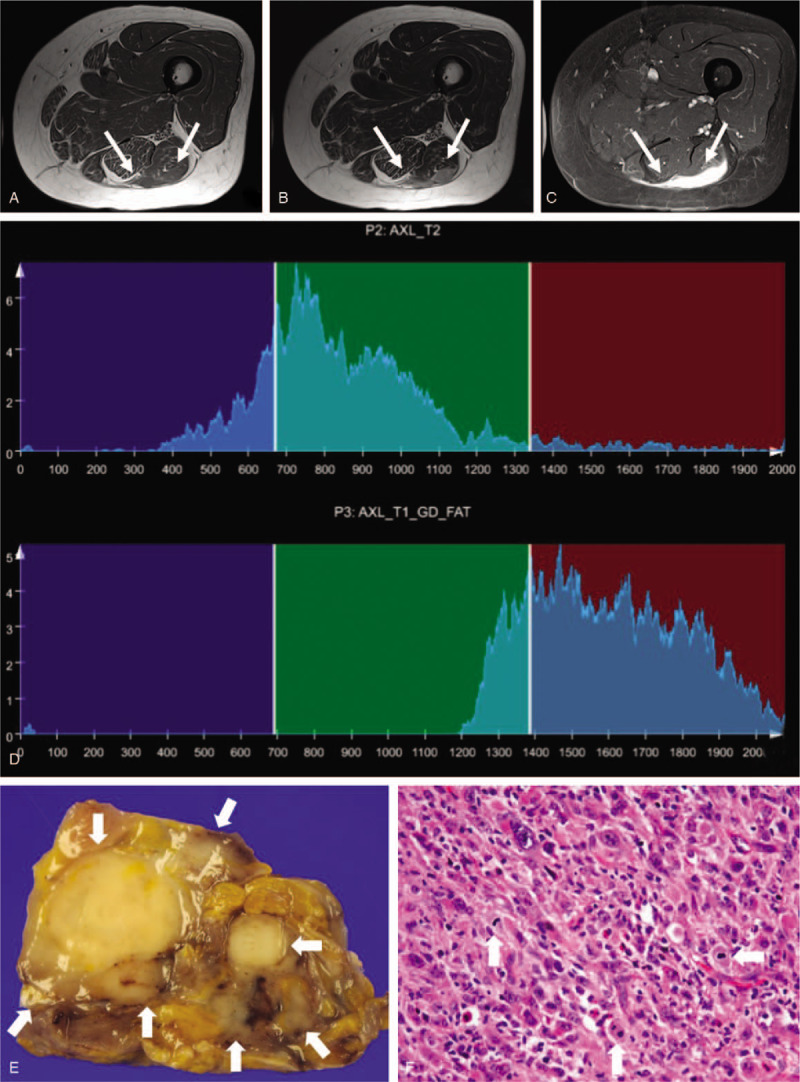
A 61-year-old woman with undifferentiated sarcoma, grade 3. Axial T1-weighted imaging (a) demonstrates a homogeneously hypointense mass within the posterior thigh. Axial T2-weighted imaging (b) shows relatively homogeneous hypointensity to intermediate signal. The mass shows homogeneous, intense contrast enhancement on axial fat-suppressed contrast-enhanced T1-weighted imaging (c). Whole-tumor T2 (upper) and contrast-enhanced (CE) T1 (lower) histograms (d) reveal high T2 skewness (1.233) and negative CE T1 skewness (-0.529). Texture features are high T2 mean (855.3), high T1 standard deviation (234), and high CE T1 difference variance (0.305). Texture features, except for T2 mean and T1 standard deviation, are compatible with high-grade sarcoma. (e) Grossly, an ill-defined tumor shows a lobulated, firm, tan-white cut surface. (f) In this microscopic image (hematoxylin-eosin stain; original magnification, x400), pleomorphic tumor cells are admixed with abundant chronic inflammatory cells and show frequent mitosis (arrows).
Figure 3.
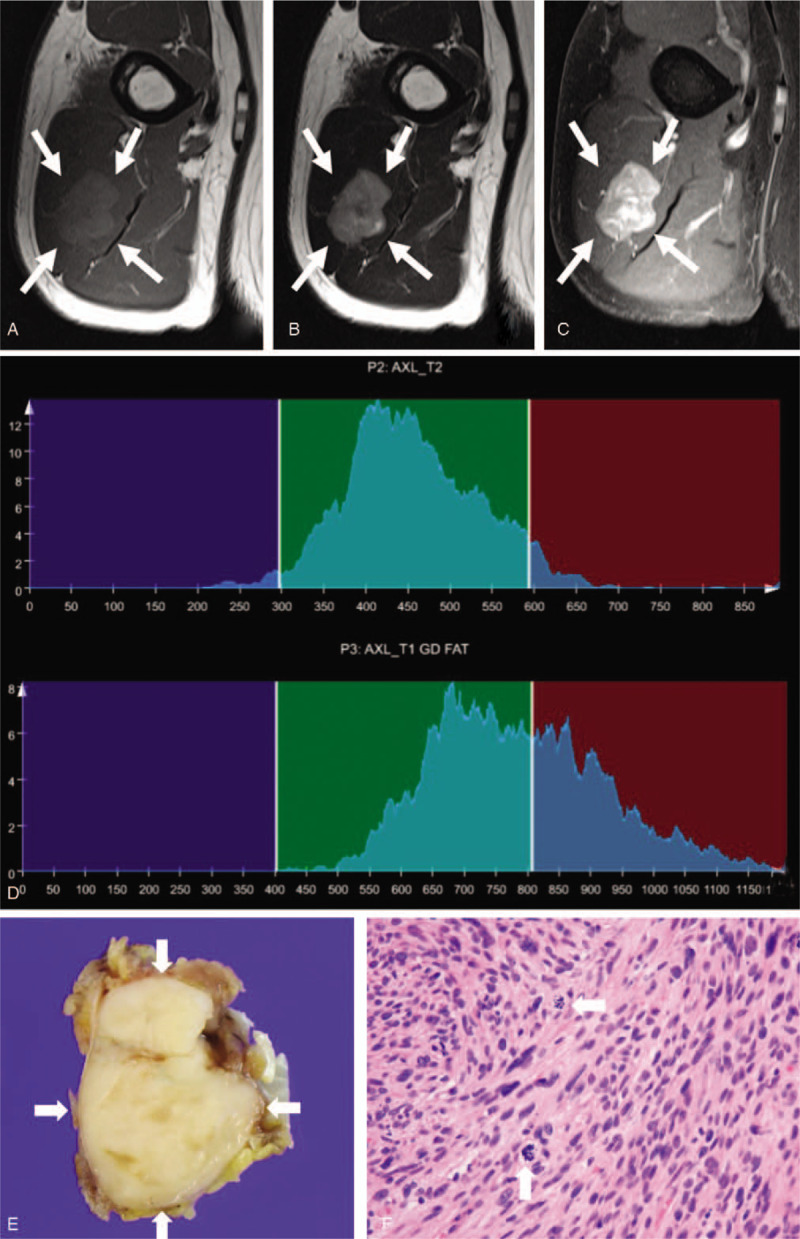
A 63-year-old man with leiomyosarcoma, grade 2. An intramuscular mass with circumscribed margin in the upper arm exhibits intermediate signal intensity on axial T1-weighted imaging (a), slight hyperintensity on axial T2-weighted imaging (b), and heterogeneous enhancement on axial fat-suppressed contrast-enhanced T1-weighted imaging (c). Whole-tumor T2 (upper) and contrast-enhanced (CE) T1 (lower) histograms (d) reveal high T2 skewness (0.402) and low CE T1 skewness (0.382). Texture features are low T1 standard deviation (49.2) and high CE T1 difference variance (0.275). These findings suggest high-grade sarcoma. (e) Grossly, the tumor is well circumscribed and shows firm to fleshy, whitish cut surface. (f) In this microscopic image (hematoxylin-eosin stain; original magnification, x400), spindle tumor cells are arranged in a fascicular architecture and show eosinophilic cytoplasm, elongated blunt-ended nuclei, and frequent mitosis (arrows).
We obtained receiver operating characteristic curves for texture features which demonstrated a significant difference between high- and low-grade sarcomas (Fig. 5). The diagnostic performance for assessment of tumor grade in soft-tissue sarcomas is summarized in Table 4. AUC of the above texture features that demonstrated significant differences were all > 0.7 (.710 [95% CI .543, .876] in T2 mean; .768 [95% CI .590, .947] in CE T1mean; .730 [95% CI .554, .906] in T1 SD; .751 [95% CI .586, .916] in CE T1 skewness; .721 [95% CI .536, .907] in CE T1 difference variance; .727 [95% CI .530, .924] in CE T1 contrast). In addition, we performed multivariate analysis for each texture features to investigate the impact of age and sex on their diagnostic performance. CE T1 mean, CE T1 skewness and CE T1 difference variance remained significant even after the adjustment for age and sex (Table 4).
Figure 5.
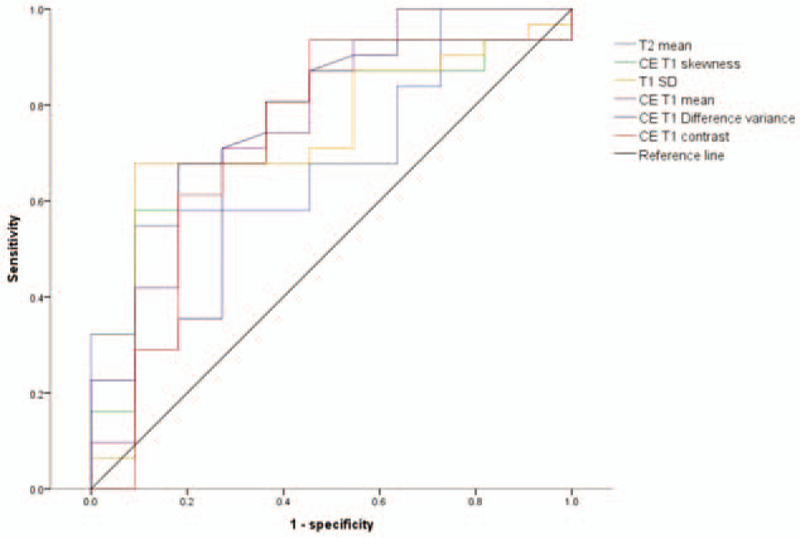
Receiver operating characteristic curves for texture features, which demonstrate a significant difference between high- and low-grade sarcomas.
Table 4.
Diagnostic performance of texture features for assessment of tumor grade in soft tissue sarcomas.

3.4. Multivariate models using qualitative and texture analysis
We constructed multivariate logistic regression models using features of qualitative and texture analysis which were significant in univariate analysis. The diagnostic performances of the models are summarized in Table 5. The multivariate model composed of only the texture features had numerically higher AUC than that composed of only the qualitative features. The model composed of both qualitative and texture features had even higher AUC than those models composed of only qualitative or texture features, although the difference was not statistically significant (Fig. 6). The multivariate model composed of both qualitative and texture features had higher sensitivity and specificity than the model composed of only qualitative features.
Table 5.
Multivariate logistic regression models using qualitative and/or texture analysis.

Figure 6.
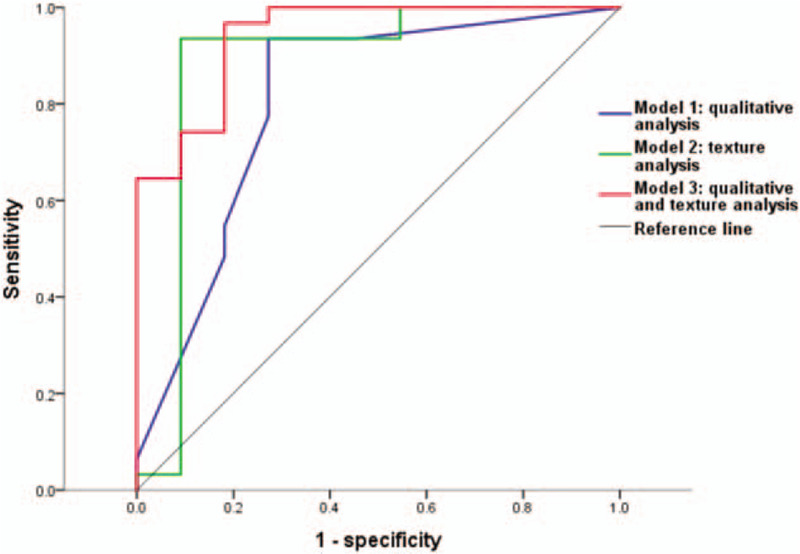
Receiver operating characteristic curves for models using features of qualitative and/or texture analysis which were significant in univariate analysis.
4. Discussion
The results of our study demonstrated that texture analysis at 3T MRI may provide additional diagnostic value to the qualitative MRI features for the differentiation of high- and low-grade sarcomas. Among all texture features, T2 mean, CE T1 mean, T1 SD, CE T1 skewness, CE T1 difference variance, and CE T1 contrast showed significant difference between high- and low-grade sarcomas. The AUCs of these features were fairly high (> 0.7). In multivariate logistic regression analysis, the AUC of both texture and qualitative features was numerically higher than that of either qualitative or texture features alone.
The histological grade of soft-tissue sarcoma is one of the most important prognostic factors. Preoperative prediction of tumor grade is essential for planning a patient's treatment strategy.[4] Preoperative biopsy can be used for diagnosing and grading of soft-tissue sarcomas. However, biopsy specimens cannot represent the entire tumor; grading of sarcoma using biopsy, therefore, may be limited. Yang et al[26] found that preoperative tumor grades that were evaluated using biopsy were changed after surgical resection in 5 of 66 soft-tissue sarcomas. Texture analysis of whole tumor volume is a non-invasive tool for preoperatively predicting tumor grade.
Fernebro et al and Zhao et al[8,9] revealed that MRI features may be used to differentiate high-grade from low-grade sarcomas. Zhao et al[9] reported that high-grade tumors exhibited larger size, poorly defined tumor margin, more heterogeneous signal intensity, and peritumoral high signal intensity on T2-weighted images and peritumoral enhancement on T1-weighted CE images. Previous studies[8,9] have reported that tumoral heterogeneity, tumor margin, and peripheral growth pattern are important factors in predicting tumor grade. We also found that high-grade tumors are more likely to have poorly-defined margin on T2- and fat-suppressed CE T1-weighted images and peritumoral enhancement. These results are consistent with previous studies.[8,9] Low-grade sarcomas showed more frequently hyperintense signal intensity on T1-weighted images in this study. We suspect that this result is due to higher number of liposarcoma among low-grade sarcomas. Unlike previous studies, tumoral heterogeneity on T1-, T2-, and fat-suppressed CE T1-weighted images were not significantly different between high- and low-grade sarcoma. We assumed that the assessment of tumoral heterogeneity by visual and qualitative analysis might be limited. In our study, texture analysis was also used to perform quantitative analysis regarding tumoral heterogeneity and spatial arrangement. We found that texture features, which provide quantitative information about tumoral heterogeneity and growth pattern, may help to differentiate high-grade from low-grade soft-tissue sarcomas.
First-order features are calculated from the histogram of pixel intensity values and reflect tumor heterogeneity; SD, kurtosis, and skewness are such first-order features. Several studies have reported that these first-order features were useful in predicting tumor stage and in assessing treatment response in tumors.[12,20,21,27,28] In our study, T2 mean, CE T1 mean, T1 SD and CE T1 skewness were significantly different between low-grade and high-grade sarcoma. CE T1 skewness was significantly lower in high-grade than in low-grade tumor. This was consistent previous studies[15,16,29] that have used non-CE and CE computed tomography and MR imaging for other organs. Skewness means the asymmetry of the distribution. Lower skewness means more symmetric distribution. Features derived from histogram analysis reflect cellular distribution of tumor as well as distribution of contrast agent.[15,16] It means that first order features are associated with tumor vascular permeability and then tumors with high vascular permeability may show less heterogeneity in first order texture analysis.[15,16]
Second-order features calculated by GLCMs may reflect the relationship between neighboring pixels. Such features have been used to differentiate benign from malignant breast lesions, and to stage tumors in the kidney and rectum.[12,18,27] In our study, difference entropy, difference variance, contrast and entropy were used as second-order features. Among these features, CE T1 difference variance and CE T1 contrast exhibited significant differences, which were higher in high-grade than low-grade sarcomas. Contrast means degree of difference in the neighboring values, and difference variance describes the dispersion (with regard to the mean) of the difference gray-level distribution of the image. Our current study showed high-grade sarcoma have dissimilar and wider distribution in GLCM. These results suggest high-grade sarcoma are more spatially heterogeneous on CE T1-weighted images.
There are small number of recent studies which have predicted grade of soft-tissue sarcoma using texture analysis.[22–24] They performed texture analysis based on only ADC maps or fat suppressed T2-weighted images or T1- and T2-weighted images. We used T1- and T2-weighted images and fat-suppressed CE T1-weighted images for texture analysis. Among total 24 texture features, CE T1 mean and CE T1 skewness showed the highest discriminatory power to differentiate high-grade from low-grade sarcoma. Previous researches revealed that contrast-enhanced CT or MR texture analysis was useful to differentiate benign from malignant tumor, stage the tumor and predict the survival.[16,30,31] Our results also suggest that texture analysis based on CE T1 weighted images could be useful tool for prediction of tumor grade in soft tissue sarcoma.
To compare the overall diagnostic performance of qualitative and texture features, we constructed multivariate logistic models composed of qualitative, texture features and both. Although, the difference was not statistically significant, the multivariate model of texture features had higher AUC than that of qualitative features. Furthermore, the addition of texture features to the multivariate model of qualitative features increased both sensitivity and specificity.
Our study had several limitations, the first of which were its retrospective design, lack of a standardized MRI protocol, and relatively small sample size. Although selection bias was possible, we recruited consecutive patients who fulfilled the inclusion criteria. We performed texture analysis using dataset with different voxel size due to its retrospective nature. We used only some of the many variable texture features and, therefore, further studies using more diverse texture features may be needed.
In conclusion, our study demonstrated that several texture features are significantly different between high- and low-grade sarcomas and diagnostic performance of these texture features were fairly high. The addition of texture analysis to the conventional qualitative MRI analysis may provide additional diagnostic value for the prediction of soft tissue sarcoma grade.
Acknowledgments
The authors thank Siemens Healthineers (Robert Grimm, Yohan Son, and Mun Young Paek) for providing the Multiparametric Analysis prototype software.
Author contributions
Acquisition of data: Ji Hyun Hong, Won-Hee Jee, Chan-Kwon Jung, Yang-Guk Chung.
Analysis and interpretation of data: Ji Hyun Hong, Won-Hee Jee.
Critical review: Won-Hee Jee.
Drafting of manuscript: Ji Hyun Hong, Won-Hee Jee, Chan-Kwon Jung, Yang-Guk Chung.
Study conception and design: Ji Hyun Hong, Won-Hee Jee.
Footnotes
Abbreviations: AUC = area under the receiver operating characteristic curve, CE = contrast-enhanced, CI = confidence interval, GLCM = gray-level co-occurrence matrix, MRI = magnetic resonance imaging, PACS = picture archiving and communication system, ROC = receiver operating characteristic, ROI = regions of interest, SD = standard deviation, TSE = turbo spin-echo, VOI = volume of interest.
How to cite this article: Hong JH, Jee W-H, Jung C-K, Chung Y-G. Tumor grade in soft-tissue sarcoma: prediction with magnetic resonance imaging texture analysis. Medicine. 2020;99:27(e20880).
The authors have no funding and conflicts of interest to disclose.
The datasets generated during and/or analyzed during the current study are available from the corresponding author on reasonable request.
References
- [1].Stefanovski PD, Bidoli E, De Paoli A, et al. Prognostic factors in soft tissue sarcomas: a study of 395 patients. Eur J Surg Oncol 2002;28:153–64. [DOI] [PubMed] [Google Scholar]
- [2].Mandard AM, Petiot JF, Marnay J, et al. Prognostic factors in soft tissue sarcomas. A multivariate analysis of 109 cases. Cancer 1989;63:1437–51. [DOI] [PubMed] [Google Scholar]
- [3].Coindre JM. Grading of soft tissue sarcomas: review and update. Arch Pathol Lab Med 2006;130:1448–53. [DOI] [PubMed] [Google Scholar]
- [4].Lucas DR, Kshirsagar MP, Biermann JS, et al. Histologic alterations from neoadjuvant chemotherapy in high-grade extremity soft tissue sarcoma: clinicopathological correlation. Oncologist 2008;13:451–8. [DOI] [PubMed] [Google Scholar]
- [5].Kransdorf MJ, Jelinek JS, Moser RP, Jr, et al. Soft-tissue masses: diagnosis using MR imaging. AJR Am J Roentgenol 1989;153:541–7. [DOI] [PubMed] [Google Scholar]
- [6].Totty WG, Murphy WA, Lee JK. Soft-tissue tumors: MR imaging. Radiology 1986;160:135–41. [DOI] [PubMed] [Google Scholar]
- [7].Walker EA, Salesky JS, Fenton ME, et al. Magnetic resonance imaging of malignant soft tissue neoplasms in the adult. Radiol Clin North Am 2011;49:1219–34. [DOI] [PubMed] [Google Scholar]
- [8].Fernebro J, Wiklund M, Jonsson K, et al. Focus on the tumour periphery in MRI evaluation of soft tissue sarcoma: infiltrative growth signifies poor prognosis. Sarcoma 2006;2006:21251. [DOI] [PMC free article] [PubMed] [Google Scholar]
- [9].Zhao F, Ahlawat S, Farahani SJ, et al. Can MR imaging be used to predict tumor grade in soft-tissue sarcoma? Radiology 2014;272:192–201. [DOI] [PubMed] [Google Scholar]
- [10].Davnall F, Yip CS, Ljungqvist G, et al. Assessment of tumor heterogeneity: an emerging imaging tool for clinical practice? Insights Imaging 2012;3:573–89. [DOI] [PMC free article] [PubMed] [Google Scholar]
- [11].Fisher R, Pusztai L, Swanton C. Cancer heterogeneity: implications for targeted therapeutics. Br J Cancer 2013;108:479–85. [DOI] [PMC free article] [PubMed] [Google Scholar]
- [12].Liu L, Liu Y, Xu L, et al. Application of texture analysis based on apparent diffusion coefficient maps in discriminating different stages of rectal cancer. J Magn Reson Imaging 2017;45:1798–808. [DOI] [PubMed] [Google Scholar]
- [13].Ganeshan B, Skogen K, Pressney I, et al. Tumour heterogeneity in oesophageal cancer assessed by CT texture analysis: preliminary evidence of an association with tumour metabolism, stage, and survival. Clin Radiol 2012;67:157–64. [DOI] [PubMed] [Google Scholar]
- [14].Miles KA, Ganeshan B, Griffiths MR, et al. Colorectal cancer: texture analysis of portal phase hepatic CT images as a potential marker of survival. Radiology 2009;250:444–52. [DOI] [PubMed] [Google Scholar]
- [15].Kim JH, Ko ES, Lim Y, et al. Breast cancer heterogeneity: MR imaging texture analysis and survival outcomes. Radiology 2017;282:665–75. [DOI] [PubMed] [Google Scholar]
- [16].Ng F, Ganeshan B, Kozarski R, et al. Assessment of primary colorectal cancer heterogeneity by using whole-tumor texture analysis: contrast-enhanced CT texture as a biomarker of 5-year survival. Radiology 2013;266:177–84. [DOI] [PubMed] [Google Scholar]
- [17].Woods BJ, Clymer BD, Kurc T, et al. Malignant-lesion segmentation using 4D co-occurrence texture analysis applied to dynamic contrast-enhanced magnetic resonance breast image data. J Magn Reson Imaging 2007;25:495–501. [DOI] [PubMed] [Google Scholar]
- [18].Holli K, Laaperi AL, Harrison L, et al. Characterization of breast cancer types by texture analysis of magnetic resonance images. Acad Radiol 2010;17:135–41. [DOI] [PubMed] [Google Scholar]
- [19].Parikh J, Selmi M, Charles-Edwards G, et al. Changes in primary breast cancer heterogeneity may augment midtreatment MR imaging assessment of response to neoadjuvant chemotherapy. Radiology 2014;272:100–12. [DOI] [PubMed] [Google Scholar]
- [20].Peng SL, Chen CF, Liu HL, et al. Analysis of parametric histogram from dynamic contrast-enhanced MRI: application in evaluating brain tumor response to radiotherapy. NMR Biomed 2013;26:443–50. [DOI] [PubMed] [Google Scholar]
- [21].King AD, Chow KK, Yu KH, et al. Head and neck squamous cell carcinoma: diagnostic performance of diffusion-weighted MR imaging for the prediction of treatment response. Radiology 2013;266:531–8. [DOI] [PubMed] [Google Scholar]
- [22].Corino VDA, Montin E, Messina A, et al. Radiomic analysis of soft tissues sarcomas can distinguish intermediate from high-grade lesions. J Magn Reson Imaging 2018;47:829–40. [DOI] [PubMed] [Google Scholar]
- [23].Zhang Y, Zhu Y, Shi X, et al. Soft Tissue Sarcomas: preoperative predictive histopathological grading based on radiomics of MRI. Acad Radiol 2019;26:1262–8. [DOI] [PubMed] [Google Scholar]
- [24].Wang H, Chen H, Duan S, et al. Radiomics and machine learning with multiparametric preoperative MRI may accurately predict the histopathological grades of soft tissue sarcomas. J Magn Reson Imaging 2019;51:791–7. [DOI] [PubMed] [Google Scholar]
- [25].Guillou L, Coindre JM, Bonichon F, et al. Comparative study of the National Cancer Institute and French Federation of Cancer Centers Sarcoma Group grading systems in a population of 410 adult patients with soft tissue sarcoma. J Clin Oncol 1997;15:350–62. [DOI] [PubMed] [Google Scholar]
- [26].Yang J, Frassica FJ, Fayad L, et al. Analysis of nondiagnostic results after image-guided needle biopsies of musculoskeletal lesions. Clin Orthop Relat Res 2010;468:3103–11. [DOI] [PMC free article] [PubMed] [Google Scholar]
- [27].Kierans AS, Rusinek H, Lee A, et al. Textural differences in apparent diffusion coefficient between low- and high-stage clear cell renal cell carcinoma. AJR Am J Roentgenol 2014;203:W637–44. [DOI] [PubMed] [Google Scholar]
- [28].Downey K, Riches SF, Morgan VA, et al. Relationship between imaging biomarkers of stage I cervical cancer and poor-prognosis histologic features: quantitative histogram analysis of diffusion-weighted MR images. AJR Am J Roentgenol 2013;200:314–20. [DOI] [PubMed] [Google Scholar]
- [29].Goh V, Ganeshan B, Nathan P, et al. Assessment of response to tyrosine kinase inhibitors in metastatic renal cell cancer: CT texture as a predictive biomarker. Radiology 2011;261:165–71. [DOI] [PubMed] [Google Scholar]
- [30].Karahaliou A, Vassiou K, Arikidis NS, et al. Assessing heterogeneity of lesion enhancement kinetics in dynamic contrast-enhanced MRI for breast cancer diagnosis. Br J Radiol 2010;83:296–309. [DOI] [PMC free article] [PubMed] [Google Scholar]
- [31].Lisson CS, Lisson CG, Flosdorf K, et al. Diagnostic value of MRI-based 3D texture analysis for tissue characterisation and discrimination of low-grade chondrosarcoma from enchondroma: a pilot study. Eur Radiol 2018;28:468–77. [DOI] [PubMed] [Google Scholar]


