Abstract
Evidence suggests that the shape of left atrium appendages (LAA) is a primary indicator in predicting stroke for patients diagnosed with atrial fibrillation (AF). Statistical shape modeling tools used to represent (i.e., parameterize) the underlying LAA variability are of crucial importance to learn shape-based predictors of stroke. Most shape modeling techniques use some form of alignment either as a data pre-processing step or during the modeling step. However, the LAA is a joint anatomy along with left atrium (LA), and the relative position and alignment plays a crucial part in determining risk of stroke. In this paper, we explore different alignment strategies for statistical shape modeling and how each strategy affects the stroke prediction capability. This allows for identifying a unified approach of alignment while analyzing the LAA anatomy for stroke. Here, we study three different alignment strategies, (i) global alignment, (ii) global translational alignment and (iii) cluster based alignment. Our results show that alignment strategies that take into account LAA orientation, i.e., (ii), or the inherent natural clustering of the population under study, i.e., (iii), provide significant improvement over global alignment in both qualitative as well as quantitative measures.
1. Introduction
Evidence suggests that patients with atrial fibrillation (AF) have an increased risk for ischaemic stroke. AF is closely tied to the shape and function of the left atrium (LA) and left atrial appendage (LAA) [1, 2]. The shapes and functions of these structures can be used for predicting stroke. There are various studies in cardiovascular research identifying factors in the functionality as well as morphology of the LA and LAA that correlates to and are predictive of stroke in patients suffering from atrial fibrillation [3–5]. An essential body of research identifies the shape/anatomy of LAA to be indicative of stroke [4,6].
As LAA shape is viewed as a stroke predictor, statistical shape modeling (SSM) tools used for learning the representation of LAA shape and its subsequent statistical analysis become immensely important. SSM tools follow one of two methodologies: correspondence-based methods that take in a population of shapes and places a dense set of geometrically consistent points on each shape [7,8], and deformation-based methods that compute the coordinate transformations between images/shapes and use them as implicit representation of shape information [9]. In this study, we focus on a correspondend-based method, namely particle-based shape modeling [7], and its open-source software, ShapeWorks [10].
To learn a population-level consistent shape representation, SSM tools rely on shape alignment, prior or within the shape representation optimization process, to factor out some global transformations not relevant to the statistical analyses. In most cases, the anatomy of interest is an independent entity and a global rigid alignment, which removes the translation and rotational component across the population of shapes, is sufficient for SSM. However, several cases deal with joint anatomies, and in such cases the relative alignment between anatomies plays an important role along with the absolute shape. For instance, to analyze the kinematics of knee in [11], the authors stress on the importance of relative alignment of articular structure along with its shape. This discussion of joint anatomy is relevant to stroke as the LAA and LA are joint anatomies and SSM of the LAA needs to consider the relative alignment between the LA and LAA. We hypothesize that while LAA shape is important for stroke assessment, its alignment relative to the LA also plays an important role in subsquent analysis, and in particular, stroke prediction.
In this paper, we explore and evaluate different alignment strategies for LAA during SSM and its subsequent impact on the task of predicting stroke outcome. We explore three different alignment strategies, and use their respective shape models to identify dominant components of shape variation in LAA population that are the most predictive of stroke. We qualitatively assess these modes by qualitatively comparing them with known LAA traits indicative of stroke [6]. We also evaluate such different strategies quantitatively by classifying LAA of being normal or stroke, and comparing the misclassification scores for different alignment strategies. We conclude that global rigid alignment on LAA population is not beneficial with respect to predicting stroke outcome, and provide two alternate strategies that produces better results.
2. Methods
Cohort and shape models
We conducted this exploratory study on a cohort of 243 cardiac MRI scans of AF patients, including the segmentations of the left atrium (LA) and left atrium appendage (LAA), retrospectively obtained from the AFib database at the University of Utah Hospital. Each cardiac scan is also associated with the binary class label of “stroke”(1) and “no stroke”(0), with 200 normal (no-stroke) scans and 43 stroke scans. We used ShapeWorks [10] to represent this LAA population using as a correspondence-based shape model. There is a pipeline of pre-processing steps required before executing ShapeWorks, which includes, isotropic resampling, alignment, padding and cropping, and conversion to distance transforms (for dense correspondences optimization). After ShapeWorks optimization, each LAA shape is represented using 512 3D correspondence points. These correspondences are simple and computationally efficient representations to investigate the relationship between shape of LAA and stroke outcome. For analysis of an independent anatomy, the choice of alignment strategy is usually global translation and rotational alignment. However, LAA’s relative position with LA is of interest while modeling the LAA shape, and hence, we explore the resulting shape models using three different alignment strategies.
Alignment strategies
In this work, we consider three different alignment strategies: (i) global alignment that performs translation and rotation alignment of all the LAA shapes to a reference shape, (ii) global center of mass alignment that only aligns the global translation component by translating the center of mass of each segmented LAA to their corresponding image centers, and (iii) cluster based alignment that clusters LAA using k-means algorithm [12] into 4 clusters (with number of clusters obtained using the elbow method [13]) and performs the translation and rotation alignment in each cluster independently. To underscore, we only employ these strategies for the alignment as a pre-processing step, all other steps before and after such alignment including the shape modeling optimization is exactly the same across the three alignment strategies. Hereafter, we will use the roman numerals (i), (ii), and (iii) to describe these three alignment strategies.
Stroke prediction
For each alignment strategy,, we perform principal component analysis (PCA) on the optimized correspondences and express each LAA shape using the PCA loading vector. The dimension of the loading vector is determined by the number of PCA components that explains 95% variability of data (13 dimensions were found for three models). Let si denote the PCA loading for shape i, and the associated label be yi. After PCA, we want to find which of the 13 PCA components are most predictive of stroke. Here, we use lasso regression on 1000 random subsets (represented by indices i ∈ [m]j, where j is the subset index) of the data, i.e., for each subset, we solve the following:
Solving each of these equations gives a weight vector w, and all the non-zero entries in w correspond to the PCA loading components which are relevant to predicting stroke. We then compute the probability of each PCA component to be predictive of stroke by counting the number of times it was identifed relevant in the 1000 subsets.
We select the top 3 most relevant PCA components, having the highest probabilities of being selected in the lasso analysis described above. We use these three dimensions to learn a stroke prediction classifier. For the stroke prediction, we use logistic regression after splitting the data into training and testing subsets. The output of logistic regression is a stroke probability for an LAA shape represented as a tuple of 3 dominant PCA loading values.
3. Results and discussion
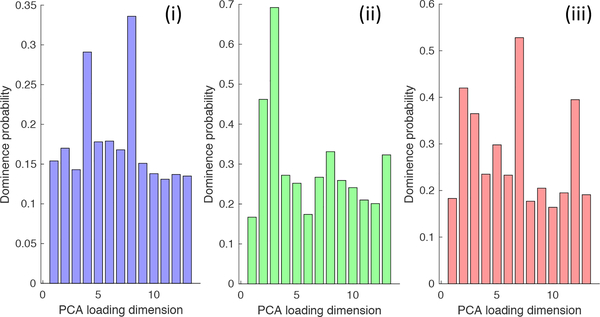
In this section, we report the results obtained by the alignment methods describes in Section 2, and analyze them in the context of LAA shape-based stroke prediction. We performed SSM using ShapeWorks [7] with the different alignment strategies, performed PCA, and used the lasso analysis to produce the probability bar charts for each alignment strategy (Figure 1).
Figure 1.
Probabilities of PCA dimensions to determine the dominant modes that are predictive of stroke for three different properties, (i) global alignment, (ii) global center of mass alignment and, (iii) cluster based alignment.
We predict stroke using logistic regression (described in Section 2) and compute the probability of stroke for each LAA shape. Using probability thresholding(threshold at 50% probability), we compute the misclassifications over the entire dataset for each of three different alignment strategies, enumerated in Table 1. The misclassifications are divided into misclassfications in the 200 normal scans and misclassifications in the 43 stroke scans. We find that the misclassifications percentage for the stroke data is about 7% more in strategy (i) as compared to (ii) and (iii). This behaviour is expected from the probability charts in Figure 1. Strategy (i) has a flat probability distributions and even the most relevant components are significant only 30% of the times, wheras strategy (ii) and (iii) have clear dominant/relevant components that show that global rigid alignment gets rid of the prominent stroke predictive component. Another observation from Table 1 indicates that stroke scans have much higher error as compared to the normal scans. This can be explained by the skewed data, since we have almost 5 times more normal as compared to stroke. Hence, the logistic regression tends to be biased towards accurately predicting the normals compared to stroke.
Table 1.
Missclassification (Misclass) scores from the logistic regression trained on three dominant modes coning in from three different alignment strategies.
| Strategy | Misclass-Normal | Misclass-Stroke |
|---|---|---|
| (i) | 24.2% | 66.9% |
| (ii) | 24.6% | 59.4% |
| (iii) | 21.6% | 57.4% |
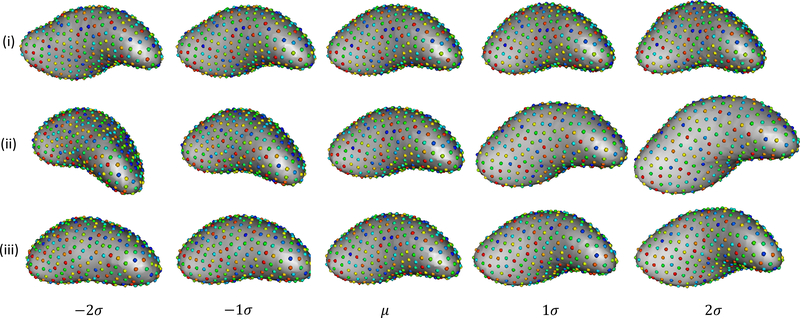
In Figure 3, we show the morphological variation along the most dominant/relevant modes of variation, in the context of stroke prediction, for each alignment strategies (Figure 1 showcases it is mode 8 for strategy (i), mode 3 for strategy (ii) and mode 7 for strategy (iii)). We observe that in rows 2 and 3, which correspond to strategy (ii) and (iii), LAA exhibits a variation that is approximately rotational, which indicates that a mode capturing variation in the relative alignment of LA and LAA is dominant for stroke prediction. Strategy (ii) shows a more prominent rotation as compared to strategy (iii) since the strategy (ii) retains all rotational components of variations wheras (iii) removes it within the cluster.
Figure 3.
The three rows represent the variation along the most dominant mode in regards to stroke prediction for the alignment strategies (i), (ii) and (iii) respectively.
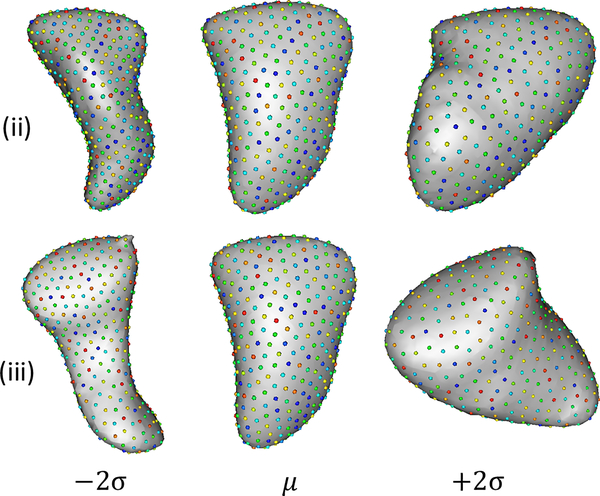
Studies show that LAA with the chicken wing morphology class has a low risk of stroke [3, 14], and in some cases [4] have found non-chicken wing morphology to be at higher risk for stroke. If we look at the most dominant modes for alignment strategy (ii) and (iii) closely, they correspond to moving towards (+2σ) a more chicken wing shape, which correlate with the clinical observations of shape variations relevant to stroke prediction. Such a variation is not observed in any of the modes for the global alignment strategy (i). Other studies such as [15] suggest that in patients with AF that exhibit stroke have larger LAA volume and LAA neck diameter (major and minor axes). The second most dominant mode for strategy (ii) and (iii) (mode number 2 in both cases) exhibits this variation of expanding and constricting the LAA neck, as seen in Figure 2. Again no such mode is observed in (i).
Figure 2.
These represent the ±2σ varying images from the second most dominant mode (which is most helpful in stroke prediction) for alignment strategies (ii) and (iii). Both for (ii) and (iii) these respective modes of variation represent the expansion and constriction of LAA neck diameter which according to previous clinical studies is an important factor in stroke prediction.
4. Conclusion
In this paper, we explored the role of LAA alignment as a preprocessing step for LAA statistical shape modeling for stroke prediction. We presented three different alignment strategies, namely (i) global alignment, (ii) global translational alignment and, (iii) global alignment within a cluster. With three different shape models using the aforementioned alignment strategies, we performed the same analysis on all three to determine which strategy is best for stroke prediction. We found that (ii) and (iii) outperform (i) in quantitative metrics and also produced clinically interpretable modes of variations that are indicative to stroke prediction. This showed that retaining some information that captures the relative alignment between LA and LAA is important for shape modeling on LAA shapes, especially in the context of stroke prediction.
Acknowledgments
This work was supported by NIH [grant numbers R01-AR-076120-01, R01- HL135568-02, and P41-GM103545-19].
References
- [1].Cates J, Bieging E, Morris A, Gardner G, Akoum N, Kholmovski E, Marrouche N, McGann C, MacLeod RS. Computational shape models characterize shape change of the left atrium in atrial fibrillation. Clinical Medicine Insights Cardiology 2014;8:CMC–S15710. [DOI] [PMC free article] [PubMed] [Google Scholar]
- [2].Bieging ET, Morris A, Wilson BD, McGann CJ, Marrouche NF, Cates J. Left atrial shape predicts recurrence after atrial fibrillation catheter ablation. Journal of Cardiovascular Electrophysiology 2018;29(7):966–972. [DOI] [PubMed] [Google Scholar]
- [3].Delgado V, Biase LD, Leung M, Romero J, Tops LF, Casadei B, Marrouche N, Bax JJ. Structure and function of the left atrium and left atrial appendage: Af and stroke implications. Journal of the American College of Cardiology 2017;70(25):3157–3172. [DOI] [PubMed] [Google Scholar]
- [4].Di Biase L, Santangeli P, Anselmino M, Mohanty P, Salvetti I, Gili S, Horton R, Sanchez JE, Bai R, Mohanty S, Pump A, Cereceda Brantes M, Gallinghouse GJ, Burkhardt JD, Cesarani F, Scaglione M, Natale A, Gaita F. Does the left atrial appendage morphology correlate with the risk of stroke in patients with atrial fibrillation? Journal of the American College of Cardiology 2012;60(6):531–538. [DOI] [PubMed] [Google Scholar]
- [5].Yaghi S, Song C, Gray WA, Furie KL, Elkind MS, Kamel H. Left atrial appendage function and stroke risk. Stroke 2015;46(12):3554–3559. [DOI] [PMC free article] [PubMed] [Google Scholar]
- [6].Khurram IM, Dewire J, Mager M, Maqbool F, Zimmerman SL, Zipunnikov V, Beinart R, E. Marine J, Spragg DD, Berger RD, Ashikaga H, Nazarian S, Calkins H. Relationship between left atrial appendage morphology and stroke in patients with atrial fibrillation. Heart Rhythm 2013; 10(12):1843–1849. [DOI] [PubMed] [Google Scholar]
- [7].Cates J, Fletcher PT, Styner M, Shenton M, Whitaker R. Shape modeling and analysis with entropy-based particle systems In IPMI. Springer, 2007; 333–345. [DOI] [PMC free article] [PubMed] [Google Scholar]
- [8].Styner M, Oguz I, Xu S, Brechbuehler C, Pantazis D, Levitt J, Shenton M, Gerig G. Framework for the statistical shape analysis of brain structures using spharm-pdm. The Insight Journal 2006;1071:242–250. [PMC free article] [PubMed] [Google Scholar]
- [9].Beg MF, Miller MI, Trouvé A, Younes L. Computing large deformation metric mappings via geodesic flows of diffeomorphisms. International journal of Computer Vision 2005; 61(2):139–157. [Google Scholar]
- [10].Cates J, Elhabian S, Whitaker R. Shapeworks: Particle-based shape correspondence and visualization software In Statistical Shape and Deformation Analysis. Elsevier, 2017; 257–298. [Google Scholar]
- [11].Smoger LM, Fitzpatrick CK, Clary CW, Cyr AJ, Maletsky LP, Rullkoetter PJ, Laz PJ. Statistical modeling to characterize relationships between knee anatomy and kinematics. Journal of Orthopaedic Research 2015;33(11):1620–1630. [DOI] [PMC free article] [PubMed] [Google Scholar]
- [12].Lloyd SP. Least squares quantization in PCM. IEEE Trans Information Theory 1982;28(2):129–136. [Google Scholar]
- [13].Hardy A An examination of procedures for determining the number of clusters in a data set In New approaches in classification and data analysis. Springer, 1994; 178–185. [Google Scholar]
- [14].Lupercio F, Diaz JC, Spinetto PV, Briceno D, Romero J, Gonzalez S, Maraboto C, Krumerman A, Garcia M, Natale A, Biase LD. Left atrial appendage morphology and stroke risk in patients with atrial fibrillation: A meta-analysis. Journal of the American College of Cardiology 2016;67(13 Supplement):713. [Google Scholar]
- [15].BEINART R, HEIST EK, NEWELL JB, HOLMVANG G, RUSKIN JN, MANSOUR M. Left atrial appendage dimensions predict the risk of stroke/tia in patients with atrial fibrillation. Journal of Cardiovascular Electrophysiology 2011;22(1):10–15. [DOI] [PubMed] [Google Scholar]


