

Abstract
Self-templating assemblies of the human prion protein are clinically associated with transmissible spongiform encephalopathies. Here we present the cryo-EM structure of a denaturant- and protease-resistant fibril formed in vitro spontaneously by a 9.7kDa unglycosylated fragment of the human prion protein. This human prion fibril contains two protofilaments intertwined with screw symmetry and linked by a tightly packed hydrophobic interface. Each protofilament consists of an extended beta arch formed by residues 106 to 145 of the prion protein, a hydrophobic and highly fibrillogenic disease-associated segment. Such structures of prion polymorphs serve as blueprints on which to evaluate the potential impact of sequence variants on prion disease.
Keywords: cryo-EM, structure, prion, prp, amyloid, fibril
Summary sentence:
The cryo-EM structure of a denaturant- and protease-resistant human prion fibril shows a parallel, in-register assembly with a hydrophobic core.
Introduction
Prions1, from benign assemblies to pathogenic proteinaceous infectious particles, undergo self-templated propagation and are found across the domains of life2–4. The protein only hypothesis for prion proteopathy rests on the existence of a polypeptide quaternary structure that encodes infectious and toxic properties 1. The mammalian prion protein can adopt both a native globular fold (PrPc) and a self-templating infectious fold (PrPSc) that can spread within or between certain species1. Despite the availability of native PrPc 5 structures, atomic structures of PrPSc are lacking6–10, and its mechanism for self-templating and lateral transmission remains a mystery6–8,11.
The enigma of prion propagation is deepened by the capacity for a single prion sequence to present variable pathologies1,12. Prion-induced disorders such as transmissible spongiform encephalopathies (TSEs)13 can have both genetic and sporadic origins12,13. Those caused by coding variants of the human prion protein include Creutzfeldt-Jakob disease (CJD), fatal familial insomnia (FFI), and Gertsmann-Sträussler-Scheinker (GSS), while sporadic TSEs include cases of Kuru, CJD, sporadic fatal insomnia (sFI), iatrogenic CJD and the new variant form of CJD (vCJD) associated with bovine encephalopathy1,13.
A molecular basis for prion disease has been established in part through the characterization of PrPSc isolates1. PrPSc from infected tissues can be resistant to proteolysis and denaturation14,15 and associated with fibrillar deposits16. Assemblies of infectious protease-resistant prions (PrPRes) can be disease associated, fibrillar, and variable in size and infectivity17,18. Electron micrographs of one protease-resistant infectious prion fragment known as PrP 27-30 (Fig. 1a)19 reveal polymorphic deposits that contain beta sheet-rich fibrils or rods20,21, potentially comprised of two intertwined protofilaments22.
Figure 1.
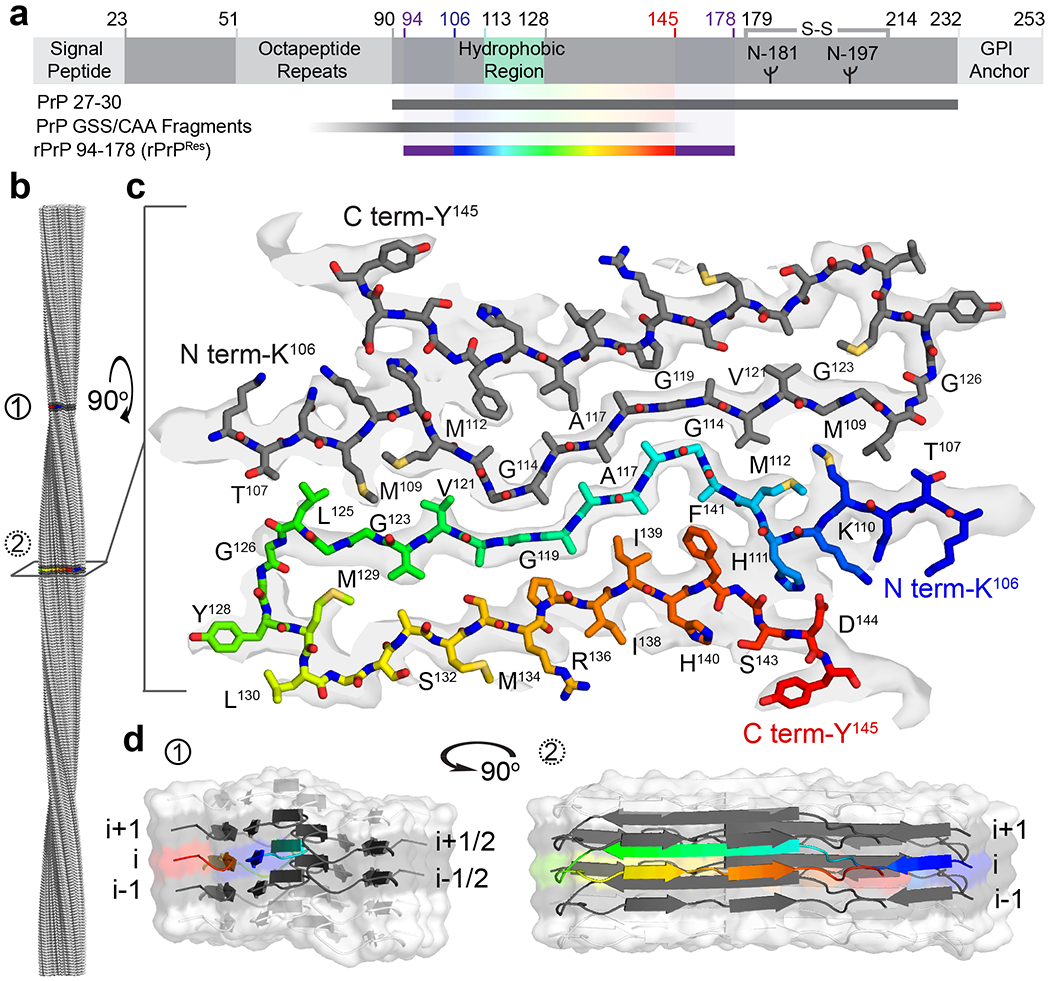
PrP domain architecture and structure of the rPrPRes fibril, the protease-resistant core of rPrP94-178. a Schematic representation of prion protein features and segments of interest. Sequence of PrP 27-3019, a protease resistant disease-associated fragment54,55, approximately 7-8 kDa fragments observed in patients with GSS and CAA54,55 and rPrP94-178 are indicated by gray and purple bars; the segment from residues 106 to 145 that forms rPrPRes is shown in rainbow. The disulfide bond between residues 179 and 214 in the native protein and the two possible N-linked glycosylation sites at residues 181 and 197 are noted. b Surface representation of the fibril model indicating its full 1260 Å pitch with regions of interest colored in dark gray and labeled (1) and (2). c A cross-section of the fibril with a stick representation of the model built into density is shown with termini and select residues labeled. d A space-filled and cartoon model of ten chains in a rPrPRes filament. The trajectory of a single rainbow-colored strand and the four (gray) chains it directly contacts are shown. The two orthogonal views correspond to regions (1) and (2) of the fibril shown in b.
Progress in prion studies has been accelerated by laboratory-generated constructs. Atomic structures of peptides fewer than 10-residues long reveal partial clues to the molecular basis for prion assemblies23,24, but lack context. PrP segments as short as 21 residues in length are fibrillogenic and toxic, but incapable of propagating disease25, while recombinant fibrils of an 89-residue segment of bank vole PrP (PrP90-178) are likewise fibrillogenic and show biophysical characteristics that mimic brain-derived PrPSc 25. Recombinantly generated26,27, C-terminally truncated28 and unglycosylated29 prions have now been shown to spontaneously form PrPSc-like aggregates that under certain conditions can retain infectivity and recapitulate transmission barriers in mouse models27,30,31. For example, recombinant, C-terminally truncated prion amyloid fibrils with parallel, in-register strands - whose most ordered region includes residues 112-139 of the mouse prion sequence32,33 (moPrP23-144) - are infectious to mice28. Thus, recombinant forms of mammalian PrP can create synthetic pathogenic prions28. However, structural variation between in vitro generated and tissue-isolated pathogenic prions can exist, as illustrated by comparisons of recombinant PrP fibrils generated in vitro to fibrils from full-length ex vivo infectious mouse prion isolates22,34,35. These differences underscore the need for atomic structures of both tissue-isolated and in vitro generated prion assemblies.
Results
Cryo-EM of recombinant, protease-resistant human prion fibrils
To gain atomic insights into the biophysical properties of prion assemblies, we interrogated the structure of prion fibrils formed by an 85-residue, 9.7 kDa fibrillogenic peptide encoding residues 94-178 of the human prion protein (rPrP94-178) (Extended Data Fig. 1). This recombinant, unglycosylated segment encompasses a substantial portion of the protease-resistant core of PrPSc 16,36,37 and the entire hydrophobic region of PrP (Fig. 1a)38–41. Within these regions are major portions of fibrillogenic segments previously shown to form infectious species with biophysical properties that mimic those of PrPSc 25,28,32. Continuous mixing of recombinantly purified rPrP94-178 in acidified 4M urea produced a heterogeneous population of aggregates that included amorphous species, fibrils and rods (Extended Data Fig. 1)25. Treatment with proteinase-K clarified the rPrP94-178 aggregates by removing some species while sparing others (Extended Data Fig. 2). The remnants of protease digestion were preserved in a solution of 2% SDS in a frozen-hydrated state for high-resolution cryo-electron microscopy (cryo-EM) (Extended Data Fig. 1, 2).
Views of rPrP94-178 fibrils were sorted into 2D classes that revealed one major, and several less abundant, morphologies. The most abundant morphology included unbranched fibrils approximately 8-10 nm wide with a 126 nm helical pitch; this type of fibril represented approximately 71 % of selected particles. The other morphologies, broadly classified as rods or ribbons of thickness varying from 7.2-18.8 nm, accounted for the remaining 29 % of selected particles (Extended Data Figs. 3, 4). The 3D structures of the less abundant species were not determined in this work due to their apparent absence of a regular helical twist. For this reason, we could not discern whether 2D classes of rod or ribbon fibrils represented different views of the same polymorph.
Architecture of a recombinant, protease-resistant human prion fibril polymorph
A 3.5 Å-resolution 3D map of the rPrP94-178 fibril core (Fig. 1c) was obtained by helical reconstruction with 21 screw symmetry from 76,246 windows 428 Å in size, selected along the length of rPrP94-178 fibrils (Extended Data Fig. 3, and Table 1). Approximately half of the 85 residues in rPrP94-178 could be placed into the cryo-EM map and modeled as part of two symmetric protofilaments that compose rPrP94-178 fibrils. These represent a protease-resistant structure we refer to as rPrPRes (Fig. 1; Extended Data Fig. 5).
Table 1.
Cryo-EM data collection, refinement and validation statistics
| rPrPRes (EMD-20900, PDB 6UUR) | |
|---|---|
| Data collection | |
| Magnification | 130,000x |
| Voltage (kV) | 300 |
| Electron exposure (e−/Å2) | 36 |
| Defocus range (μm) | 1.1-5.1 |
| Pixel size (Å)# | 1.07 |
| Symmetry imposed | C1 (21 screw) |
| Helical rise (Å) | 2.4 |
| Helical twist (°) | 179.3 |
| Initial particles images (no.) | 217,988 |
| Final particle images (no.) | 76,246 |
| Map Resolution (Å) | 3.54 (3.19) |
| FSC threshold | 0.5 (0.143) |
| Map resolution range (Å) | 200-3.54 |
| Refinement | |
| Model resolution (Å) | 3.60 (3.19) |
| FSC threshold | 0.5 (0.143) |
| Model resolution range (Å) | 200-3.60 |
| Map sharpening B factor (Å2) | −139.98 |
| Model composition | |
| Nonhydrogen atoms | 2770 (10 chains) |
| Protein residues | 2770 |
| B factors (Å2) | |
| Protein | 23.7 |
| R.m.s. deviations | |
| Bond lengths (Å) | 0.004 |
| Bond angles (°) | 0.752 |
| Validation | |
| MolProbity score | 1.81 |
| Clashscore | 8.15 |
| Poor rotamers (%) | 0.00 |
| Ramachandran plot | |
| Favored (%) | 94.74 |
| Allowed (%) | 5.26 |
| Disallowed (%) | 0.00 |
0.535 Å for super resolution mode
Secondary structure in rPrPRes fibrils differs from that in PrPC; segments that in the globular structure of PrPc form loops or helices make four beta strands linked by turns in rPrPRes (Fig. 2a). Strands in each rPrPRes protofilament stack parallel, in-register, spaced 4.8 Å apart (Extended Data Figs. 5). The overall structure of rPrPRes is reminiscent of, but distinct from, predicted models of truncated PrP fibrils32,42, and segments of rPrPRes coincide with atomic structures of prion hexapeptides to varying degrees. Some hexapeptide structures (Table 2) are predictive of local secondary structure in rPrPRes and mimic conformations suited for close amyloid-like packing in the context of the fibril (Extended Data Fig. 6, Supplementary Table 1).
Figure 2.
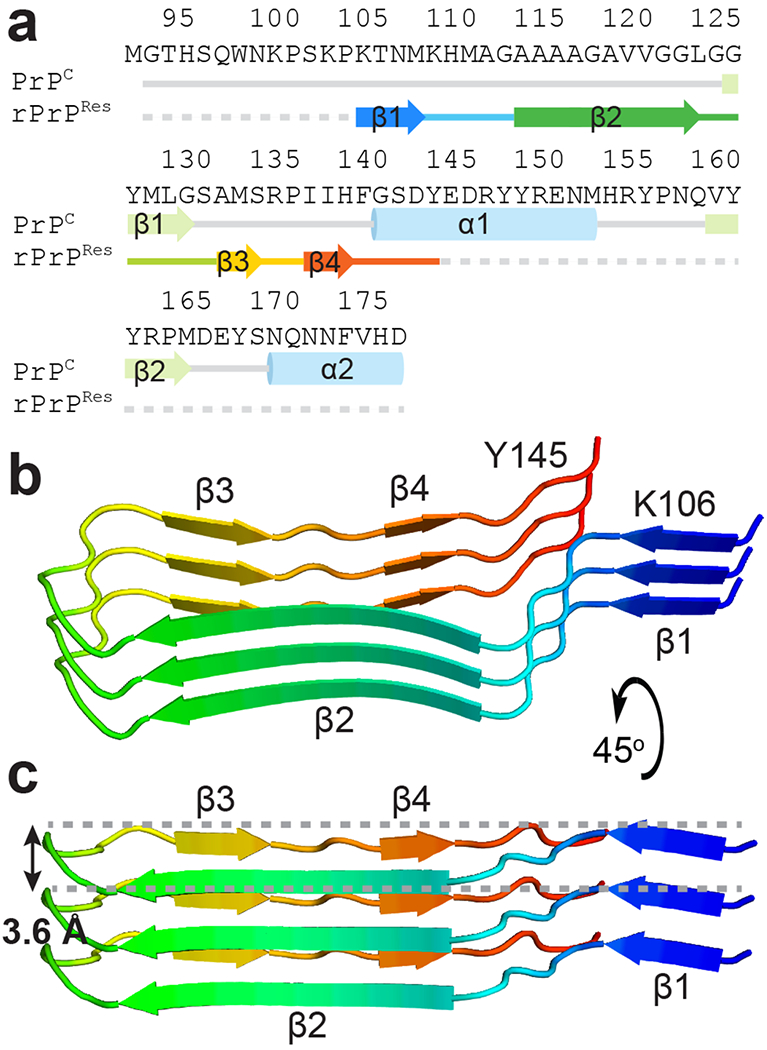
Secondary structure of rPrPRes in contrast to that of PrPC and topology of the rPrPRes protofilament. a Sequence and secondary structure alignment of residues 94-178 of natively folded human PrPC and an amyloid conformation of rPrP94-178 observed here (rPrPRes). Dotted lines represent residues included in the construct but not built into the model. A single nonnative methionine was added as a start codon for rPrP94-178. b Spatial arrangement of three stacked beta strands shown in a, making up one half of the filament. c A side view of the same side of the filament highlighting the flat nature of the structure, which only spans 3.6 Å from the highest to lowest backbone position along the fiber axis in a single chain.
Table 2.
X-ray data collection and refinement statistics
| 113AGAAAA118 (PDB 6PQ5) | 119GAVVGG124 (PDB 6PQA) | |
|---|---|---|
| Data collection | ||
| Space group | P21 | P21 |
| Cell dimensions | ||
| a, b, c (Å) | 18.5, 9.5, 17.6 | 4.78, 12.8, 20.8 |
| α, β, γ (°) | 90.0, 120.5, 90.0 | 90.0, 90.0, 90.0 |
| Resolution (Å) | 1.5 (1.55-1.50)a | 1.45 (1.50-1.45) |
| Rmerge | 0.18 (0.50) | 0.15 (0.31) |
| I/σ(I) | 5.42 (1.59) | 7.21 (1.92) |
| Completeness (%) | 91.5 (64.9) | 93.6 (93.2) |
| Redundancy | 3.4 (2.4) | 5.4 (2.8) |
| Refinement | ||
| Resolution (Å) | 1.5 | 1.45 |
| No. reflections | 2830 | 2451 |
| Rwork / Rfree | 0.237 / 0.271 | 0.187 / 0.238 |
| No. atoms | ||
| Protein | 60 | 32 |
| Ligand (malonate) | 14 (malonate) | 0 |
| Water | 0 | 3 |
| B factors | ||
| Protein | 14.4 | 5.0 |
| Ligand (malonate) | 28.8 | 0 |
| Water | 0 | 31.5 |
| R.m.s. deviations | ||
| Bond lengths (Å) | 0.006 | 0.007 |
| Bond angles (°) | 1.1 | 1.1 |
Values in parentheses are for highest-resolution shell.
Stabilizing features of rPrPRes fibrils
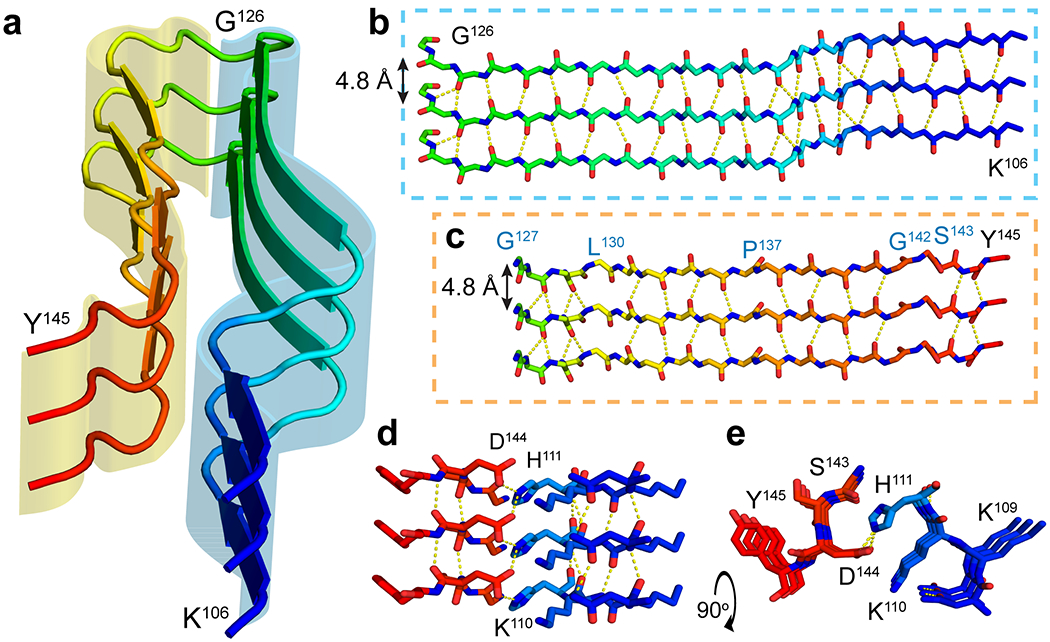
The rPrPRes fibril is a compact, low-energy structure with canonical amyloid features (Fig. 3). Each chain in rPrPRes forms a beta arch whose ordered core starts at K106 and ends with Y145 in the human PrP sequence. Within a protofilament, the N- and C-terminal halves of each beta arch meet at a tight, dry interface, one of two unique interfaces in rPrPRes (Fig. 3).
Figure 3.
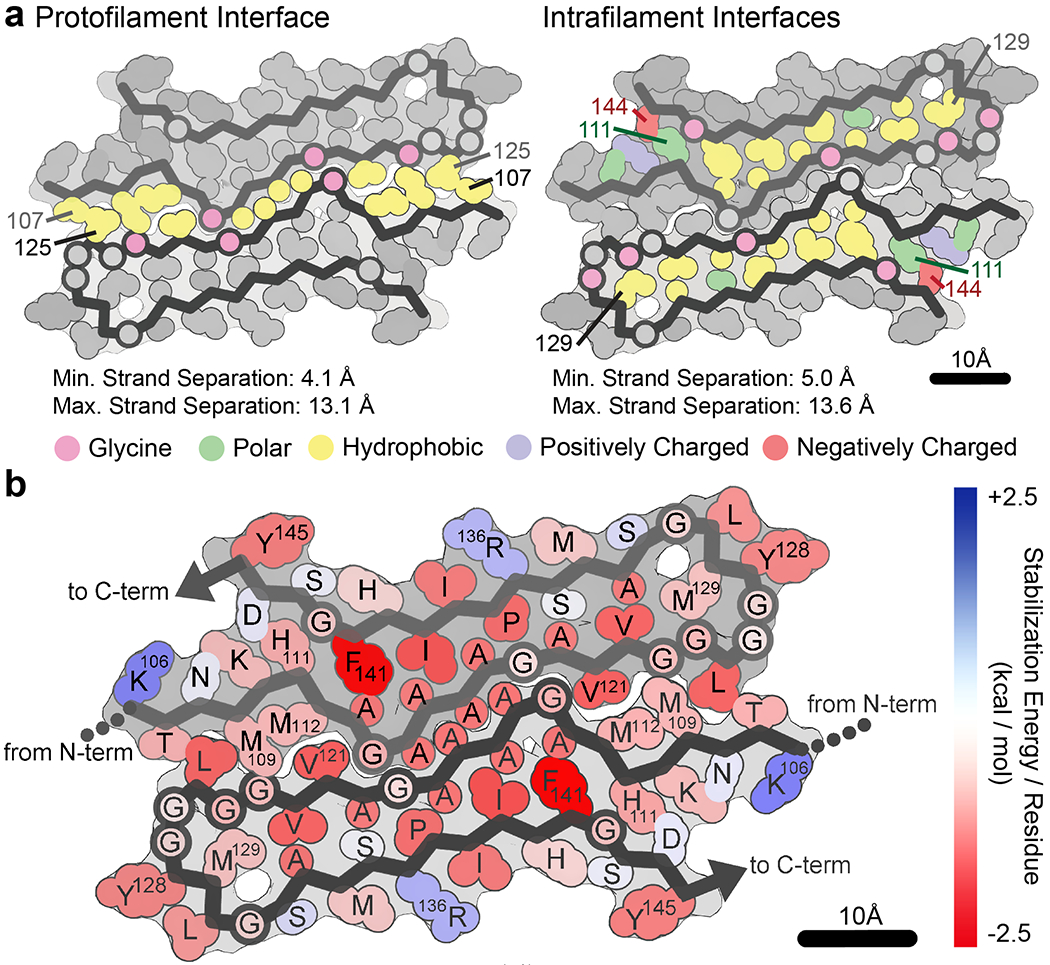
Stability of the core of rPrPRes. a Interfaces formed by each protofilament. The interface at the center of the fibril (left) is created by apolar residues between protofilaments where 460 Å2 of surface area are buried. A second set of identical interfaces, one at the heart of each protofilament (right), buries 848 Å2 of surface area per chain. Residues are colored according to their type, as shown in color key. H111 is colored to be polar and could be protonated based on this chemical environment. Maximum and minimum strand separation between backbones for each interface is also noted. b Stabilization energy per residue based on calculations of energy of solvation. In the diagram, a single color is assigned to each residue, rather than each atom. The color corresponds to the sum of free energy values of each of the atoms in the residue. Across the structure, the average ΔG per residue is −0.74 kcal/mol, or −29.6 kcal/mol per chain. Stabilization energy is shown as a gradient from positive (blue) to negative (red) in units of kcal/mol where red is more stabilizing.
The two protofilaments meet at the second tight interface, with backbone atoms separated by a mere 3.5 Å at closest atomic contact (Fig. 3; Extended Data Fig. 5). Each layer of rPrPRes buries 44 apolar residues across two unique interfaces (Fig. 3). The interface between protofilaments is large, spanning 10 interface-facing side chains per molecule and burying 460 Å2. The core of each protofilament buries an additional 848 Å2 per chain and is sealed from solvent by a pair of polar residues: H111 and D144 (Fig. 3; Extended Data Figs. 5, 7). Each rPrPRes protofilament is also stabilized by a network of backbone hydrogen bonds that link strands along the growing axis of the fibril (Extended Data Fig. 7).
Compatibility of rPrPRes with human sequence variants and patterns of disease progression
The proteopathic relevance of rPrPRes is supported by its apparent incompatibility with sequence variants that may alter both PrPSc structure and the course of prion disease. A familial mutant (A117V)43 produces a protease-sensitive form of rPrPSc that appears to induce clashes at the protofilament interface in rPrPRes (Fig. 4). Likewise, a natural variant (G114V)44 associated with early onset but atypically long disease duration is poorly accommodated by the quaternary structure of rPrPRes (Fig. 4). In contrast, a valine associated with the protective heterozygous condition (M/V129)45 is not structurally precluded when modeled in place of methionine at position 129. However, V129 creates a small void within the core of each protofibril (Fig. 4). Thus, rPrPRes leaves ambiguity in the origin of resistance to certain types of prion diseases conferred by 129 heterozygosity. The notion that sequence variants G114V, A117V, and M129V might engender polymorphs with similar core geometry to rPrPRes is supported by the adoption of energetically favorable folds by rPrPRes models containing these mutations after minimal backbone rearrangement and side chain repacking (Extended Data Fig. 8; Supplementary Table 2). This raises the possibility that disease-relevant PrP sequence variants may represent closely related but distinct polymorphs, as observed for other amyloid assemblies46,47.
Figure 4.
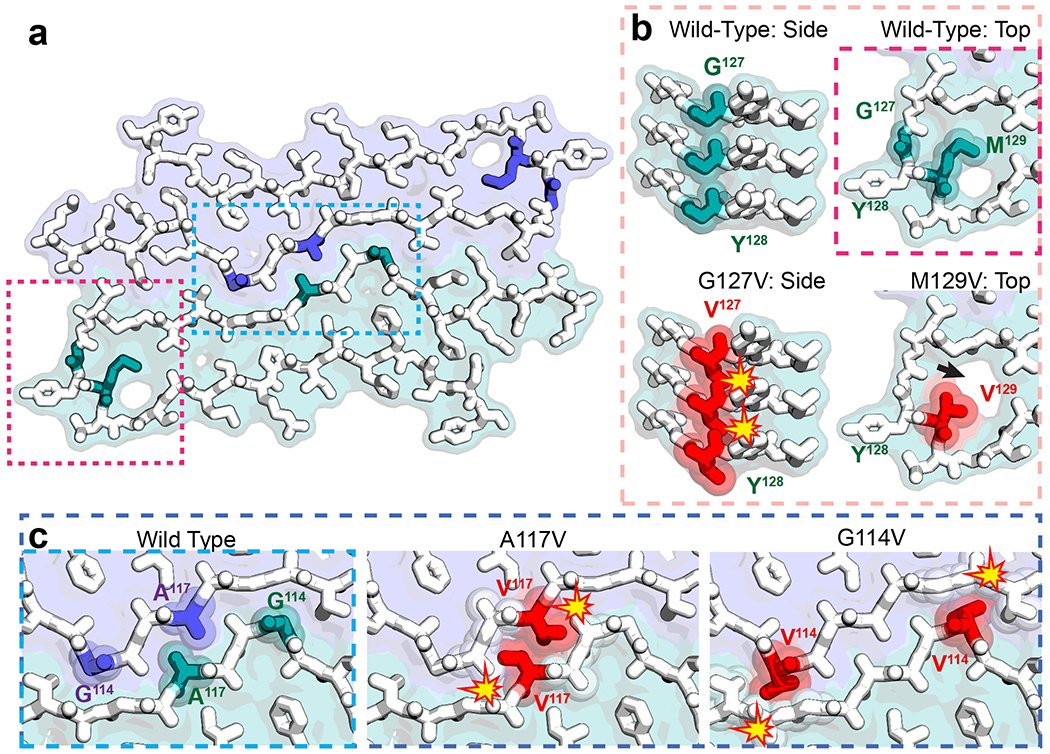
Compatibility of sequence variants at key residues in rPrPRes. a A space-filled model overlaid onto a stick representation of rPrPRes in which one protofilament surface is shown in purple, the other in green. b Magnified views of the turn region containing residues G127 and M129, where mutant G127V is protective against disease. A side view (left) shows that G127 fits well into the model, but V127 cannot due to steric clashes along the fibril axis (red). A view down the fibril axis (right) shows that both M129 and V129 polymorphisms can be accommodated by the model, but V129 introduces a small void (arrow) in the turn region of the rPrPRes arch. c Magnified view of the interface between protofilaments shows two GSS-associated mutants, A117V and G114V, that delay disease onset or produce protease sensitive aggregates, respectively. Both are poorly accommodated in rPrPRes due to steric clashes with the opposing protofilament (red).
A natural sequence variant of PrP (G127V)48 completely prevents prion disease and is expected to induce clashes between protein layers in the structure of rPrPRes (Fig. 4). This is in agreement with observations indicating this sequence variant hinders the formation of stable PrP fibrils by destabilizing beta sheets and disrupting hydrogen bonding49,50. Unlike models based on rPrPRes that contain variants G114V, A117V, and M129V, those that contain G127V predict folds that are less energetically favorable than wild-type rPrPRes despite backbone rearrangement and side chain repacking (Extended Data Fig. 8d, Supplementary Table 2). These models offer a potential structural explanation for why prion fibrils of the G127V variant require higher monomer concentrations to achieve nucleation and a lengthened lag phase of fibril growth51.
Compatibility of rPrPRes with mammalian PrP sequences and species barriers
Insights into cross-seeding of PrP fibrils between mammals can be inferred from an analysis of sequence variability in PrP106-145 (Extended Data Fig. 6). Only seven of the 40 residues in the structure display any sequence variability across closely related mammals, and in most cases, physical properties are conserved. All seven varying residues (108, 109, 112, 138, 139, 143, and 145) are confined to the same region of the structure near the H111-D144 bridge. The positioning of these residues in rPrPRes agrees with conclusions about cross-species conversion drawn from NMR experiments on a similar fragment with known infectivity32. In those studies, a methionine variant of human residue I139 acts as a switch, changing the conformation of PrPSc from one resembling a human prion structure to one resembling that of a hamster. In rPrPRes, this residue faces the protofilament core, and its methionine variant is disfavored (Extended Data Fig. 6). In contrast, a second methionine variant at I138, which is solvent-facing in rPrPRes, does not alter the overall fibril fold of PrPSc 32. Likewise, an M112V variant, found in mice, would create an interface vacancy that could disfavor if not prevent the formation of the rPrPRes polymorph.
Discussion
The structural characterization of rPrPRes presents a framework for evaluation and comparison of properties associated with protease-resistant prion assemblies. The major fibril polymorph of rPrPRes forms a parallel, in-register structure with low solvation free energy, set apart from most other amyloid fibril structures (Fig. 3; Supplementary Table 3) but consistent with its resistance to denaturants, protease digestion, and detergents (Extended Data Figs. 1, 2). Assignment of residues within the core of rPrPRes reveals a large number of apolar side chains, tightly packed to facilitate formation of its two beta arch protofilaments. The tight geometry of rPrPRes allows for an evaluation of the potential impact of prion sequence variants on its overall fold. Collectively, these variants reflect the constraints on sequence variation imposed by the close packing of residues in rPrPRes, in line with their impacts on the structure and function of PrPSc.
While rPrPRes offers atomic insight into its structural accessibility to a variety of PrP sequence variants and homologs, this single polymorph represents only a small portion of the total structural space available to PrP, as evidenced by the diverse range of prion assemblies reported in the literature6–11,22,25,34. The high degree of variation in prion strain properties, including growth kinetics, size distribution, proteinase K resistance, post-translational modification, co-factor binding, tissue distribution, infectivity and mortality, may be reflective of structural differences among strains52. Structural heterogeneity in fibrils isolated from prion strains contributes to the challenges facing an atomic definition of PrPSc. Uncovering the atomic structures of both recombinant and tissue-isolated prion assemblies may therefore yield clues to strain specific features.
Since in vitro generated prions can, under certain conditions, offer greater control over fibril polymorph distributions, they may more readily yield structural insights into prion assemblies25,31,42. However, the apparent structural differences between tissue-isolated infectious prion assemblies and those generated in vitro highlight the need for structural comparisons at the atomic scale between rPrPRes and yet-to-be-determined structures of other prion polymorphs. For example, reconstructions of prion fibrils from various sources show a variety of structural repeats, ranging from ~ 19 Å22 to 60 Å53 that are not recapitulated by rPrPRes. However, other molecular features of rPrPRes are shared with amyloid-like fibrils formed by truncated Y145Stop prions that can transmit prion disease in mice and model a heritable, disease-causing human variant42. Like these disease-causing fibrils, the structure of rPrPRes demonstrates that a protease-resistant human prion fibril polymorph can exhibit canonical amyloid features: parallel, in-register strands spaced 4.8 Å apart, held together by the dry interfaces of a tightly packed core.
The relevance of rPrPRes in the context of other prion assemblies is underscored by the similarity of its protease-resistant regions54 and fibril dimensions to those found in patient-isolated samples55 and synthetic, infectious prions32. For example, patients with PrP cerebral amyloid angiopathy (CAA)54 show a truncation of the prion protein at residue 145, whose soluble fragment forms 8-10 nm fibrils54. The dimensions of these fibrils are similar in width to those of rPrPRes (Fig. 1a, Extended Data Fig. 3). PrP fragments in CAA have been shown to include residues 90 to 145; most of which are clearly resolved in rPrPRes fibrils54 (Fig. 1a). Mutations that drive prion disease can also result in the formation of fibrils with similar residues at their core. For example, patients with GSS-inducing mutations accumulate short, ~7-8 kDa fragments that start near residue 90 of human PrP55 - akin to the segment that forms rPrPRes 55. Overall, the structure of rPrPRes is consistent with core residues, fragment size, filament dimensions, protease resistance, and denaturant resistance of disease-associated prions54,55. Nonetheless, alternate atomic arrangements at the core of prion assemblies may share features with rPrPRes but ultimately vary in disease-relevant features such as number of ordered residues, post-translational modifications56 or interaction with co-factors57.
Like the discovery of the prion58, the unveiling of near-atomic structures of prion fibrils, including rPrPRes, opens new opportunities to unravel the mysteries of protein-based infection. With it, we look forward to the structures of prion strains that will collectively provide a blueprint for atomically defined proteinaceous infectious agents.
Online Methods
Recombinant expression, purification and characterization of rPrP94-178
A gene encoding human PrP94-178 (IDT) with an additional anteceding methionine start codon was cloned by Gibson Assembly into a derivative of a pET28 vector lacking purification or solubility tags and verified via DNA sequencing (Genewiz). Recombinant human PrP94-178 (rPrP94-178) was expressed in E. coli BL21 GOLD cells (Agilent). Briefly, cells were grown at 37 °C shaking at 180-230 rpm until OD600 reached approximately 0.6. Protein overexpression was induced by addition of 1 mM IPTG, followed by 4-6 hours of growth under the same conditions. Cells were then harvested and stored at −80 °C until protein purification.
rPrP94-178 was purified using previously described protocols as a guide25. Specifically, cell pellets were resuspended in 25 mM Tris-HCl pH 8 and 5 mM EDTA (Buffer A) with 100x HALT protease inhibitor cocktail and lysed using an EmulsiFlex-C3 High Pressure Homogenizer (Avestin). Lysed cells were centrifuged at 30,000 xg for one hour and the supernatant was removed. The pellet was resuspended in an equal volume of Buffer A, vortexed to resuspend the pellet, and centrifuged again at the same speed and duration to remove any remaining soluble material. The supernatant was discarded and replaced with half the volume of 8 M Guanidine-HCl, 25 mM Tris-HCl pH 8 and 100 mM DTT (Buffer B), vortexed to resuspend, and centrifuged at 14,000 xg for 20 minutes. The supernatant containing any previously insoluble proteins was filtered using a 0.45 μm filter. One or two milliliter injections were loaded into an NGC chromatography system (Biorad) and eluted through an ENrich SEC 650 10 × 300 column (Biorad) equilibriated in 6 M Guanidine-HCl, 12.5 mM Tris-HCl pH 8, 5 mM DTT, and 1 mM EDTA (Buffer C). Under these conditions, rPrP94-178 eluted in both monomeric and multimeric forms; monomeric species eluted as a major peak (Extended Data Fig. 1). Fractions containing monomeric rPrP94-178 were pooled and buffer exchanged into 8 M urea using a Duoflow chromatography system (Biorad) and a HiTrap Desalting column (GE Healthcare). Protein was concentrated to 1.6-2.4 mg/ml and flash frozen for storage at −80 °C until fibril formation.
Mass spectrometry of rPrP94-178
Purified rPrP94-178 in 8 M urea was diluted to 20 μM in 50% methanol and 0.1% formic acid. Mass spectrometry was carried out using a Q-Exactive™ Plus Hybrid Quadruple-Orbitrap™ Mass Spectrometer (Thermo). The most abundant peaks correspond to ions of rPrP94-178 with an extracted exact mass of 9665.49 Da, within approximately 1 ppm of the expected exact mass of 9665.48 Da (Extended Data Fig. 1).
Growth of rPrP94-178 fibrils
Aliquots of monomeric rPrP94-178 were diluted to 0.8-1.2 mg/ml in 1-4 M urea and 50 mM Sodium Citrate pH 4 (growth buffer) and added to a 96 well plate. Samples were agitated for 1-3 days by acoustic resonance mixing59,60 at 37 °C using a custom-built 96-well plate shaker set to 38 Hz. No change in fibril morphology was observed as a function of incubation time. However, each fibril preparation was highly polymorphic, and preparations varied in polymorph yield and distribution. Once fibrils formed, they appeared stable for months with no perceivable dissolution or evolution by negative stain electron microscopy. Fibril suspensions were collected and centrifuged at 16,160 xg for 5-7 minutes to pellet aggregated material and washed with water twice before resuspending in a volume of water that allowed ideal concentration for cryo-EM.
Crystallization, data collection and structure determination of PrP113-118 and PrP119-124
Both segments were purchased at a purity of 99 % from CS BIO Inc. (Menlo Park, CA). Screening for crystallization conditions was achieved by the hanging drop method using “Crystal Screen” and “Index Screen” from Hampton Research (Aliso Viejo, CA). Idealized crystal growth conditions were then optimized. Crystals of PrP113-118 were grown from 1.92 M sodium malonate pH 4.0 at a concentration of 35 mg/ml. Crystals of PrP119-124 were grown from a condition of 2.4 M sodium malonate pH 7.0 at a concentration of 10 mg/ml.
Diffraction data were collected at the micro-diffraction beamline ID13 at the European Synchrotron Radiation Facility (ESRF), where crystals were mounted directly onto the ends of pulled glass capillaries. Because of the tight packing between segments in the crystals, cryoprotectant was unnecessary. Crystals were cooled to −180 °C during data collection. In both cases data were collected using 5 ° wedges.
In most cases, diffraction data represented patterns from epitaxially twinned crystals that could not be separated during mounting. Despite the multiple diffraction patterns found on each frame, the program XDS61, which uses an automated algorithm for picking spots from multiple frames, was successfully used to index the images. The program SCALEPACK62 was used for scaling, merging, and reducing data from multiple crystals. The programs “xds2mosflm,” written by Richard Kahn (Grenoble), and the utility ROTGEN, distributed with the software package MOSFLM63, were used to convert the crystal orientation and cell parameters from XDS into DENZO format. Re-indexing using the XDS parameters and subsequent data reduction was performed in DENZO and SCALEPACK from the HKL suite62. The merged and scaled data was imported into the CCP4 format with programs from the CCP4 program suite.
Structures were phased by molecular replacement using the program PHASER64 with an idealized poly-alanine beta strand as a probe. The program Coot65 was used for model building and refinement was carried out using REFMAC66. Data collection and refinement statistics can be found in Table 2 and structures shown in Extended Data Fig. 6.
Negative stain electron microscopy of rPrP94-178 fibrils
Imaging of fibrils embedded in stain was performed by applying 3 μL of washed sample to glow discharged formvar/carbon 200 mesh copper grids (Ted Pella) and incubated at room temperature for 2 minutes followed by the addition of 3 μL of 2 % uranyl acetate and additional 2 minute incubation before liquid was wicked away and the grid was left to dry for 2-3 minutes. Images were recorded on a Tecnai 12 electron microscope (Extended Data Fig. 1) (FEI; Hillsboro, Oregon).
Partial protease digestion and nephelometry monitoring of rPrP94-178 fibrils
Fibrils in growth buffer were incubated with a 1:10 molar ratio of freshly dissolved Proteinase K (GoldBio) to rPrP94-178 monomer for 24 hours at room temperature without agitation67. After the incubation period, any remaining insoluble material was pelleted by centrifugation at 16,160 xg for 5-7 minutes and the supernatant removed. The pellet was resuspended in water (for negative stain imaging) or 2 % SDS (for cryo-EM).
For a measure of insoluble character in response to Proteinase K treatment, dissolution experiments were monitored by nephelometry (Extended Data Fig. 2). A slurry of 100 μL of rPrP94-178 fibrils in growth buffer with the addition of 1:10 molar ratio of Proteinase K: rPrP94-178 monomer (10 μM ProK: 100 μM rPrP94-178 monomer), growth buffer with the same amount of Proteinase K, growth buffer only, or water were added to a sealed 96-well plate and loaded into a NEPHELOstar Plus (BMG Labtech). Readings in nephelometry units (NTUs) were recorded at 37 °C for 0.1 seconds every 10 minutes for 24 hours with a 2.5 mm beam at 12 % intensity. Before each reading, the plate was shaken at 300 rpm for 20 seconds.
Preparation of frozen-hydrated rPrP94-178 fibrils for high-resolution imaging
Following treatment of fibrils with Proteinase K, insoluble material was resuspended in a solution one fifth the original volume and containing 2 % w/v SDS and sonicated in an ultrasonic bath (Fisher Scientific) for 10 minutes. Sonication for up to 20 minutes showed no observable effect on individual fibril morphology or size. However, sonication for intervals greater than or equal to 3 minutes modestly reduced fibril clumping. 1.8 μL of Proteinase K-treated rPrP94-178 fibrils in 2 % SDS were applied to each side of glow-discharged holey carbon grids (Quantifoil, R1.2/1.3 200 mesh Cu, Electron Microscopy Sciences) after 10 minutes of bath sonication (Extended Data Fig. 1). Blotting and plunge freezing into liquid ethane was performed on a FEI Vitrobot Mark IV using a blot force of 1 and a blot time of 7 seconds with no wait or drain time.
High-resolution imaging of frozen-hydrated rPrP94-178 fibrils
High-resolution images were collected on a Titan Krios microscope (FEI) with an accelerating voltage of 300 kV and 130,000 x magnification using a Gatan K2 Summit direct electron detector attached to a Gatan image filter (GIF) in super-resolution counting mode with a GIF slit of 20 eV. 30 movie frames of 200 ms each were collected for a total exposure time of 6 seconds and a total accumulated dose of 36 e−/Å2 at a calibrated pixel size of 1.07 Å (0.535 Å for super resolution). Automated data collection was carried out using the Leginon software package68 with a target defocus value of −2.0 μm, to record a total of 4341 micrographs.
Pre-processing of rPrP94-178 fibril cryo-EM images
Patchwise motion correction using 5x5 patches per micrograph, and frame alignment were carried out using MotionCorr269,70 integrated in RELION 3.071. The resulting dose-weighted micrographs were used to determine defocus values for each image using Gctf72. Micrographs that (1) did not have fibrils in the field of view, (2) had clumps of fibrils with too much overlap to select even small segments, (3) were too far from focus, or (4) had ice that would limit extraction of high-resolution information were not processed further. Particles were manually picked as helical segments using RELION 3.0 from 2542 out of 4341 micrographs.
Two-dimensional classification of rPrP94-178 fibril cryo-EM images
All analysis was carried out with extracted particles that were down-sampled by a factor of two, such that the pixel size during 2D classification through the reported map was 1.07 Å. 217,988 segments were initially ctf phase-flipped and extracted using a box size of 267.5 Å (250 pixels) and an interbox distance of 28.8 Å, or 10.8 % of the box size. In RELION, this interbox distance was achieved by specifying 6 asymmetric units where each asymmetric unit was 4.8 Å. Several rounds of 2D classification using a 250 pixel, or a larger 400 pixel, box were carried out to remove particles in less defined classes (Extended Data Fig. 3). The larger box size allowed for more of the helical twist to be visible within a single box, which helped prevent misalignment based on only the 4.8 Å feature. After all rounds of 2D classification, 113,320 particles with a 400 pixel box were used for 3D classification.
Fibril crossover distance was estimated by stitching together 2D classes with a box size of 400 pixels (428 Å) where there was noticeable overlap between class averages. A box size nearly the length of the estimated crossover distance (1000 0.535 Å pixels rescaled to 250 pixels, or 535 Å) was used to extract and classify the same particles, where agreement in morphology and the estimated crossover distance was achieved between both methods (Extended Data Fig. 3).
The images also contained filaments belonging to minor populations that did not have an apparent regular helical twist (Extended Data Fig. 4). These filaments were manually picked, extracted, and classified separately using a 1000 pixel box rescaled to 250 pixels (535 Å) and a 475 Å mask to accommodate thicker filament morphologies. 75,860 extracted segments fell into 2D classes of visibly defined morphology (Extended Data Fig. 4c), of which 6007 segments had a thick ribbon appearance. The remaining narrower particles underwent additional 2D classification using a smaller box size of 500 pixels rescaled to 250 pixels (267.5 Å). Poorly defined particles were removed and additional rounds of 2D classification were carried out until the resolution in the best-defined classes ceased to improve. This resulted in 47,479 particles falling into the best classes assessed by a combination of RELION’s estimated resolution and visual assessment (Extended Data Fig. 4d)71. These classes were not deemed sufficient for 3D structure determination as part of this work.
3D helical reconstruction of rPrP94-178 fibrils
A Gaussian ellipsoid was generated as an initial reference model for 3D classification of the main morphology using 3 classes and a helical z value set to 30 % of the box size. An initial estimate of the helical rise observed in 2D classes of 4.8 Å was used and helical symmetry in C1 was enforced. An initial estimate of the helical twist was calculated from the estimated crossover distance – 630 Å. All three classes were of identical ultrastructure, but only 76,246 particles in the highest resolution class were moved forward for optimization of the twist and rise during a subsequent 3D classification run. The twist and rise were each refined individually, starting with the twist, then together until convergence. A staggering of strands at the interface between two identical protofilaments was observed, and C1 symmetry with a 21 screw was enforced. Final values of 2.4 Å helical rise and 179.3 ° helical twist for a left-handed filament were used for subsequent 3D auto-refinement where two half-maps were independently refined.
To prevent a bimodal tilt distribution during 3D classification and auto-refinement (maxima near 75 ° and 105 °), rather than the expected mono-modal tilt distribution about 90 ° for filaments preserved in a thin layer of vitreous ice73, a Gaussian ellipsoid was used as a reference in the first round of 3D auto-refinement. The flags – helical_keep_tilt_prior_fixed, –limit_tilt 70, and sigma tilt and psi values of 1 were used with a starting healpix order of 5 – or 0.9375 degrees. A subsequent round of 3D auto-refinement was carried out using the previous auto-refinement reconstruction filtered to 7 Å as a reference. The orientations of the particles from the previous run were also used as the starting point for particle orientations. This 3D auto-refinement was carried out without the flag – limit_tilt but still kept the helical tilt prior fixed at 90 ° and started with an angular sampling using healpix order 5. After a few iterations, the sigma tilt and psi were expanded to 3 and a smooth distribution about 90 ° was achieved with only very few particles with tilt angles past 75 ° or 105 °. It is worth noting that reconstruction from particles with tilts distributed bimodally resulted in a reconstruction that appeared similar in cross section but had substantial differences in the perceived staggering of beta strands within each protofilament.
After final 3D auto-refinement, helical symmetry in real space was imposed using the central 10 % of the box to ensure uniform resolution throughout the length of the fiber. Masking and post-processing were carried out in RELION 3.0 and sharpening was performed in PHENIX using phenix.auto_sharpen to 3.4 Å and a B factor of −139.98. Overall resolution estimates were calculated based on the Fourier shell correlation (FSC) coefficient of both 0.143 and 0.5 between the independently refined half maps (Extended Data Fig. 5)71.
Helical rise multiples of 4.8 Å up to four repeats (19.2 Å) and their corresponding helical twist values for C1 symmetry were also used to test for repeating structures encompassing multiple rungs, but no repeating patterns were detected.
Model building and refinement for rPrP94-178 fibrils
A cross-section of the map normal to the fibril axis was used for initial sequence assignment, where large side chains and the tight protofilament interface were used as guides for building the initial model in Coot65. Using that initial model, 5 chains per protofilament, for a total of 10 identical chains, were generated and placed in a central region of the cryo-EM density map. Manual refinement was performed in Coot, where changes were made to a single chain and propagated to all 10 chains to ensure model compatibility with neighboring chains. Iterations of manual adjustments in Coot and refinement in PHENIX were employed to arrive at a final model that optimally balanced geometric constraints, Ramachandran angles, map fit, and clashes. In PHENIX74, all 10 chains were also refined identically as in Coot.
The density for residue 126 left an ambiguity in the map where a choice to build the backbone up the fiber axis or down the fiber axis would have to be made. In order to address this ambiguity, we built and refined both models against the map and found the chosen direction to be substantially more favorable for Ramachandran angles, clashes, and fit to the density.
Model building and refinement were carried out independently on maps with either right-handed75 or left-handed beta sheet twists to validate the assignment of handedness. Each model was subjected to identical refinement procedures and resulted in very different profiles for Ramachandran angles with the left-handed reconstruction being substantially more favorable. All further analysis was carried out using the left-handed model.
Analysis of buried surface area (Sa) in rPrPRes interfaces
Sa was computed as an average of the buried surface area per chain in a 20-chain assembly representing the fibril using PyMol76. It was calculated as the difference between the sum of the solvent accessible surface area of the two sheets and the solvent accessible surface area of the entire complex, divided by the total number of strands in both sheets.
Comparison of rPrP94-178 paired helical filament structure to prion hexapeptide zipper structures
Model building for rPrP94-178 was performed without previous knowledge or consideration for the described peptide crystal structures. Sequence alignment and structural superpositions of both an individual chain and the crystalline arrangement of six residue prion peptide structures were performed in PyMOL 76 (Extended Data Fig. 6). This alignment produced an all atom RMSD between a single chain in the peptide crystal structures and the corresponding residues in the fibril structure, which we used to assess similarity between the structures (Extended Data Table 1). For peptide structures with alternate conformations, the conformation for comparison was chosen by pdbcur (CCP4) based on the highest occupancy.
Threading of sequences onto rPrPRes and their energetic evaluation using PyRosetta
PyRosetta77 was used to evaluate the fit of a specific sequence onto the backbone built into density for the structure of rPrPRes for a series of 40-residue sequences. To prepare a structure for threading, an ensemble representing 20 chains of the structure of rPrPRes (10 chains per protofilament) was fast-relaxed in PyRosetta while keeping the 3 chains at the top and bottom of the assembly fixed. The resulting model yielded an energetically favorable overall score (Extended Data Table 1) reported in Rosetta Energy Units (REU).
To assess the impact of sequence variants on the energetic favorability of the rPrPRes polymorph, each relevant site was independently mutated and followed by side chain repacking without backbone movement. A second trial was performed by first using a fast-relax protocol in PyRosetta (Extended Data Fig. 8, Extended Data Table 1) and followed by side chain repacking. This allowed the assessment of both the compatibility of mutations with our density-informed model and which small movements may still lead to a favorable structure. The energy of the resulting models was evaluated as the average of six independent trials (Extended Data Table 1, repack only) or three independent trials (Extended Data Table 1, fast-relax followed by repacking). This procedure did not enforce the symmetry present in rPrPRes but was restricted to small backbone movements. It was further constrained by allowing the fast-relax movements to only the middle strands of the fibril model. These restrictions were put in place to reduce the influence fibril ends might have on the overall structure. RMSD calculations were performed in PyMol over ten chains to obtain an average RMSD over the whole assembly generated by PyRosetta. Comparisons were made between fast-relaxed wild-type and mutant sequences and the density informed model before fast relaxing (Extended Data Table 1).
Calculation of solvation free energy for rPrPRes
Our calculation of free energy is an adaptation of the solvation free energy described previously78,79, in which the energy is calculated as the sum of products of the area buried of each atom and its corresponding atomic solvation parameter (ASP). ASPs were taken from previous work79. Area buried is calculated as the difference in solvent accessible surface area (SASA) of the reference state (i.e. unfolded state) and the folded state. The SASA of residue i of the unfolded state was approximated as the SASA of residue i in the folded structure after removing all other atoms except the main chain atoms of residues i−1 and i+1.
The SASA of the folded state was measured for each atom in the context of all amyloid fibril atoms. Fibril coordinates were symmetrically extended by three to five chains on either side of the molecule to ensure the energetic calculations were representative of the majority of molecules in a fibril, rather than a fibril end. To account for energetic stabilization of main chain hydrogen bonds, the ASP for backbone N/O elements was reassigned from −9 to 0 cal/mol/Å2 if they participated in a hydrogen bond. Similarly, if an asparagine or glutamine side chain participated in a polar ladder (two hydrogen bonds per amide) and was shielded from solvent (SASAfolded < 5 Å2), the ASPs of the side chain N and O elements were reassigned from −9 to 0. Lastly, the ASP of ionizable atoms (e.g. Asp, Glu, Lys, His, Arg, N-terminal amine, or C-terminal carboxylate) were assigned the charged value (−37 or −38) unless the atoms participated in a buried ion pair, defined as a pair of complementary ionizable atoms within 4.5 Å distance of each other, each with SASAfolded < 50 Å2). In that case, the ASP of the ion pair was reassigned to −9*(distance - 2.8 Å)/2.8 Å)2. Side chain conformational entropy terms adapted from Koehl & Delarue, 1994 were added to the energy values obtained above80. The entropy terms were scaled by the percentage of side chain surface area buried in the assembly. Based on these calculations, the average ΔG per residue for rPrPRes is −0.74 kcal/mol, indicating an overall favorable energy for assembly (Figure 3).
Reporting Summary:
Further information on experimental design is available in the Nature Research Reporting Summary linked to this article.
Data Availability:
EM maps and atomic coordinates for rPrP106-145 have been deposited in the EMDB and wwPDB as EMD-20900 and PDB 6UUR, respectively; atomic coordinates and structure factors have been deposited in the wwPDB for PrP113-118 (PDB 6PQ5) and PrP119-124 (PDB 6PQA).
Extended Data
Extended Data Figure 1. Production, isolation and characterization of rPrP94-178 fibrils.
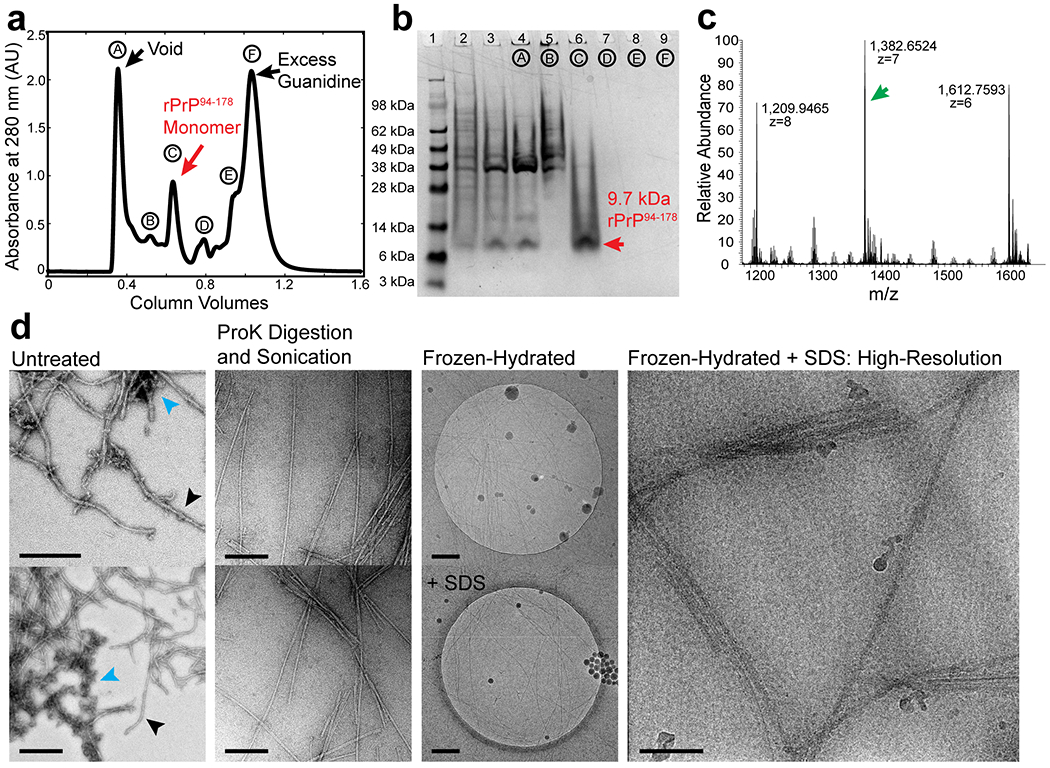
(a) Purification of untagged human PrP94-178. Samples collected during size exclusion chromatography of PrP94-178 were run on a 4-12 % SDS-PAGE gel corresponding to labeled peaks (b). Gel lanes left to right: 1. Pre-stained protein ladder (Thermo), 2. Post-induction fraction, 3. Solubilized material from inclusion bodies, 4. Void fraction (A) from (a), 5. Peak (B) from (a), 6. Peak (C) from (a) containing 9.7 kDa monomeric rPrP94-178, 7-9. Peaks D-F from (a) containing excess guanidine or other UV active small eluates. (c) Mass spectrum showing most abundant peaks correspond to ions with an extracted molecular weight that matches rPrP94-178. (d) Representative micrographs of a heterogeneous mix of untreated fibrils (left) in Growth Buffer; promising filaments (black arrows) and disordered, clumped, or amorphous material (blue arrows). Adjacent images are of filaments treated with 1:10 molar ratio proteinase K:rPrP94-178 monomer and bath sonicated for 10 minutes. Proteinase K treated and sonicated filaments exchanged into water in a frozen-hydrated state (third column, top) or 2 % SDS (third column, bottom). Representative image of Proteinase K, sonication, and SDS treated filaments used for high-resolution imaging and reconstruction (right). Scale bars, 200 nm. Scale bar for high-resolution image (right) 50 nm.
Extended Data Figure 2. Partial protease digestion of rPrP94-178 fibrils.
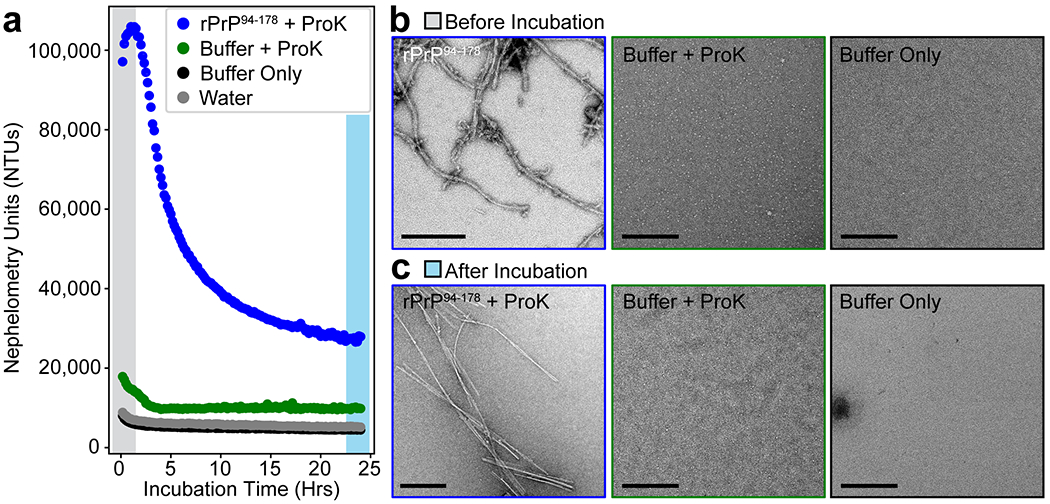
(a) Plots of incubation time versus nephelometry units as a measure of insoluble character in fibril suspensions treated with proteinase K compared to proteinase K only and buffer controls. (b) Representative electron micrographs of each sample in panel (a) before proteinase K digestion at the start of the incubation period. This image of fibrils is the same as that shown in Extended Data Figure 1d. (c) Representative micrographs of each sample in Panel (a) after the 24 hour incubation period. All scale bars are 200 nm.
Extended Data Figure 3. Classification of major species of protease-resistant rPrP94-178 fibrils.
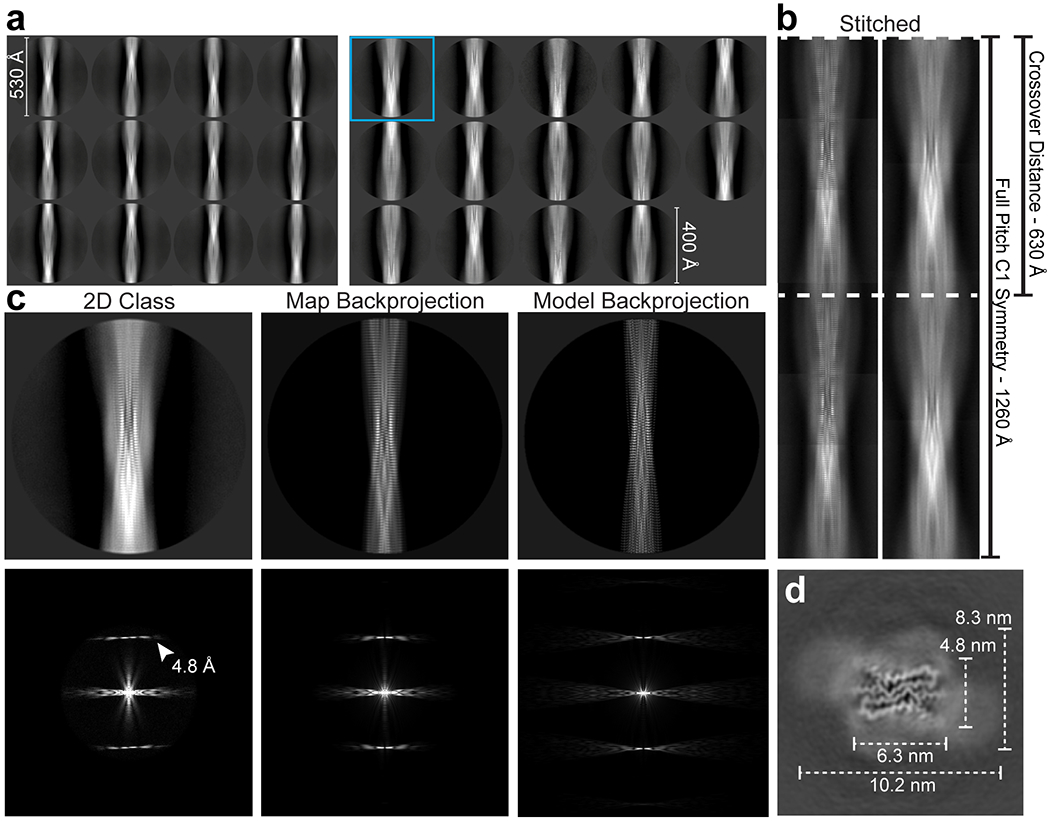
(a) Final 2D class averages from the major species comprising 71 % of defined segments using a 535 Å box with a 530 Å mask (left) or 428 Å (400 pixel) box with a 400 Å mask (right). (b) A composite image (left) formed by stitching of 2D class averages with the small box shown in (a), agrees with a composite image (right) formed by class averages obtained using a box size encompassing a full crossover distance in (a). The crossover distance and full pitch are both marked. (c) Comparison between a 2D class (enlarged view of boxed class in (a)), the map backprojection, and model backprojection with accompanying Fourier transforms below. (d) Slice through the 3D density with dimensions of the ordered region and surrounding diffuse density noted.
Extended Data Figure 4. 2D classification of minor morphological populations formed by rPrP94-178.
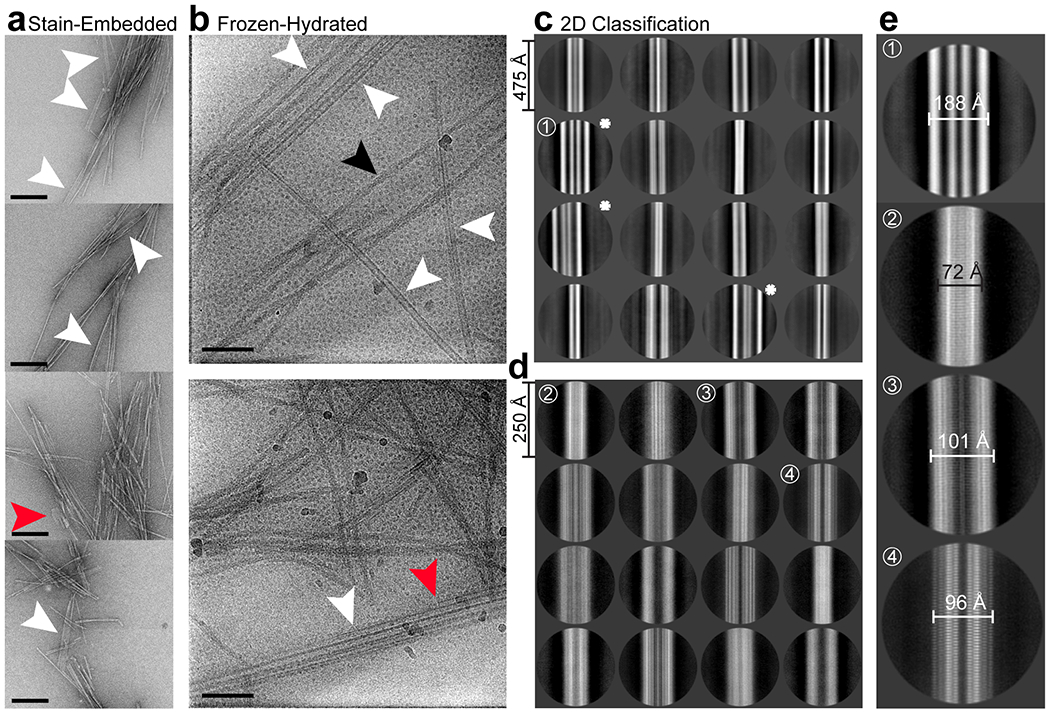
(a) Stain-embedded, Proteinase K and sonication treated fibrils show several minor populations of ribbon-like polymorphs (white arrows), including wide filaments with regions that abruptly stop (red arrows). These morphologies remain a minor species after vitrification in 2 % SDS alongside the major twisted species (single example black arrow) (b). A 2D classification round selecting for minor species results in 2D classes that make up 29 % (75,860 segments) of total particles sorted into defined classes (c), with 2.1% of the total segments across major and minor populations (~6000 particles) being sorted into classes that resemble thick ribbons with columns of alternating electron dense and poor material (stars). Additional 2D classification of segments that did not sort into thick ribbon classes (d) revealed several classes containing high-resolution information, in some classes even revealing 4.8 Å strand separation. The 16 best looking classes are shown and make up 62 % (47,479 segments) of the particles shown in (c). 3D reconstruction of these filaments was unsuccessful. A magnified view of select classes from (c) and (d) show the range of fibril widths observed (e). Scalebar in (a) 200 nm, in (b) 50 nm.
Extended Data Figure 5. Agreement of rPrP106-145 model with core density in rPrPRes.
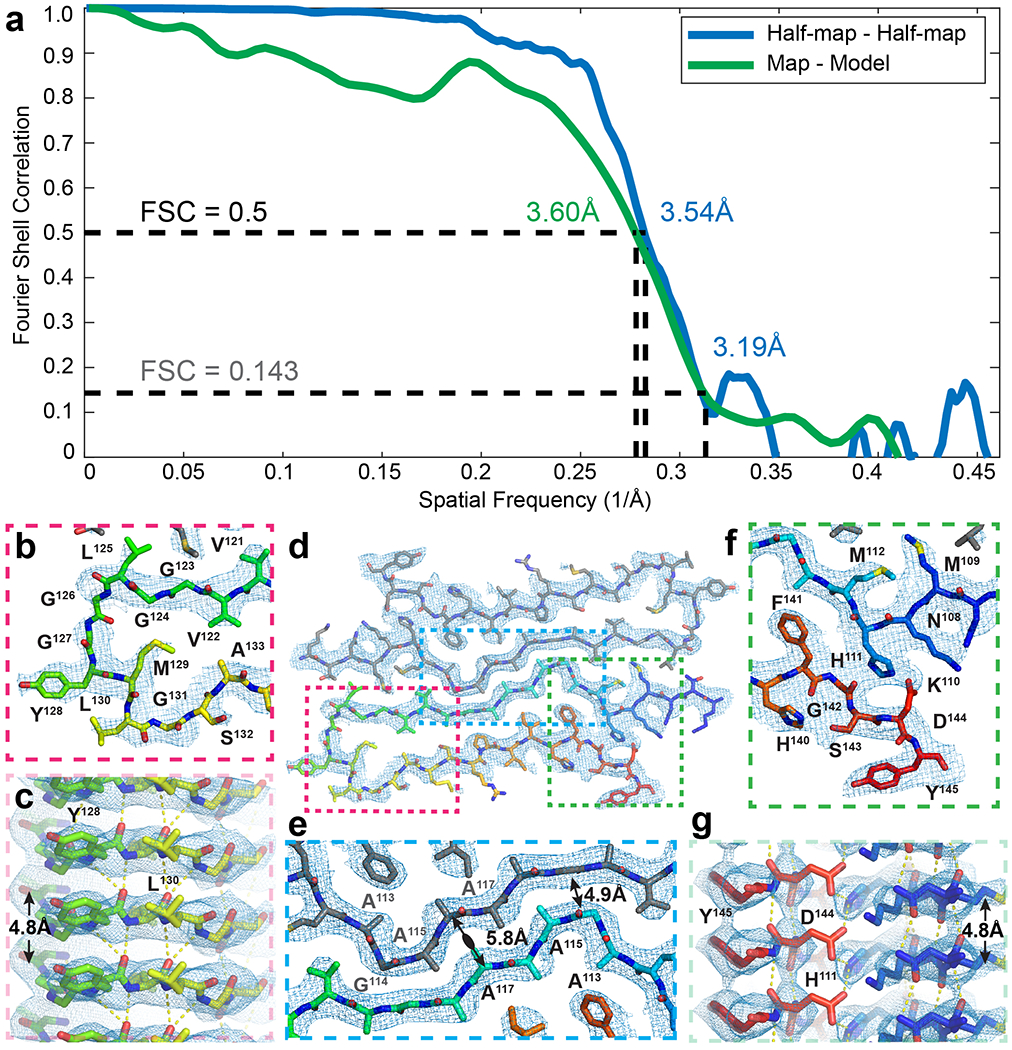
(a) Fourier Shell Correlation (FSC) between half-maps (blue) and the map and model (green) with resolutions at FSC = 0.5 (black dotted line) and 0.143 (gray dotted line) noted. (b) Agreement of turn region with density looking down the fibril axis and (c) a side view of the same region shows clear strand separation. (d) Overall fit of model into density. (e) Magnified view of protofilament interface showing spacing between backbones at the center of the interface is at the most tightly spaced region between G114 of one chain and G119 of its mate. (f) Magnified view of linchpin region with inferred salt bridge between residues H111 and D144 that seal off the interior of each chain and a side view (g) of the same region showing 4.8 Å separation between strands.
Extended Data Figure 6. Structural agreement of hexapeptide prion zipper structures to rPrPRes.
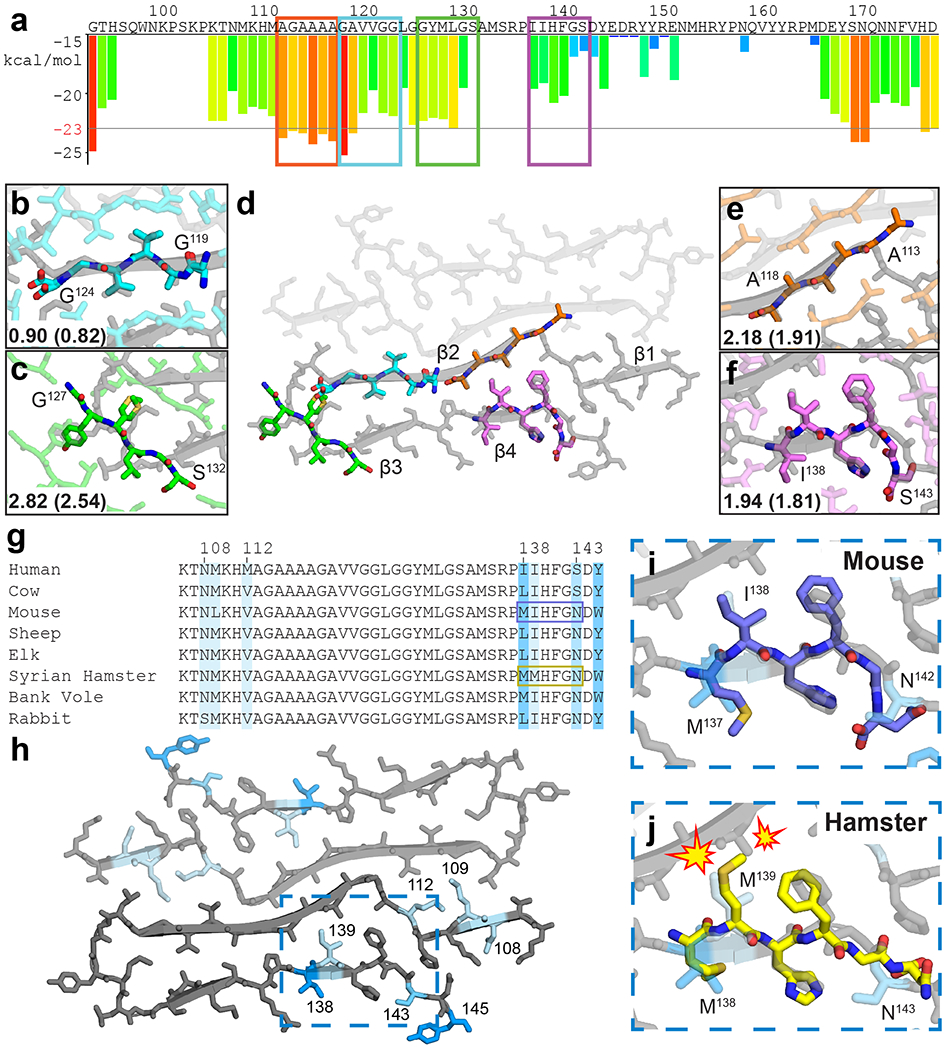
(a) ZipperDB26 profile of the segment encoding for rPrPRes. Bars extending below the line represent hexapeptides predicted to form steric zippers. Peptides with crystal structures aligned to the fibril model are boxed. Two of these were previously published27,28. Alignment of crystal structures 119GAVVGG124 (b), 113AGAAAA118 (c), 127GYMLGS132 (e) and 138IIHFGS143 (f) with rPrPRes (d). Symmetry mates in plane, all atom, and backbone (parentheses) RMSD values against rPrPRes are shown (g) Sequence alignment for species of common interest to prion disease. Darker blues correlates with more variability, loosely defined as more residue mismatches among the species compared, and mapping of these residues onto rPrPRes (h). Hexapeptide structure for muPrP137-142 (mouse numbering) is compatible with rPrPRes (i) while shPrP138-143 is not (j).
Extended Data Figure 7. Molecular contacts at the core of rPrPRes.
(a) Cartoon representation of one protofilament with three stacked chains highlighting outer (yellow) and inner (blue) sheets. Stick representation of stacked inner (b) and outer (c) sheets with inferred hydrogen bonding networks based on refinement giving weight to standard beta sheet geometry, favored Ramachandran angles, and map to model fit. Residues where geometry deviated during refinement to break backbone hydrogen bonds are noted in blue text. (d) Side view highlighting a favorable salt bridge between H111 and D144 and the same region rotated to show the interaction looking down the fiber axis (e).
Extended Data Figure 8. Alignment of fast-relaxed mutant sequences to rPrPRes.
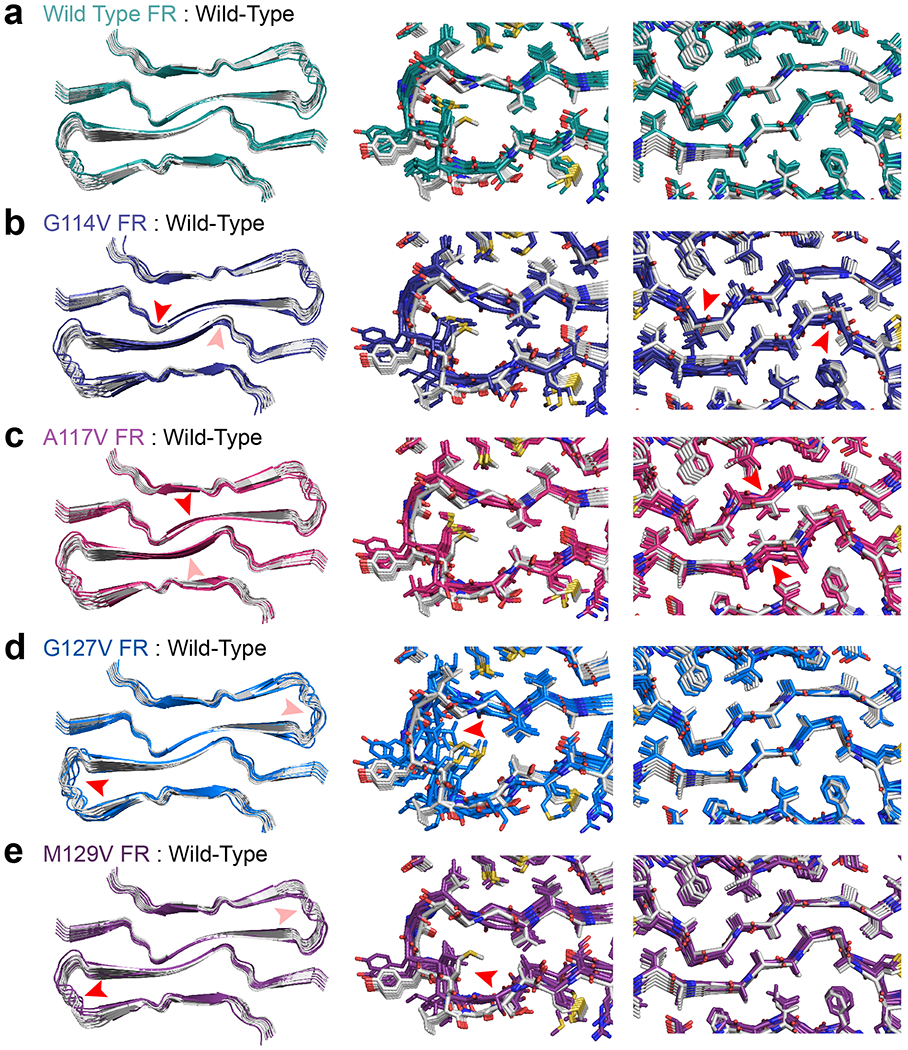
(a) Left: Alignment of eight chains of the model (gray) to the same number of chains of a fast-relaxed model produced in PyRosetta (green) along with magnified views with sidechains in the turn region (center) and the protofilament interface (right). (b). Eight chains of fast relaxed G114V mutant (left) along with magnified view of the protofilament interface near the mutation site (red arrow). The same set of three views are also shown for A117V (c), G127V (d), and M129V (e) mutants or polymorphisms.
Supplementary Material
Acknowledgments:
We thank Drs. Duilio Cascio (UCLA), Heather McFarlane (UCLA) and Christina Sigurdson (UCSD). This work is supported by NSF Grants DMR-1548924 and DBI-1338135, DOE Grant DE-FC02-02ER63421, NIH Grants R35 GM128867, AG054022 and 1U24GM116792, as well as NIH instrumentation grants 1S10OD016387-01, 1S10RR23057, 1S10OD018111, that support our use of instruments at the Electron Imaging Center for NanoMachines and CNSI at UCLA. C.G. was funded by the Ruth L. Kirschstein NRSA GM007185 (NIH T32 Cellular and Molecular Biology Training Grant, UCLA) and is now funded by the Ruth L. Kirschstein Predoctoral Individual NRSA, 1F31 AI143368. J.A.R. is supported as a Searle Scholar a Pew Scholar and a Beckman Young Investigator. D.S.E is supported by the Howard Hughes Medical Institute (HHMI).
Footnotes
Competing Interests: DSE is SAB chair and equity holder in ADRx, Inc.
References:
- 1.Prusiner SB Prions. Proc. Natl. Acad. Sci. 95, 13363–13383 (1998). [DOI] [PMC free article] [PubMed] [Google Scholar]
- 2.Wasmer C et al. Amyloid Fibrils of the HET-s(218–289) Prion Form a β Solenoid with a Triangular Hydrophobic Core. Science 319, 1523–1526 (2008). [DOI] [PubMed] [Google Scholar]
- 3.Yuan AH & Hochschild A A bacterial global regulator forms a prion. Science 355, 198–201 (2017). [DOI] [PMC free article] [PubMed] [Google Scholar]
- 4.Cobb NJ & Surewicz WK Prion Diseases and Their Biochemical Mechanisms. Biochemistry 48, 2574–2585 (2009). [DOI] [PMC free article] [PubMed] [Google Scholar]
- 5.Riek R et al. NMR structure of the mouse prion protein domain PrP(121-231). Nature 382, 180–182 (1996). [DOI] [PubMed] [Google Scholar]
- 6.Diaz-Espinoza R & Soto C High-resolution structure of infectious prion protein: the final frontier. Nat. Struct. Mol. Biol. 19, 370–377 (2012). [DOI] [PMC free article] [PubMed] [Google Scholar]
- 7.Wille H & Requena JR The Structure of PrPSc Prions. Pathogens 7, (2018). [DOI] [PMC free article] [PubMed] [Google Scholar]
- 8.Surewicz WK & Apostol MI Prion Protein and Its Conformational Conversion: A Structural Perspective in Prion Proteins (ed. Tatzelt J.) 135–167 (Springer Berlin Heidelberg, 2011). doi: 10.1007/128_2011_165. [DOI] [PubMed] [Google Scholar]
- 9.Caughey B & Lansbury PT Protofibrils, pores, fibrils, and neurodegeneration: separating the responsible protein aggregates from the innocent bystanders. Annu. Rev. Neurosci. 26, 267–298 (2003). [DOI] [PubMed] [Google Scholar]
- 10.Rodriguez JA, Jiang L & Eisenberg DS Toward the Atomic Structure of PrPSc. Cold Spring Harb. Perspect. Biol. a031336 (2017) doi: 10.1101/cshperspect.a031336. [DOI] [PMC free article] [PubMed] [Google Scholar]
- 11.Wille H et al. Structural studies of the scrapie prion protein by electron crystallography. Proc. Natl. Acad. Sci. U. S. A. 99, 3563–3568 (2002). [DOI] [PMC free article] [PubMed] [Google Scholar]
- 12.Prusiner SB, Scott MR, DeArmond SJ & Cohen FE Prion Protein Biology. Cell 93, 337–348 (1998). [DOI] [PubMed] [Google Scholar]
- 13.Collins SJ, Lawson VA & Masters CL Transmissible spongiform encephalopathies. The Lancet 363, 51–61 (2004). [DOI] [PubMed] [Google Scholar]
- 14.Prusiner SB, Groth D, Serban A, Stahl N & Gabizon R Attempts to restore scrapie prion infectivity after exposure to protein denaturants. Proc. Natl. Acad. Sci. U. S. A. 90, 2793–2797 (1993). [DOI] [PMC free article] [PubMed] [Google Scholar]
- 15.Caughey B, Raymond GJ, Kocisko DA & Lansbury PT Scrapie infectivity correlates with converting activity, protease resistance, and aggregation of scrapie-associated prion protein in guanidine denaturation studies. J. Virol. 71, 4107–4110 (1997). [DOI] [PMC free article] [PubMed] [Google Scholar]
- 16.McKinley MP, Bolton DC & Prusiner SB A protease-resistant protein is a structural component of the Scrapie prion. Cell 35, 57–62 (1983). [DOI] [PubMed] [Google Scholar]
- 17.Rubenstein R et al. Detection of scrapie-associated fibril (SAF) proteins using anti-SAF antibody in non-purified tissue preparations. J. Gen. Virol. 67 ( Pt 4), 671–681 (1986). [DOI] [PubMed] [Google Scholar]
- 18.Silveira JR et al. The most infectious prion protein particles. Nature 437, 257–261 (2005). [DOI] [PMC free article] [PubMed] [Google Scholar]
- 19.Bolton DC, Meyer RK & Prusiner SB Scrapie PrP 27-30 is a sialoglycoprotein. J. Virol. 53, 596–606 (1985). [DOI] [PMC free article] [PubMed] [Google Scholar]
- 20.Pan KM et al. Conversion of alpha-helices into beta-sheets features in the formation of the scrapie prion proteins. Proc. Natl. Acad. Sci. 90, 10962–10966 (1993). [DOI] [PMC free article] [PubMed] [Google Scholar]
- 21.Nguyen JT et al. X-ray diffraction of scrapie prion rods and PrP peptides. J. Mol. Biol. 252, 412–422 (1995). [DOI] [PubMed] [Google Scholar]
- 22.Vázquez-Fernández E et al. The Structural Architecture of an Infectious Mammalian Prion Using Electron Cryomicroscopy. PLOS Pathog. 12, e1005835 (2016). [DOI] [PMC free article] [PubMed] [Google Scholar]
- 23.Gallagher-Jones M et al. Sub-ångström cryo-EM structure of a prion protofibril reveals a polar clasp. Nat. Struct. Mol. Biol. 25, 131–134 (2018). [DOI] [PMC free article] [PubMed] [Google Scholar]
- 24.Sawaya MR et al. Atomic structures of amyloid cross-β spines reveal varied steric zippers. Nature 447, 453–457 (2007). [DOI] [PubMed] [Google Scholar]
- 25.Wan W et al. Structural Studies of Truncated Forms of the Prion Protein PrP. Biophys. J. 108, 1548–1554 (2015). [DOI] [PMC free article] [PubMed] [Google Scholar]
- 26.Kocisko DA et al. Cell-free formation of protease-resistant prion protein. Nature 370, 471 (1994). [DOI] [PubMed] [Google Scholar]
- 27.Legname G et al. Synthetic mammalian prions. Science 305, 673–676 (2004). [DOI] [PubMed] [Google Scholar]
- 28.Choi J-K et al. Amyloid fibrils from the N-terminal prion protein fragment are infectious. Proc. Natl. Acad. Sci. U. S. A. 113, 13851–13856 (2016). [DOI] [PMC free article] [PubMed] [Google Scholar]
- 29.Taraboulos A et al. Acquisition of protease resistance by prion proteins in scrapie-infected cells does not require asparagine-linked glycosylation. Proc. Natl. Acad. Sci. 87, 8262–8266 (1990). [DOI] [PMC free article] [PubMed] [Google Scholar]
- 30.Zhang Z et al. De novo generation of infectious prions with bacterially expressed recombinant prion protein. FASEB J. 27, 4768–4775 (2013). [DOI] [PMC free article] [PubMed] [Google Scholar]
- 31.Wille H et al. Natural and synthetic prion structure from X-ray fiber diffraction. Proc. Natl. Acad. Sci. 106, 16990–16995 (2009). [DOI] [PMC free article] [PubMed] [Google Scholar]
- 32.Theint T et al. Species-dependent structural polymorphism of Y145Stop prion protein amyloid revealed by solid-state NMR spectroscopy. Nat. Commun. 8, 753 (2017). [DOI] [PMC free article] [PubMed] [Google Scholar]
- 33.Theint T et al. Structural Studies of Amyloid Fibrils by Paramagnetic Solid-State Nuclear Magnetic Resonance Spectroscopy. J. Am. Chem. Soc. 140, 13161–13166 (2018). [DOI] [PMC free article] [PubMed] [Google Scholar]
- 34.Terry C et al. Structural features distinguishing infectious ex vivo mammalian prions from non-infectious fibrillar assemblies generated in vitro. Sci. Rep. 9, (2019). [DOI] [PMC free article] [PubMed] [Google Scholar]
- 35.Terry C et al. Ex vivo mammalian prions are formed of paired double helical prion protein fibrils. Open Biol. 6, (2016). [DOI] [PMC free article] [PubMed] [Google Scholar]
- 36.Prusiner SB, Groth DF, Bolton DC, Kent SB & Hood LE Purification and structural studies of a major scrapie prion protein. Cell 38, 127–134 (1984). [DOI] [PubMed] [Google Scholar]
- 37.Stahl N et al. Structural studies of the scrapie prion protein using mass spectrometry and amino acid sequencing. Biochemistry 32, 1991–2002 (1993). [DOI] [PubMed] [Google Scholar]
- 38.Walsh P, Simonetti K & Sharpe S Core Structure of Amyloid Fibrils Formed by Residues 106–126 of the Human Prion Protein. Structure 17, 417–426 (2009). [DOI] [PubMed] [Google Scholar]
- 39.Jobling MF et al. The Hydrophobic Core Sequence Modulates the Neurotoxic and Secondary Structure Properties of the Prion Peptide 106–126. J. Neurochem. 73, 1557–1565 (1999). [DOI] [PubMed] [Google Scholar]
- 40.Biasini E et al. The hydrophobic core region governs mutant prion protein aggregation and intracellular retention. Biochem. J. 430, 477–486 (2010). [DOI] [PubMed] [Google Scholar]
- 41.Norstrom EM & Mastrianni JA The AGAAAAGA Palindrome in PrP Is Required to Generate a Productive PrPSc-PrPC Complex That Leads to Prion Propagation. J. Biol. Chem. 280, 27236–27243 (2005). [DOI] [PubMed] [Google Scholar]
- 42.Aucoin D et al. Protein-solvent interfaces in human Y145Stop prion protein amyloid fibrils probed by paramagnetic solid-state NMR spectroscopy. J. Struct. Biol. 206, 36–42 (2019). [DOI] [PMC free article] [PubMed] [Google Scholar]
- 43.Asante EA et al. Inherited prion disease A117V is not simply a proteinopathy but produces prions transmissible to transgenic mice expressing homologous prion protein. PLoS Pathog. 9, e1003643 (2013). [DOI] [PMC free article] [PubMed] [Google Scholar]
- 44.Rodriguez M-M et al. A novel mutation (G114V) in the prion protein gene in a family with inherited prion disease. Neurology 64, 1455–1457 (2005). [DOI] [PubMed] [Google Scholar]
- 45.Collinge J, Palmer MS & Dryden AJ Genetic predisposition to iatrogenic Creutzfeldt-Jakob disease. The Lancet 337, 1441–1442 (1991). [DOI] [PubMed] [Google Scholar]
- 46.Fitzpatrick AWP et al. Cryo-EM structures of tau filaments from Alzheimer’s disease. Nature 547, 185–190 (2017). [DOI] [PMC free article] [PubMed] [Google Scholar]
- 47.Falcon B et al. Novel tau filament fold in chronic traumatic encephalopathy encloses hydrophobic molecules. Nature 568, 420–423 (2019). [DOI] [PMC free article] [PubMed] [Google Scholar]
- 48.Asante EA et al. A naturally occurring variant of the human prion protein completely prevents prion disease. Nature 522, 478–481 (2015). [DOI] [PMC free article] [PubMed] [Google Scholar]
- 49.Zheng Z et al. Structural basis for the complete resistance of the human prion protein mutant G127V to prion disease. Sci. Rep. 8, 1–15 (2018). [DOI] [PMC free article] [PubMed] [Google Scholar]
- 50.Zhou S, Shi D, Liu X, Liu H & Yao X Protective V127 prion variant prevents prion disease by interrupting the formation of dimer and fibril from molecular dynamics simulations. Sci. Rep 6, 21804 (2016). [DOI] [PMC free article] [PubMed] [Google Scholar]
- 51.Sabareesan AT & Udgaonkar JB The G126V Mutation in the Mouse Prion Protein Hinders Nucleation-Dependent Fibril Formation by Slowing Initial Fibril Growth and by Increasing the Critical Concentration. Biochemistry 56, 5931–5942 (2017). [DOI] [PubMed] [Google Scholar]
- 52.Morales R Prion strains in mammals: Different conformations leading to disease. PLoS Pathog. 13, (2017). [DOI] [PMC free article] [PubMed] [Google Scholar]
- 53.Tattum MH et al. Elongated oligomers assemble into mammalian PrP amyloid fibrils. J. Mol. Biol. 357, 975–985 (2006). [DOI] [PubMed] [Google Scholar]
- 54.Ghetti B et al. Vascular variant of prion protein cerebral amyloidosis with tau-positive neurofibrillary tangles: the phenotype of the stop codon 145 mutation in PRNP. Proc. Natl. Acad. Sci. U. S. A. 93, 744–748 (1996). [DOI] [PMC free article] [PubMed] [Google Scholar]
- 55.Piccardo P et al. Prion Proteins with Different Conformations Accumulate in Gerstmann-Sträussler-Scheinker Disease Caused by A117V and F198S Mutations. Am. J. Pathol. 158, 2201–2207 (2001). [DOI] [PMC free article] [PubMed] [Google Scholar]
- 56.Sim VL & Caughey B Ultrastructures and strain comparison of under-glycosylated scrapie prion fibrils. Neurobiol. Aging 30, 2031–2042 (2009). [DOI] [PubMed] [Google Scholar]
- 57.Li Q et al. Structural attributes of mammalian prion infectivity: Insights from studies with synthetic prions. J. Biol. Chem. 293, 18494–18503 (2018). [DOI] [PMC free article] [PubMed] [Google Scholar]
- 58.Prusiner SB Novel proteinaceous infectious particles cause scrapie. Science 216, 136–144 (1982). [DOI] [PubMed] [Google Scholar]
- 59.Gao Y, Tran P, Petkovic-Duran K, Swallow T & Zhu Y Acoustic micromixing increases antibody-antigen binding in immunoassays. Biomed. Microdevices 17, 79 (2015). [DOI] [PubMed] [Google Scholar]
- 60.Nagapudi K, Umanzor EY & Masui C High-throughput screening and scale-up of cocrystals using resonant acoustic mixing. Int. J. Pharm. 521, 337–345 (2017). [DOI] [PubMed] [Google Scholar]
- 61.Kabsch W XDS. Acta Crystallogr. D Biol. Crystallogr 66, 125–132 (2010). [DOI] [PMC free article] [PubMed] [Google Scholar]
- 62.Otwinowski Z, Minor W, Borek D & Cymborowski M DENZO and SCALEPACK. urn:isbn:978-0-470-66078-2 https://onlinelibrary.wiley.com/iucr/itc/doi/10.1107/97809553602060000833 (2012) doi: [Google Scholar]
- 63.Leslie AGW & Powell HR Processing diffraction data with mosflm in Evolving Methods for Macromolecular Crystallography (eds. Read RJ & Sussman JL.) 41–51 (Springer Netherlands, 2007). [Google Scholar]
- 64.McCoy AJ et al. Phaser crystallographic software. J. Appl. Crystallogr. 40, 658–674 (2007). [DOI] [PMC free article] [PubMed] [Google Scholar]
- 65.Emsley P, Lohkamp B, Scott WG & Cowtan K Features and development of Coot. Acta Crystallogr. D Biol. Crystallogr 66, 486–501 (2010). [DOI] [PMC free article] [PubMed] [Google Scholar]
- 66.Murshudov GN et al. REFMAC 5 for the refinement of macromolecular crystal structures. Acta Crystallogr. D Biol. Crystallogr 67, 355–367 (2011). [DOI] [PMC free article] [PubMed] [Google Scholar]
- 67.Hilz H, Wiegers U & Adamietz P Stimulation of proteinase K action by denaturing agents: application to the isolation of nucleic acids and the degradation of ‘masked’ proteins. Eur. J. Biochem. 56, 103–108 (1975). [DOI] [PubMed] [Google Scholar]
- 68.Carragher B et al. Leginon: An Automated System for Acquisition of Images from Vitreous Ice Specimens. J. Struct. Biol. 132, 33–45 (2000). [DOI] [PubMed] [Google Scholar]
- 69.Li X et al. Electron counting and beam-induced motion correction enable near-atomic-resolution single-particle cryo-EM. Nat. Methods 10, 584–590 (2013). [DOI] [PMC free article] [PubMed] [Google Scholar]
- 70.Zheng SQ et al. MotionCor2: anisotropic correction of beam-induced motion for improved cryo-electron microscopy. Nat. Methods 14, 331–332 (2017). [DOI] [PMC free article] [PubMed] [Google Scholar]
- 71.Zivanov J et al. New tools for automated high-resolution cryo-EM structure determination in RELION-3. eLife 7, e42166 (2018). [DOI] [PMC free article] [PubMed] [Google Scholar]
- 72.Zhang K Gctf: Real-time CTF determination and correction. J. Struct. Biol. 193, 1–12 (2016). [DOI] [PMC free article] [PubMed] [Google Scholar]
- 73.He S Helical Reconstruction in RELION. (University of Cambridge, 2018). doi: 10.17863/CAM.31456. [DOI] [Google Scholar]
- 74.Adams PD et al. PHENIX : a comprehensive Python-based system for macromolecular structure solution. Acta Crystallogr. D Biol. Crystallogr 66, 213–221 (2010). [DOI] [PMC free article] [PubMed] [Google Scholar]
- 75.Liberta F et al. Cryo-EM fibril structures from systemic AA amyloidosis reveal the species complementarity of pathological amyloids. Nat. Commun. 10, 1104 (2019). [DOI] [PMC free article] [PubMed] [Google Scholar]
- 76.Delano W The PyMOL Molecular Graphics System. (Schrödinger LLC; ). [Google Scholar]
- 77.Chaudhury S, Lyskov S & Gray JJ PyRosetta: a script-based interface for implementing molecular modeling algorithms using Rosetta. Bioinforma. Oxf. Engl. 26, 689–691 (2010). [DOI] [PMC free article] [PubMed] [Google Scholar]
- 78.Eisenberg D & McLachlan AD Solvation energy in protein folding and binding. Nature 319, 199–203 (1986). [DOI] [PubMed] [Google Scholar]
- 79.Eisenberg D, Wesson M & Yamashita M Interpretation of protein folding and binding with atomic solvation parameters. Chemica Scripta https://eurekamag.com/research/032/001/032001963.php (1989). [Google Scholar]
- 80.Koehl P & Delarue M Application of a self-consistent mean field theory to predict protein side-chains conformation and estimate their conformational entropy. J. Mol. Biol. 239, 249–275 (1994). [DOI] [PubMed] [Google Scholar]
Associated Data
This section collects any data citations, data availability statements, or supplementary materials included in this article.
Supplementary Materials
Data Availability Statement
EM maps and atomic coordinates for rPrP106-145 have been deposited in the EMDB and wwPDB as EMD-20900 and PDB 6UUR, respectively; atomic coordinates and structure factors have been deposited in the wwPDB for PrP113-118 (PDB 6PQ5) and PrP119-124 (PDB 6PQA).