

Abstract
In this work, we have proposed a simple overlapping community detection algorithm based on a distributed neighbourhood threshold method (DNTM). DNTM uses pre-partitioned disjoint communities and then analyzes the neighbourhood distribution of boundary nodes in disjoint communities to detect overlapping communities. It is a form of seed-based global method since boundary nodes are considered as seeds and become the starting point for detecting overlapping communities. Threshold value for each boundary node is used as minimum influence by the neighbours of a node in order to determine its belongingness to any community. The effectiveness of the DNTM algorithm has been demonstrated by testing on fifteen real-world datasets and compared with seven overlapping community detection algorithms. DNTM outperforms comparable algorithms with 10 out of 15 datasets and gives comparable results for the remaining 5 datasets in terms of the extended modularity  measure. Experiments with various disjoint algorithms on 15 datasets reveal that DNTM with tolerance community detection (TCD) as a preprocessing algorithm gives the best result.
Keywords: Community detection, Social networks analysis, Overlapping communities, Graph clustering
Introduction
There are a plethora of methods for detecting overlapping communities in social networks for both synthetic and real-world datasets starting from [19]. Classical strategies include: local expansion of seed nodes [20, 22], label propagation [7, 13, 33], clique-based [26] and ensemble-based methods [3, 4] to name a few. In this paper, we propose a new method based on detecting overlapping communities by i) utilizing disjoint communities, and ii) analyzing the neighbourhood distribution of boundary nodes in disjoint communities to detect overlapping clusters. Our method is akin to the more recent class of ensemble methods [3] that uses disjoint methods as a starting point for development of overlapping method. In this paper, we propose a distributed neighbourhood threshold method (DNTM) which depends on the neighbourhood distribution of boundary nodes in disjoint communities. The threshold for each boundary node is used as minimum neighbour influence for a node to belong in any community. DNTM can be considered as global method since we are not performing any local expansion on a set of initial seed nodes for generating overlapping clusters. Instead, we are using boundary nodes and exploring the clusters external to the home clusters of boundary nodes to generate overlapping clusters. It is also a form of seed-based method since boundary nodes are considered as seeds and become the starting point for detecting overlapping clusters. There is only a user-defined maximum threshold (tolerance) criteria to form a neighbourbood. Four disjoint methods have been considered in this work with the primary method based on a tolerance community detection (TCD) [15]. The other partitioning methods include: Louvain [1], Girvan-Newman [10] and Greedy Modularity [5]. Typical metrics such as Overlapping Normalized Mutual Information (ONMI), Precision, Recall, or F-measure require ground-truth communities. However, ground-truth communities are readily available for large real networks. In their absence, computer generated benchmark networks with built-in ground-truth communities, called synthetic networks such as LFR [19] must be used, to first generate the ground-truth communities. In this paper, DNTM uses an extended modularity  measure introduced by Nicosia et al. [24] as a performance metric. The effectiveness of the DNTM algorithm has been demonstrated by testing on fifteen real-world datasets and compared with seven overlapping community detection algorithms.
The contribution of this paper is a simple algorithm which outperforms comparable algorithms with 10 out of 15 datasets and gives comparable results for the remaining 5 datasets in terms of extended modularity  measure. Another noteworthy feature of DNTM is that no optimization strategy such as satisfying some fitness function criteria has been used. Experiments with various partitioning methods on 15 datasets reveal that: TCD gives the best result with 7 datasets, Greedy Modularity method gives the best result with 4 datasets and both Louvain and Girvan-Newman methods with 4 datasets.
Our paper is organized as follows: In Sect. 2, we briefly review some representative overlapping community detection algorithms. In Sect. 3, we give a brief overview of definitions and cluster quality measure used in this paper. In Sect. 4, we give details of the proposed DNTM algorithm and its complexity. In Sect. 5, we present experimental results and analysis. Lastly, we give concluding remarks in Sect. 6.
Related Works
In this section, we briefly review some representative algorithms in terms of general strategies used by these algorithms.
Local Expansion
The general strategy is to start with a set of initial nodes as seeds and then expand to communities based on a fitness function criteria.
OSLOM [20]: Introduced in 2011 by Lancichinetti et al., this method was the first that detected communities based on their statistical significance that takes into account different types of graphs, edge direction, edge weights, overlapping communities, network hierarchy and to recognize the absence of community structure and/or the presence of randomness in graphs. It is based on a local expansion and optimization strategy where community expansion is performed by comparing the statistical significance of clusters defined with respect to a global null model (which is the configuration model).
LEMON [22]: This algorithm proposed in 2018 by Li et al., is based on the concepts of seed sets, local spectral diffusion, and local spectra. Here, a subspace around the initial seed sets called local spectra is explored using a short random walk also known as local spectral diffusion. Local spectra avoids computation burden by replacing a large number of singular vectors with short random walks. The running time of LEMON scales with the size of the community rather than that of the entire graph and has been tested on large networks.
Label Propagation
The general strategy is to label every node with a unique value and replace the node’s label value with that of its most commonly detected neighbour. Once this process terminates, the nodes having the same label form a community.
COPRA [13]: Introduced in 2010, this method extends the label propagation algorithm(LPA) method by Raghavan et al. [27] to detect overlapping communities with a novel termination condition. This method is dependent on parameters such as node belonging coefficient and maximum number of communities a node can belong to, and can handle weighted and bipartite graphs. COPRA usually produces results that are better (in terms of modularity) for large networks.
SLPA [33]: This algorithm is based on speaker-listener mechanism to transfer the information known as labels between the nodes. Each node in this method maintains a list of labels and a randomly selected label from this list is propagated further to the node under consideration presently for detecting communities.
DEMON [7, 8]: Label propagation algorithm is applied at the core of DEMON method to merge the locally generated clusters using merging function to obtain overlapping communities.
Ensemble Based
The general strategy here is to leverage disjoint clusters produced by various disjoint community detection algorithms to discover the overlapping communities.
MEDOC [4]: Introduced in 2016 by Chakraborty et al., this is the first ensemble based method for discovering overlapping communities by using meta-communities created from combining various similar clusters produced by disjoint communities detection methods. Further an association matrix which records the probability of a vertex belonging to a meta-community is utilized to generate both non-overlapping and overlapping communities.
EnCoD [3]: This method uses various disjoint community detection algorithms to generate disjoint clusters and further utilize the good qualities of these clusters to create an ensemble solution. This algorithm uses node membership as a feature and similarity of node pairs to form a network.
Others
CPM [26]: Introduce by Gergely Palla et al. in 2005, this classical algorithm is the first method to detect overlapping communities based on clique-percolation technique.
NECTAR [6]: It is a node-centric overlapping community detection algorithm in which the best communities for a given node are found using objective function and further this node is added to these communities to obtain the overlapping communities. In this method, Louvain’s local search heuristic approach is generalized to discover overlapping communities. This algorithm tries to maximize the dynamically chosen objective function (i.e. WOCC and  ) by testing every possible existence of each node in it’s neighbouring cluster in order to generate overlapping communities. All the clusters with a maximum value of objective function are considered to obtain the overlapping communities.
IEDC [14]: This algorithm provides an integrated framework for discovering both overlapping and non-overlapping communities. It uses a node-based criteria with a probabilistic model. It includes computation of internal associations (non-overlapping communities), computation of external associations (overlapping communities) using interaction matrix and a community propagation probability of its neighbours.
Preliminaries
Here, we give a brief overview of definitions and cluster quality measure used in this paper.
Undirected Graph: A graph G is defined as a pair of (V, E) where V is a set consisting all the nodes and E is set consisting all the edges E
 . Undirected graphs are such graphs in which if an edge
  then edge (y, x) must also be in E. The degree of a node v is defined as the number of edges containing v. Two nodes are adjacent if they share a common edge.
Path: A path is composed of a series of nodes  where
where  ,
,  is adjacent to
  . The path length of P is measured as
  where n is the total number of nodes in path P. It is also measured as the number edge(s) in that path. The path with minimum length (or number of edge(s)) from a source node s to a destination node d is called the shortest path sp from s to d.
Neighbourhood of a Node: The neighbourhood of a node x for a graph  is defined as:
 |
1 |
where
 |
2 |
 is a user-defined positive real threshold value, sp is the shortest path from x to y and |sp| is the number of edge(s) in sp. A breadth first search is used for traversing the graph in order to find the neighbourhood of any given node.
Neighbourhood Cluster of a Node: Let  be a set of disjoint clusters that cover the graph G where
  is a cluster or community such that
  . Let
. Let  where
where  is the home cluster, then
 |
3 |
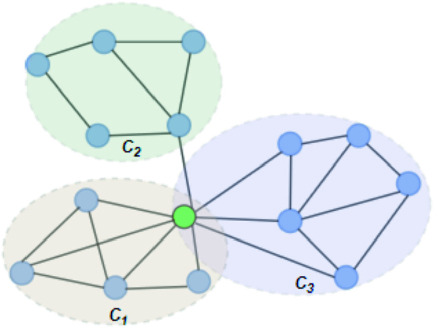
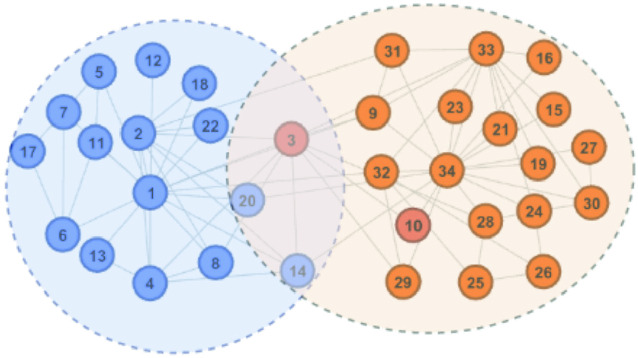
In Fig. 1, the neighbourhood cluster(s) for the green node belonging to cluster  are: clusters
  and
and  . Note, for the green node, cluster
  is considered as the home cluster.
Fig. 1.
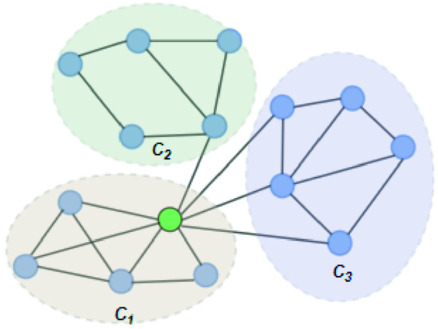
Overlapping candidate node (Color figure online)
Distributed Neighbourhood Threshold: Equaion 4 defines this threshold as the ratio of total number of the neighbours of a given node v over the total number of neighbourhood clusters of v plus the home cluster of v.
 |
4 |
Overlapping Candidate Node: Let  , then v is a candidate overlapping node if it satisfies the following equation:
 |
5 |
Overlapping Node: Node v is a overlapping node if for any  it satisfies the following equation:
 |
6 |
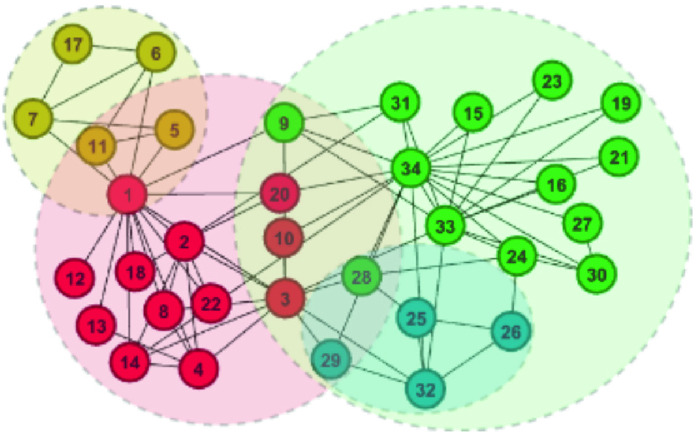
Example 1
In Fig. 1, the green node in cluster  is an overlapping candidate node since it has neighbours in clusters
  and
and  . All nodes that have neighbours outside their home clusters are considered as overlapping candidate nodes. Using Eq. 4,
  and
and  , hence
  . In other words,
  is considered as the minimum threshold value for a node v to be classified as overlapping node. As shown in Fig. 1
green node shares 3 edges with
is considered as the minimum threshold value for a node v to be classified as overlapping node. As shown in Fig. 1
green node shares 3 edges with  which also means
  in
in  is 3. Since cluster
  includes neighbours of green node and
  meets the threshold requirement, the green node will be shared with
  as shown in Fig. 2.
Fig. 2.
Sample overlapping clusters (Color figure online)
Cluster Quality Measure: Extended Modularity: In this work we have used the extended modularity  measure introduced by Nicosia in [24, 25] given in Eq. 7 where V is the set of nodes, |V| represents the number of nodes, C represents the set of overlapping cluster, m is the total number of edges and
  is the adjacency matrix for the graph. We have chosen to use this measure since it does not require the ground-truth to measure the quality of the generated clusters. Generally, good quality overlapping clusters have higher
  value. The value of
  will be 0 when only one cluster is obtained with all the nodes in it. Details about various coefficients in Eq. 7 can also be found in [25].
 |
7 |
 |
8 |
 |
9 |
In overlapping communities, each node can belong to multiple communities but with different strengths of belonging. An array of such belonging factor [ ] is calculated and allotted to each node i in the graph G. The strength of node i belonging to community c is depicted by coefficient
  . Since the belonging coefficient for each node is already defined, it is also possible to define the belonging coefficient to each community for edges incoming to or outgoing from a node. Belonging coefficient of edge
  with source node i and target node j to community c is represented by function
  . Further, the belonging coefficient for link l(i, j) pointing to a node going into the community c is represented by
  and given by Eq. 8 similarly the belonging coefficient for link l(i, j) pointing to a node going out of the community c is obtained by using Eq. 9 and is represented by
  . Extended Modularity measures for overlapping cluster depends on
  which is defined in the Eq. 10
 |
10 |
where  is a simple linear scaling function given in Eq. 11 . The value of p is set to 30 in [25]. Generally, good quality overlapping clusters have higher
  value. The value of
  will be 0 when only one cluster is obtained with all the nodes in it.
 |
11 |
Datasets: Various sized real-world datasets were used in this study: Karate [34], Dolphin [23], Lesmis [16], Football [10], Polbooks [17], Jazz [11], Power grid [31], Durgnet [32], Highschool [18], Netscience [29], C.elegans [9], Bible-names [18], Protein [18], Internet-Route [21] and PGP [2].
Overlapping Community Detection Algorithm: DNTM
In Fig. 3, the flow of the DNTM algorithm is given where DNTM takes crisp partitioned clusters as input irrespective of the algorithm used. We first generate non-overlapping clusters and use these clusters to examine all such nodes which have neighbours in other clusters to find overlapping nodes. Once an overlapping node is found, we update the respective clusters by including this overlapping node to obtain the resultant overlapping clusters.
Fig. 3.

Flow diagram of DNTM Algorithm
The main steps of DNTM algorithm are as follows: i) generate non-overlapping clusters, ii) find candidate overlapping nodes using Eq. 5, iii) calculate distributed neighbourhood threshold using Eq. 4, iv) filter overlapping nodes using Eq. 6, and v) update the clusters with overlapping nodes to obtain the resultant overlapping clusters. Note, DNTM takes crisp partitioned clusters as input, irrespective of the algorithm used (see Fig. 6 and 7).
Fig. 6.
DNTM clustering using disjoint clusters generated from Girvan-Newman method on the Karate dataset
Fig. 7.
DNTM clustering using disjoint clusters generated from Louvain method on the Karate dataset
Algorithm 1 includes the following data structures: list of overlapping clusters  is used to store generated overlapping clusters, Node-Cluster Dictionary
  to store cluster id of each node, Cluster-Node Dictionary
  to store nodes in each cluster, Neighbour Node-Cluster Dictionary
  to store cluster id of neighbourhood nodes, Overlapping-Candidate-Node Dictionary
  to store overlapping candidate nodes and its neighbours
  from neighbourhood cluster NC, Node-Neighbour Dictionary
  to store node and its neighbours.
Time Complexity
In DNTM algorithm for a graph G(V, E), the time taken for pre-processing the disjoint clusters is O(|L|.|C|) which is less than or equal to O(|V|) where |L| is the number of disjoint clusters, |C| represents the number of nodes in a cluster C and |V| represent total number of nodes in graph G. Running time of BFS is  where b is branching factor and d is maximum depth. In DNTM, we consider neighbours at depth 1, so time taken is O(b). To find overlapping candidate nodes, the time consumed is
  . To filter overlapping nodes, computation time is
  where |OCN| is the number of overlapping candidate nodes,
  is the number of neighbourhoods in other clusters and
  is the number of neighbourhood clusters. Since
  , so the computation time will be
  . Finally it takes O(|L|) time to generate overlapping clusters. So the obtained final time complexity is
Experiments and Results
To examine the performance of DNTM, 15 real world data-sets were used and compared with the following overlapping communities detection algorithms: CPM [26], OSLOM [20], COPRA [13], SLPA [33], Node Perception [30], DEMON [7, 8] and CONGO [12] with h = 2 and h = 3. Except for OSLOM and COPRA, all other algorithms were taken from CDlib [28] Python package. Table 1 gives the results of our experiments where DNTM (TCD) is the proposed algorithm which uses TCD method to generate non-overlapping clusters with  with source code made available by the authors. TCD method relies on a tolerance relation where a tolerance class represents members of the same community and uses an objective function based on two well-known quality functions, modularity and coverage.
Table 1.
Extended Modularity ( ) values
| Datasets | CPM | OSLOM | COPRA | SLPA | NodePer. | DEMON | CONGO | CONGO | DNTM |
|---|---|---|---|---|---|---|---|---|---|
| h = 2 | h = 3 | (TCD) | |||||||
| Karate | 0.51 | 0.7099 | 0.7228 | 0.5405 | 0.1944 | 0.38 | 0.3423 | 0.488 | 0.7282 |
| Dolphins | 0.66 | 0.7426 | 0.7434 | 0.7231 | 0.1947 | 0.457 | 0.4085 | 0.134 | 0.734 |
| Lesmis | 0.586 | 0.6908 | 0.7156 | 0.7772 | 0.3259 | 0.385 | 0.315 | 0.6586 | 0.755 |
| Football | 0.44 | 0.6674 | 0.6962 | 0.7052 | 0.072 | 0.353 | 0.4332 | 0.4955 | 0.75 |
| Polbooks | 0.786 | 0.8263 | 0.8226 | 0.8286 | 0.142 | 0.279 | 0.3468 | 0.4945 | 0.81 |
| Jazz | 0.096 | 0.5142 | 0.6626 | 0.7401 | 0.0438 | 0.382 | 0.24 | 0.22 | 0.6904 |
| Power | 0.15 | 0.3887 | 0.4842 | 0.6363 | 0.0970 | 0.077 | 0.8312 | 0.7878 | 0.90 |
| Durgnet | 0.207 | 0.1697 | 0.7664 | 0.6255 | 0.1355 | 0.155 | 0.235 | 0.235 | 0.7853 |
| Highschool | 0.056 | 0.6762 | 0.7064 | 0.6581 | 0.144 | 0.056 | 0.4612 | 0.7015 | 0.755 |
| Netscience | 0.0 | 0.7862 | 0.8444 | 0.8353 | 0.512 | 0.436 | 0.7547 | 0.7314 | 0.953 |
| C.elegans | 0.217 | 0.4551 | 0.212 | 0.4346 | 0.080 | 0.0279 | 0.07426 | 0.10357 | 0.61 |
| Bible names | 0.425 | 0.2965 | 0.4025 | 0.3657 | 0.0938 | 0.013 | 0.19 | 0.160 | 0.6424 |
| Protein | 0.16 | 0.1784 | 0.363 | 0.7402 | 0.1015 | 0.140 | 0.57221 | 0.5858 | 0.7958 |
| Internet route | 0.245 | 0.3475 | 0.102 | 0.63 | 0.0213 | 0.0045 | 0.1467 | 0.25482 | 0.5273 |
| PGP | 0.568 | 0.5364 | 0.775 | 0.737 | 0.2523 | 0.2024 | 0.5607 | 0.5563 | 0.7963 |
Since most of the algorithms have a non-unique output for  for each execution, hence these algorithms were executed 10 times and the average of the 5 best scores for
  was used in our reporting shown in Table 1 and bold values represent the best score for each dataset. In additon, the number of clusters generated by majority of the algorithms is used as input for those algorithms that require number of clusters as input.
Based on the results in Table 1 and Fig. 4 and Fig. 5, we can observe that the proposed DNTM algorithm outperforms comparable algorithms with 10 out of 15 datasets and gives comparable results for the remaining 5 datasets. The quality of generated overlapping clusters from DNTM is greatly affected by the number of disjoint clusters passed as input, generated by the initial disjoint algorithm. From Eq. 4 it can be observed that  has an inverse relation with number of communities.
  is highly sensitive and dependent on the number of communities. As a result, increasing number of communities, will decrease the value of
  , which will in turn affect the overlap between the communities. In our experiments, the number of communities, range from 2 to 109. We also observed that in general, for the datasets, where the number of communities is greater than 4, DNTM achieves the best result. Also, DNTM depends on the boundary nodes in the disjoint clusters as well their internal and external links (edges). If the number of external links of a node is extremely less as compared to its internal links, this node is less likely to qualify the condition in Eq. 6 to be classified as an overlapping node. Most algorithms use an internal objective function to obtain good quality clusters which entails parameter selection. DNTM does not have this limitation as it does not use an internal objective function and the major computation is done for overlapping candidate nodes which is comparatively less than |V|. Hence DNTM is computationally efficient. Table 2 gives comparative results for
  with the proposed DNTM algorithm where the input (disjoint clusters) was obtained using Louvain [1] DNTM (LN), Girvan-Newman [10] DNTM (GN) and Greedy Modularity [5] DNTM (GD) methods on all the datasets. It can be observed that DNTM (TCD) is giving best results in 7 out of 15 datasets and comparable with the other data sets (either second best or third best).
Fig. 4.
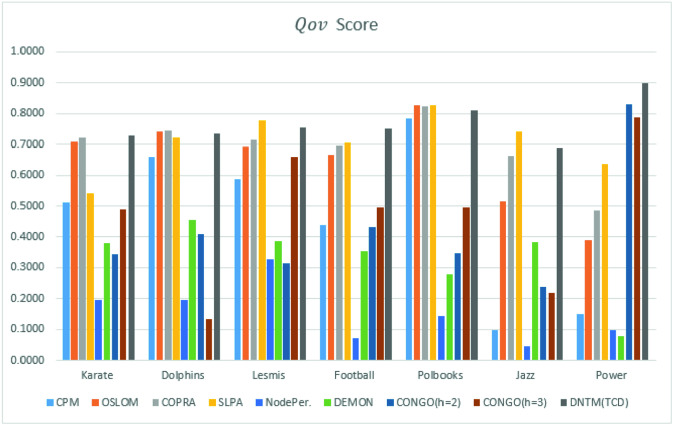
Part 1:  results with 7 datasets
Fig. 5.

Part 2:  results with 8 datasets
Table 2.
DNTM results with different partitioning methods
| Datasets | DNTM (TCD) | DNTM (LN) | DNTM (GN) | DNTM (GD) | Best in DNTM |
|---|---|---|---|---|---|
| Karate | 0.7282 | 0.615 | 0.7185 | 0.5861 | TCD |
| Dolphins | 0.734 | 0.6193 | 0.7232 | 0.7359 | GD |
| Lesmis | 0.755 | 0.6644 | 0.2689 | 0.7034 | TCD |
| Football | 0.75 | 0.6563 | 0.7777 | 0.6493 | GN |
| Polbooks | 0.81 | 0.8138 | 0.8090 | 0.825 | GD |
| Jazz | 0.6904 | 0.7064 | 0.0379 | 0.7016 | LN |
| Power | 0.90 | 0.9513 | 0.8709 | 0.9511 | LN |
| Durgnet | 0.7853 | 0.7299 | 0.8654 | 0.7907 | GN |
| Highschool | 0.755 | 0.5909 | 0.5964 | 0.7329 | TCD |
| Netscience | 0.953 | 0.9154 | 0.8674 | 0.9256 | TCD |
| C.elegans | 0.61 | 0.3473 | 0.0756 | 0.5035 | TCD |
| Bible names | 0.6424 | 0.4156 | 0.1 | 0.5815 | TCD |
| Protein | 0.7958 | 0.8076 | 0.6095 | 0.8171 | GD |
| Internet route | 0.5273 | 0.4305 | 0.01519 | 0.4375 | TCD |
| PGP | 0.7963 | 0.8975 | 0.2042 | 0.9082 | GD |
Figure 6 and 7 show overlapping clusters generated with the proposed DNTM algorithm where the input (disjoint clusters) was obtained using Louvain [1] and Girvan-Newman [10] methods on the Karate dataset. In Fig. 6, three overlapping nodes  were detected, whereas using TCD as input method, five overlapping nodes
  were detected. In Fig. 7, 12 overlapping nodes were detected including a hierarchical cluster where nodes
  are present in 3 clusters.
Conclusion and Future Work
In this paper, we have proposed a new overlapping community detection algorithm (DNTM) based on: i) utilizing disjoint communities produced by community detection algorithm(s), and ii) analyzing the neighbourhood distribution of boundary nodes of discovered disjoint communities to detect overlapping clusters. The effectiveness of the DNTM algorithm has been demonstrated by testing on fifteen real-world datasets and compared with seven overlapping community detection algorithms in terms of an extended modularity  measure. Three other well-known disjoint methods have been considered in this work with the primary method based on a tolerance community detection. DNTM outperforms comparable algorithms with 10 out of 15 datasets and gives comparable results for the remaining 5 datasets. Experiments with various disjoint algorithms on 15 datasets reveal that DNTM with TCD as a preprocessing algorithm gives the best result. Another noteworthy feature of DNTM is that no any optimization strategy has been used during or after the clustering process. Future work with DNTM will include: i) considering an ensemble mechanism to use various disjoint methods to select the best disjoint clusters in terms of quality and number of clusters as a preprocessing step to the DNTM algorithm, ii) defining an internal objective function to obtain good quality clusters, iii) testing and analyzing the behavior of DNTM on synthetic networks and iv) implementing a parallel DNTM to be able to handle datasets with larger nodes and communities.
Footnotes
This research has been supported by the Natural Sciences and Engineering Research Council of Canada (NSERC) Discovery grant 194376. Rajesh Jaiswal’s research is supported by the UW Graduate Studies Scholarship and Linda and Vana Kirby Scholarship.
Contributor Information
Rafael Bello, Email: rbellop@uclv.edu.cu.
Duoqian Miao, Email: dqmiao@tongji.edu.cn.
Rafael Falcon, Email: rfalcon@ieee.org.
Michinori Nakata, Email: nakatam@ieee.org.
Alejandro Rosete, Email: rosete@ceis.cujae.edu.cu.
Davide Ciucci, Email: davide.ciucci@unimib.it.
Rajesh Jaiswal, Email: jaiswal-r@webmail.uwinnipeg.ca.
Sheela Ramanna, Email: s.ramanna@uwinnipeg.ca.
References
- 1.Blondel VD, Guillaume JL, Lambiotte R, Lefebvre E. Fast unfolding of communities in large networks. J. Stat. Mech: Theory Exp. 2008;2008(10):P10008. doi: 10.1088/1742-5468/2008/10/P10008. [DOI] [Google Scholar]
- 2.Boguná M, Pastor-Satorras R, Díaz-Guilera A, Arenas A. Models of social networks based on social distance attachment. Phys. Rev. E. 2004;70(5):056122. doi: 10.1103/PhysRevE.70.056122. [DOI] [PubMed] [Google Scholar]
- 3.Chakraborty, T., Ghosh, S., Park, N.: Ensemble-based overlapping community detection using disjoint community structures (2018)
- 4.Chakraborty, T., Park, N., Subrahmanian, V.: Ensemble-based algorithms to detect disjoint and overlapping communities in networks. In: 2016 IEEE/ACM International Conference on Advances in Social Networks Analysis and Mining (ASONAM), pp. 73–80. IEEE (2016)
- 5.Clauset A, Newman ME, Moore C. Finding community structure in very large networks. Phys. Rev. E. 2004;70(6):066111. doi: 10.1103/PhysRevE.70.066111. [DOI] [PubMed] [Google Scholar]
- 6.Cohen Y, Hendler D, Rubin A. Node-centric detection of overlapping communities in social networks. In: Shmueli E, Barzel B, Puzis R, editors. 3rd International Winter School and Conference on Network Science. Cham: Springer; 2017. pp. 1–10. [Google Scholar]
- 7.Coscia, M., Rossetti, G., Giannotti, F., Pedreschi, D.: DEMON: a local-first discovery method for overlapping communities. In: Proceedings of the 18th ACM SIGKDD International Conference on Knowledge Discovery and Data Mining, pp. 615–623. ACM (2012)
- 8.Coscia M, Rossetti G, Giannotti F, Pedreschi D. Uncovering hierarchical and overlapping communities with a local-first approach. ACM Trans. Knowl. Discov. Data (TKDD) 2014;9(1):6. [Google Scholar]
- 9.Duch J, Arenas A. Community detection in complex networks using extremal optimization. Phys. Rev. E. 2005;72(2):027104. doi: 10.1103/PhysRevE.72.027104. [DOI] [PubMed] [Google Scholar]
- 10.Girvan M, Newman ME. Community structure in social and biological networks. Proc. Natl. Acad. Sci. 2002;99(12):7821–7826. doi: 10.1073/pnas.122653799. [DOI] [PMC free article] [PubMed] [Google Scholar]
- 11.Gleiser PM, Danon L. Community structure in jazz. Adv. Complex Syst. 2003;6(04):565–573. doi: 10.1142/S0219525903001067. [DOI] [Google Scholar]
- 12.Gregory S. A fast algorithm to find overlapping communities in networks. In: Daelemans W, Goethals B, Morik K, editors. Machine Learning and Knowledge Discovery in Databases. Heidelberg: Springer; 2008. pp. 408–423. [Google Scholar]
- 13.Gregory S. Finding overlapping communities in networks by label propagation. New J. Phys. 2010;12(10):103018. doi: 10.1088/1367-2630/12/10/103018. [DOI] [Google Scholar]
- 14.Hajiabadi M, Zare H, Bobarshad H. IEDC: an integrated approach for overlapping and non-overlapping community detection. Knowl.-Based Syst. 2017;123:188–199. doi: 10.1016/j.knosys.2017.02.018. [DOI] [Google Scholar]
- 15.Kardan V, et al. Tolerance methods in graph clustering: application to community detection in social networks. In: Nguyen H, Ha QT, Li T, Przybyła-Kasperek M, et al., editors. Rough Sets. Cham: Springer; 2018. pp. 73–87. [Google Scholar]
- 16.Knuth DE. The Stanford GraphBase: A Platform for Combinatorial Computing. Boston: Addison-Wesley Reading; 1993. [Google Scholar]
- 17.Krebs, V.: Books about us politics. http://networkdata.ics.uci.edu/data.php?d=polbooks
- 18.Kunegis, J.: KONECT - the Koblenz network collection. In: Proceedings of International Conference on World Wide Web Companion, pp. 1343–1350 (2013). http://userpages.uni-koblenz.de/~kunegis/paper/kunegis-koblenz-network-collection.pdf
- 19.Lancichinetti A, Fortunato S. Benchmarks for testing community detection algorithms on directed and weighted graphs with overlapping communities. Phys. Rev. E. 2009;80(1):016118. doi: 10.1103/PhysRevE.80.016118. [DOI] [PubMed] [Google Scholar]
- 20.Lancichinetti A, Radicchi F, Ramasco JJ, Fortunato S. Finding statistically significant communities in networks. PLoS One. 2011;6(4):e18961. doi: 10.1371/journal.pone.0018961. [DOI] [PMC free article] [PubMed] [Google Scholar]
- 21.Leskovec J, Kleinberg J, Faloutsos C. Graph evolution: densification and shrinking diameters. ACM Trans. Knowl. Discov. Data. 2007;1(1):1–40. doi: 10.1145/1217299.1217301. [DOI] [Google Scholar]
- 22.Li Y, He K, Kloster K, Bindel D, Hopcroft J. Local spectral clustering for overlapping community detection. ACM Trans. Knowl. Discov. Data (TKDD) 2018;12(2):17. [Google Scholar]
- 23.Lusseau, D., Newman, M.E.: Identifying the role that animals play in their social networks. Proc. R. Soc. London Ser. B: Biol. Sci. 271(suppl\_6), S477–S481 (2004) [DOI] [PMC free article] [PubMed]
- 24.Nicosia V, Mangioni G, Carchiolo V, Malgeri M. Extending the definition of modularity to directed graphs with overlapping communities. J. Stat. Mech: Theory Exp. 2009;2009(03):P03024. doi: 10.1088/1742-5468/2009/03/P03024. [DOI] [Google Scholar]
- 25.Nicosia, V., Mangioni, G., Malgeri, M., Carchiolo, V.: Extending modularity definition for directed graphs with overlapping communities. Technical report (2008)
- 26.Palla G, Derényi I, Farkas I, Vicsek T. Uncovering the overlapping community structure of complex networks in nature and society. Nature. 2005;435(7043):814. doi: 10.1038/nature03607. [DOI] [PubMed] [Google Scholar]
- 27.Raghavan UN, Albert R, Kumara S. Near linear time algorithm to detect community structures in large-scale networks. Phys. Rev. E. 2007;76(3):1–12. doi: 10.1103/PhysRevE.76.036106. [DOI] [PubMed] [Google Scholar]
- 28.Rossetti G, Milli L, Cazabet R. CDLIB: a Python library to extract, compare and evaluate communities from complex networks. Appl. Netw. Sci. 2019;4(1):52. doi: 10.1007/s41109-019-0165-9. [DOI] [Google Scholar]
- 29.Rossi, R.A., Ahmed, N.K.: The network data repository with interactive graph analytics and visualization. In: Proceedings of the Twenty-Ninth AAAI Conference on Artificial Intelligence (2015). http://networkrepository.com
- 30.Soundarajan S, Hopcroft JE. Use of local group information to identify communities in networks. ACM Trans. Knowl. Discov. Data (TKDD) 2015;9(3):21. [Google Scholar]
- 31.Watts DJ, Strogatz SH. Collective dynamics of ‘small-world’ networks. Nature. 1998;393(6684):440. doi: 10.1038/30918. [DOI] [PubMed] [Google Scholar]
- 32.Weeks MR, Clair S, Borgatti SP, Radda K, Schensul JJ. Social networks of drug users in high-risk sites: finding the connections. AIDS Behav. 2002;6(2):193–206. doi: 10.1023/A:1015457400897. [DOI] [Google Scholar]
- 33.Xie, J., Szymanski, B.K., Liu, X.: SLPA: uncovering overlapping communities in social networks via a speaker-listener interaction dynamic process. In: 2011 IEEE 11th International Conference on Data Mining Workshops, pp. 344–349. IEEE (2011)
- 34.Zachary WW. An information flow model for conflict and fission in small groups. J. Anthropol. Res. 1977;33(4):452–473. doi: 10.1086/jar.33.4.3629752. [DOI] [Google Scholar]