

Introduction:
Sepsis remains a significant source of morbidity and mortality in hospitalized patients across the United States.1–3 An aging population, increase in multi-drug resistant organisms, and growing number of patients receiving immune suppressive regimes has kept this devastating disease at the forefront of challenges facing our health care system. To help confront this health emergency, state and national agencies regularly update sepsis management guidelines.4,5 Compliance with these guidelines, however, can be a challenge for front-line providers who, in order to deliver timely and appropriate care, must be able to both identify patients with sepsis and recognize those at greatest risk of further clinical deterioration. In sepsis, timely diagnosis and accurate assessment of severity of illness is challenging for two reasons. First, host response to systemic infection is complex and non-linear, involving multiple inflammatory, metabolic, and end-organ interactions; this can make its clinical course unpredictable and subject to abrupt change.6 Second, the clinical markers currently relied upon to gauge severity of illness – including intermittent recordings of vital signs (e.g. blood pressure) and sepsis biomarkers (e.g. lactate) – are, when abnormal, signs that physiologic deterioration has already occurred.7
Development of novel analytic tools that improve identification and risk-stratification of patients with sepsis is needed. Variability analysis – the study and characterization of patterns in the normal variation of physiologic parameters over time – is one such tool that has made promising advances in the early detection of illness.8 Heart rate variability (HRV) in particular has demonstrated prognostic value in myocardial infarction, sepsis, trauma, and sleep apnea.9–15 In patients with sepsis, abnormal HRV signals have been shown to herald the onset of acute illness up to 24 hours before the appearance of more traditional clinical markers.16–18
This study evaluates the utility of several HRV measures in assessing severity of illness and predicting poor outcome in Emergency Department (ED) patients with confirmed or suspected sepsis. HRV measures evaluated include low frequency (LF) signal, high frequency (HF) signal, the ratio between these two bands (LF/HF), and, as the novel focus of this study, quantitative deviations in LF and HF signal from age-adjusted reference values in healthy men and women.
Methods:
This was a prospective, observational study. The hospital institutional review board (IRB) approved the study protocol and written consent. Between May 2016 and March 2017, subject to the availability of study investigators, a convenience sample of all adult ED patients with confirmed or suspected sepsis (identified according our institution’s ED triage sepsis screening tool) were considered for enrollment within 6 hours of arrival to the ED. Because HRV analysis is dependent on the presence of a normal sinus rhythm, exclusion criteria included cardiac arrhythmia, cardiac pacing, or known autonomic dysfunction. Evaluation and treatment of patients enrolled in the study remained entirely at the discretion of the ED attending physician.
Patient demographics and comorbidities were recorded. For assessment of clinical status, hemodynamic and metabolic parameters including blood pressure, respiratory rate, oxygen saturation, mental status, and laboratory results were recorded, and, using the worst clinical indicators obtained during the first 6 hours of hospital stay, used to define sepsis severity.4,5 Poor outcome, defined by need for vasopressors, intubation, ICU admission at any point during hospital stay, or death within 28-days, was recorded, as was hospital length of stay. Following hospital discharge, the medical record for each patient was reviewed to complete data collection. All patient information was stored in a secure REDCap database.19
For HRV calculations, continuous raw ECG raw data was sampled (ADInstruments PowerLab AD Converter and LabChart) at 400Hz and recorded in digital format within 6 hours of the patient’s arrival to the ED.20 Ten-minute recordings were obtained, and, at a later date, the cleanest (fewest ectopic beats) continuous 5-minute segment was selected for HRV analysis. If a 5-minute segment with fewer than 10% ectopic activity could not be identified, the sample was discarded and the patient excluded from the study.
A power spectrum density analysis was subsequently performed on all ECG recordings. Spectral bands identified included 0.00–0.04 Hz (very low frequency, VLF), 0.04–0.14 Hz (low frequency, LF) and 0.15–0.4 Hz (high frequency, HF).10 LF and HF signal were subsequently reported in “PowerNu,” or normalized (nu) units, indicating the relative contribution of each wavelength to the composite waveform.20 For each patient, LF signal, HF signal, and the ratio between the two bands (LF/HF) were assessed for correlation with severity of illness, composite poor outcome, and individual measures of poor outcome. These HRV measures were selected for analysis because they are the most commonly referenced in the existing emergency medicine literature dedicated to this subject. Following analysis of these traditional HRV measures, deviations in measured LF and HF signal from age-adjusted reference values in healthy men and women were calculated and assessed for correlation with the same endpoints.21 For the purpose of this study, this later measure was labeled ‘age-adjusted’ signal. To our knowledge, the use of an age-adjusted correction to LF and HF signal measures has not been previously reported on in the emergency medicine literature. Lastly, the influence of advancing age on LF and HF signal, LF/HF, and age-adjusted LF and HF signal was assessed, for both the study population as a whole and subcategorized by severity of illness as defined by sepsis subtype.
Data are presented as frequencies (with proportions) or means (with standard deviation). Comparisons between categorical factors, such as composite poor outcome and individual measures of poor outcome, and continuous measures of LF and HF signal, LF/HF, and age-adjusted LF and HF signal were made using chi-square tests, Welch’s t-tests, or Kruskal-Wallis tests, with Bonferroni corrections for multiple-comparisons as appropriate. Linear regression was used to assess the association between continuous covariates and LF and HF signal, LF/HF, and age-adjusted LF and HF signal with severity of illness. Results of linear regression models are reported as β coefficients with 95% confidence intervals. Data analysis was conducted using Stata, v14.0 (StataCorp, College Station, TX) and R 3.4.0 (R Core Team, Vienna, Austria). All p-values are two-tailed, with p < 0.05 considered statistically significant.
Results:
92 adult patients were enrolled; 72 had ECG recordings of sufficient quality for analysis (Table 1). The mean age for enrolled patients was 60.42 (± 20.34). Within the initial 6-hour evaluation period, 32 patients (44%) were categorized as having sepsis, 26 severe sepsis (36%), and 14 septic shock (19%). Comorbid conditions were present in 58.3% of patients. Patients with sepsis had less co-morbidity than those with severe sepsis or septic shock (50%, vs. 65.4% and 64.3% respectively); this finding, however, lacked statistical significance (p = 0.4). Twenty-one patients (29%) experienced a poor outcome. Seven patients (9.7%) died within 28 days. Patient age increased with sepsis severity (sepsis: 50.6± 18.3, severe sepsis: 67.7 ± 18.0, septic shock: 69.3 ± 20.3). Sepsis severity, in turn, correlated with composite poor outcome (sepsis: 6.3%, severe sepsis: 26.9%, septic shock: 85.7%) and hospital length of stay (sepsis: 6.7 ± 7.3, severe sepsis: 10.9 ± 13.2, septic shock: 18.5 ± 17.3).
Table 1:
Patient Demographics, HRV Measures, Poor Outcome (individual and composite), and Length of Stay by Sepsis Subtype (initial 6 hours)
| Overall (n=72) | Sepsis (n=32) | Severe Sepsis (n=26) | Septic Shock (n=14) | P value | |
|---|---|---|---|---|---|
| Age, mean ± SD | 60.42 ± 20.3 | 50.62 ± 18.3 | 67.70 ± 18.0 | 69.32 ± 20.3 | 0.001 |
| Race, n (%) | 0.01 | ||||
| White | 36 (50.0) | 13 (40.6) | 19 (73.1) | 4 (28.6) | |
| Hispanic | 11 (15.3) | 9 (28.1) | 1 (3.8) | 1 (7.1) | |
| Black | 7 (9.7) | 3 (9.4) | 3 (11.5) | 1 (7.1) | |
| Asian | 5 (6.9) | 3 (9.4) | 0 (0.0) | 2 (14.3) | |
| Other | 13 (18.1) | 4 (12.5) | 3 (11.5) | 6 (42.9) | |
| Sex, n (%) | 0.03 | ||||
| Male | 44 (61.1) | 17 (53.1) | 14 (53.8) | 13 (92.9) | |
| Female | 28 (38.9) | 15 (46.9) | 12 (46.2) | 1 (7.1) | |
| LF/HF ratio, mean ± SD | 3.51 ± 4.48 | 5.13 ± 5.69 | 2.40 ± 2.47 | 1.84 ± 2.96 | 0.02 |
| LF(nu), mean ± SD | 59.77 ± 26.82 | 70.68 ± 22.95 | 54.00 ± 28.41 | 45.54 ± 23.31 | 0.02 |
| HF(nu), mean ± SD | 37.77 ± 24.25 | 27.87 ± 19.42 | 44.63 ± 27.29 | 47.66 ± 20.98 | 0.01 |
| Age-adjusted LF, mean ± SD | −13.47 ± 29.54 | 0.41 ± 24.53 | −21.43 ± 30.09 | −30.39 ± 26.09 | 0.005 |
| Age-adjusted HF, mean ± SD | 11.00 ± 27.09 | −1.86 ± 21.09 | 20.07 ± 29.03 | 23.6 ± 24.17 | 0.004 |
| Significant comorbid condition, n (%)† | 42 (58.3) | 16 (50.0) | 17 (65.4) | 9 (64.3) | 0.4 |
| Vasopressor use, mean ± SD | 12 (16.7) | 0 (0.0) | 3 (11.5) | 9 (64.3) | < 0.001 |
| ICU during hospital stay, n (%) | 18 (25) | 2 (6.2) | 7 (26.9) | 9 (64.3) | < 0.001 |
| Intubation, n (%)‡ | 10 (13.9) | 0 (0.0) | 3 (11.5) | 7 (50.0) | < 0.001 |
| 28-day mortality, n (%) | 7 (9.7) | 0 (0.0) | 1 (3.8) | 6 (42.9) | <0.001 |
| Composite poor outcome, n (%)§ | 21 (29.2) | 2 (6.3) | 7 (26.9) | 12 (85.7) | <0.001 |
| Hospital length of stay, mean ± SD | 10.5 ± 12.6 | 6.7 ± 7.3 | 10.9 ± 13.2 | 18.5 ± 17.3 | 0.009 |
Significant comorbid condition defined as HIV/AIDS, cirrhosis, liver failure, immune suppression within last 6 months, leukemia/myeloma, non-Hodgkin’s lymphoma, solid tumor with metastasis, or other chronic organ failure (e.g., CHF)
Intubation at any point during hospital stay.
Poor outcome defined as use of vasopressors, intubation, ICU stay at any point during hospital course, or death within 28 days.
LF and HF signal correlated with severity of illness and poor outcome. Severity of illness as defined by sepsis subtype correlated with decreased LF signal (sepsis: 70.68 ± 22.95, severe sepsis: 54.00 ± 28.41, septic shock: 45.54 ± 23.31, Table 1, p = 0.02) and increased HF signal (sepsis: 27.87 ± 19.42, severe sepsis: 44.63 ± 27.29, septic shock: 47.66 ± 20.98, Table 1, p = 0.01). Composite poor outcome correlated with decreased LF signal (Figure 1a, p = 0.008) and increased HF signal (Figure 1b, p = 0.03). For individual measures of poor outcome, significance was lost for all correlations (Figures 2a, 2d, 3a–d) except LF signal and vasopressor use (Figure 2b, p = 0.03) and LF signal and ICU stay (Figure 2c, p = 0.03). LF/HF correlated with severity of illness (sepsis: 5.13 ± 5.69, severe sepsis: 2.40 ± 2.47, septic shock: 1.84 ± 2.96, Table 1, p = 0.02), but not with poor outcome (Figure 1c, p = 0.09). Advancing age correlated with decreased LF (β −0.46; 95% CI −0.76, −0.17, p = 0.003), increased HF (β 0.43; 95% CI 0.16, 0.69, p = 0.002), and decreased LF/HF (β −0.06; 95% CI −0.11, −0.005, p = 0.03). Correlations (LF, HF, and LF/HF) with advancing age lost significance when patients were subcategorized by sepsis subtype.
Figure 1, 2, & 3:


Boxplot: The boxplot compactly displays the distribution of a continuous variable. It graphs five summary statistics (the median, two hinges and two whiskers), and all “outlying” points individually. The band inside the box represents the second quartile (the median). The lower and upper hinges correspond to the first and third quartiles (the 25th and 75th percentiles). The upper whisker extends from the hinge to the largest value no further than 1.5 * IQR from the hinge (where IQR is the inter-quartile range, or distance between the first and third quartiles). The lower whisker extends from the hinge to the smallest value at most 1.5 * IQR of the hinge. Data beyond the end of the whiskers are “outlying” points plotted individually.
Age-adjusted LF and HF signal similarly correlated with severity of illness and poor outcome (Table 1). Severity of illness as defined by sepsis subtype correlated with increasingly negative deviations in LF signal (sepsis: 0.41 ± 24.53, severe sepsis: −21.43 ± 30.09, septic shock −30.39 ± 26.09, Table 1, p = 0.005) and increasingly positive deviations in HF signal (sepsis: −1.86 ± 21.09, severe sepsis: 20.07 ± 29.03, septic shock: 23.6 ± 24.17, Table 1, p = 0.004) from age-adjusted reference values. Large negative deviations in LF (Figure 1d, p = 0.004) and large positive deviations in HF (Figure 1e, p = 0.02) correlated with composite poor outcome. For individual measures of poor outcome, significance was retained for correlations between age-adjusted LF and vasopressor use (Figure 2f, p = 0.02), ICU stay (Figure 2g, p = 0.01), and need for intubation (Figure 2h, p = 0.03), but lost for death at 28 days (Figure 2e). For age-adjusted HF, significance was retained for correlations with vasopressor use (Figure 3f, p = 0.04) and ICU stay (Figure 3g, p = 0.05), but lost for death at 28 days and intubation (Figures 3e, 3h). Advancing age correlated with increasingly negative LF deviations (β −0.76; 95% CI −1.06, - 0.47; p < 0.001) and increasingly positive HF deviations (β 0.73; 95% CI 0.47, 0.99; p < 0.001). Correlations between age-adjusted LF and HF signal and advancing age retained significance when patients were subcategorized by sepsis subtype. For age-adjusted LF, in sepsis (β - 0.52; 95% CI −0.98, −0.06, p = 0.03), severe sepsis (β - 0.66; 95% CI −1.31, −0.01, p = 0.05), and septic shock (β - 0.70; 95% CI −1.38, −0.02, p = 0.04) (Figure 4a); for age-adjusted HF, in sepsis (β 0.49; 95% CI 0.01, 0.87, p = 0.02), severe sepsis (β 0.65; 95% CI 0.03, 1.28, p = 0.04), and septic shock (β 0.73; 95% CI 0.14, 1.32, p = 0.02) (Figure 4b).
Figure 4: Age-adjusted LF and HF signal vs. Age and Sepsis Subtype.
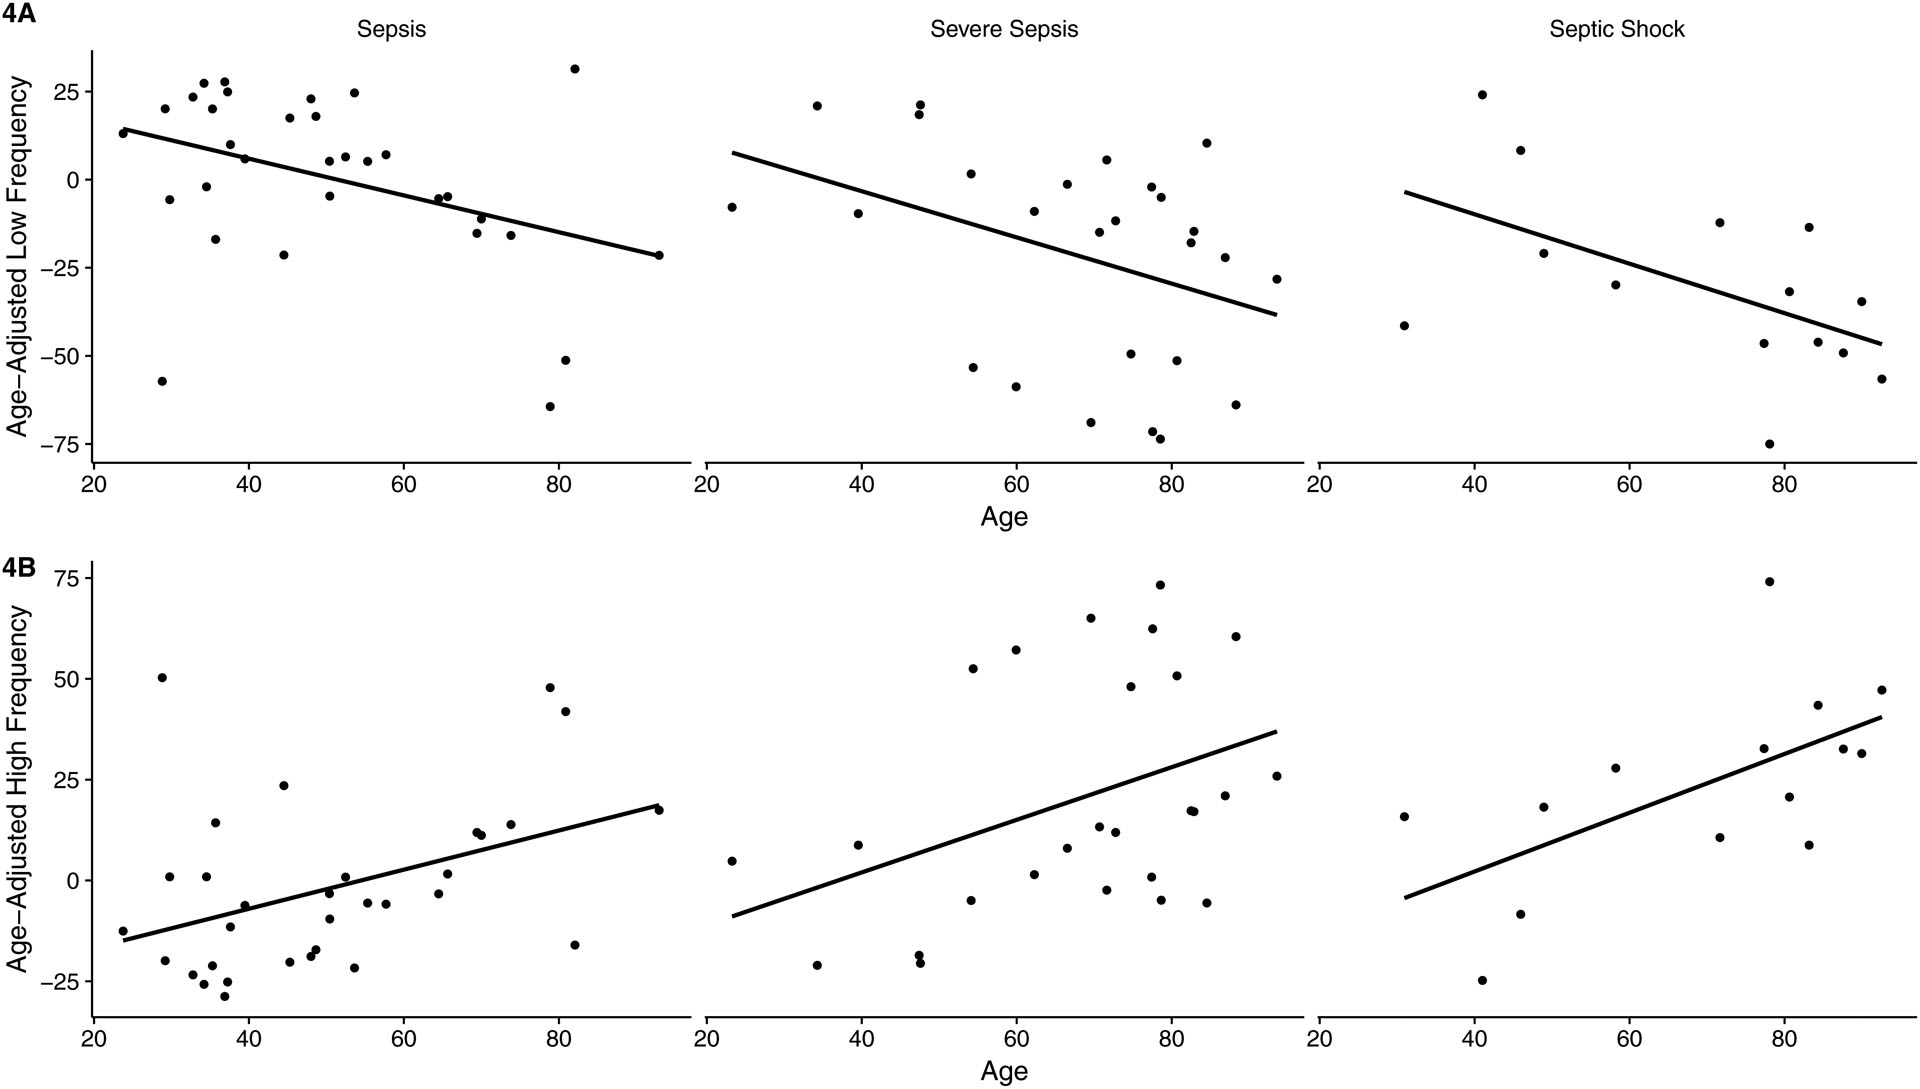
4A: Age-adjusted LF: Sepsis (β - 0.52; 95% CI −0.98, −0.06, p = 0.03), severe sepsis (β - 0.66; 95% CI −1.31, −0.01, p = 0.05), septic shock (β - 0.70; 95% CI −1.38, −0.02, p = 0.04)
4B: Age-adjusted HF: Sepsis (β 0.49; 95% CI 0.01, 0.87, p = 0.02), severe sepsis (β 0.65; 95% CI 0.03, 1.28, p = 0.04), and septic shock (β 0.73; 95% CI 0.14, 1.32, p = 0.02)
Discussion:
Numerous techniques exist to quantify HRV signals. The simplest being the time interval between successive peaks of an electrocardiograph (ECG) tracing, or R-R interval. Recently, HRV research has focused on frequency-domain analysis. According to Fourier theory, any time series – such as an ECG’s R-R interval – represents the sum of sinusoidal oscillations with distinct frequencies. A power spectrum density analysis of any ECG tracing will demonstrate a range of both LF and HF signal. Across this range of frequencies, specific bandwidths are believed to correlate with autonomic nervous system (ANS) regulation of sympathetic (LF) and parasympathetic (HF) activity.10 In the setting of acute infection, increases in LF signal are therefore considered appropriate, and reflect efforts to maintain physiologic homeostasis (e.g. normal blood pressure). Increases in HF signal are also anticipated, and are believed to represent, in part, ANS efforts to counterbalance infection-related endotoxin-mediated inflammation.18, 22 For this reason, these measures have been proposed as a means of assessing severity of illness (HF), capacity to respond a systemic stressor (LF), and, with the ratio of the two bands, sympathovagal balance (LF/HF).23
A limited number of studies have investigated the utility of HRV measures in ED patients with sepsis.23–26 Results of these studies – all of which have relied on qualitative assessment of LF and HF signal – support the hypothesis that patients who clinically deteriorate or experience poor outcome demonstrate decreased sympathetic (LF) activity (response to a stressor), increased parasympathetic (HF) activity (severity of illness), and decreased ‘sympathovagal’ balance (LF/HF). In a 2002 study of 15 ED patients with sepsis, ‘weak’ LF signal correlated with higher APACHE II and SOFA scores, while ‘low’ LF/HF identified patients at risk of developing shock, organ failure, or death.23 A 2007 study of 81 ED patients with sepsis reported decreased LF and LF/HF values in those who progressed to septic shock,24 and a 2010 study of 34 patients with acute stroke demonstrated decreased LF, increased HF, and decreased LF/HF to be early signs of sub-acute post-stroke infection.25 More recently, a single LF/HF was calculated for 466 ED patients as a means of identifying patients who would go on to require critical care interventions or die within 72 hours. Thirty-two patients (7%) met study endpoints; the sensitivity of a single point estimate of LF/HF was, however, only 34%.26
Building on existing research, this study considered – in addition to traditional LF and HF signal measures – the value of age-adjusted LF and HF signal in predicting severity of illness and poor outcome in ED patients with confirmed or suspected sepsis. The rationale for the use of age-adjusted LF and HF signal is research on the autonomic regulation of the heart in healthy subjects, which has demonstrated advancing age to correlate with higher resting sympathetic (LF) and lower resting parasympathetic (HF) tone.21, 27 Age-related increases in resting sympathetic tone are believed to result from elevated circulating catecholamine concentrations produced in response to decreased receptor activity. Age-related decreases in parasympathetic tone are believed to result from down-regulation of vagal receptors without an accompanying elevation in circulating parasympathetic mediators. These findings suggest that purely qualitative assessments of LF and HF signal (i.e. ‘increased’ or ‘decreased’ relative to other subjects), or the ratio of these two bands (LF/HF), has the potential to underestimate severity of illness and likelihood of poor outcome in the elderly. Specifically, higher resting LF and lower resting HF signal in the elderly could make a comparatively ‘decreased’ LF signal (response to a stressor), ‘increased’ HF signal (severity of illness), or the ratio of these two bands (LF/HF), appear clinically less significant. Age-adjusted signals would, in theory, compensate for this physiologic difference.
In this study, LF and HF signal, LF/HF, and age-adjusted LF and HF signal all correlated with severity of illness, poor outcome (except LF/HF), and advancing age. Age-adjusted LF and HF signal correlated with individual measures of poor outcome with greater consistency than LF or HF signal, or LF/HF (Figures 2, 3). As patients advanced in age – despite baseline (healthy) higher resting sympathetic (LF) and lower resting parasympathetic (HF) signal – the capacity to respond to a stressor (LF) and to contain systemic infection (HF) weakened compared to younger counterparts. This disadvantage appeared to become more pronounced in the setting of more severe disease. Demonstration of this finding, however, required the use of age-adjusted LF and HF signal (Figures 4a, 4b).
A comparison of two study patients – an 83 year-old female and a 35-year-old male – illustrates the value of age-adjusted measures. For these 2 patients, nearly identical LF (65.36 vs. 63.36) and HF (37.03 vs. 35.53) signals were recorded, producing a LF/HF of 1.77 and 1.78 respectively. Age-adjusted LF signal for the 83 and 35 year-old patient, however, were −14.7 and −2.0 respectively, and, for HF signal, 17.1 and 0.9 respectively; both sets of values suggestive of greater severity of illness (Table 1) and likelihood of poor outcome (Figures 1d, 1e) in the elderly patient.
This study has several limitations. It was underpowered to assess the impact chronic illness (comorbidity) on likelihood of clinical deterioration or poor outcome. Adding this layer of predictive modeling would enhance the utility of these HRV measures in the ED setting. HRV measures are influenced by body position, respiratory rate, and use of beta- and calcium-channel blockers. Future work should control for these factors. The impact of administration of exogenous catecholamine infusions (i.e. vasopressors) on HRV signal is poorly understood and was not assessed. Enrollment was dependent on the availability of study investigators. Subjects included may be systematically different from those not included. Finally, this study was conducted at a large, urban, academic medical center and may not be generalizable to all settings.
Conclusions:
In this study, both age-adjusted and non-age-adjusted HRV measures correlated with severity of illness and poor outcome. Use of age-adjusted measures resulted in more consistent reporting of individual measures of poor outcome and better tracked the deleterious influence of advancing age on the ability to contend with systemic infection. These findings suggest that accounting for the influence of age on resting sympathetic (LF) and parasympathetic (HF) signal may improve the predictive value of HRV measures in ED patients with sepsis.
Financial Support:
This research was made possible by a Weill Cornell Clinical & Translational Science Center (CTSC) Pilot Award administered by the NIH Center for Advancing Translational Sciences (NCATS #UL1TR002384)) and by an NIH Loan Repayment Award.
Footnotes
Publisher's Disclaimer: This is a PDF file of an unedited manuscript that has been accepted for publication. As a service to our customers we are providing this early version of the manuscript. The manuscript will undergo copyediting, typesetting, and review of the resulting proof before it is published in its final form. Please note that during the production process errors may be discovered which could affect the content, and all legal disclaimers that apply to the journal pertain.
Conflict of Interest Disclosure: JEA reports no conflict of interest. JKL reports no conflict of interest. WJHF reports no conflict of interest. SC reports no conflict of interest. EF reports no conflict of interest. EJS reports no conflict of interest. RS reports no conflict of interest. PMH reports the following: 1.) Co-founder RVMetrics, LLC; 2) Sponsored research for Caretaker Medical.
Presentations: None
References
- 1.Dombrovskiy VY, Martin AA, Sunderram J, Paz HL. Rapid increase in hospitalization and mortality rates for severe sepsis in the United States: A trend analysis from 1993 to 2003. Crit Care Med. 2007;35(5):1244–50. [DOI] [PubMed] [Google Scholar]
- 2.Angus DC, Linde-Zwirble WT, Lidicker J, et al. Epidemiology of severe sepsis in the United States: analysis of incidence, outcome, and associated costs of care. Crit Care Med 2001;29(7):1303–1310. [DOI] [PubMed] [Google Scholar]
- 3.Xu J, Kochanek KD, Murphy SL, Tejada-Vera B. Deaths: final data for 2014. Natl Vital Stat Rep 2016;65(5):1–96. [PubMed] [Google Scholar]
- 4.Dellinger RP, Levy MM, Rhodes A, et al. Surviving Sepsis campaign: international guidelines for mangagement of severe sepsis and septic shock: 2012. Cit Care Med 2013;41(2):580–657. [DOI] [PubMed] [Google Scholar]
- 5.Rhodes A, Evans LE, Alhazzani W, et al. Surviving Sepsis Campaign: International Guidelines for Management of Severe Sepsis and Septic Shock: 2016. Intensive Care Med. 2017;43(3):304–377. [DOI] [PubMed] [Google Scholar]
- 6.Seely AJ, Cristou NV. Multiple organ dysfunction syndrome: exploring the paradigm of complex nonlinear systems. Crit Care Med 2000;28(7):2193–2200. [DOI] [PubMed] [Google Scholar]
- 7.Kumar A, et al. Duration of hypotension before initiation of effective antimicrobial therapy is the critical determinant of survival in human septic shock. Crit Care Med 2006; 34:1589. [DOI] [PubMed] [Google Scholar]
- 8.Billman GE. Heart rate variability – A historical persspective. Frontiers in Physiology 2011; 2(86):1–13. [DOI] [PMC free article] [PubMed] [Google Scholar]
- 9.Task Force of the European Society of Cardiology and the North American Soiety of Pacing and Elecrophysiology. Heart Rate Variability. European Heart Journal (1996)1,345–281. [PubMed] [Google Scholar]
- 10.Clifford GD. Signal Processing Methods for Heart Rate Variability. St. Cross College, Department of Engineering Science, University of Oxford, 2002. [Google Scholar]
- 11.Buchan CA, Bravi A, Seely AJE. Variability Analysis and the Diagnosis, Management, and Treatment of Sepsis. Current Infectious Disease Reports 2012;14(5):512–21. [DOI] [PubMed] [Google Scholar]
- 12.Ahmad S, Tejuja A, Newman K, et al. Clinical Review: A review and analysis of heart rate variability and the diagnosis and prognosis of infection. Critical Care 2009;13:232. [DOI] [PMC free article] [PubMed] [Google Scholar]
- 13.Bravi A, Green G, Longtin A, Seely A. Monitoring and identification of sepsis developementn through a composit measure of heart rate variability. PLoS ONE 2012;7(9):e45666. [DOI] [PMC free article] [PubMed] [Google Scholar]
- 14.Norris P, Ozdas A, Cao H, et al. Cardiac uncoupling and heart rate variability stratify ICU patients by mortality: A study of 2088 trauma patients. Annals of Surgery 2006;243(6)L804–814. [DOI] [PMC free article] [PubMed] [Google Scholar]
- 15.Winchell RJ, Hoyt DB. Spectral analysis of heart rate variability in the ICU: A mearure of autonomic function. Journal of Surgical Research 1996;63:11–16. [DOI] [PubMed] [Google Scholar]
- 16.Pontet J, Contreras P, Curbelo A, et al. Heart rate variability as early marker of multiple organ dysfunction syndrome in septic patients. Journal of Critical Care 2003;18(3):156–163. [DOI] [PubMed] [Google Scholar]
- 17.Ahmad S, Ramsay T, Huebsch L, Flanagan S, McDiarmid S, Batkin I, et al. Continuous Multi-Parameter Heart Rate Variability Analysis Heralds Onset of Sepsis in Adults. Rapallo F, editor. PLoS ONE 2009;4(8):e6642. [DOI] [PMC free article] [PubMed] [Google Scholar]
- 18.Papaioannou V, Pneumatikos I, Maglavernas N. Association of heart rate variability and inflammatory response in patients with cardiovascular diseases: current strengths and limitations. Fronteirs in Physiology 2013;4:174. [DOI] [PMC free article] [PubMed] [Google Scholar]
- 19.Harris PA, Taylor R, Thielke R, et al. Research electronic data capture (REDCap) – a metadata-driven methodology and workflow process for providing translational research informatics support. J Biomed Inform. 2009;42(2):377–381. [DOI] [PMC free article] [PubMed] [Google Scholar]
- 20.AD Instruments, 2205 Executive Circle, Colorado Springs CO, USA [Google Scholar]
- 21.Sammito S, Bockelmann I. Reference values for time- and frequency-domain heart rate variablity measures. Heart Rhythm, Vol 13, No 6, June 2016. [DOI] [PubMed] [Google Scholar]
- 22.Tacey K. The Inflammatory Revlex. Nature Vol 420, 19/26 December 2000 [Google Scholar]
- 23.Barnaby D, Ferrick K, Kaplan D, et al. Heart rate variability in emergency department patients with sepsis. Acad Emerg Med 2002;9(7):661–670. [DOI] [PubMed] [Google Scholar]
- 24.Chen W-L, Kuo CD. Characteristics of heart rate variability can predict impending septic shock in emergency department patients with sepsis. Acad Emerg Med 2007;14(5): 392–397. [DOI] [PubMed] [Google Scholar]
- 25.Gunther A, Alszmann I, Nowack S, et al. Heart rate variability – a potential early marker of sub-acute post-stroke infections. Acta Neurol Scan 2010. September;126(3):189–96. [DOI] [PubMed] [Google Scholar]
- 26.Barnaby DP, Fernando SM, Ferrick KJ, Herry CJ, Seely AJE, Bijur PE, Gallagher EJ Use of the low-frequency/high-frequency ratio of heart rate variability to Predict short term deterioration in emergency department patients with Sepsis. Emerg Med J. 2018. February;35(2):96–102. [DOI] [PubMed] [Google Scholar]
- 27.Abhishekh HA, Nisarga P, Kisan R, et al. Influence of age and gender on autonomic regulation of heart. J clin Monit Comput 2013;27:259–264. [DOI] [PubMed] [Google Scholar]