

Abstract
Multiple myeloma is a systemic malignancy of monoclonal plasma cells that accounts for 10% of hematologic cancers. With development of highly effective therapies for multiple myeloma, minimal residual disease (MRD) assessment has emerged as an important end point for management decisions. Currently, serologic assays lack the sensitivity for MRD assessment, and invasive bone marrow sampling with flow cytometry or molecular methods has emerged as the gold standard. We report a sensitive and robust targeted mass spectrometry proteomics method to detect MRD in serum, without the need of invasive, sequential bone marrow aspirates. The method detects Ig-derived clonotypic tryptic peptides predicted by sequencing the clonal plasma cell Ig genes. A heavy isotope-labeled Ig internal standard is added to patient serum at a known concentration, the Ig is enriched in a light chain type specific manner, and proteins are digested and analyzed by targeted mass spectrometry. Peptides from the constant regions of the λ or κ light chains, Ig heavy chains, and clonotypic peptides unique to the patient monoclonal Igs are targeted. This technique is highly sensitive and specific for the patient-specific monoclonal Igs, even in samples negative by multiparametric flow cytometry. Our method can accurately and precisely detect monoclonal protein in serum of patients treated for myeloma and has broad implications for management of hematologic patients.
Multiple myeloma (MM) is a systemic plasma cell malignancy characterized by neoplastic monoclonal plasma cell infiltrates in the bone marrow. The disease accounts for 1.7% of all cases of cancer and 10% of all hematologic malignancies and is the second most prevalent hematologic malignancy in the United States.1 The neoplastic plasma cells produce a monoclonal Ig, or M-protein, which has long been used as a biomarker in serum or urine.2,3 This biomarker is extensively used for diagnosis and monitoring of MM by a variety of techniques, including protein electrophoresis (serum protein electrophoresis or urine protein electrophoresis), immunofixation, or free light chain assays.4 However, with the development of new therapeutic strategies that achieve deeper and sustained responses, their utility and effectiveness in disease monitoring has diminished.5 Consequently, monitoring of minimal residual disease (MRD) has emerged as an important clinical end point to assess response to therapy and to predict long-term clinical outcome.6
Current methods for detection and diagnosis of MRD include immunohistochemistry, flow cytometry, quantitative PCR, and next-generation sequencing. These methods have high sensitivity for detection of MRD, ranging from one MM cell per 103 to 106 bone marrow cells.7 However, these methods depend on invasive bone marrow aspirates. Highly sensitive, specific, and noninvasive methods for detection of low-level M-protein after treatment are not currently available in the clinical setting.
Efforts have been made to use mass spectrometry (MS)–based proteomics for monitoring the circulating M-protein in the serum as a surrogate marker for the presence of neoplastic plasma cells. This has been done on intact, reduced, and digested M-protein. For example, κ and λ light chain–specific enrichment was used upstream of matrix-assisted laser desorption/ionization MS for measurement of the intact Ig heavy and light chains, enabling the calculation of heavy/light chain ratio in both serum and urine with a limit of detection of 20 mg/dL.8 Another method using Melon gel (Thermo Fisher Scientific, Waltham, MA) for the removal of non-IgG proteins from serum, followed by dissociation of the heavy and light chains, isolation of the unique M-protein light chain, and monitoring with liquid chromatography–MS (LC-MS) resulted in a limit of detection down to 0.5 mg/dL.9 Bergen et al10 enriched for the Ig fraction of serum in a κ or λ light chain–specific manner, separated the light chains from the heavy chains by SDS-PAGE, digested the light chains, and detected the patient-specific variable region peptides via LC-MS with a limit of detection of 0.1 mg/dL. Remily-Wood et al11 monitored serum levels of Igs without enrichment with multiple reaction monitoring. However, this procedure had a high level of interassay variability. Recently, Zajec et al12 combined Melon gel purification with protein digestion and targeted peptide mass spectrometry to achieve an increased sensitivity (0.01 to 0.03 mg/dL) and reproducibility for detection of M-protein in serum. This method depended on the synthesis of unique heavy isotope-labeled peptides for each patient assay.
Herein, we describe a specific and sensitive method for detection of residual M-protein in patients treated for multiple myeloma. Our method combines immunoaffinity capture of Igs in serum and mass spectrometry–based methods targeting mutated peptides, derived from Ig variable regions, specific to each patient, as determined by rapid amplification of cDNA ends PCR (Figure 1). The use of a heavy-labeled internal standard allows for normalization across samples, enabling relative quantification and estimate of the depth of response. The overall efficiency of the method is highly reproducible, and there is no measurable interference from therapeutic antibodies, even at high concentrations. This method has broad implications for the management of therapy in patients with monoclonal gammopathies.
Figure 1.

Experimental workflow. An aliquot of the bone marrow aspirate collected as part of multiple myeloma diagnosis protocols is used to determine the M-protein variable regions by rapid amplification of cDNA ends (RACE) PCR and Sanger sequencing. These sequences are used to identify theoretical unique clonotypic tryptic peptides to target in the PRM experiments. Peripheral blood drawn at diagnosis is used to determine which of the theoretical peptides from the M-protein are detectable and then evaluate the peptides to select the best candidates for M-protein targeting. Ig is enriched from serum using light chain (LC)–specific enrichment for κ or λ light chains following the addition of a standardized concentration of the heavy isotope-labeled Ig. After treatment, the patient can be monitored by detection of these peptides in the peripheral blood, without the need for further bone marrow aspirates. HC, heavy chain.
Materials and Methods
Enrichment for Ig Fraction of Serum Using κ or λ Immune Capture
To increase the sensitivity of detection of clonotypic Ig protein sequences and to reduce background serum protein contamination, enrichment for Ig fraction of serum was performed. Ig κ or λ fractions were enriched from serum using the Capture Select Kappa-XL Affinity Matrix or Lambda resins (Thermo Fisher Scientific), respectively, in a Spin-X Costar centrifuge tube filter, with a 45 μm pore size (Corning, St. Louis, MO). Briefly, 5 μL of spiked-in serum was added to 200 μL of phosphate-buffered saline (pH 7.2 to 7.4) in a spin filter with 50 μL of prewashed resin slurry 50% (three times with 400 μL phosphate-buffered saline, centrifuging at 847 × g for 1 minute). The spin filter was rotated end over end for 1 hour at room temperature. The resin was washed with 400 μL of phosphate-buffered saline, pH 7.4, and centrifuged at 847 × g for 1 minute. This procedure was repeated for a total of three washes, and the Igs were eluted with 200 μL of glycine, 100 mmol/L, pH 2.8, into a clean tube containing 20 μL of Tris, 1 mol/L, pH 8.0.
All samples were reduced with 5 mmol/L Tris(2-carboxyethyl)phosphine hydrochloride (Thermo Scientific, Rockford, IL), for 15 minutes at 95°C in a thermomixer (Eppendorf, Hauppauge, NY), at 450 rpm, cooled to room temperature, alkylated with 10 mmol/L iodoacetamide (Millipore-Sigma, St. Louis, MO), for 15 minutes in the dark, and digested by addition of 1 μg of trypsin (Promega, Madison, WI) overnight at 37°C, at 450 rpm in a thermomixer. An additional aliquot of 0.5 μg of trypsin was added and incubated for 3 hours under the same conditions. Samples were acidified, and the tryptic peptides were desalted using a C18 micro-spin column (Harvard Apparatus, Holliston, MA), eluted in 70% acetonitrile in 0.1% trifluoroacetic acid, and lyophilized in a SpeedVac concentrator (Thermo Fisher Scientific).
Determination of the Sensitivity of the Method before and after Enrichment
To compare the sensitivity of Ig fraction enrichment with the analysis of whole serum, stable isotopically labeled SILuMAb κ (MSQC7; Millipore-Sigma) or λ (MSQC3; Millipore-Sigma) Igs were diluted in human healthy pooled serum (HPS; Fisher Scientific, Waltham, MA) at levels of 0.01, 0.1, 1, and 10 mg/dL. Samples were prepared as described above in triplicate for both SILuMAb κ and λ with enrichment or without any enrichment. Nonenriched samples were prepared in triplicate by diluting 5 μL of each dilution point to 220 μL total volume with 50 mmol/L Tris-HCl, pH 7.0, before reduction, alkylation, and digestion. All other steps were identical to the preparation of the enriched samples.
Mass Spectrometry
Samples were resuspended in 1% acetonitrile in 0.1% trifluoroacetic acid. Enriched samples were reconstituted in 17.5 μL, and 0.5 μL was injected for analysis. Nonenriched samples were reconstituted in 350 μL, and 1 μL was injected. The 6 × 5 peptide mix (Promega) was added to the samples for monitoring of retention time, mass accuracy, and instrument sensitivity at a total of 100 fmol per injection. The stable isotope labeled IgA peptide (WLQGSQELPR) was spiked into all MM patient samples at a total of 10 fmol per injection.
Aliquots were loaded onto an Acclaim PepMap trap column (2 cm × 100 μm) in line with an EASY-Spray analytical column (25 cm × 75 μm inner diameter PepMap C18; 2 μm bead size) using the auto sampler of a Dionex Ultimate 3000 nano LC system (Thermo Fisher Scientific). Solvent A consisted of 2% acetonitrile in 0.1% formic acid, and solvent B consisted of 80% acetonitrile in 0.08% formic acid. Peptides were gradient eluted into a Q Exactive Plus (Thermo Fisher Scientific) mass spectrometer at 300 nL/minute using the following gradient: 2% to 27% solvent B in 75 minutes, 27% to 40.5% in 15 minutes, followed by 40.5% to 100% in 2 minutes.
For data-dependent acquisition (DDA), high-resolution full MS spectra were acquired with a resolution of 70,000, an automatic gain control target of 1 × 10⁶, with a maximum ion time of 50 minutes, and scan range of 300 to 1400 m/z. Following each full MS scan, 10 higher-energy collisional dissociation MS/MS spectra were acquired with resolution of 17,500, automatic gain control target of 1 × 10⁵, maximum ion time of 100 minutes, 1.5 m/z isolation window, fixed first mass of 100 m/z, normalized collision energy of 25, and dynamic exclusion of 20 seconds. Lock mass was set for best with masses 445.1200 and 371.1012 m/z.
For the parallel reaction monitoring (PRM) experiments, high-resolution full MS spectra were acquired with a resolution of 70,000, an automatic gain control target of 1 × 10⁶, with a maximum ion time of 50 minutes, and scan range of 300 to 1500 m/z. Following each full MS scan, 10 PRM scans were acquired with a resolution of 17,500, automatic gain control target of 1 × 10⁵, maximum ion time of 120 minutes, 1.5 m/z isolation window, fixed first mass of 150 m/z, and normalized collision energy of 27. Lock mass feature was set for best with masses 445.1200 and 371.1012 m/z. The inclusion list contained peptides from the constant region of heavy chain from IgG and IgA, light chains κ and λ, including the heavy isotope counterparts when appropriate, and the unique clonotypic peptides of the SILuMAb antibodies (Supplemental Tables S1 and S2).
Mass Spectrometry Data Analysis
DDA raw files were searched against a Uniprot human database with the addition of the SILuMAb sequences using Byonic version 2.14.27 (Protein Metrics, Cupertino, CA) within Proteome Discoverer version 2.1 (Thermo Fisher Scientific) using the following settings: trypsin digestion, maximum of two missed cleavages, precursor mass tolerance of 10 ppm, fragment mass tolerance of 20 ppm, and a maximum of two common modifications and two rare modifications. Carbamidomethylation of cysteines was a static modification. Dynamic modifications included oxidation of methionine as common maximum of two, label 13C(6)15N(2) on lysine and label 13C(6)15N(4) on arginine (both as common maximum of three per peptide), and deamidation of asparagine and glutamine rare maximum of two. The search results were filtered to remove any peptide spectral matches with a Byonic score of <300, and these results were uploaded to Skyline version 4.1.11796 to build a spectral library.13 PRM raw files were uploaded to Skyline, and peptides were quantified using the fragment ion area of the three most intense y-ions based on the reference spectrum available in the spectral library. The total fragment ion area values were exported, and triplicate values were plotted verses the concentration of heavy isotope-labeled Ig added to the healthy pooled serum.
Determination of Efficiency of Enrichment, Recovery, and Matrix Effect after Enrichment
To determine the overall performance of the enrichment method, three protocols were compared (Supplemental Figure S1): i) light- (MSQC4) and heavy-labeled (MSQC3) λ SILuMAb antibodies were mixed in equal amounts (20 mg/dL) and digested without enrichment; ii) light λ SILuMAb was added to HPS depleted of endogenous λ Ig at 20 mg/dL, enriched for λ light chain Ig, and heavy isotope labeled SILuMAb was added to the Ig-enriched fraction at a final concentration of 20 mg/dL; and iii) HPS depleted of λ antibodies was enriched for λ light chain Ig, and then both light and heavy isotope-labeled SILuMAb Igs were added to the Ig-enriched fraction at a final concentration of 20 mg/dL. The same protocol was performed with both a 1-hour and an overnight Capture Select Affinity Matrix incubation. All samples were then reduced, alkylated, digested, and desalted, as described above.
Collection of Patient Samples
All the human samples were collected in accordance with the protocols approved by Memorial Sloan Kettering Cancer Center Institutional Review Board and the guiding principles for experimental procedures found in the Declaration of Helsinki of the World Medical Association. Serum was collected from six patients with multiple myeloma at the time of diagnosis and after treatment. Diagnostic bone marrow aspirate samples were also obtained from the same patients for mRNA sequencing. Supplemental Table S3 shows the characteristics of the samples, and Figure 2 outlines the time lines for each patient from diagnosis to the most recent available clinical information on disease status.
Figure 2.

Time line of patient (Pat.) sampling. Each line starts with the date of diagnosis, then the first blood collection (in orange), the start of treatment (in red), the end of treatment (in green), the time at which the post-treatment sample was collected, and the corresponding minimal residual disease (MRD) status, as determined by multiparameter flow cytometry (MFC), indicated by a + for positive and − for negative. The blue pin indicates the time of the last patient visit in which the patient’s disease status was the same as when the post-treatment serum sample was collected.
mRNA Sequencing to Identify Clonotypic IGL-V and IGH-V
To establish the clonotypic Ig protein sequences, Ig light chain variable region (IGL-V) and Ig heavy chain variable region (IGH-V) mRNA were sequenced. Patient mRNA was extracted from 500,000 bone marrow cells collected at the time of diagnosis (>10% of abnormal plasma cells), using the Qiagen RNeasy micro kit (Qiagen, Hilden, Germany). Synthesis of cDNA first strand and 5′ PCR was performed with the SMARTer RACE 5′/3′ Kit (Clontech Lab, Mount View, CA), according to the clonally expanded Ig (κ or λ), then 200 ng of DNA was sequenced with 10 pmol of primer in a total volume of 11 μL using Sanger method at Memorial Sloan Kettering Cancer Center Integrated Genomics Operation. Two primers were used for each light chain for 5′ and 3′ ends of κ (IGKC) and λ (IGLC) light chains.
The primers were as follows: IGKC_R1: 5′-GGGAGTTACCCGATTGGAGG-3′ (reverse); IGKC_R2: 5′-AAGACAGATGGTGCAGCCAC-3′ (reverse); IGLC_R1: 5′-GTGCTCCCTTCATGCGTGACC-3′ (reverse); and IGLC_R2: 5′-AGTGTGGCCTTGTTGGCTTG-3′ (reverse). For analysis of heavy chain, the following primers were used: IGHG_R1: 5′-GGGGAAGTAGTCCTTGACCAG-3′ (reverse); and IGHA_R1: 5′-GAGGCTCAGCGGGAAGACCTT-3′ (reverse). The mRNA sequences were analyzed by Chromas software version 2.6.2 (Technelysium, South Brisbane, QLD, Australia), and the results were converted to FASTA format. Sequences were compared with the human Ig variable region using IMGT/V-QUEST14 online tool for identification of rearrangements. The uniqueness of the mutated peptides was determined by the NextProt online tool.15
Detection of Patient-Specific Ig Peptides in Serum at Diagnosis
The κ or λ Ig fractions were enriched from serum samples collected at the time of diagnosis, as described above. The resulting peptides were analyzed using a DDA method, and the raw files were searched in Proteome Discoverer 2.1. Theoretical unique M-protein peptides, predicted from mRNA sequencing, were manually verified; and the suitability of these peptides for targeted LC-MS analysis was determined. At least one best unique peptide from each patient was selected on the basis of peak shape, intensity, fragmentation efficiency, and specificity.
Targeted LC-MS Analysis of M-Protein in Patient Serum at Diagnosis and after Treatment
Patient serum samples collected at diagnosis were diluted by fivefold with water because of the high concentration of Ig, which would result in overloading of the column, poor chromatography, and saturation of the detector during LC-MS analysis (Supplemental Figure S2). Serum samples collected after treatment were used without dilution. All samples were prepared in triplicate. Serum samples were spiked with the appropriate heavy SILuMAb, depending on the M-protein light chain type, at a final concentration of 1 mg/dL. Samples were then enriched for κ or λ and prepared as described above. Before LC-MS analysis, a heavy isotope-labeled version of an IgA heavy chain constant region peptide (WLQGSQELPR) was added at a final concentration of 10 fmol per injection for normalization across samples (Supplemental Figures S2 and S3). Peptide samples were analyzed via LC-MS using the PRM method, as described above, except for the addition to the inclusion list of the curated clonotypic peptides specific to the patient M-protein and the heavy isotope-labeled IgA peptide. The complete inclusion list included peptides from the constant region of heavy chain type IgG and IgA, light chains κ and λ, the corresponding heavy isotope-labeled counterparts when appropriate, and the unique M-protein peptides for each patient (Supplemental Tables S1 and S2).
Determination of Depth of Response to Treatment Using Targeted Proteomics
The total area fragment ion values for endogenous peptides in diagnosis serum samples were multiplied by 5 to correct for the dilution (Supplemental Figure S3). Total fragment ion abundance was normalized across samples using the heavy isotope-labeled IgA heavy chain peptide before any further analysis.
Two representative peptides from the constant regions of λ light chain (AAPSVTLFPPSSEELQANK and YAASSYLSLTPEQWK) and κ light chain (SGTASVVCLLNNFYPR and VDNALQSGNSQESVTEQDSK) were used to determine the relative concentration of monoclonal protein in each patient serum sample. These peptides are conserved in all λ or κ light chains and are therefore present in the heavy isotope-labeled Ig used as an internal standard. The ratio of the total fragment ion area of endogenous light chain constant region peptides/the heavy isotope-labeled counterparts (1 mg/dL) was used to determine the relative concentration of Ig in the serum samples at diagnosis. The ratio of the total fragment ion area of the patient's unique clonotypic peptides at diagnosis/the total fragment ion area of the same peptides in the post-treatment samples was determined and represents the fold change in M-protein concentration (Supplemental Figure S3).
Interference of Therapeutic Antibody
To test for interference due to the presence of a therapeutic antibody, daratumumab was spiked into each κ light chain patient post-treatment serum sample at a final concentration of 100 mg/dL. The κ light chain–specific fraction was enriched from the serum samples and prepared as described above. Data were analyzed the same way as above in comparison to the diagnosis serum without daratumumab.
Results
The current article describes a novel LC-MS–based proteomics method to detect in multiple myeloma patients during and after treatment, using peripheral blood. Our method relies on the detection of clonotypic peptides from the M-protein variable light chain, determined by mRNA sequencing, in serum as a surrogate marker for the presence of neoplastic plasma cells in the bone marrow (Figure 1). The addition of a stable heavy isotope-labeled Ig before any sample preparation serves as a control across the pre-analytical and analytical workflows. It also allows for calculation of the M-protein relative abundance between patient samples collected and processed at different time points without the need for costly and time-consuming synthesis of heavy isotope-labeled peptides specific to each patient M-protein. Enrichment of Ig fractions from serum by κ or λ light chain immunoaffinity capture enhanced sensitivity of detection of clonotypic peptides.
Clinical and Pathologic Features of the Multiple Myeloma Cohort
Samples were obtained from a cohort of multiple myeloma patients (Supplemental Table S3) for evaluating the method in clinical cases. Conventional diagnostic methods, including protein electrophoresis, immunofixation, flow cytometry, and histologic review, were used for the diagnosis of MM. Supplemental Table S3 includes the subtype of the multiple myeloma clone and MRD status, as determined by the current gold standard method of flow cytometry, alongside with quantification of Igs, free light chains, and M-protein by conventional methods at the time of diagnosis. All patients were in stringent complete response by International Myeloma Working Group response criteria at the end of therapy6; however, three were determined to be MRD positive by multiparameter flow cytometry (MFC). Figure 2 shows the chronology of bone marrow and serum sampling from these patients, from diagnosis to the most recent available medical information.
mRNA Sequencing of IGH-V and IGL-V
Supplemental Table S4 summarizes the sequences determined by mRNA sequencing. M-protein light chain sequences were determined for all patients, and heavy chain sequences were determined for four patients (Supplemental Table S4). At least one theoretical unique M-protein variable light chain peptide per patient was detected in the diagnosis serum samples and validated for use in the targeted proteomics method. A unique M-protein heavy chain peptide was detected and validated for three of the four patients in whom a variable heavy chain sequence was obtained. Supplemental Table S4 displays the variable chain sequences with mutations in bold and the validated peptides underlined.
Affinity Enrichment of Ig from Serum Improves Sensitivity by 10-Fold
To determine the improvement in sensitivity from immunoaffinity capture and the limit of detection of our method, a dilution curve experiment was conducted in serum with and without enrichment, using stable isotopically labeled antibodies as an M-protein proxy. The SILuMAb antibodies, κ or λ, were spiked into HPS at five concentrations, ranging from 0.01 to 10 mg/dL. An HPS only sample was also prepared as a negative control. For reference, 10 mg/dL is approximately 100-fold lower than the average concentration of total Ig in the serum of a healthy individual.16 Two Ig heavy chain constant region peptides and four peptides from the light chain (two for κ and two for λ) were targeted for relative quantitation. Without enrichment, all peptides were detected down to 1 mg/dL and some peptides were detected at a concentration of 0.1 mg/dL (Figure 3, A and B). However, when κ or λ light chain based enrichment is used, all SILuMAb peptides were detected down to 0.1 mg/dL and at 0.01 mg/dL in some cases (Figure 3, C and D). All SILuMAb peptides had a linear response in this concentration range (R2 ≥ 0.997) with or without enrichment. Endogenous Ig peptide abundance was constant regardless of the concentration of SILuMAb spiked into healthy pooled serum (Figure 3, E and F).
Figure 3.

Enrichment of Ig from serum provides improved sensitivity. A–D: The limit of detection of the SILuMAb isotopically labeled antibodies without enrichment was 0.1 mg/dL (A and B), but with Capture Select–based immunoaffinity enrichment, detection of some Ig-specific peptides was down to 0.01 mg/dL (C and D) in both SILuMAb κ and λ serial dilutions. E and F: The levels of endogenous Ig constant region peptides are constant across the samples regardless of the level of SILuMAb spiked into the healthy pooled serum. The total area fragment ions are plotted against the concentration of SILuMAb spiked into the healthy pooled serum. The y axis is in log10 scale. The peptides marked as black or white dots represent constant regions of the specific light chain, white triangles are a heavy chain constant region peptide common to all IgG class proteins, and the black triangles are a peptide common to the heavy chains of both SILuMAbs (GLEWVSK).
The lower limit of detection of each targeted SILuMAb peptide was determined to be 0.01 to 0.15 mg/dL when enriched with a 1.5- to 15-fold increase in lower limit of detection between enriched and unenriched, dependent on the peptide (Table 1).13,17,18
Table 1.
Determination of LLoD (in mg/dL), Based on the SD of the Lowest Total Area Fragment Ion Detected in Each Dilution Curve and on the Slope Calculated by Quasar,17,18 in Skyline,13 and Increase in Sensitivity
| Protein | Peptide | Before enrichment, mg/dL | After enrichment, mg/dL | Increase in sensitivity, fold change |
|---|---|---|---|---|
| κ | ||||
| κ | SGTASVVCLLNNFYPR | 0.16 | 0.04 | 4.6 |
| VDNALQSGNSQESVTEQDSK | 0.23 | 0.15 | 1.5 | |
| IgG | NQVSLTCLVK | 0.29 | 0.02 | 12.8 |
| SILuMAb Only | GLEWVSK | 0.21 | 0.02 | 14.1 |
| λ | ||||
| λ | AAPSVTLFPPSSEELQANK | 0.07 | 0.05 | 1.5 |
| YAASSYLSLTPEQWK | 0.05 | 0.01 | 6.3 | |
| IgG | NQVSLTCLVK | 0.47 | 0.03 | 15.2 |
| SILuMAb Only | GLEWVSK | 0.09 | 0.01 | 8.7 |
LLoD, lower limit of detection.
Ig Enrichment Efficiency Determination
To evaluate the performance of the light chain–specific enrichment method, a variation of the Matuszewski protocol was used, as outlined in Supplemental Figure S1, to determine the percentage recovery, efficiency, and the matrix effect.19 The results are summarized in Table 2. The average percentage recovery was 40% when both the light and heavy standards were at a concentration of 20 mg/dL. The average percentage efficiency was 39% regardless if the incubation time was 1 hour or overnight. However, the average percentage matrix effect for both sets of experiments was close to 100, indicating minimal matrix effect (Table 2).
Table 2.
Levels of Recovery, Efficiency, Matrix Effect, and Process Efficiency Obtained for Low Levels (0.2 mg/dL) of Antibody, Representing the Concentration Values Usually Found after Treatment
| Peptide sequence | Recovery, % | Total efficiency, % | Matrix effect, % | Process efficiency, % |
|---|---|---|---|---|
| AAPSVTLFPPSSEELQANK | 35 | 33 | 95 | 33 |
| YAASSYLSLTPEQWK | 37 | 35 | 94 | 35 |
| NQVSLTC(+57)LVK | 58 | 57 | 99 | 57 |
| GLEWVSK | 30 | 29 | 94 | 28 |
| Average | 40 | 39 | 96 | 38 |
Confirmation of the Detectability and Specificity of Predicted Clonotypic Peptides in Patient Pretreatment Serum
Serum samples collected at or near the time of diagnosis were analyzed using a DDA method to determine the protein composition as a quality check, determine if the theoretical unique M-protein peptides were detected, and validate the detected peptides for use in the targeted method. At least one of the predicted tryptic peptides from the variable light chain for each patient was experimentally detected at high levels. The patient-specific peptides incorporated into the targeted LC-MS method were selected on the basis of peak shape, intensity, specificity, minimal interference, and fragmentation (Supplemental Tables S1 and S2). Unique patient peptides were only detected in the serum of the specific patient but not in normal control serum of other patient samples.
Heavy and light chain constant region peptides were also evaluated using the same criteria. Retention time windows for scheduled targeting were determined from the DDA analysis. All peptides were incorporated into the isolation list for the PRM LC-MS method. Full lists of the peptides targeted in κ and λ light chain samples are contained in Supplemental Tables S1 and S2.
Targeted Proteomics Allows for the Detection of Persistent Clonotypic Peptides Derived from Multiple Myeloma Even in Patients MRD Negative by MFC
The optimized PRM method was used to analyze the Ig fractions enriched from serum of MM patients at diagnosis and post-treatment time points. Patient clonotypic peptides specific to each patient were exclusively detected in the corresponding patient diagnosis and post-treatment samples. The clonotypic peptides were detected in the specific post-treatment samples regardless of MFC status (Figure 4). The sensitivity of the MFC test performed was 6 cells in 1 million total cells with at least 3 million cell acquisitions.20,21 Total fragment ion area for all peptides was normalized across samples before any further data analysis using the stable isotope-labeled IgA heavy chain peptide, WLQGSQELPR, to correct for any variation in instrument sensitivity across days. Patients determined to be MRD negative by MFC after treatment had larger responses to treatment than the MRD-positive portion of the cohort, as determined by the log fold change relative concentration of the M-protein at diagnosis compared with after treatment (Figure 4). Patient 6, who was determined to be MRD negative by MFC, had a high level of circulating M-protein at diagnosis, but had the smallest change after treatment of the MRD-negative portion of the cohort (Figure 4).
Figure 4.

Minimal residual disease (MRD)–negative patients (PTs) have a larger response to treatment and a higher level of M-protein at diagnosis. Log10 fold change of monoclonal Ig at post-treatment versus diagnosis is plotted to show the degree of response to treatment as measured by the change in monoclonal protein. Patients who were MRD negative by multiparameter flow cytometry (MFC) had a greater monoclonal protein fold change compared with the MRD positive by MFC patients. Patients who were determined to be MRD positive after treatment by MFC are in gray, and those MRD negative are in black. Dx, diagnosis.
Targeted Proteomics Allows for the Detection of Multiple Myeloma in the Presence of a Therapeutic Antibody without any Evidence of Interference
Therapeutic Igs are increasingly used for treatment of multiple myeloma and therefore methods must be able to differentiate interference from these therapeutics from the patient's M-protein during MRD analysis of peripheral blood. To assess the possible interference from a therapeutic Ig in this method, daratumumab was used to investigate the possibility of assay interference. Serum collected after treatment from the Ig κ light chain patients in the cohort was spiked with daratumumab at a concentration of 100 mg/dL. These samples were prepared and analyzed following the same workflows as the patient samples. The only difference was the addition of two daratumumab-specific peptides to the isolation list for targeted MS analysis. Daratumumab is an IgG1-κ human antibody. There is no significant change in the fold change of monoclonal protein in the presence of daratumumab compared with post-treatment samples without the therapeutic antibody (Figure 5).
Figure 5.

Daratumumab does not interfere with the detection of patient-specific M-protein peptides. Daratumumab was spiked into all κ multiple myeloma patient post-treatment serum samples at a concentration of 100 mg/dL. Samples were then processed the same way as the other multiple myeloma patient serum samples. The bar plot shows the log 10-fold change of monoclonal protein in post-treatment versus diagnosis with and without daratumumab spiked into the post-treatment samples. The bars representing monoclonal protein fold change for patients who were determined to be minimal residual disease (MRD) negative after treatment by multiparameter flow cytometry have black borders, and MRD-positive samples do not. Fold change values determined when daratumumab is added to the post-treatment sample are in light gray, and those without the therapeutic antibody are in dark gray.
Discussion
The current gold standard methods for MRD detection in multiple myeloma require an invasive bone marrow biopsy. This study proposes a method for detection of M-protein as a surrogate for residual disease using Ig isolation from serum in a light chain–dependent manner, paired with the high sensitivity of targeted mass spectrometry–based proteomics. The method is highly sensitive, with a limit of detection of 0.1 mg/dL (Figure 3, C and D). Without enrichment of the Ig fraction, the sensitivity is at least 10-fold lower (Figure 3, A and B, and Table 1).
In addition, the use of a heavy stable isotope-labeled Ig standard in all serum samples allows for tracking of pre-analytical efficiency across all steps, including immunoaffinity capture, digestion, and desalting. The internal standard is key to determining the relative abundance of Ig in general and M-protein specifically. Previous LC-MS–based methods have relied on the synthesis of heavy labeled versions of the patient-specific peptides that are added just before analysis.22 These peptides can allow for more accurate quantitation of the patient-specific peptides and therefore the M-protein, but pre-analytical sample loss is not measurable. In addition, the synthetic peptides can be expensive, require a multiple week lead time, and some sequences pose major synthetic challenges. The SILuMAb Ig proteins are commercially available as high-quality mass spectrometry certified standards that can be aliquoted and stored for up to a year.
The combination of an internal standard, pre-analytical enrichment, and targeted proteomics results in a sensitive method, allowing for detection even at low post-treatment levels, which can be 1000 times lower than at diagnosis in the same patient. Specifically, this method targets a predefined list of peptides for fragmentation, resulting in product ions that are measured with high resolution and accuracy. The detection and quantitation of fragment ions, compared with peptide precursor ions, is more specific and thus much less likely to experience interference.8,23, 24, 25
A list of theoretical mutated peptides for each patient was produced from the light and heavy chain variable regions, as determined by rapid amplification of cDNA ends PCR on RNA isolated from plasma cells at diagnosis and Sanger sequencing of the cDNA product. Patient serum at diagnosis was analyzed using a DDA or discovery method to determine which theoretical peptides are LC-MS amenable. Patient-specific peptides identified at the time of diagnosis were evaluated, and a curated list of peptides for isolation was constructed. The list included the patient-specific peptides and peptides from the constant regions of λ and κ light chains and heavy chains of IgG and IgA. Two constant region peptides were targeted for each κ and λ light chain, although only one was used for the quantitation. The endogenous constant region peptide relative abundance values were within 10% CV from one another for the same light chain. This indicates that either peptide can be used as an accurate proxy for the quantitation of the Ig proteins.
This method was able to detect M-protein in the serum of MM patients determined to be MRD negative by one of the current gold standard methods, MFC. Three of the six patients comprising the cohort were MRD negative by MFC, but circulating M-protein could be detected by our method. Interestingly, the largest difference in the relative concentration of M-protein after treatment compared with diagnosis was observed in the patients with negative MRD MFC results (Figure 4). In this set of patients, the larger response from treatment, as determined by the fold change of clonotypic peptides, correlated to MRD negative status by MFC. Patient 6 is particularly interesting; the fold change in concentration of circulating M-protein between diagnosis and after treatment was the smallest of the MRD-negative patients. On review of this patient's medical history, a positive MRD test result by MFC was documented a year after the post-treatment sample used in this study was collected. In addition, Patient 6 lies more closely to the patients positive for MRD by MFC when comparing the post-treatment M-protein levels (Figure 4). The remaining patients who were MRD negative by MFC had no evidence of relapse or further treatment in their records.
It has been recently reported that a change in M-protein serum levels correlates with progression-free survival.25 Therefore, serial M-protein measurements may be more meaningful in assessing likelihood of relapse. A need for serial measurements supports the development of a sensitive, minimally invasive assay. An investigation into a larger patient cohort may reveal a pattern of response or circulating M-protein range that indicates likelihood of disease reoccurrence.
In addition, the post-treatment samples collected varied widely in the timing of collection (Figure 2). A cohort with standardized collection time points after treatment completion would allow for more comprehensive evaluation of this method, potential clinical utility, and the role that rates of change play in prognosis. Another issue complicating the use of circulating M-protein as a surrogate for MRD is that Ig proteins can have long half-lives in serum, even up to 25 days in the case of IgG. The circulating M-protein measured could be present at levels not directly correlating to the diseased plasma cell population remaining in the patient's bone marrow.26,27
Not all multiple myeloma patients have circulating Ig that can be measured as a surrogate for diseased plasma cells, but that can be determined by evaluation of a diagnosis time point serum sample; and these patients would not be monitored using this method. Even if a patient does have circulating M-protein, the clonotypic sequences may not be amenable to tryptic digestion. This means the peptides generated by digestion of the M-protein may be too small or too large to be compatible with standard reverse phase liquid chromatography and/or mass spectrometry with high-energy collision dissociation. For example, in the patient cohort, the M-protein light chain variable regions had LC-MS amenable tryptic peptides, but only four of the seven patients had heavy chain variable region peptides that were detectable. This could be because of inaccuracy in the sequencing or the fact that the chemical properties of the peptides make them less amenable to LC-MS analysis. For example, if a peptide is <5 amino acids in length, the peptide may not be retained by the LC column, but if the peptide is >15 amino acids, it may not elute from the column. In addition, highly acidic peptides do not ionize or fragment as well as more basic peptides.28 Therefore, there may not be LC-MS amenable peptides in the variable regions of the Ig proteins. However, in this study cohort, at least one peptide from the light chain variable region was detected and successfully monitored. Despite these possible limitations, this method presents a robust, efficient, specific, and sensitive method for minimally invasive monitoring of M-protein as a surrogate for MRD in multiple myeloma patients.
This method is highly sensitive, and specific steps are being taken to optimize it for more accurate quantitation. The M-protein relative concentrations at diagnosis are higher than the concentration ranges observed by serum protein electrophoresis in MM patients at diagnosis in general. The procedure for dilution of diagnosis samples requires additional optimization to ensure the M-protein levels are within the linear range of the instrument. In this series of experiments, the diagnosis serum samples were diluted fivefold, but in some patient samples, the Ig levels were outside of the linear range. This may result in slightly less accurate relative abundance levels when compared with the stable isotope labeled peptides that are within the linear range. Evaluation of a larger set of MM patient serum samples collected at diagnosis is in progress to determine the appropriate dilution. In addition, optimization of the SILuMAb level of spike in so that it is closer in final concentration to the endogenous M-protein is underway. For these reasons, fold change of M-protein is reported in this study.
As has been mentioned, the treatment for multiple myeloma is ever evolving, and therapies are improving.29, 30, 31 Therapeutic antibodies have become a major tool in the treatment of multiple myeloma, but these Ig proteins can cause interference in methods that measure the circulating M-protein.32 To evaluate the effect of a therapeutic antibody on this method, patient samples were spiked with daratumumab at a high concentration (100 mg/dL). This method can sensitively measure the M-protein specific peptides in the presence of this abundant therapeutic antibody, which is promising for the use of this method throughout treatment and post-treatment time points (Figure 5). The specificity of this method minimizes the chances of therapeutic antibody interference.
The method herein described allows for the detection of Ig, light chains, and M-protein from multiple myeloma patient serum with sensitivity ranging between 0.01 and 0.15 mg/dL, depending on the peptide, even in the presence of a therapeutic antibody. The addition of an antibody standard greatly improves the ability to track pre-analytical sample preparation efficiency and catch and correct for interassay variability. This method can detect M-protein as a surrogate for MRD in multiple myeloma patients and will allow for better maintenance and care of patients without additional invasive procedures.
Footnotes
Supported by the Farmer Family Foundation, the Susan and Peter Solomon Divisional Genomics Program, and the NIH, National Cancer Institute Cancer Center support grant P30 CA008748.
Disclosures: A.D. has received personal consultancy fees from Roche, Corvus Pharmaceuticals, Physicians' Education Resource, Seattle Genetics, Peerview Institute, Oncology Specialty Group, Pharmacyclics, Celgene, Novartis, Takeda, and EUSA Pharma; and research grants from National Cancer Institute and Roche.
Supplemental material for this article can be found at https://doi.org/10.1016/j.jmoldx.2020.04.002.
Supplemental Data
Supplemental Figure S1.

Procedure for evaluation of the performance of the method using light and stable isotopically heavy-labeled λ Ig (SILuMAb). A: Method A: both versions of the Ig are mixed and digested. Method B: the light Ig is enriched in a serum matrix depleted of λ, then mixed with the heavy-labeled Ig and digested. Method C: serum depleted of λ is enriched for λ, and both versions of Ig are spiked in and digested. B: The equations used for determination of total efficiency, recovery, matrix effect, and process efficiency, in which the measured parameter is the total fragment areas of the ions.
Supplemental Figure S2.

Workflow map displaying the sample preparation steps for patient serum samples. Each step in the sample preparation process is outlined. LC-MS, liquid chromatography–mass spectrometry; PRM, parallel reaction monitoring.
Supplemental Figure S3.
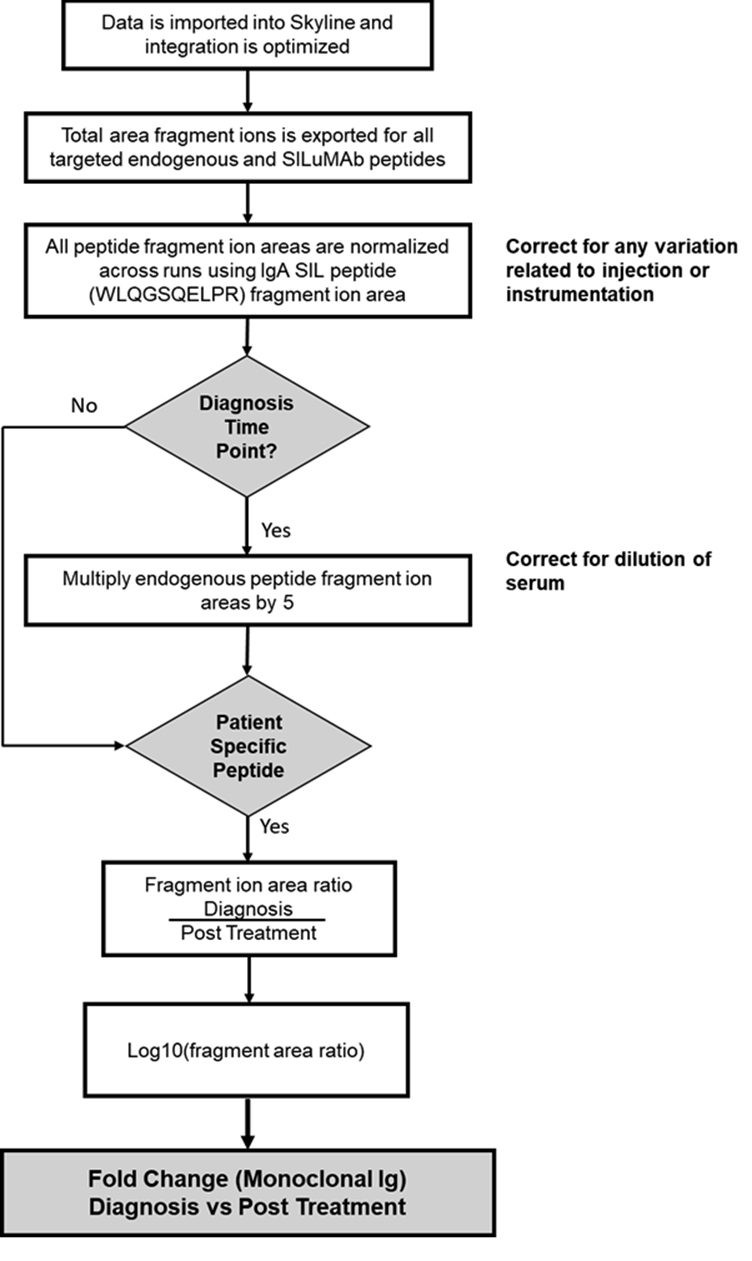
Workflow map displaying the data analysis and calculation steps used to determine fold change of M-protein in patient serum samples. This workflow includes the calculations used at each step to get from total area fragment ions to fold change of M-protein.
References
- 1.Siegel R.L., Miller K.D., Jemal A. Cancer statistics, 2016. CA Cancer J Clin. 2016;66:7–30. doi: 10.3322/caac.21332. [DOI] [PubMed] [Google Scholar]
- 2.Landgren O. MRD testing in multiple myeloma: from a surrogate marker of clinical outcomes to an every-day clinical tool. Semin Hematol. 2018;55:1–3. doi: 10.1053/j.seminhematol.2018.03.003. [DOI] [PubMed] [Google Scholar]
- 3.Landgren O., Lu S.X., Hultcrantz M. MRD testing in multiple myeloma: the main future driver for modern tailored treatment. Semin Hematol. 2018;55:44–50. doi: 10.1053/j.seminhematol.2018.03.001. [DOI] [PubMed] [Google Scholar]
- 4.Kyle R.A., Gertz M.A., Witzig T.E., Lust J.A., Lacy M.Q., Dispenzieri A., Fonseca R., Rajkumar S.V., Offord J.R., Larson D.R., Plevak M.E., Therneau T.M., Greipp P.R. Review of 1027 patients with newly diagnosed multiple myeloma. Mayo Clin Proc. 2003;78:21–33. doi: 10.4065/78.1.21. [DOI] [PubMed] [Google Scholar]
- 5.Anderson K.C., Auclair D., Kelloff G.J., Sigman C.C., Avet-Loiseau H., Farrell A.T., Gormley N.J., Kumar S.K., Landgren O., Munshi N.C., Cavo M., Davies F.E., Di Bacco A., Dickey J.S., Gutman S.I., Higley H.R., Hussein M.A., Jessup J.M., Kirsch I.R., Little R.F., Loberg R.D., Lohr J.G., Mukundan L., Omel J.L., Pugh T.J., Reaman G.H., Robbins M.D., Sasser A.K., Valente N., Zamagni E. The role of minimal residual disease testing in myeloma treatment selection and drug development: current value and future applications. Clin Cancer Res. 2017;23:3980–3993. doi: 10.1158/1078-0432.CCR-16-2895. [DOI] [PubMed] [Google Scholar]
- 6.Kumar S., Paiva B., Anderson K.C., Durie B., Landgren O., Moreau P. International Myeloma Working Group consensus criteria for response and minimal residual disease assessment in multiple myeloma. Lancet Oncol. 2016;17:e328–e346. doi: 10.1016/S1470-2045(16)30206-6. [DOI] [PubMed] [Google Scholar]
- 7.Mailankody S., Korde N., Lesokhin A.M., Lendvai N., Hassoun H., Stetler-Stevenson M., Landgren O. Minimal residual disease in multiple myeloma: bringing the bench to the bedside. Nat Rev Clin Oncol. 2015;12:286–295. doi: 10.1038/nrclinonc.2014.239. [DOI] [PMC free article] [PubMed] [Google Scholar]
- 8.Mills J.R., Kohlhagen M.C., Dasari S., Vanderboom P.M., Kyle R.A., Katzmann J.A., Willrich M.A., Barnidge D.R., Dispenzieri A., Murray D.L. Comprehensive assessment of M-proteins using nanobody enrichment coupled to MALDI-TOF mass spectrometry. Clin Chem. 2016;62:1334–1344. doi: 10.1373/clinchem.2015.253740. [DOI] [PubMed] [Google Scholar]
- 9.Mills J.R., Barnidge D.R., Murray D.L. Detecting monoclonal immunoglobulins in human serum using mass spectrometry. Methods. 2015;81:56–65. doi: 10.1016/j.ymeth.2015.04.020. [DOI] [PubMed] [Google Scholar]
- 10.Bergen H.R., 3rd, Dasari S., Dispenzieri A., Mills J.R., Ramirez-Alvarado M., Tschumper R.C., Jelinek D.F., Barnidge D.R., Murray D.L. Clonotypic light chain peptides identified for monitoring minimal residual disease in multiple myeloma without bone marrow aspiration. Clin Chem. 2016;62:243–251. doi: 10.1373/clinchem.2015.242651. [DOI] [PMC free article] [PubMed] [Google Scholar]
- 11.Remily-Wood E.R., Benson K., Baz R.C., Chen Y.A., Hussein M., Hartley-Brown M.A., Sprung R.W., Perez B., Liu R.Z., Yoder S.J., Teer J.K., Eschrich S.A., Koomen J.M. Quantification of peptides from immunoglobulin constant and variable regions by LC-MRM MS for assessment of multiple myeloma patients. Proteomics Clin Appl. 2014;8:783–795. doi: 10.1002/prca.201300077. [DOI] [PMC free article] [PubMed] [Google Scholar]
- 12.Zajec M., Jacobs J.F.M., Groenen P., de Kat Angelino C.M., Stingl C., Luider T.M., De Rijke Y.B., VanDuijn M.M. Development of a targeted mass-spectrometry serum assay to quantify M-protein in the presence of therapeutic monoclonal antibodies. J Proteome Res. 2018;17:1326–1333. doi: 10.1021/acs.jproteome.7b00890. [DOI] [PubMed] [Google Scholar]
- 13.MacLean B., Tomazela D.M., Shulman N., Chambers M., Finney G.L., Frewen B., Kern R., Tabb D.L., Liebler D.C., MacCoss M.J. Skyline: an open source document editor for creating and analyzing targeted proteomics experiments. Bioinformatics. 2010;26:966–968. doi: 10.1093/bioinformatics/btq054. [DOI] [PMC free article] [PubMed] [Google Scholar]
- 14.Brochet X., Lefranc M.P., Giudicelli V. IMGT/V-QUEST: the highly customized and integrated system for IG and TR standardized V-J and V-D-J sequence analysis. Nucleic Acids Res. 2008;36:W503–W508. doi: 10.1093/nar/gkn316. [DOI] [PMC free article] [PubMed] [Google Scholar]
- 15.Schaeffer M., Gateau A., Teixeira D., Michel P.A., Zahn-Zabal M., Lane L. The neXtProt peptide uniqueness checker: a tool for the proteomics community. Bioinformatics. 2017;33:3471–3472. doi: 10.1093/bioinformatics/btx318. [DOI] [PMC free article] [PubMed] [Google Scholar]
- 16.Gonzalez-Quintela A., Alende R., Gude F., Campos J., Rey J., Meijide L.M., Fernandez-Merino C., Vidal C. Serum levels of immunoglobulins (IgG, IgA, IgM) in a general adult population and their relationship with alcohol consumption, smoking and common metabolic abnormalities. Clin Exp Immunol. 2008;151:42–50. doi: 10.1111/j.1365-2249.2007.03545.x. [DOI] [PMC free article] [PubMed] [Google Scholar]
- 17.Abbatiello S.E., Schilling B., Mani D.R., Zimmerman L.J., Hall S.C., MacLean B. Large-scale interlaboratory study to develop, analytically validate and apply highly multiplexed, quantitative peptide assays to measure cancer-relevant proteins in plasma. Mol Cell Proteomics. 2015;14:2357–2374. doi: 10.1074/mcp.M114.047050. [DOI] [PMC free article] [PubMed] [Google Scholar]
- 18.Addona T.A., Abbatiello S.E., Schilling B., Skates S.J., Mani D.R., Bunk D.M. Multi-site assessment of the precision and reproducibility of multiple reaction monitoring-based measurements of proteins in plasma. Nat Biotechnol. 2009;27:633–641. doi: 10.1038/nbt.1546. [DOI] [PMC free article] [PubMed] [Google Scholar]
- 19.Matuszewski B.K., Constanzer M.L., Chavez-Eng C.M. Strategies for the assessment of matrix effect in quantitative bioanalytical methods based on HPLC-MS/MS. Anal Chem. 2003;75:3019–3030. doi: 10.1021/ac020361s. [DOI] [PubMed] [Google Scholar]
- 20.Roshal M., Flores-Montero J.A., Gao Q., Koeber M., Wardrope J., Durie B.G.M., Dogan A., Orfao A., Landgren O. MRD detection in multiple myeloma: comparison between MSKCC 10-color single-tube and EuroFlow 8-color 2-tube methods. Blood Adv. 2017;1:728–732. doi: 10.1182/bloodadvances.2016003715. [DOI] [PMC free article] [PubMed] [Google Scholar]
- 21.Royston D.J., Gao Q., Nguyen N., Maslak P., Dogan A., Roshal M. Single-tube 10-fluorochrome analysis for efficient flow cytometric evaluation of minimal residual disease in plasma cell myeloma. Am J Clin Pathol. 2016;146:41–49. doi: 10.1093/ajcp/aqw052. [DOI] [PMC free article] [PubMed] [Google Scholar]
- 22.Brun V., Masselon C., Garin J., Dupuis A. Isotope dilution strategies for absolute quantitative proteomics. J Proteomics. 2009;72:740–749. doi: 10.1016/j.jprot.2009.03.007. [DOI] [PubMed] [Google Scholar]
- 23.Barnidge D.R., Dispenzieri A., Merlini G., Katzmann J.A., Murray D.L. Monitoring free light chains in serum using mass spectrometry. Clin Chem Lab Med. 2016;54:1073–1083. doi: 10.1515/cclm-2015-0917. [DOI] [PubMed] [Google Scholar]
- 24.Kohlhagen M.C., Barnidge D.R., Mills J.R., Stoner J., Gurtner K.M., Liptac A.M., Lofgren D.I., Vanderboom P.M., Dispenzieri A., Katzmann J.A., Willrich M.A., Snyder M.R., Murray D.L. Screening method for M-proteins in serum using nanobody enrichment coupled to MALDI-TOF mass spectrometry. Clin Chem. 2016;62:1345–1352. doi: 10.1373/clinchem.2015.253781. [DOI] [PubMed] [Google Scholar]
- 25.Mills J.R., Barnidge D.R., Dispenzieri A., Murray D.L. High sensitivity blood-based M-protein detection in sCR patients with multiple myeloma. Blood Cancer J. 2017;7:e590. doi: 10.1038/bcj.2017.75. [DOI] [PMC free article] [PubMed] [Google Scholar]
- 26.Jefferis R. Isotype and glycoform selection for antibody therapeutics. Arch Biochem Biophys. 2012;526:159–166. doi: 10.1016/j.abb.2012.03.021. [DOI] [PubMed] [Google Scholar]
- 27.Jefferis R. Antibody therapeutics: isotype and glycoform selection. Expert Opin Biol Ther. 2007;7:1401–1413. doi: 10.1517/14712598.7.9.1401. [DOI] [PubMed] [Google Scholar]
- 28.Osaka I., Takayama M. Influence of hydrophobicity on positive- and negative-ion yields of peptides in electrospray ionization mass spectrometry. Rapid Commun Mass Spectrom. 2014;28:2222–2226. doi: 10.1002/rcm.7010. [DOI] [PubMed] [Google Scholar]
- 29.Mateos M.V., Masszi T., Grzasko N., Hansson M., Sandhu I., Pour L., Viterbo L., Jackson S.R., Stoppa A.M., Gimsing P., Hamadani M., Borsaru G., Berg D., Lin J., Di Bacco A., van de Velde H., Richardson P.G., Moreau P. Impact of prior therapy on the efficacy and safety of oral ixazomib-lenalidomide-dexamethasone vs. placebo-lenalidomide-dexamethasone in patients with relapsed/refractory multiple myeloma in TOURMALINE-MM1. Haematologica. 2017;102:1767–1775. doi: 10.3324/haematol.2017.170118. [DOI] [PMC free article] [PubMed] [Google Scholar]
- 30.Moreau P., Masszi T., Grzasko N., Bahlis N.J., Hansson M., Pour L., Sandhu I., Ganly P., Baker B.W., Jackson S.R., Stoppa A.M., Simpson D.R., Gimsing P., Palumbo A., Garderet L., Cavo M., Kumar S., Touzeau C., Buadi F.K., Laubach J.P., Berg D.T., Lin J., Di Bacco A., Hui A.M., van de Velde H., Richardson P.G., Group T.-M.S. Oral ixazomib, lenalidomide, and dexamethasone for multiple myeloma. N Engl J Med. 2016;374:1621–1634. doi: 10.1056/NEJMoa1516282. [DOI] [PubMed] [Google Scholar]
- 31.Murata K., McCash S.I., Carroll B., Lesokhin A.M., Hassoun H., Lendvai N., Korde N.S., Mailankody S., Landau H.J., Koehne G., Chung D.J., Giralt S.A., Ramanathan L.V., Landgren O. Treatment of multiple myeloma with monoclonal antibodies and the dilemma of false positive M-spikes in peripheral blood. Clin Biochem. 2018;51:66–71. doi: 10.1016/j.clinbiochem.2016.09.015. [DOI] [PMC free article] [PubMed] [Google Scholar]
- 32.Rosenberg A.S., Bainbridge S., Pahwa R., Jialal I. Investigation into the interference of the monoclonal antibody daratumumab on the free light chain assay. Clin Biochem. 2016;49:1202–1204. doi: 10.1016/j.clinbiochem.2016.07.016. [DOI] [PubMed] [Google Scholar]
Associated Data
This section collects any data citations, data availability statements, or supplementary materials included in this article.