Abstract
M6A methylation is likely to be closely associated with the occurrence and development of tumours. In this study, we demonstrated that the transcription levels of the m6A RNA methylation regulators are closely related to the prognosis of glioma. Univariate Cox analysis was performed on the expression levels of methylation regulators and selected three hub genes in glioma. Next, we systematically compared the expression of these m6A RNA methylation regulators in gliomas with different clinicopathological features. The overall survival (OS) curve of the hub genes was initially established based on TCGA database information. YTHDF1 was selected from the hub genes following survival and prognosis analysis. A nomogram was developed to predict the survival probability. We further performed cell function and in vivo xenograft tumour experiments to further verify its role in tumour progression. Next, based on the miRanda and miRDB databases, we predicted one microRNA, hsa‐mir‐346, that might regulate and bind to 3'UTR of YTHDF1, which was confirmed by our fluorescent enzyme reporter gene experiment. In summary, m6A RNA methylation regulators play a potential role in the progression of gliomas. YTHDF1 may have an essential function in glioma diagnosis, treatment and prognosis.
Keywords: glioma, miRNA, prognostic signature, RNA modification, YTHDF1
1. INTRODUCTION
Glioma is a common primary central nervous system tumour. Approximately 200,000 new patients are diagnosed every year around the world. The most frequent type of malignant glioma (WHO III–IV) is glioblastoma multiforme (GBM), which accounts for 45.2% of all central nervous system malignancies, with a median overall survival of only 12‐18 months. 1 The treatment of glioma has evolved from a single surgical treatment to a combined treatment such as surgery plus radiotherapy and chemotherapy, but the prognosis has not improved significantly. At present, the clinical diagnosis of glioma includes imaging and histopathology that also have limitations. Therefore, it is important to reveal the mechanisms of glioma treatment and prognosis to find new diagnostic targets.
N6‐adenine (m6A) is the most abundant chemical modification in eukaryotes, and m6A methylation is an epigenetic modification of RNA molecules. In the 1970s, geneticists discovered this methylation modification on eukaryotic messenger RNA (message RNA, mRNA). 2 The function and role of m6A methylation in different biological processes have again attracted attention. A large number of studies have confirmed that with mainly three types of proteins are involved in m6A methylation. The first is m6A methyltransferase, whose coding gene is called Writer. 3 , 4 , 5 The second type of protein is m6A demethylase, whose encoding gene is Erasers, which can remove m6A methylation groups in RNA. 6 Their coding genes are called readers, including two subtypes of YTHDFs and YTHDCs. 7 , 8 YTHDF1, as a member of the m6A‐modified RNA‐binding protein family, inhibits its expression in normal lung epithelial cells to resist hypoxia‐induced apoptosis and is highly expressed in non‐small cell lung cancer tumour tissues and cell lines. 9 Nishizawa et al. confirmed that YTHDF1 can affect tumour progression by modifying m6A methylation levels of inhibitory genes. 10 Another analysis of clinical data showed that patients with m6A hypomethylation had significantly lower disease‐free survival (DFS) and overall survival (OS) and a higher recurrence rate (P < 0.01). 11 However, there is a lack of literature on the function and prognostic value of regulators in the malignant progression of gliomas.
We systematically compared the expression of these m6A methylation genes in gliomas with different clinicopathological features of their TCGA datasets. YTHDF1 was selected from the hub genes based on survival and prognosis analysis. Multivariate cox regression analyses were performed, and a nomogram was built with potential risk factors based on a multivariate Cox analysis to predict survival probability. We further performed cell function and in vivo xenograft tumour experiments to further verify its role in tumour progression. Next, based on the miRanda and miRDB databases, we predicted one microRNA, hsa‐mir‐346, that might regulate and bind to 3'UTR of YTHDF1, which was confirmed by a fluorescent enzyme reporter gene experiment.
2. MATERIALS AND METHODS
2.1. Microarray data
The gene expression profiles and clinical information were downloaded from The Cancer Genome Atlas (TCGA). We selected the expression data of thirteen m6A RNA methylation regulator‐related gene from the TCGA databases and then compared the associations between different clinical parameters and m6A RNA methylation regulator expression in gliomas. The differential expression of any gene of interest between tumour and adjacent normal tissues was studied in gliomas using R software (version 3.5.1). Analyses of the differential expression and the pairwise difference map of these m6A RNA methylation regulators were performed using R software.
2.2. Kaplan‐Meier analysis
We compared the levels of genes expression at the clinical stage using R software. The overall survival analyses of the hub genes were performed trough TCGA databases. Kaplan‐Meier plots and mutation of hub genes were analysed by the open‐source web tool cBioPortal (http://www.cbioportal.org/index.do).
2.3. Prognostic nomogram
Multivariate analyses were conducted to determine the prognostic value of the hub genes and clinical characteristics. A nomogram and risk score were built with potential risk factors (P < 0.05) based on a multivariate Cox analysis using the R software package. The predictive performance of the nomogram was then measured by receiver operating characteristic (ROC) curves and analysed by Kaplan survival probability.
2.4. Cell culture and transfection
Glioma cell lines were cultured in DMEM medium containing 10% foetal bovine serum under the conditions of 37°C, 5% CO2 and 100% saturated humidity. Passive culture was performed when the cells confluent to 70% to 80%. The cells were cultured in 6‐well plates and synchronized with serum‐free medium for 24 hours. Further, the cells were divided into a Si‐NC group and a Si‐YTHDF1 group. Next, we transfected the blank plasmid and YTHDF1 interfering plasmid following the instructions of the Lipofectamine 2000 transfection kit (Guangzhou Xiangbo Biotechnology Co., Ltd., Guangzhou, China).
2.5. Quantitative real‐time polymerase chain reaction and Western blotting
Qqt‐PCR was used to detect the changes in the YTHDF1 expression. The aforementioned reverse transcription products were tested by Takara's SYBRPremixExTaqTM on an ABI7900 instrument using qPCR, and GAPDH expression was utilized as an internal reference. The following primers were used: YTHDF1‐5′ACCTGTCCAGCTATTACCCG, TGGTGAGGTATGGAATCGGAG; GAPDH‐5′ACCCACTCCT CCACCTTTGA, 3′CTGTTGCTGTAGCCAAATTCGT. Cells from each group were collected, and total cell protein was extracted using cell lysate. Then, the protein concentration was determined by a BCA kit. According to the results of protein concentration detection, 25 μL of protein samples was subjected to Western blot detection.
2.6. Colony formation assay
We diluted the cell suspension of a single‐layer culture cell in logarithmic growth phase by multiple gradients and inoculated the culture dish with an appropriate cell density (according to the proliferation ability). Next, we discarded the supernatant and carefully dipped it twice with PBS, added 5 mL of pure methanol or 1:3 acetic acid/methanol and fixed it for 15 minutes. Then, we removed the fixative solution, added an appropriate amount of Giemsa stain and applied the staining solution for 10‐30 minutes. Finally, we inverted the plate, superimposed a grid of transparencies and counted the clones directly with the naked eye.
2.7. In vivo xenograft tumour growth
Twelve nude mice were divided into an experimental and a control group (n = 6). Nude mice were kept in an environment of about 25°C with a suitable humidity and were provided with sufficient food and water during the administration. Experimental grouping: About 5 × 10⁶ cells transfected with pc‐YTHDF1 in SHG‐44 cell (si‐YTHDF1 in U87 cell) were suspended in 0.1 mL of PBS and injected subcutaneously into nude mice. The control group was given the same amount of normal saline. The volume and weight of the xenograft tumours in the nude mice were then measured every 10 days. Thirty days later, the nude mice were killed, and the transplanted tumours were removed. The morphological changes in the tumour tissues were observed by H & E staining, and the expression of Ki67 was also detected.
2.8. Immunohistochemical analysis
Antibody system immunohistochemistry kits were purchased from Roche, Switzerland. According to the method of Dowset et al, 12 pale yellow, yellow or brown particles appeared in the nuclei of cells as positive expression. Readers blinded to the patient's pathological data observed the expression of the whole film under a microscope.
2.9. miRNA database analysis
The potential miRNAs targeting YTHDF1 were downloaded from miRanda and miRDB databases. We performed survival analysis of hsa‐miR‐346 in brain glioma, downloaded from TCGA. We then conducted survival analysis of hsa‐miR‐346 in glioma using a TCGA project. Coexpression analysis for hsa‐miR‐346 and YTHDF1 was performed via ENCORI, which mainly focuses on miRNA‐target interactions and is an open‐source platform for studying RNA‐RNA interactome data (http://starbase.sysu.edu.cn/index.php).
2.10. Luciferase reporter assay
The YTHDF1 gene promoter was cloned by RT‐q PCR and DNA fragments from the 3′‐UTR of YTHDF1 inserted into the luciferase reporter vector pGL3. Then, the pGL3‐YTHDF1‐3′UTR reporter plasmids (100 ng) plus 5 ng of pRL‐TK renilla plasmid and increasing levels of NC, Hsa‐mir‐346 or mutant Hsa‐mir‐346 mimics were co‐transfected into the U87 cell. Luciferase activity analysis was next performed to calculate the luciferase activity ratio of the reporter plasmid and the internal reference.
2.11. Statistical analysis
Statistical analysis was conducted using SPSS (IBM, Chicago, IL, USA) and R software (version 3.5.1). Factors were identified as significant at P < 0.1 in the univariate analysis. Comparisons between groups were performed using independent sample t tests, and multiple group comparisons were done using single‐factor variance. Pairwise comparisons were performed using LSD Lt test. P < 0.05 was considered statistically significant.
3. RESULTS
3.1. Clinical significance of YTHDF1
We examined the microarray data of all 605 glioma cases from the TCGA database. Heat maps and violin plot showed different gene expression between the normal and the tumour group (Figure 1A,B). As is visible in the violin plot, the mRNA expression levels of YTHDF2, YTHDF1, METTL3, RBM15 and HNRNPC were up‐regulated in glioma compared to normal tissues, whereas the expression levels of ALKBH5, WTAP, YTHDC2, ZC3H13 and METTL14, especially of FTO, were decreased in glioma (Figure 1B). Next, we performed univariate cox regression analysis on the expression levels in the TCGA dataset (Figure 1C). As can be seen in Figure 1D, YTHDF1, RBM15 and METTL14 are associated with clinicopathological features (P < 0.05; Figure 1D). Of these genes, YTHDF1 is the risky gene with HR > 1, whereas RBM15 and METTL14 are protective genes.
Figure 1.
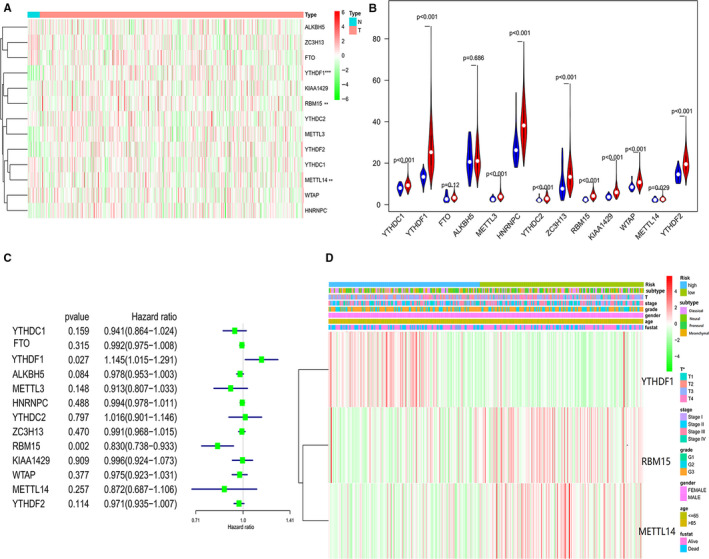
Heat maps (A) and violin (B) plot showed different gene expression profiles in the normal vs tumour group in glioma from TCGA. C, A univariate Cox regression analysis on the expression levels of thirteen genes in the TCGA dataset. D, Heat maps showed that the different gene expressions of YTHDF1, METTL3 and FTO are significantly correlated with clinicopathological features. *P < 0.05 versus control
To evaluate the prognosis of the three tested genes in glioma, the overall survival (OS) curve was performed first on the Kaplan‐Meier Plotter Database. The high expression of YTHDF1 in glioma was associated with worse OS (P < 0.05; Figure 2A). OS of RBM15 and METTL14 were not statistically significant (Figure 2B,C). Interestingly, the OS and DFS of the YTHDF1 mutations in glioma were performed via the cBioPortal. The results we obtained showed that glioma cases with related genes mutations had better OS and DFS (P < 0.05; Figure 2D,E). Next, we investigated the association between the YTHDF1 gene expression and the clinical stage using the TCGA database. The results indicated that high levels of YTHDF1 are correlated with advanced stages. The above results indicated that YTHDF1 may contribute to glioma progression (Figure 2F,G).
Figure 2.
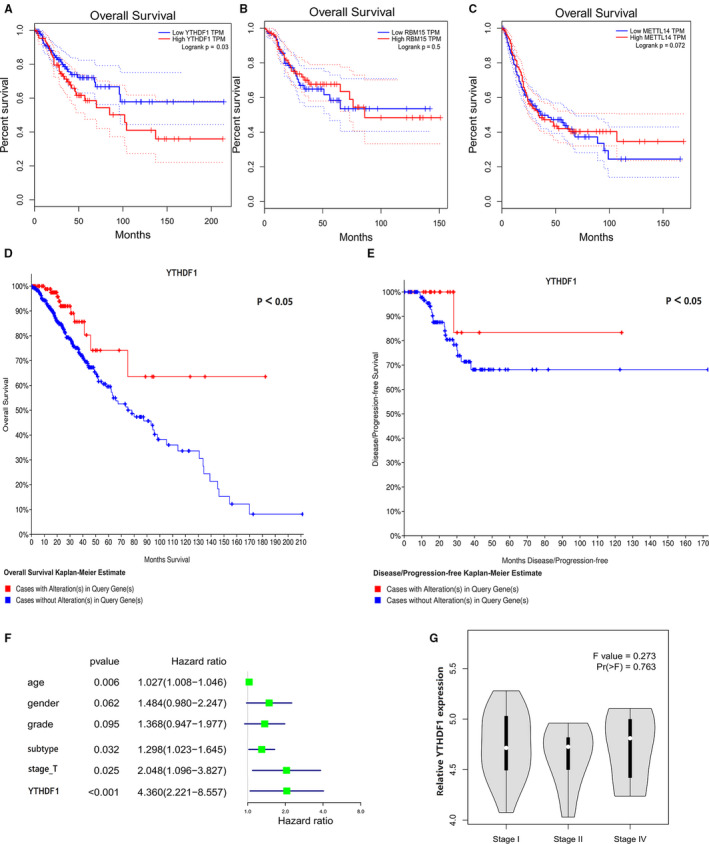
A‐C, The overall survival (OS) curve of YTHDF1, METTL3 and FTO was performed firstly on Kaplan‐Meier Plotter Database. The overall survival (D) and disease‐free (E) survival of the YTHDF1 mutations on glioma were performed via the cBioPortal for Cancer Genomics website. F, The high expression levels of YTHDF1 are correlated with advanced stages. G, The multivariate analysis of dimension, subtype, age, grade, stage and YTHDF1 were statistically significant factors for glioma progression. *P < 0.05 versus control
3.2. Prognosis of YTHDF1 in glioma patients
In the present study, a total number of 605 glioma patients were included from TCGA. The clinicopathological characteristics of the patients are listed in Table 1. The results of the multivariate analysis revealed that the dimension, subtype, age, grade, stage and YTHDF1 were statistically significant factors for glioma progression (Figure 2F). The prognostic nomogram that integrated all significant independent factors is presented in Figure 3A. The ROC curve area evaluating the prognostic nomogram for OS prediction was 0.750 (95% CI, 0.729 to 0.759; Figure 3B). The calibration plot for the probability of survival at three or five years revealed an optimal agreement with the prediction by the nomogram, which appeared to be good in the model (Figure 3C,D).
Table 1.
Demographic and clinicopathological characteristics of patients with Glioma in TCGA database
| Demographic or characteristics | All patients (N = 605) (%) | Training cohort (N = 300) | Validation cohort (N = 305) |
|---|---|---|---|
| Age at diagnosis | |||
| ≤49 | 69 (11.4) | 36 (11.6) | 37 (11.8) |
| 50‐59 | 152 (25.1) | 73 (24.3) | 78 (25.7) |
| 60‐69 | 145 (24.0) | 73 (24.3) | 72 (23.9) |
| 70‐79 | 132 (21.8) | 69 (22.6) | 68 (23.6) |
| ≥80 | 107 (17.7) | 49 (16.6) | 49 (16.0) |
| Gender | |||
| Female | 241 (39.8) | 241 (39.8) | 241 (39.8) |
| Male | 364 (60.2) | 364 (60.2) | 364 (60.2) |
| Subtype | |||
| Classical | 156 (28.5) | 84 (28.0) | 87 (28.5) |
| Neural | 100 (16.5) | 51 (17.0) | 50 (16.5) |
| Proneural | 155 (25.6) | 78 (26.0) | 78 (25.6) |
| Mesenchymal | 184 (30.4) | 90 (30.0) | 93 (30.4) |
| Grade | |||
| G1 | 333 (55.0) | 162 (54.0) | 167 (55.0) |
| G2 | 200 (33.0) | 102 (34.0) | 99 (33.0) |
| G3 | 72 (12.0) | 36 (12.0) | 39 (12.0) |
| T (cm) | |||
| 0‐1 | 330 (54.6) | 164 (54.7) | 166 (54.4) |
| 1‐1.4 | 196 (32.4) | 99 (32.9) | 97 (33.6) |
| 1.5‐1.9 | 41 (6.9) | 20 (6.6) | 21 (6.8) |
| 2‐3 | 35 (5.9) | 16 (5.4) | 19 (5.2) |
| Immunotherapy | |||
| No | 489 (80.9) | 240 (80.0) | 249 (80.2) |
| Yes | 116 (19.1) | 60 (20.0) | 56 (19.8) |
| Radiation therapy | |||
| No | 426 (70.5) | 212 (71.0) | 214 (70.2) |
| Yes | 179 (29.5) | 87 (29.0) | 92 (29.8) |
| YTHDF1 expression | |||
| High | 395 (65.4) | 195 (65.0) | 200 (66.0) |
| Low | 210 (34.6) | 105 (35.0) | 105 (34. 0) |
Figure 3.
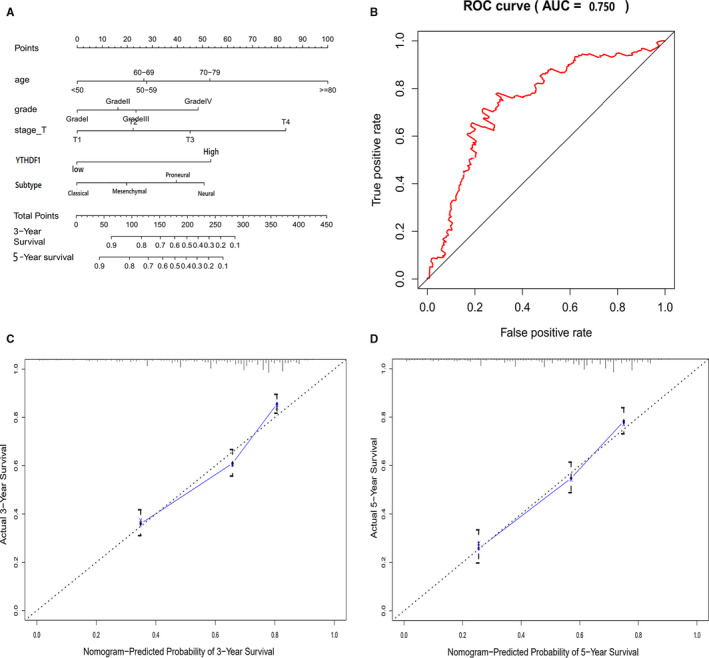
A, The prognostic nomogram that integrated all significant independent factors from the multivariate analysis for OS in the training cohort. B, The ROC curve area evaluating the prognostic nomogram for OS prediction was 0.750 (95% CI, 0.729 to 0.759). C, The calibration plot for the probability of survival at 3 or 5 years after surgery showed an optimal agreement between the prediction by the nomogram, respectively. *P < 0.05 versus control
3.3. YTHDF1 promotes the proliferation of glioma cell lines
First, RT‐qPCR assay was performed to investigate the expression of YTHDF1 in different glioma cells. The results showed that the YTHDF1 expression was markedly up‐regulated in U87 and SHG‐44 cell lines (Figure 4A). Then, the expression efficiency of pc‐YTHDF1 and si‐YTHDF1 was measured by RT‐qPCR assay in U87 and SHG‐44. Next, we overexpressed YTHDF1 by transfecting a YTHDF1 plasmid into a SHG‐44 cell line; a shRNA YTHDF1 plasmid was transfected with a U87 cell line to knockdown the YTHDF1 expression, indicating that introduction of si‐YTHDF1 and pc‐YTHDF1 is successful and can be used for subsequent research (Figure 4B). Then, the effects of YTHDF1 down‐regulation and up‐regulation on cell proliferation and apoptosis were further examined in U87 and SHG‐44 cells, respectively (Figure 5A–F). MTS analysis showed that the proliferation ability of YTHDF1 knockdown U87 cells was significantly lower than that of mock cells, and the proliferation ability of SHG‐44 cells with YTHDF1 overexpression was significantly higher than that of mock cells (Figure 5A,D). Colony formation analysis showed that YTHDF1 knockdown caused a significant decrease in the number of colonies in U87 cells, and YTHDF1 overexpression caused a significant increase in the number of colonies in SHG‐44 cells (Figure 5B‐F).
Figure 4.

A, The YTHDF1 expression in different glioma cells. B, The expression efficiency of pc‐YTHDF1 and si‐YTHDF1 was measured by RT‐qPCR and WB assay in U87 and SHG‐44. *P < 0.05 versus control
Figure 5.
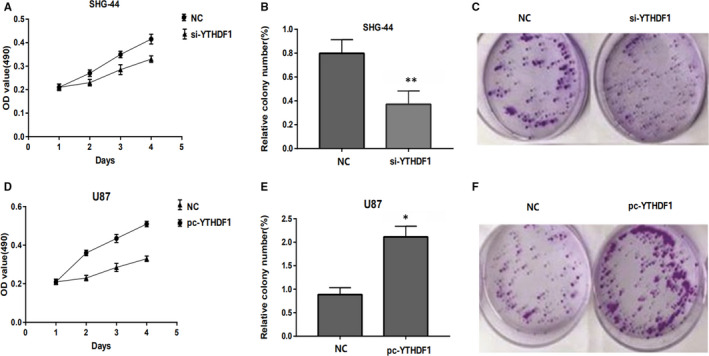
A, MTT assays show that YTHDF1 down‐regulation decreased cell proliferation in U87 shRNA cells. B, C, Colony formation assays indicate significantly decreased the number of colonies in the U87 shRNA cells compared to control U87 cells. D, MTT assays show that YTHDF1 overexpression increased cell proliferation in SHG‐44 shRNA cells. E, F, Colony formation assays indicate significantly decreased the number of colonies in the SHG‐44 shRNA cells compared to control SHG‐44 cells
3.4. YTHDF1 promotes glioma tumour growth in vivo
To further study the biological significance of YTHDF1 in gliomas, we injected U87‐siYTHDF1 and SHG‐44‐pcYTHDF1 cells and their corresponding controls subcutaneously in nude mice and monitored their tumour growth. Compared to the control U87 cells, the U87‐pcYTHDF1 cells had a significantly larger tumour size. In contrast, the SHG‐44‐siYTHDF1 cells formed tumours that were much smaller than those in the SHG‐44 control cells (Figure 6A,B). In addition, the low YTHDF1 levels in glioma cells were associated with low tumour growth rates and smaller tumour weight, whereas the high YTHDF1 levels in glioma cells were associated with higher tumour growth rates and tumour weight (Figure 6C). Immunohistochemical experiments established that the Ki67 positive rate in the high‐YTHDF1 group was significantly higher than that in the control group (Figure 6D). Taken together, these data suggest that YTHDF1 promotes the growth of glioma tumours in vivo.
Figure 6.
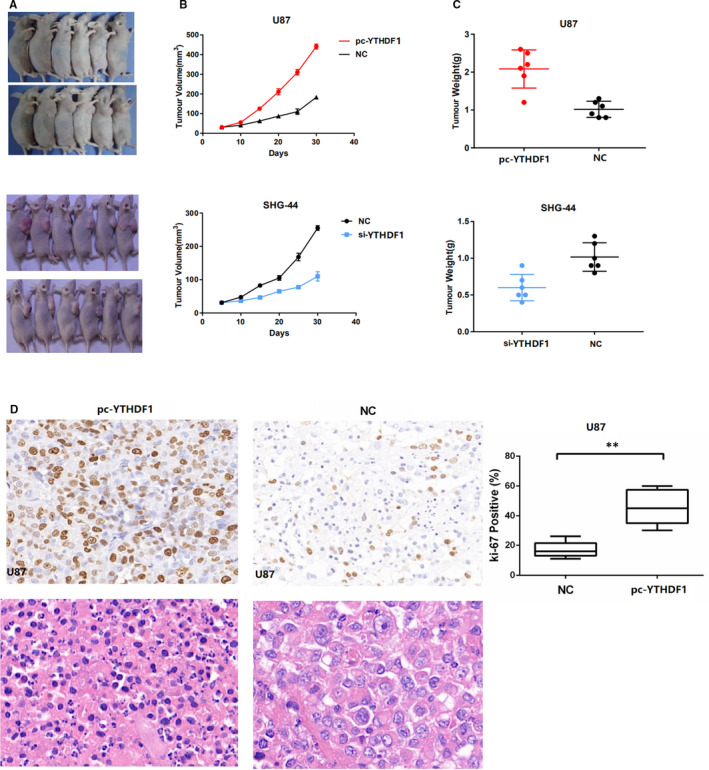
YTHDF1 promotes glioma tumour growth in vivo. A, Representative images of day 28 tumours in mice transplanted with U87‐shYTHDF1, U87 (control), SHG‐44‐YTHDF1 and SHG‐44 (control) cells. B, Plots showing tumour growth measurements of U87‐shYTHDF1, U87 (control), SHG‐44‐YTHDF1 and SHG‐44 (control) cells is shown. C, The mean tumour weights in each group (U87‐shYTHDF1, U87 (control), SHG‐44‐YTHDF1 and SHG‐44 (control) cells) on day 30 are shown. D, IHC staining showing that cell proliferation (Ki67‐positive) positively correlates with YTHDF1 expression levels. Data in (B) and (C) are presented as mean ± SD (n = 5). *P < 0.05 versus control
3.5. Hsa‐mir‐346 targets YTHDF1
Finally, we selected two sets of miRNAs related to YTHDF1 from miRanda and miRDB databases and obtained miR‐486‐5p as a possible candidate by drawing Veen map (Figure 7A). Next, we performed survival analysis of hsa‐miR‐346 in brain glioma via ENCORI. We found that glioma patients with high expression of Hsa‐mir‐346 had better overall survival than those with low expression (P < 0.05; Figure 7B). Moreover, the miRNA‐target coexpression between hsa‐mir‐346 and YTHDF1 via ENCORI showed that hsa‐mir‐346 expression was negatively correlated with the YTHDF1 expression (Figure 7C). Importantly, we established that hsa‐mir‐346 may be combined with 3′UTR of YTHDF1 (Figure 7D). Therefore, we speculated that hsa‐mir‐346 is a potential key upstream negative regulator of YTHDF1 and may be involved cancer treatment and prognosis.
Figure 7.
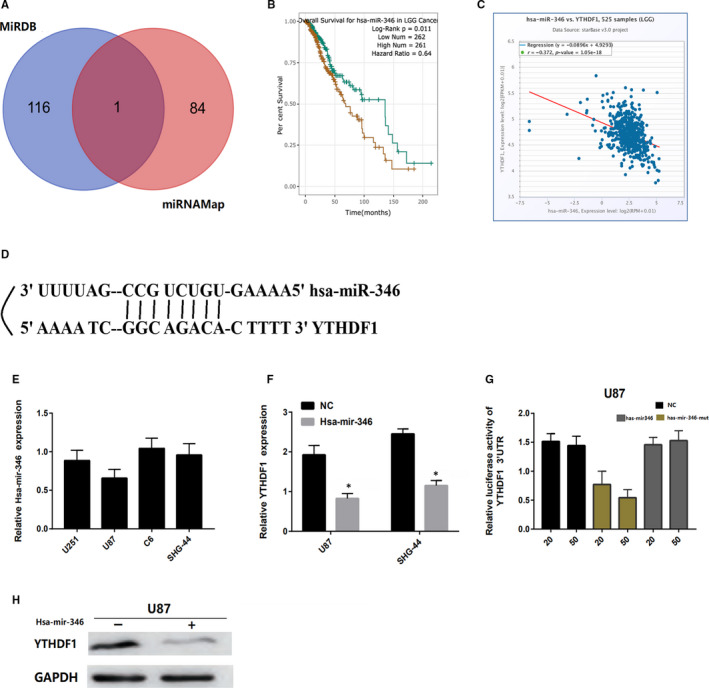
YTHDF1 is a target for miR‐346 in glioma cells. A, Venn diagrams showing the number of potential miRNAs targeting the 3'UTR of YTHDF1, as predicted by two databases, miRanda and miRDB. B, Survival analysis of hsa‐miR‐346 in brain glioma via ENCORI. C, The coexpression between hsa‐mir‐346 and YTHDF1 via ENCORI showed that hsa‐mir‐346 expression is negatively correlated with YTHDF1 expression. D, Sequences of miR‐346 and their potential binding sites in the 3'UTR of YTHDF1 are shown. E, Quantitative real‐time PCR analysing miR‐346 expression relative to U87 as internal control is shown. F, H Comparison of YTHDF1 expression in glioma cells transfected with miR‐346 mimic or negative control (NC) based on qRT‐PCR and Western blotting. The loading control for Western blotting was GADPH. G, Analysis of luciferase activity from reporters containing the 3'UTR end of YTHDF1 in cells transfected with the miR‐346 mimic, miR‐346 mutation mimic (miR‐346‐mut) and negative control (NC) is shown. *P < 0.05 versus control
In addition, we speculated that hsa‐miR‐346 is a potential key upstream negative regulator of YTHDF1 that may be associated with cancer treatment. Next, we analysed the expression level of hsa‐mir‐346 in glioma cell lines by qRT‐PCR. The results showed that hsa‐mir‐346 was down‐regulated in glioma cells (Figure 7E,F). Then, we transfected glioma cells or mutant hsa‐mir‐346 mimics and luciferase‐labelled NEK2‐3'UTR with hsa‐mir‐346, which were subjected to luciferase reporter gene analysis. We found that hsa‐mir‐346 mimic significantly reduced the activity of YTHDF1‐3'UTR, whereas the mutant hsa‐mir‐346 mimic did not inhibit the luciferase activity of YTHDF1‐3'UTR (Figure 7G). Moreover, we analysed the expression levels of YTHDF1 in u87 cells transfected with hsa‐mir‐346 and the negative control (NC) by qRT‐PCR and Western blotting and found that the expression of YTHDF1 with hsa‐mir‐346 was significantly lower than that of the negative control group (Figure 7H). Therefore, these results indicated that YTHDF1 is regulated by hsa‐mir‐346 and may have an impact on the prognosis of glioma patients.
4. DISCUSSION
Previous studies have reported that the pathological grade, age at onset, surgical methods and post‐operative adjuvant treatment of glioma patients are directly related to their prognosis. 13 , 14 However, many factors affect the prognosis of glioma patients, most of which are uncertain. 15 Furthermore, much of the literature on the relationship between M6A methylation and tumours has been mostly focused on liver and cervical cancer. For example, Dominissini confirmed that the knockout of YTHDF1 in cell lines induced apoptosis of liver cancer cells in in vitro experiments and speculated that its mechanism may be through the activation of the p53 signalling pathway. 16 JmzhaoMa found that the expression of YTHDF1in liver cancer was reduced, which was negatively correlated with the prognosis of liver cancer patients. 17 Patients with m6A hypomethylated cervical cancer had significantly lower disease‐free survival (DFS) and overall survival (OS), whereas hypomethylation led to a higher recurrence rate (P < 0.01). 11 In this study, we demonstrated that the expression of regulators (RNA m6A RNA methylation) is also closely associated with the progress and prognosis of gliomas. Among them, YTHDF1 is associated with OS and clinicopathological features (P < 0.05). Importantly, YTHDF1 is a risky gene with HR > 1 (P < 0.05).
Nishizawa et al found that the YTHDF1 gene was highly expressed in colorectal cancer patients and was related to the tumour diameter, clinical stage, but its specific regulatory mechanism was not studied. 19 Additionally, Hao et al conducted research on liver cancer data in TCGA and found that YTHDF1 was associated with tumour progression and may be an indicator factor for poor prognosis. 20 The results of these studies are consistent with our findings that the high expression of YTHDF1 in glioma is associated with worse OS and advanced stages. Furthermore, glioma patients with YTHDF1 mutations have a better overall survival and disease‐free survival than those of the wild‐type. In our investigation, univariate analysis revealed that ages, grade, stage and YTHDF1 expression were statistically significant factors for glioma progression. Then, a prognostic nomogram that integrated all significant independent factors from the multivariate analysis for OS was made. Yan et al developed a radiomic signature to predict OS for glioma, and the C‐Index for OS prediction was 0.707. 21 Our nomogram has five readily available pathological variables and achieved a ROC curve area of 0.750, superior to that of the nomogram, which indicated that the high YTHDF1 expression was an independent risk factor and improved the current prognostic model. We further performed cell function and in vivo xenograft tumour experiments to further verify its role in tumour progression.
MicroRNAs (miRNAs) are a wide range of regulatory non‐coding RNAs (18‐25 nt) in mammals that can regulate the expression of target genes through post‐transcriptional regulation. At present, abnormally expressed miRNAs are often used as the key to disease prediction, prevention and treatment in clinical treatment. 21 , 22 , 23 Next, based on the data available in the miRanda and miRDB databases, we predicted that one microRNA, hsa‐mir‐346, might regulate and bind to 3'UTR of YTHDF1, which was later confirmed by a fluorescent enzyme reporter gene experiment. Previous studies have shown that hsa‐miR‐346 can regulate other physiological and pathological processes, including cell differentiation, inflammatory reactions and carcinogenesis. 24 , 25 , 26
It is noteworthy that miR‐346 was found to be up‐regulated in human cervical cancer tissues and promoted malignant progression. 28 Here, using ENCORI, we found that glioma patients with high expression of hsa‐mir‐346 had better overall survival than those with low expression (P < 0.05). Importantly, the miRNA‐target coexpression between hsa‐mir‐346 and YTHDF1 established by ENCORI showed that the hsa‐mir‐346 expression was negatively correlated with the YTHDF1 expression. Next, we confirmed that hsa‐mir‐346 mimic significantly reduced the luciferase activity of YTHDF1‐3'UTR by luciferin experiments. There is evidence that the m6A reader YTHDF1 can enhance the translation of EIF3C and its expression, promoting the malignant progression of ovarian cancer. 29 Therefore, we speculated that hsa‐miR‐346 is a potential key upstream negative regulator of YTHDF1 that may be related to cancer treatment and prognosis. However, this notion needs to be further explored.
In summary, our study showed that YTHDF1 is associated with glioma progression, and high YTHDF1 expression also predicts a poor prognosis in glioma patients. We also developed a nomogram to predict the overall survival (OS) of glioma patients. Finally, we identified hsa‐mir‐346 as an upstream regulator of YTHDF1 expression, which may be involved in the development of a new treatment reducing the development of glioma.
CONFLICT OF INTEREST
The authors declare that they have no conflicts of interest.
AUTHOR CONTRIBUTION
SL and CX conceived and designed the study, which were proofed by SL. CX analysed the data and wrote the manuscript. BY and TH carried out the concepts, design and manuscript preparation. BY, TH and BD provided assistance for data acquisition. All authors have read and approved the content of the manuscript.
ACKNOWLEDGEMENT
The authors gratefully acknowledge contributions from the TCGA Network. This study was generously supported by the Science and Technology Research Project of Henan Province (Grant no. 182102311180).
Xu C, Yuan B, He T, Ding B, Li S. Prognostic values of YTHDF1 regulated negatively by mir‐3436 in Glioma. J Cell Mol Med. 2020;24:7538–7549. 10.1111/jcmm.15382
DATA AVAILABILITY STATEMENT
The data that support the findings of this study are available from the corresponding author upon reasonable request.
REFERENCES
- 1. Ostrom QT, Gittleman H, Stetson L, Virk SM, Barnholtz‐Sloan JS. Epidemiology of gliomas. Cancer Treat Res. 2015;163(3):1‐14. [DOI] [PubMed] [Google Scholar]
- 2. Bray F, Ferlay J, Soerjomataram I, Siegel RL, Torre LA, Jemal A. Global cancer statistics 2018: GLOBOCAN estimates of incidence and mortality worldwide for 36 cancers in 185 countries. CA Cancer J Clin. 2018;68(6):394‐424. [DOI] [PubMed] [Google Scholar]
- 3. Kim K, Jutooru I, Chadalapaka G, et al. HOTAIR is a negative prognostic factor and exhibits pro‐oncogenic activity in pancreatic cancer. Oncogene. 2012;32(13):1616‐1625. [DOI] [PMC free article] [PubMed] [Google Scholar]
- 4. Liu XH, Sun M, Nie FQ, et al. Lnc RNA HOTAIR functions as a competing endogenous RNA to regulate HER2 expression by sponging miR‐331‐3p in gastric cancer. Mol Cancer. 2014;13(1):92. [DOI] [PMC free article] [PubMed] [Google Scholar]
- 5. Kapranov P, Cheng J, Dike S, et al. RNA maps reveal new RNA classes and a possible function for pervasive transcription. Science. 2007;316(5830):1484‐1488. [DOI] [PubMed] [Google Scholar]
- 6. Zhao Y, Yang YH, Trovik J, et al. A novel wnt regulatory axis in endometrioid endometrial cancer. Cancer Res. 2014;74(18):5103‐5117. [DOI] [PubMed] [Google Scholar]
- 7. Tripathi V, Shen Z, Chakraborty A, et al. Long noncoding RNA MALAT1controls cell cycle progression by regulating the expression of oncogenic transcription factor B‐MYB. PLoS Genet. 2013;9(3):e1003368. [DOI] [PMC free article] [PubMed] [Google Scholar]
- 8. Vassallo I, Zinn P, Lai M, Rajakannu P, Hamou MF, Hegi ME. WIF1 re‐expression in glioblastoma inhibits migration through attenuation of non‐canonical WNT signaling by downregulating the lncRNA MALAT1. Oncogene. 2015;35(1):12‐21. [DOI] [PubMed] [Google Scholar]
- 9. Zuo Z, Li X, Jiang L, et al. YTHDF1 links hypoxia adaptation and non‐small cell lung cancer progression. Nat Commun. 2019;10:4892. [DOI] [PMC free article] [PubMed] [Google Scholar]
- 10. Nishizawa Y, Konno M, Asai A, et al. Oncogene c‐Myc promotes epitranscriptome m6A reader YTHDF1 expression in colorectal cancer. Oncotarget. 2018;9(7):7476‐7486. [DOI] [PMC free article] [PubMed] [Google Scholar]
- 11. Wang X, Li Z, Kong B, et al. Reduced m6 A mRNA methylation is correlated with the progression of human cervical cancer. Oncotarget. 2017;8(58):98918‐98930. [DOI] [PMC free article] [PubMed] [Google Scholar]
- 12. Dowsett M, Nielsen TO, Hern RA, et al. Assessment of Ki67 in breast cancer: recommendations from the international Ki67 in breast cancer working group. J Natl Cancer Inst. 2011;103(22):1656‐1664. [DOI] [PMC free article] [PubMed] [Google Scholar]
- 13. Shaw E, Arusell R, Scheithauer B, et al. Prospective randomized trial of low‐versus high‐dose radiation therapy in adults with supratentorial low‐grade glioma: initial report of a North Central Cancer Treatment Group/Radiation Therapy Oncology Group/Eastern Cooperative Oncology Group study. J Clin Oncol. 2002;20(9):2267‐2276. [DOI] [PubMed] [Google Scholar]
- 14. Palmer JD, Siglin J, Yamoah K, et al. Re‐resection for recurrent high‐grade glioma in the setting of re‐irradiation: more is not always better. J Neurooncol. 2015;124(2):215‐221. [DOI] [PubMed] [Google Scholar]
- 15. Yang JY, Kong SH, Ahn HS, et al. Prognostic factors for reoperation of recurrent retroperitoneal sarcoma: the role of clinicopathological factors other than histologic grade. J Surg Oncol. 2015;111(2):165‐172. [DOI] [PubMed] [Google Scholar]
- 16. Dominissini D, Moshitch‐Moshkovitz S, Schwartz S, et al. Topology of the human and mouse m6A RNA methylomes revealed by m6A‐seq. Nature. 2012;485(7397):201‐206. [DOI] [PubMed] [Google Scholar]
- 17. Jin‐zhao Ma FU, Yang C‐C, Liu F, et al. METTL14 suppresses the metastatic potential of hepatocellular carcinoma by modulating N6‐methyladenosine‐dependent primary MicroRNA processing. Hepatology. 2017;65(2):529‐543. [DOI] [PubMed] [Google Scholar]
- 18. Nishizawa Y, Konno M, Asai A, et al. Oncogene c‐Myc promotes epitranscriptome m6 A reader YTHDF1 expression in colorectal cancer. Oncotarget. 2018;9(7):7476‐7486. [DOI] [PMC free article] [PubMed] [Google Scholar]
- 19. Zhao X, Chen Y, Mao Q, et al. Overexpression of YTHDF1 is associated with poor prognosis in patients with hepatocellular carcinoma. Cancer Biomark. 2018;21(4):859‐868. [DOI] [PubMed] [Google Scholar]
- 20. Tan Y, Mu W, Wang XC, Yang GQ, Gillies RJ, Zhang H. Improving survival prediction of high‐grade glioma via machine learning techniques based on MRI radiomic, genetic and clinical risk factors. Eur J Radiol. 2019;120:108609. [DOI] [PubMed] [Google Scholar]
- 21. Blenkiron C, Miska EA. miRNAs in cancer: approaches, aetiology, diagnostics and therapy. Hum Mol Genet. 2007;16(R1):R106‐R113. [DOI] [PubMed] [Google Scholar]
- 22. Zhong X, Coukos G, Zhang L. miRNAs in human cancer. Methods Mol Biol (Clifton, N.J.). 2012;822:295‐306. [DOI] [PMC free article] [PubMed] [Google Scholar]
- 23. Fuse M, Nohata N, Kojima S, et al. Restoration of miR‐145 expression suppresses cell proliferation, migration and invasion in prostate cancer by targeting FSCN1. Int J Oncol. 2011;38(4):1093. [DOI] [PubMed] [Google Scholar]
- 24. Alsaleh G, Suffert G, Semaan N, et al. Bruton's tyrosine kinase is involved in miR‐346‐related regulation of IL‐18 release by lipopolysaccharide‐activated rheumatoid fibroblast‐like synoviocytes. J Immunol. 2009;182(8):5088‐5097. [DOI] [PubMed] [Google Scholar]
- 25. Chen B, Pan W, Lin X, et al. MicroRNA‐346 functions as an oncogene in cutaneous squamous cell carcinoma. Tumor Biol. 2016;37(2):2765‐2771. [DOI] [PubMed] [Google Scholar]
- 26. Oskowitz AZ, Lu J, Penfornis P, et al. Human multipotent stromal cells from bone marrow and microRNA: regulation of differentiation and leukemia inhibitory factor expression. Proc Natl Acad Sci. 2008;105(47):18372‐18377. [DOI] [PMC free article] [PubMed] [Google Scholar]
- 27. Liu T, Wei Q, Jin J, et al. The m6A reader YTHDF1 promotes ovarian cancer progression via augmenting EIF3C translation. Nucleic Acids Res. 2020;48(7):3816‐3831. [DOI] [PMC free article] [PubMed] [Google Scholar]
- 28. Song G, Wang R, Guo J, et al. miR‐346 and miR‐138 competitively regulate hTERT in GRSF1‐ and AGO2‐dependent manners, respectively. Sci Rep. 2015;5:15793. [DOI] [PMC free article] [PubMed] [Google Scholar]
Associated Data
This section collects any data citations, data availability statements, or supplementary materials included in this article.
Data Availability Statement
The data that support the findings of this study are available from the corresponding author upon reasonable request.


