

Abstract
Affinity fingerprints report the activity of small molecules across a set of assays, and thus permit to gather information about the bioactivities of structurally dissimilar compounds, where models based on chemical structure alone are often limited, and model complex biological endpoints, such as human toxicity and in vitro cancer cell line sensitivity. Here, we propose to model in vitro compound activity using computationally predicted bioactivity profiles as compound descriptors. To this aim, we apply and validate a framework for the calculation of QSAR-derived affinity fingerprints (QAFFP) using a set of 1360 QSAR models generated using Ki, Kd, IC50 and EC50 data from ChEMBL database. QAFFP thus represent a method to encode and relate compounds on the basis of their similarity in bioactivity space. To benchmark the predictive power of QAFFP we assembled IC50 data from ChEMBL database for 18 diverse cancer cell lines widely used in preclinical drug discovery, and 25 diverse protein target data sets. This study complements part 1 where the performance of QAFFP in similarity searching, scaffold hopping, and bioactivity classification is evaluated. Despite being inherently noisy, we show that using QAFFP as descriptors leads to errors in prediction on the test set in the ~ 0.65–0.95 pIC50 units range, which are comparable to the estimated uncertainty of bioactivity data in ChEMBL (0.76–1.00 pIC50 units). We find that the predictive power of QAFFP is slightly worse than that of Morgan2 fingerprints and 1D and 2D physicochemical descriptors, with an effect size in the 0.02–0.08 pIC50 units range. Including QSAR models with low predictive power in the generation of QAFFP does not lead to improved predictive power. Given that the QSAR models we used to compute the QAFFP were selected on the basis of data availability alone, we anticipate better modeling results for QAFFP generated using more diverse and biologically meaningful targets. Data sets and Python code are publicly available at https://github.com/isidroc/QAFFP_regression.
Keywords: QSAR, Affinity fingerprints, ChEMBL, Bioactivity modeling, Cytotoxicity, Drug sensitivity prediction, Drug sensitivity
Introduction
A major research question in Quantitative Structure–Activity Relationship (QSAR) has been (and still is) how to numerically encode small molecules [1–4]. Compound descriptors are generally calculated using 2-dimensional (2D) or 3-D representations of chemical structures as a starting point (although sometimes even simpler 1-D descriptors are also used, e.g., atom counts or molecular weight [5, 6]). The underlying idea when these descriptors are used to generate QSAR models is the ‘Molecular Similarity Principle’, which states that the bioactivities of structurally similar compounds tend to be correlated more often than those of dissimilar ones [7, 8]. Although compound descriptors based on the chemical structure are customarily used today in similarity searching and QSAR, they suffer from the limitation that they can only provide accurate predictions for structurally similar compounds, where the above principle holds. However, in case of e.g., ‘activity cliffs’ [9], different scaffolds binding to the same protein, or different binding sites, there are exceptions to this principle, and molecular descriptors based purely on molecular structure will not be sufficiently information-rich in order to handle such multi-modal models very well. Hence, the information that can be gathered about the bioactivities of structurally dissimilar compounds on the basis of their chemical structure alone is often limited.
A conceptually different approach is the quantification of compound similarity on the basis of the similarity of their bioactivity profiles instead of the similarity of their chemical structures [10–12]. The underlying principle, similarity in bioactivity space, is that compounds displaying correlated bioactivity endpoints across a set of assays (e.g., assays based on the activity of a purified protein, or cell-based assays) are likely to display similar activities also on other assays (which conceptually can then be modelled as a linear combination, or more complex function, of the input assay panel activities [13]). The set of bioactivities across a panel of assays are usually known as affinity, bioactivity, protein or high-throughput screening fingerprints [12–15]. Note that the term ‘affinity fingerprint’ is often used even when the bioactivity endpoints are not Ki nor Kd values, but rather assay-specific metrics of potency, such as IC50 or EC50 values, so it comprises a broad set of activity spectra-based descriptors. In the following and in the accompanying manuscript, we use the term affinity fingerprint to refer to the set of biological endpoints, experimentally determined or predicted, irrespective of whether the endpoint measured corresponds to a potency or an affinity metric. For a comprehensive review of existing methods to predict affinity fingerprints using existing high-throughput data [16–28], the reader is referred to the introduction of the accompanying manuscript [29].
Affinity fingerprints encode information about the many interactions (both strong and weak) between a given compound and its targets, and thus permit to model complex biological endpoints, such as human toxicity and in vitro cancer cell line sensitivity, and provide complementary signal to chemical structure information [30, 31]. Current predictive methods use either structural information of compounds as descriptors to model their activity on a single target (i.e., QSAR [32]), or assay activity as covariates to model the activity of a single compound across a target panel [33–35]. The latter strategy suffers from the limitation that in order to make predictions on novel targets these need to be experimentally profiled in the same way as those in the training set. In contrast, QSAR methods permit, to the extent the training data allows extrapolation in chemical space [36], to make predictions on new molecules more scalable, as the computation of compound descriptors only requires the chemical structure as input. Therefore, designing computational tools to model assay readouts using the chemical structure of compounds as input would permit to predict in silico the affinity fingerprint for a molecule of interest without the need for experimental testing, which in turn could provide a better description of the relevant variance connecting chemical and biological space.
The construction of such in silico affinity fingerprints, termed QSAR-derived Quantitative Affinity Fingerprints (QAFFPs), is described in the accompanying manuscript [29] where their performance for similarity searching, compound activity classification and scaffold hopping is reported. The range of application of QAFFP is further enhanced in the present manuscript, in which the use of QAFFPs in regression settings is studied. Specifically, QAFFPs were assessed to model in vitro potency on a continuous scale across 43 diverse data sets (Fig. 1 and Tables 1, 2). For each compound in each data set, the predictions generated by a set of 1360 QSAR models (termed base models) trained on IC50, EC50, Ki and Kd data were recorded. These vectors of predicted activities, i.e., QAFFP, were then used as compound descriptors to build QSAR models. To benchmark the predictive power of QAFFP, we assembled 18 diverse cytotoxicity data sets from ChEMBL, and constructed QSAR models using cross-validation. In addition, we also used 25 additional protein target QSAR data sets from ChEMBL for validation. The compounds were encoded using either circular Morgan fingerprints [37], 1-D and 2-D physicochemical descriptors, or QAFFP fingerprints. Hence, this framework allowed us to evaluate the predictive power of QAFFP fingerprints across a wide range of bioactivity prediction models.
Fig. 1.
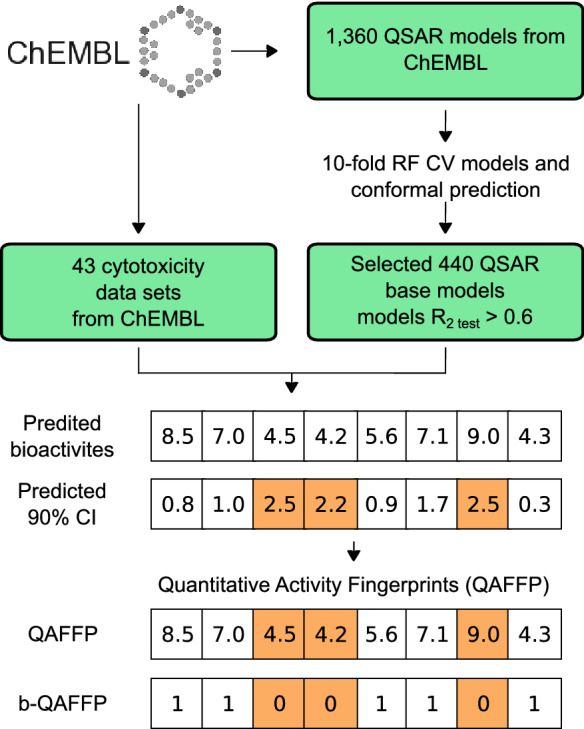
Overview of the workflow used in this study. We initially assembled and modelled 1360 data sets from ChEMBL database using RF (Random Forest) and conformal prediction. Of these, 440 displayed high predictive power in cross validation (q2 > 0.5) and on external molecules (R2test set > 0.6), and hence, were selected to build QAFFP fingerprints for 18 cytotoxicity and 25 protein target data sets (Tables 1 and 2) assembled from ChEMBL database as well. To benchmark the predictive signal of QAFFP, we compared the performance of RF models trained on QAFFP against models generated using Morgan2 fingerprints or 1-D and 2-D physicochemical descriptors across a diverse set of 43 bioactivity data sets (Tables 1 and 2)
Table 1.
Cytotoxicity data sets used in this study
| Cell line | Cell line description | ChEMBL assay ID | Cellosaurus ID | Organism of origin | Number of bioactivity data points |
|---|---|---|---|---|---|
| A2780 | Ovarian carcinoma cells | CHEMBL3308421 | CVCL_0134 | Homo sapiens | 2255 |
| CCRF-CEM | T-cell leukemia | CHEMBL3307641 | CVCL_0207 | Homo sapiens | 3047 |
| DU-145 | Prostate carcinoma | CHEMBL3308034 | CVCL_0105 | Homo sapiens | 2512 |
| HCT-116 | Colon carcinoma cells | CHEMBL3308372 | CVCL_0291 | Homo sapiens | 6231 |
| HCT-15 | Colon adenocarcinoma cells | CHEMBL3307945 | CVCL_0292 | Homo sapiens | 994 |
| HeLa | Cervical adenocarcinoma cells | CHEMBL3308376 | CVCL_0030 | Homo sapiens | 7532 |
| HepG2 | Hepatoblastoma cells | CHEMBL3307718 | CVCL_0027 | Homo sapiens | 3897 |
| HL-60 | Promyeloblast leukemia cells | CHEMBL3307654 | CVCL_0002 | Homo sapiens | 4637 |
| HT-29 | Colon adenocarcinoma cells | CHEMBL3307768 | CVCL_0320 | Homo sapiens | 5630 |
| K562 | Erythroleukemia cells | CHEMBL3308378 | CVCL_0004 | Homo sapiens | 4160 |
| KB | Squamous cell carcinoma | CHEMBL3307959 | CVCL_0372 | Homo sapiens | 2731 |
| L1210 | Lymphocytic leukemia cells | CHEMBL3308391 | CVCL_0382 | Mus musculus | 4873 |
| LoVo | Colon adenocarcinoma cells | CHEMBL3307691 | CVCL_0399 | Homo sapiens | 1120 |
| MCF7 | Breast carcinoma cells | CHEMBL3308403 | CVCL_0031 | Homo sapiens | 12,001 |
| MDA-MB-231 | Breast epithelial adenocarcinoma cells | CHEMBL3307960 | CVCL_0062 | Homo sapiens | 3482 |
| NCI-H460 | Non-small cell lung carcinoma | CHEMBL3307677 | CVCL_0459 | Homo sapiens | 2277 |
| PC-3 | Prostate carcinoma cells | CHEMBL3307570 | CVCL_ NIRG—MRC0035 | Homo sapiens | 4294 |
| SK-OV-3 | Ovarian carcinoma cells | CHEMBL3307746 | CVCL_0532 | Homo sapiens | 1589 |
Table 2.
Protein target data sets used in this study
| Target preferred name | Target abbreviation | Uniprot ID | ChEMBL ID | Number of bioactivity data points |
|---|---|---|---|---|
| Alpha-2a adrenergic receptor | A2a | P08913 | CHEMBL1867 | 203 |
| Tyrosine-protein kinase ABL | ABL1 | P00519 | CHEMBL1862 | 773 |
| Acetylcholinesterase | Acetylcholinesterase | P22303 | CHEMBL220 | 3159 |
| Androgen Receptor | Androgen | P10275 | CHEMBL1871 | 1290 |
| Serine/threonine-protein kinase Aurora-A | Aurora-A | O14965 | CHEMBL4722 | 2125 |
| Serine/threonine-protein kinase B-raf | B-raf | P15056 | CHEMBL5145 | 1730 |
| Cannabinoid CB1 receptor | Cannabinoid | P21554 | CHEMBL218 | 1116 |
| Carbonic anhydrase II | Carbonic | P00918 | CHEMBL205 | 603 |
| Caspase-3 | Caspase | P42574 | CHEMBL2334 | 1606 |
| Thrombin | Coagulation | P00734 | CHEMBL204 | 1700 |
| Cyclooxygenase-1 | COX-1 | P23219 | CHEMBL221 | 1343 |
| Cyclooxygenase-2 | COX-2 | P35354 | CHEMBL230 | 2855 |
| Dihydrofolate reductase | Dihydrofolate | P00374 | CHEMBL202 | 584 |
| Dopamine D2 receptor | Dopamine | P14416 | CHEMBL217 | 479 |
| Norepinephrine transporter | Ephrin | P23975 | CHEMBL222 | 1740 |
| Epidermal growth factor receptor erbB1 | erbB1 | P00533 | CHEMBL203 | 4868 |
| Estrogen receptor alpha | Estrogen | P03372 | CHEMBL206 | 1705 |
| Glucocorticoid receptor | Glucocorticoid | P04150 | CHEMBL2034 | 1447 |
| Glycogen synthase kinase-3 beta | Glycogen | P49841 | CHEMBL262 | 1757 |
| HERG | HERG | Q12809 | CHEMBL240 | 5207 |
| Tyrosine-protein kinase JAK2 | JAK2 | O60674 | CHEMBL2971 | 2655 |
| Tyrosine-protein kinase LCK | LCK | P06239 | CHEMBL258 | 1352 |
| Monoamine oxidase A | Monoamine | P21397 | CHEMBL1951 | 1379 |
| Mu opioid receptor | Opioid | P35372 | CHEMBL233 | 840 |
| Vanilloid receptor | Vanilloid | Q8NER1 | CHEMBL4794 | 1923 |
Methods
Data collection and curation
We gathered IC50 data for 18 cancer cell lines from ChEMBL database version 23 using the chembl_webresource_client python module [38–40]. To gather high-quality data, we only kept IC50 values corresponding to molecules that satisfied the following filtering criteria [41]: (i) molecule type equal to “Small molecule”, (ii) activity unit equal to “nM”, and (iii) activity relationship equal to “=”. The average pIC50 value was calculated when multiple IC50 values were annotated for the same compound-cell line pair. IC50 values were modeled in a logarithmic scale (pIC50 = − log10 IC50 [M]). Further information about the data sets is given in Table 1 and in a previous study by the authors [42]. We also collected 25 QSAR data sets for validation from previous work by the authors (Table 2) [42–44]. All data sets used in this study, as well as the code required to generate the results presented herein, are publicly available at https://github.com/isidroc/QAFFP_regression. The distribution of bioactivity values for all data sets is reported in Additional file 1: Figure S1.
Molecular representation
The Innovative Medicines Initiative eTOX project standardizer (https://github.com/flatkinson/standardiser) was used to normalize all chemical structures reported here to a common representation scheme using the default options. This normalization step is crucial for the generation of compound descriptors, as these (except for e.g., heavy atom counts) generally depend on a consistent representation of molecular properties, such as aromaticity of ring systems, tautomer representation or protonation states. Entries corresponding to entirely inorganic structures were removed. In the case of organic molecules, the largest fragment was kept in order to filter out counterions following standard procedures in the field [45, 46], and salts were neutralized.
QSAR-based activity fingerprints (QAFFP)
The protocol to calculate QSAR-based affinity fingerprints using ChEMBL data is explained in detail in the accompanying manuscript [29]. In brief, the workflow can be summarized in the following five steps (Fig. 1):
We initially gathered a total of 1360 QSAR data sets from ChEMBL version 19. We considered both human and non-human protein targets, and EC50 (173 targets), IC50 (786), Ki (365), and Kd (36) values as bioactivity endpoints. We only considered measurements with an activity relationship equal to ‘=’ and activity values reported in ‘nM’ units. The mean value was used as the activity value when multiple measurements were annotated for the same compound-protein pair only if the standard deviation of all annotated measurements was lower than 0.5; otherwise the data point was not further considered.
To model these data sets, we trained tenfold CV RF models using 30% of the data as the test set, and Morgan2 fingerprints as compound descriptors. We term these models base models. A total of 440 models (376 unique targets) displayed an average R2test value > 0.6, and a cross-validation q2 value > 0.5. These cut-off values are a reasonable choice to identify models with high predictive power on unseen data (although we note that the minimum predictive power required for a model to be useful in practice depends on the context in which it is applied, e.g., poor predictive performance might be useful in hit identification but not in lead optimization) [47].
The cross-validation predictions served to build a cross-conformal predictor for each of the 1360 base models as previously described [48].
To calculate QAFFP for the compounds in the 18 cytotoxicity and 25 protein target data sets, we used the base models to calculate point predictions (i.e., IC50, EC50, Kd, and Ki values), and calculated confidence intervals (90% confidence) for each individual prediction using the corresponding conformal predictor. Hence, for a given compound we computed (i) a 1360-dimensional fingerprint, where each bit corresponds to the predicted activity for that compound using one of the 1360 base models considered, and (ii) a 1360-dimensional vector recording the prediction errors calculated using conformal prediction.
- Next, we combined the point predictions and the predicted confidence intervals to define three types of QAAFP (Fig. 1):
- Real-valued QAFFP (rv-QAFFP): This type of fingerprint is defined by the point predictions computed using the base models. We defined two types of rv-QAFFP fingerprints: “rv-QAFFP 440” fingerprints were computed using the 440 base models showing high predictive power on unseen data as explained above, whereas “rv-QAFFP 1360” fingerprints were calculated using the 1360 base models irrespective of their predictive power on the test set.
- Binary QAFFP (b-QAFFP 440): To construct “b-QAFFP 440” fingerprints we set to one 1 all positions in the rv-QAFFP 440 fingerprint corresponding to predictions lying above a given activity cutoff (in this case 5 pIC50 units), and which are within the applicability domain (AD) of the underlying base model. We consider that a prediction is within the AD of a base model if the predicted confidence interval is lower than 2 pIC50 units, (i.e., the predicted confidence interval is no wider than +/− 2). Thus, all values that lie below the affinity cutoff but are still within model AD were encoded using zeros. The value was set to zero as well for predictions lying outside the model AD, following the assumption that a compound is more likely to be inactive than active. Thus, this corresponds to setting to one those bits corresponding to the targets with which a given compound is predicted to interact even at low compound concentrations, while also taking into account the confidence of the prediction.
In the case of the 25 protein target data sets (Table 2), base models trained on bioactivity data from these targets or their orthologues were excluded, and thus not considered to compute QAFFP for these data sets.
As a baseline method for comparisons, we considered RF models trained on Morgan fingerprints [37], and physicochemical descriptors. We computed circular Morgan fingerprints using RDkit (release version 2013.03.02) [37, 49]. The radius was set to 2 and the fingerprint length to 1024. Thus, we refer to Morgan fingerprints as Morgan2 hereafter. Morgan fingerprints encode compound structures by considering radial atom neighborhoods. The choice of Morgan fingerprints as a base line method to compare the performance of QSAR-derived affinity fingerprints was motivated by the high retrieval rates obtained with Morgan fingerprints in benchmarking studies of compound descriptors [50, 51]. A total of 200 1-D and 2-D physicochemical descriptors (abbreviated as Physchem hereafter) were also computed using RDkit and used to generate QSAR models. We also combined Morgan2 fingerprints, physicochemical descriptors, and QAFFP to define combined descriptors, namely: rv-QAFFP 440 and Morgan2, rv-QAFFP 440 and Physchem, b-QAFFP 440 and Morgan2, b-QAFFP 440 and Physchem, rv-QAFFP 1360 and Morgan2, rv-QAFFP 1360 and Physchem. Thus, we considered a total of 11 types of descriptors to encode the compounds.
The Jaccard-Needham dissimilarity between pairs of compounds was computed using the function scipy.spatial.distance.jaccard from the python library SciPy [52].
Model training and performance evaluation
We trained Random Forest (RF) models using tenfold CV on 70% of the data selected at random. The performance was evaluated on the remaining 30% of the data (i.e., test set) by calculating the root mean squared error (RMSE) and the Pearson correlation coefficient (R2) for the observed against the predicted pIC50 values. We trained 50 models for all combinations of factor levels, giving rise to 23,650 models (43 data sets × 11 descriptors sets × 50 replicates). In each replicate, a different subset of the data was selected as the test set. The composition of the training and test sets across the 50 replicates for a given data set was the same for all fingerprint types. RF models and feature importance values were computed using the RandomForestRegressor class from the python library Scikit-learn [53].
RF are generally robust across a wide range of parameter values. In practice, a suitable choice for the number of trees in the Forest (ntrees) was shown to be 100 in previous work [54–56], as higher values do not generally lead to significantly higher predictive power, which we found to be also the case for these data sets (Additional file 1: Figure S2). Hence, we trained the RF models using 100 trees and the default values for all other parameters.
Experimental design
To benchmark the predictive power of QAFFP, Morgan2 fingerprints and physicochemical descriptors in a statistically robust manner we designed a balanced fixed-effect full-factorial experiment with replications [57]. We considered two factors, namely: (i) data set: 43 data sets considered, and (ii) descriptor: rv-QAFFP 440, b-QAFFP 440, rv-QAFFP 1360, Morgan2, Physchem, rv-QAFFP 440 and Morgan2, rv-QAFFP 440 and Physchem, b-QAFFP 440 and Morgan2, b-QAFFP 440 and Physchem, rv-QAFFP 1360 and Morgan2, rv-QAFFP 1360 and Physchem. In addition, we included an interaction term between the factors descriptor and data set to examine whether the performance of the descriptor types used vary across data sets.
This factorial design was studied with the following linear model:
where the response variable, RMSEi,j,k test, corresponds to the RMSE value for the predicted against the observed activities on the test set for a given data set, descriptor type and replicate. The factor levels “ovarian carcinoma cells A2780” (data set), and “Morgan2” (descriptor), were used as reference factor levels to calculate the intercept term of the linear model, μ0, which corresponds to the mean RMSEtest value for this combination of factor levels. The coefficients (slopes) for the other combinations of factor levels correspond to the difference between their mean RMSEtest value and the intercept. The error term, i,j,k, corresponds to the random error of each RMSEtest value, which are defined as . These errors are assumed to (i) be mutually independent, (ii) have an expectation value of zero, and (iii) have constant variance. The use of a linear model to assess the predictive power of QAFFPP, Morgan2 fingerprints and Physchem descriptors allowed to control for the variability across data sets, and to avoid that results were biased by elements such as the number of datapoints, data set modellability, etc.
The normality and homoscedasticity assumptions of the linear model were assessed with (i) quantile–quantile (Q–Q) plots and (ii) by visual inspection of the RMSEtest distributions, and (iii) by plotting the fitted RMSEtest values against the residuals [57]. Homoscedasticity means that the residuals are evenly distributed (i.e., equally dispersed) across the range of the RMSEtest values considered in the linear model. It is essential to examine this assumption to guarantee that the modeling errors (i.e., residuals) and the dependent variable are not correlated. A systematic bias of the residuals would indicate that they are not consistent with random error, and hence, they contain predictive information that should be included in the model.
Results and discussion
We initially sought to examine the differences between Morgan2 fingerprints and QAFFP in terms of how they encode the chemical space. To this aim, for each pair of compounds in the 18 cytotoxicity data sets considered (Table 1) we computed pairwise Jaccard-Needham dissimilarity values [52, 58] using Morgan2 fingerprints (similarity in chemical space; x-axis in Fig. 2), and pairwise Pearson correlation coefficients using rv-QAFFP 440 fingerprints (similarity in bioactivity space; y-axis in Fig. 2). Overall, we observe a negative and significant correlation (Pearson correlation, P < 0.001) between Jaccard-Needham dissimilarity and correlation in bioactivity space for all data sets. The pairwise correlation values calculated using rv-QAFFP are, as expected, highly correlated for pairs of structurally similar compounds (i.e., showing a low Jaccard-Needham dissimilarity; upper left-hand quadrant in the panels in Fig. 2). These results are consistent with the fact that QAFFP are computed using base models trained on Morgan2 fingerprints and with the similarity principle, as structurally similar compounds are expected to show correlated bioactivity profiles. A substantial fraction of compound pairs showing a relatively large degree of structural dissimilarity (Jaccard-Needham dissimilarity ~ 1) show high similarity in bioactivity space (upper right-hand quadrant in Fig. 2). For instance, compounds CHEMBL357519 and CHEMBL9011 (first row in Fig. 3) display comparable activities on the cell line KB (pIC50 = 6.57 and 7.56, respectively), and a Jaccard-Needham dissimilarity of 0.87. However, their rv-QAFFPs are highly correlated, with a Pearson correlation coefficient of 0.84 (P < 0.05). Another example is the pair of compounds CHEMBL31400 and CHEMBL1801792 in the HeLa data set (second row in Fig. 3), with pIC50 values of 7.16 and 7.10, respectively, a Jaccard-Needham dissimilarity of 0.86, and highly correlated rv-QAFFP 440 values (Pearson R2 = 0.80, P < 0.05). Overall, these results show that structurally dissimilar compounds displaying comparable pCI50 values (given the uncertainty of pIC50 data [41]) are often clustered closely in bioactivity space, as quantified by the correlation between their rv-QAFFP 440 values. This is also allowed according to the ‘Neighbourhood Behavior’ principle [59], which states that while similar molecules are expected to behave similarly or average, dissimilar molecules may display either dissimilar, but in some cases also similar properties.
Fig. 2.

Jaccard-Needham dissimilarity calculated using Morgan2 fingerprints, against Pearson correlation values calculated using rv-QAFFP 440 for all pairs of compounds in each data set. Only a randomly picked subset of the 18 cytotoxicity data sets is shown for illustration. Similar results were obtained for the other data sets
Fig. 3.

Examples of structurally dissimilar compounds, showing correlated rv-QAFFP 440 and similar pIC50 values. These examples illustrate that the similarity in bioactivity space is captured by the rv-QAFFP 440 even for structurally dissimilar compounds, underlining the importance of using multi-modal representations of chemical structures, beyond similarity in chemical descriptor space alone
To test whether encoding compounds using rv-QAFFP improves the modeling of compound activity, we generated RF models for the 18 cytotoxicity data sets (Table 1), as well as for 25 protein target data sets (Table 2) [42]. As a baseline for comparisons, we trained RF models using Morgan2 fingerprints or physicochemical descriptors, and quantified performance by calculating the RMSE and R2 values for the observed against the predicted pIC50 values for the compounds in the test set (Fig. 4 and Additional file 1: Figure S3). The average R2test values (n = 50) were above 0.6 for all data sets, indicating that Morgan2 fingerprints and physicochemical descriptors capture the aspects of molecular structure related to bioactivity, and hence permit to model compound activity for these data sets satisfactorily.
Fig. 4.

RMSEtest values calculated with models trained on each of the 11 descriptor types considered across the 43 data sets modelled in this study (18 cytotoxicity and 25 protein data sets; Tables 1 and 2). We trained 50 models for each combination of descriptor type and data set, each time holding a different subset of the data as test set. Overall, predictive models were obtained for all descriptor types, and the performance of different descriptor types varied across data sets modelled
We used the same modeling strategy to generate RF models using three types of QAFFP (b-QAFFP 440, rv-QAFFP 440, and rv-QAFFP 1360), and QAFFPs combined with Morgan2 fingerprints and physicochemical descriptors (see “Methods”). Overall, the models trained on QAFFP showed high predictive power, with R2 values in the 0.5–0.9 range, and RMSE values in the ~ 0.6–0.95 pIC50 units range (Fig. 4 and Additional file 1: Figure S3). These values are in agreement with the expected model performance given the uncertainty of pIC50 data from ChEMBL; i.e., the maximum Pearson correlation coefficient when modeling IC50 data from ChEMBL, which was estimated to be in the 0.51–0.85 range [41, 60]. Finally, we performed Y-scrambling experiments for all data sets [61]. To this aim, we shuffled the bioactivity values for the training set instances before model training. We obtained R2 values around 0 (P < 0.001) in all Y-scrambling experiments we performed (Additional file 1: Figure S4). Therefore, these results indicate that the predictive power of the models trained on QAFFP is not a consequence of spurious correlations.
To assess the relative performance of the 11 descriptor types defined in a statistically robust manner, we designed a factorial experiment (see “Methods”). The fitted linear model displayed an R2 value adjusted for the number of parameters equal to 0.90, and a standard error for the residuals equal to 0.03 (P < 10−15), indicating that the variability of model performance on the test set can be explained to a large extent by the data set and descriptor type used. The values for the coefficients, namely slopes and intercept, and their P values are reported in Additional file 2: Table S1. The verification of the model assumptions is reported in Fig. 5. We did not include the percentage of the data included in the test set as a covariate in the linear model because we observed that the relative performance of the descriptor types considered was overall constant across models trained on increasingly larger fractions of the data (Additional file 1: Figure S5).
Fig. 5.

Verification of the linear model assumptions. a Assumption of homoscedasticity of the residuals. Fitted values against the residuals. The residuals are centered around zero and, roughly, present a comparable dispersion across the range of values considered, indicating that the assumption of the homoscedasticity of the residuals is fulfilled. Assumption of the normality of the residuals, assessed with the distribution of the residuals (b) and a quantile–quantile (Q–Q) plot (c). The residuals follow a Gaussian distribution with zero mean, indicating that the assumption of the normality of the residuals is fulfilled. Overall, these results indicate that the assumptions of the linear model are fulfilled
The factorial analysis revealed a significant interaction between the factors data set and descriptor type (P < 10−15) indicating that the predictive power of the descriptor types considered varies across data sets. This can be observed in Fig. 4 as well, as the distances between the boxes vary across data sets; i.e., a given descriptor type leads to the highest predictive power for some data sets but not in others. For instance, the average RMSE value for rv-QAFFP 440 (red box) is higher than that corresponding to Morgan2 fingerprints (light blue box) when modeling the cell line data set A2780; however, the opposite is observed for the data set Cannabinoid (first panel in Fig. 4). Interestingly, combining Morgan2 fingerprints and QAFFP did not increase model performance, and models trained on the binary form of QAFFP (b-QAFFP) constantly led to lower predictive power as compared to rv-QAFFP (Fig. 4 and Additional file 1: Figure S3). Overall, these results suggest that the predictive signal provided by both fingerprints, at least when using RF, does not seem to be complementary.
Given the substantial diversity in performance of the 1360 base models used to generate QAFFP [29], we next sought to investigate whether we could better model the 18 cytotoxicity data sets by computing rv-QAFFP using only those base models showing high predictive power. To this end, we used increasingly higher cut-off values for the minimum R2test value a base model needs to show to be considered for the calculation of rv-QAFFP. That is, we hypothesized that removing from the rv-QAFFP those bits corresponding to moderately predictive base models might lead to a less noisy rv-QAFFP and a better description of the relevant variance connecting chemical and biological space, thus increasing predictive power. We found that rv-QAFFP built using base models with R2test > 0.60–0.65 lead to the lowest average RMSEtest values for the 18 cytotoxicity data sets (Fig. 6). Models trained on rv-QAFFP values generated with highly predictive base models (R2test > 0.8) only, leaving 76 based models to compute QAFFP, increased the average RMSEtest values by ~ 12–20%. One explanation for this might be that increasing the dimensionality of the QAFFP by including low predictive base models adds predictive signal, even if these generate inaccurate predictions [13]. However, we observed that including all 1360 base models to compute QAFFP (i.e., rv-QAFFP 1360) did not increase predictive power on the test set, indicating that base models with low predictive power do not add additional predictive signal (Fig. 7). It is also important to consider that RF models are generally robust to moderate noise levels when modeling QSAR data sets, and hence, low levels of noise are well tolerated, and, in fact, might even help to generate models robust to noisy input data [62, 63]. Together, these results indicate that although the predictions generated by moderately predictive base models might be noisy, they better explain the relevant variance connecting chemical and biological space [13], and that including base models with low predictive power does not add additional predictive signal to improve the modelling of these data sets.
Fig. 6.

RMSEtest values obtained with models trained on rv-QAFFP fingerprints calculated using only those base models with R2 values on the test set greater or equal than the cut-off value indicated in the x-axis. Each point corresponds to a replicate. Overall, the predictive power on the test set declines as the set of models included to generate the rv-QAFFP is reduced
Fig. 7.
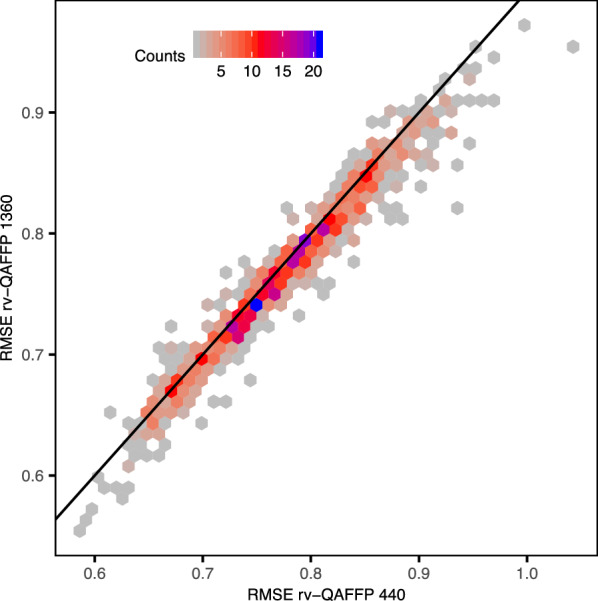
RMSE on the test set for predictive models trained on either rv-QAFFP 440 or rv-QAFFP 1360. The results for the 43 data sets and 50 replicates are shown. Overall, it can be seen that the performance of models trained on rv-QAFFP computed using base models with low and high predictive power (i.e., rv-QAFFP 1360) is comparable to the performance of models trained on rv-QAFFP (i.e., rv-QAFFP 440) computed using only base models showing high predictive power
We next analysed the predictive signal provided by each bit in the QAFFP, each one corresponding to a different base model, using the feature importance functionality of Random Forest models [64]. We did not observe a correlation between the predictive power of base models and the estimated variable importance across the 50 models generated for each descriptor and data set combination (Fig. 8). The contribution of each descriptor was variable across data sets, and in none of the cases the predictive power was driven by the contribution of few base models, but rather by the combination of weak contribution from many models (Additional file 1: Figure S6).
Fig. 8.

Analysis of feature importance. The variable importance averaged across 50 replicates for each feature in the QAFFP (i.e., base model) is shown against the predictive power of each base model in cross validation calculated during the training of base models. Overall, a correlation between predictive power and feature importance was not observed
Finally, we sought to investigate whether the activity of some compounds is better modelled by QAFFP in comparison to Morgan2 fingerprints. Such an evidence would support the use of QAFFP instead of, or in addition to, other compound descriptors in predictive bioactivity modeling. To this, we examined the correlation between the errors in prediction on the test set calculated with models trained on either Morgan2 fingerprints, one of the three types of QAFFP considered, or combinations thereof. It was found that 40.1–56.6%, and 73.7–86.2% of the test set instances were predicted with an absolute error in prediction below 0.5 and 1.0 pIC50 units, respectively by both Morgan2 and QAFFP-based models (Table 3). Although less than 0.5% of the test set instances were predicted with variable errors in prediction across models trained on different fingerprint types, the error in prediction for some compounds varies > 2 pIC50 units depending on the fingerprint type used for modeling (Additional file 1: Figures S7, S8). For instance, the error in prediction for compound CHEMBL2420625 is 1.93 pIC50 units (σ = 0.29; n = 50) for the Morgan2-trained model, whereas the error drops to 0.69 pIC50 units (σ = 0.16; n = 50) pIC50 units for models trained on QAFFP (Additional file 1: Figure S8).
Table 3.
Percentage of instances in the test set predicted using Morgan2-based and rv-QAFFP-based models showing an Absolute Error in Prediction (AEP) meeting the cut-off values indicated in the header
| Dataset | AEP Morgan2 and AEP rv-QAFFP 440 ≤ 0.5 | AEP Morgan2 and AEP rv-QAFFP 440 ≤ 1.0 | AEP Morgan2 ≥ 1.0 and AEP rv-QAFFP 440 ≤ ≤0.5 | AEP Morgan2 ≤ 0.5 and AEP rv-QAFFP 440 ≤ ≥ 1.0 | AEP Morgan2 ≥2.0 and AEP rv-QAFFP 440 ≤ ≤ 1.0 | AEP Morgan2 ≤ 1.0 and AEP rv-QAFFP 440 ≤ ≥ 2.0 | AEP Morgan2 ≥ 3.0 and AEP rv-QAFFP 440 ≤≤ 1.0 | AEP Morgan2 ≤ 1.0 and AEP rv-QAFFP 440 ≤ ≥ 3.0 |
|---|---|---|---|---|---|---|---|---|
| A2780 | 49.2 | 81.1 | 0.7 | 1.4 | 0.1 | 0.3 | 0.0 | 0.0 |
| CCRF-CEM | 46.3 | 78.1 | 0.5 | 1.7 | 0.1 | 0.2 | 0.0 | 0.0 |
| DU-145 | 52.4 | 83 | 0.4 | 1.4 | 0.1 | 0 | 0 | 0 |
| HCT-116 | 47.2 | 81.3 | 0.3 | 2.3 | 0 | 0.2 | 0 | 0 |
| HCT-15 | 40.2 | 74.7 | 1 | 3.8 | 0.2 | 0.3 | 0 | 0 |
| HeLa | 49.9 | 83.1 | 0.5 | 1.8 | 0.1 | 0.2 | 0 | 0 |
| HepG2 | 56.6 | 86.2 | 0.4 | 2.3 | 0.1 | 0.5 | 0 | 0.1 |
| HL-60 | 47.9 | 80.9 | 0.4 | 2.4 | 0 | 0.4 | 0 | 0 |
| HT-29 | 49.2 | 80.9 | 0.5 | 1.6 | 0 | 0.1 | 0 | 0 |
| K562 | 44.7 | 79.5 | 0.5 | 2.6 | 0 | 0.2 | 0 | 0 |
| KB | 40.1 | 74.6 | 0.6 | 3.1 | 0.1 | 0.5 | 0 | 0.1 |
| L1210 | 42.6 | 76.4 | 0.5 | 2.4 | 0.1 | 0.2 | 0 | 0 |
| LoVo | 49.3 | 79.8 | 0.6 | 1.7 | 0 | 0.1 | 0 | 0 |
| MCF7 | 50.1 | 82.8 | 0.4 | 2.8 | 0.1 | 0.4 | 0 | 0.1 |
| MDA-MB-231 | 53.7 | 84.9 | 0.3 | 1.3 | 0 | 0.1 | 0 | 0 |
| NCI-H460 | 43.6 | 75.6 | 0.9 | 3.1 | 0.1 | 0.5 | 0 | 0.2 |
| PC-3 | 53.6 | 85.1 | 0.4 | 1.6 | 0 | 0.1 | 0 | 0 |
| SK-OV-3 | 40.6 | 73.7 | 0.7 | 4.1 | 0.1 | 0.4 | 0 | 0.1 |
To assemble the 18 cytotoxicity data sets used here, we included all IC50 values for a given cell line satisfying the stringent criteria described in “Methods” irrespective of the cytotoxicity assay used. We have previously shown that cytotoxicity measurements might vary considerably cross cytotoxicity assays [41]; others have shown that different biological conclusions might be obtained depending on the parameterization of the dose–response curves [65–69]. Hence, we anticipate that the performance of QAFFP might be higher when modeling proprietary bioactivity data generated under uniform experimental conditions and data analysis pipelines [15, 27]. Our results show that compound activity can be modelled on a continuous scale using the predicted activities on an unbiased selection of protein targets as compound descriptors. However, we note in particular that the base models used to generate QAFFP were selected on the basis of the amount of bioactivity data available in ChEMBL only, and on whether they could be satisfactorily modelled using Morgan2 fingerprints. Hence, no biological criteria were considered. As more public data become available, it will be possible to test whether including targets with high network connectivity in pathways involved in cytotoxicity, drug resistance, cell cycle, and other biological processes altered in specific cancer types and diseases, might lead to better modeling of compound activity [70]. Similarly, using biologically meaningful targets to construct QAFFP might provide a better stratification between active and inactive compounds in bioactivity space, and hence enable the generation of models with higher predictive power [33, 70, 71]. Another important aspect to consider is that the sensitivity of some cancer cell lines to certain chemicals with well-defined mechanisms of action depends on the modulation of one or few proteins or pathways [71–76]. In such cases, using compound activity on a small set of assays as descriptors, and univariate or low-dimensional models might be sufficient to accurately model drug response [33, 77]. Here, instead of focusing on specific targets associated to the activity of few compounds, we have considered a data-driven approach that can be applicable to (potentially) any compound irrespective of its mechanism of action.
Conclusions
This study complements the accompanying paper [Skuta et al.], where the performance of QAFFP for similarity searching, compound classification and scaffold hopping is reported. Here, we have performed a comprehensive assessment of the performance of regression models trained on QSAR-derived affinity fingerprints (QAFFP). QAFFP enabled the generation of highly predictive models, with RMSE values in the ~ 0.6–0.9 pIC50 units range, which is comparable to the predictive power obtained using Morgan2 fingerprints and physicochemical descriptors, as well as to the uncertainty of heterogeneous IC50 data in ChEMBL. This level of performance is in line with the high predictive power obtained with QAFFP in similarity searching, compound classification, and scaffold hopping tasks [Skuta et al.]. Notably, QAFFP calculated using base models showing high and moderate performance were more predictive than those trained on QAFFP generated using highly predictive models alone, and likely the increased ability to describe variance in the mapping from chemical to biological space seems to be the cause of this behaviour. To further evaluate the practical utility of QAFFP, future studies will be needed to challenge them in more complex scenarios, including the modeling of the synergistic or antagonistic effect of compound combinations [79–82], and to test whether the integration of QAFFP and cell line profiling data sets (e.g., basal gene expression profiles, or changes in gene expression induced upon compound administration) improves drug sensitivity modeling.
Supplementary information
Additional file 1: Figure S1. Distribution of pIC50 values for all data sets modelled in this study. Figure S2. Model performance on the test set as a function of the number of trees in the Random Forest models for a random selection of 18 data sets. Figure S3. R2test values calculated with models trained on each of the 11 descriptor types considered across the 43 data sets modelled in this study (related to Fig. 4). We trained 50 models for each combination of descriptor type and data set, each time holding a different subset of the data as test set. Figure S4. Y-scrambling experiments. R2test values calculated for models trained after shuffling the response variable are shown. Figure S5. RMSEtest values as a function of the fraction of the training data used as test set for all data sets. Figure S6. Mean variable importance +/− standard deviation averaged across 50 replicates. Only the top 20 descriptors are shown for each data set. Figure S7. Examples of compounds that were predicted with higher error by models trained on Morgan2 fingerprints than by models trained on rv-QAFFP 440. The predictions were calculated on the test set across 50 replicates. The mean and the standard deviation across these 50 replicates are shown. The data set is indicated below the compounds ChEMBL IDs. Figure S8. Predicted pIC50 values using models trained on the fingerprint type indicated in x-axis, against the predicted pIC50 values calculated using models trained using the fingerprint type indicated in the y-axis. The plot shows the predictions for 50 replicates for data set A2780. Similar results were obtained for the other data sets. Overall, it can be seen that the predictions generated by models trained using Morgan2 fingerprints and the rv-QAFFP 440 versions considered are highly correlated across the entire bioactivity range modelled.
Additional file 2: Table S1 Value and significance for the coefficients of the linear model used to assess the performance of the 11 descriptor types considered. The code and the 43 data sets used in this study are provided at https://github.com/isidroc/QAFFP_regression.
Acknowledgements
None.
Authors’ contributions
ICC, CS, and DS designed research. ICC analyzed the results and generated the figures. DS and CS generated the models to calculate QAFFP, and calculated QAFFP for all data sets. ICC, CS, and DS wrote the paper with substantial input from AB. All authors read and approved the final manuscript.
Funding
This project has received funding from the European Union’s Framework Programme For Research and Innovation Horizon 2020 (2014–2020) under the Marie Sklodowska-Curie Grant Agreement No. 703543 (I.C.C.). C.Š. and D.S. were supported by the Ministry of Education, Youth and Sports of the Czech Republic—Project number LM2015063 and by RVO 68378050-KAV-NPUI. Computational resources were provided by the CESNET LM2015042 and the CERIT Scientific Cloud LM2015085, provided under the programme “Projects of Large Research, Development, and Innovations Infrastructures”.
Ethics approval and consent to participate
Not applicable, as no human participants, data or tissue or animals are involved in this study.
Consent for publication
The authors agree to the conditions of submission, BioMed Central’s copyright and license agreement and article-processing charge (APC).
Competing interests
The authors declare no conflicts of interest.
Footnotes
Publisher's Note
Springer Nature remains neutral with regard to jurisdictional claims in published maps and institutional affiliations.
Contributor Information
Isidro Cortés-Ciriano, Email: icortes@ebi.ac.uk.
Ctibor Škuta, Email: ctibor.skuta@img.cas.cz.
Andreas Bender, Email: ab454@cam.ac.uk.
Daniel Svozil, Email: daniel.svozil@vscht.cz.
Supplementary information
Supplementary information accompanies this paper at 10.1186/s13321-020-00444-5.
References
- 1.Costello JC, Heiser LM, Georgii E, et al. A community effort to assess and improve drug sensitivity prediction algorithms. Nat Biotechnol. 2014;32:1202–1212. doi: 10.1038/nbt.2877. [DOI] [PMC free article] [PubMed] [Google Scholar]
- 2.Eduati F, Mangravite LM, Wang T, et al. Prediction of human population responses to toxic compounds by a collaborative competition. Nat Biotechnol. 2015;33:933–940. doi: 10.1038/nbt.3299. [DOI] [PMC free article] [PubMed] [Google Scholar]
- 3.Cortés-Ciriano I, Ain QU, Subramanian V, et al. Polypharmacology modelling using proteochemometrics: recent developments and future prospects. Med Chem Commun. 2015;6:24. doi: 10.1039/C4MD00216D. [DOI] [Google Scholar]
- 4.Menden MP, Iorio F, Garnett M, et al. Machine learning prediction of cancer cell sensitivity to drugs based on genomic and chemical properties. PLoS ONE. 2013;8:e61318. doi: 10.1371/journal.pone.0061318. [DOI] [PMC free article] [PubMed] [Google Scholar]
- 5.Yap CW. PaDEL-descriptor: an open source software to calculate molecular descriptors and fingerprints. J Comput Chem. 2011;32:1466–1474. doi: 10.1002/jcc.21707. [DOI] [PubMed] [Google Scholar]
- 6.Todeschini R, Consonni V. Handbook of molecular descriptors. Weinheim: Wiley; 2000. [Google Scholar]
- 7.Bender A, Glen RC. Molecular similarity: a key technique in molecular informatics. Org Biomol Chem. 2004;2:3204–3218. doi: 10.1039/B409813G. [DOI] [PubMed] [Google Scholar]
- 8.Johnson MA, Maggiora GM, American Chemical Society . Concepts and applications of molecular similarity. New York: Wiley; 1990. [Google Scholar]
- 9.Stumpfe D, Bajorath J. Exploring activity cliffs in medicinal chemistry. J Med Chem. 2012;55:2932–2942. doi: 10.1021/jm201706b. [DOI] [PubMed] [Google Scholar]
- 10.Petrone PM, Simms B, Nigsch F, et al. Rethinking molecular similarity: comparing compounds on the basis of biological activity. ACS Chem Biol. 2012;7:1399–1409. doi: 10.1021/cb3001028. [DOI] [PubMed] [Google Scholar]
- 11.Mason JS. Burger’s medicinal chemistry and drug discovery. Hoboken: Wiley; 2010. Use of biological fingerprints versus structure/chemotypes to describe molecules; pp. 481–504. [Google Scholar]
- 12.Kauvar LM, Higgins DL, Villar HO, et al. Predicting ligand binding to proteins by affinity fingerprinting. Chem Biol. 1995;2:107–118. doi: 10.1016/1074-5521(95)90283-X. [DOI] [PubMed] [Google Scholar]
- 13.Martin EJ, Polyakov VR, Zhu X-W, et al. All-Assay-Max2 pQSAR: activity predictions as accurate as four-concentration IC 50 s for 8558 novartis assays. J Chem Inf Model. 2019;59:4450–4459. doi: 10.1021/acs.jcim.9b00375. [DOI] [PubMed] [Google Scholar]
- 14.Briem H, Lessel UF (2000) In vitro and in silico affinity fingerprints: finding similarities beyond structural classes. In: Perspectives in drug discovery and design. Kluwer Academic Publishers, New York, pp 231–244
- 15.Martin EJ, Polyakov VR, Tian L, Perez RC. Profile-QSAR 2.0: kinase virtual screening accuracy comparable to four-concentration IC50s for realistically novel compounds. J Chem Inf Model. 2017;57:2077–2088. doi: 10.1021/acs.jcim.7b00166. [DOI] [PubMed] [Google Scholar]
- 16.Nidhi Glick M, Davies JW, Jenkins JL. Prediction of biological targets for compounds using multiple-category Bayesian models trained on chemogenomics databases. J Chem Inf Model. 2006;46:1124–1133. doi: 10.1021/ci060003g. [DOI] [PubMed] [Google Scholar]
- 17.Lessel UF, Briem H. Flexsim-X: a method for the detection of molecules with similar biological activity. J Chem Inf Comput Sci. 2002;40:246–253. doi: 10.1021/ci990439e. [DOI] [PubMed] [Google Scholar]
- 18.Koutsoukas A, Lowe R, KalantarMotamedi Y, et al. In silico target predictions: defining a benchmarking data set and comparison of performance of the multiclass Naïve Bayes and Parzen-Rosenblatt Window. J Chem Inf Model. 2013;53:1957–1966. doi: 10.1021/ci300435j. [DOI] [PubMed] [Google Scholar]
- 19.Koutsoukas A, Simms B, Kirchmair J, et al. From in silico target prediction to multi-target drug design: current databases, methods and applications. J Proteomics. 2011;74:2554–2574. doi: 10.1016/j.jprot.2011.05.011. [DOI] [PubMed] [Google Scholar]
- 20.Lounkine E, Keiser MJ, Whitebread S, et al. Large-scale prediction and testing of drug activity on side-effect targets. Nature. 2012;486:361–367. doi: 10.1038/nature11159. [DOI] [PMC free article] [PubMed] [Google Scholar]
- 21.Cheng T, Li Q, Wang Y, Bryant SH. Identifying compound-target associations by combining bioactivity profile similarity search and public databases mining. J Chem Inf Model. 2011;51:2440–2448. doi: 10.1021/ci200192v. [DOI] [PMC free article] [PubMed] [Google Scholar]
- 22.Peragovics Á, Simon Z, Brandhuber I, et al. Contribution of 2D and 3D structural features of drug molecules in the prediction of drug profile matching. J Chem Inf Model. 2012;52:1733–1744. doi: 10.1021/ci3001056. [DOI] [PubMed] [Google Scholar]
- 23.Peragovics Á, Simon Z, Tombor L, et al. Virtual affinity fingerprints for target fishing: a new application of drug profile matching. J Chem Inf Model. 2013;53:103–113. doi: 10.1021/ci3004489. [DOI] [PubMed] [Google Scholar]
- 24.Simon Z, Peragovics Á, Vigh-Smeller M, et al. Drug effect prediction by polypharmacology-based interaction profiling. J Chem Inf Model. 2012;52:134–145. doi: 10.1021/ci2002022. [DOI] [PubMed] [Google Scholar]
- 25.Poroikov V, Filimonov D, Lagunin A, et al. PASS: identification of probable targets and mechanisms of toxicity. SAR QSAR Environ Res. 2007;18:101–110. doi: 10.1080/10629360601054032. [DOI] [PubMed] [Google Scholar]
- 26.Fliri AF, Loging WT, Thadeio PF, Volkmann RA. Biological spectra analysis: linking biological activity profiles to molecular structure. Proc Natl Acad Sci USA. 2005;102:261–266. doi: 10.1073/pnas.0407790101. [DOI] [PMC free article] [PubMed] [Google Scholar]
- 27.Martin E, Mukherjee P, Sullivan D, Jansen J. Profile-QSAR: a novel meta-QSAR method that combines activities across the kinase family to accurately predict affinity, selectivity, and cellular activity. J Chem Inf Model. 2011;51:1942–1956. doi: 10.1021/ci1005004. [DOI] [PubMed] [Google Scholar]
- 28.Bender A, Jenkins JL, Glick M, et al. “Bayes affinity fingerprints” Improve retrieval rates in virtual screening and define orthogonal bioactivity space: when are multitarget drugs a feasible concept? J Chem Inf Model. 2006;46:2445–2456. doi: 10.1021/ci600197y. [DOI] [PubMed] [Google Scholar]
- 29.Škuta C, Cortés-Ciriano I, Dehaen W, Kříž P, van Westen GJP, Tetko IV, Bender A, Svozil D. QSAR-derived affinity fingerprints (part 1): fingerprint construction and modeling performance for similarity searching, bioactivity classification and scaffold hopping. J Cheminform. 2020;12:39. doi: 10.1186/s13321-020-00443-6. [DOI] [PMC free article] [PubMed] [Google Scholar]
- 30.Huang R, Xia M, Sakamuru S, et al. Modelling the Tox21 10 K chemical profiles for in vivo toxicity prediction and mechanism characterization. Nat Commun. 2016;7:1–10. doi: 10.1038/ncomms10425. [DOI] [PMC free article] [PubMed] [Google Scholar]
- 31.Shoemaker RH. The NCI60 human tumour cell line anticancer drug screen. Nat Rev Cancer. 2006;6:813–823. doi: 10.1038/nrc1951. [DOI] [PubMed] [Google Scholar]
- 32.Cherkasov A, Muratov EN, Fourches D, et al. QSAR modeling: where have you been? Where are you going to? J Med Chem. 2014;57:4977–5010. doi: 10.1021/jm4004285. [DOI] [PMC free article] [PubMed] [Google Scholar]
- 33.Barretina J, Caponigro G, Stransky N, et al. The cancer cell line encyclopedia enables predictive modelling of anticancer drug sensitivity. Nature. 2012;483:603–607. doi: 10.1038/nature11003. [DOI] [PMC free article] [PubMed] [Google Scholar]
- 34.de Waal L, Lewis TA, Rees MG, et al. Identification of cancer-cytotoxic modulators of PDE3A by predictive chemogenomics. Nat Chem Biol. 2016;12:102–108. doi: 10.1038/nchembio.1984. [DOI] [PMC free article] [PubMed] [Google Scholar]
- 35.Geeleher P, Cox NJ, Huang RS. Clinical drug response can be predicted using baseline gene expression levels and in vitro drug sensitivity in cell lines. Genome Biol. 2014;15:R47. doi: 10.1186/gb-2014-15-3-r47. [DOI] [PMC free article] [PubMed] [Google Scholar]
- 36.Netzeva TI, Worth A, Aldenberg T, et al. Current status of methods for defining the applicability domain of (quantitative) structure-activity relationships. The report and recommendations of ECVAM Workshop 52. Altern Lab Anim. 2005;33:155–173. doi: 10.1177/026119290503300209. [DOI] [PubMed] [Google Scholar]
- 37.Rogers D, Hahn M. Extended-connectivity fingerprints. J Chem Inf Model. 2010;50:742–754. doi: 10.1021/ci100050t. [DOI] [PubMed] [Google Scholar]
- 38.Nowotka M, Papadatos G, Davies M, et al Want Drugs? Use Python. 2016, arXiv160700378 arXiv.org ePrint Arch. https://arxiv.org/abs/160700378. Accessed 10 July 2018
- 39.Davies M, Nowotka M, Papadatos G, et al. ChEMBL web services: streamlining access to drug discovery data and utilities. Nucleic Acids Res. 2015;43:W612–W620. doi: 10.1093/nar/gkv352. [DOI] [PMC free article] [PubMed] [Google Scholar]
- 40.Gaulton A, Bellis LJ, Bento AP, et al. ChEMBL: a large-scale bioactivity database for drug discovery. Nucleic Acids Res. 2011;40:1100–1107. doi: 10.1093/nar/gkr777. [DOI] [PMC free article] [PubMed] [Google Scholar]
- 41.Cortés-Ciriano I, Bender A. How consistent are publicly reported cytotoxicity data? Large-scale statistical analysis of the concordance of public independent cytotoxicity measurements. ChemMedChem. 2015;11:57–71. doi: 10.1002/cmdc.201500424. [DOI] [PubMed] [Google Scholar]
- 42.Cortés-Ciriano I, Bender A. KekuleScope: prediction of cancer cell line sensitivity and compound potency using convolutional neural networks trained on compound images. J Cheminform. 2019;11:41. doi: 10.1186/s13321-019-0364-5. [DOI] [PMC free article] [PubMed] [Google Scholar]
- 43.Cortés-Ciriano I, Bender A. Reliable prediction errors for deep neural networks using test-time dropout. J Chem Inf Model. 2019;59:3330–3339. doi: 10.1021/acs.jcim.9b00297. [DOI] [PubMed] [Google Scholar]
- 44.Cortés-Ciriano I, Bender A. Deep confidence: a computationally efficient framework for calculating reliable prediction errors for deep neural networks. J Chem Inf Model. 2019;59:1269–1281. doi: 10.1021/acs.jcim.8b00542. [DOI] [PubMed] [Google Scholar]
- 45.Fourches D, Muratov E, Tropsha A. Trust, but verify: on the importance of chemical structure curation in cheminformatics and QSAR modeling research. J Chem Inf Model. 2010;50:1189–1204. doi: 10.1021/ci100176x. [DOI] [PMC free article] [PubMed] [Google Scholar]
- 46.O’Boyle NM, Sayle RA. Comparing structural fingerprints using a literature-based similarity benchmark. J Cheminform. 2016;8:36. doi: 10.1186/s13321-016-0148-0. [DOI] [PMC free article] [PubMed] [Google Scholar]
- 47.Roy K, Kar S, Das RN. Understanding the basics of QSAR for applications in pharmaceutical sciences and risk assessment. Cham: Springer; 2015. Selected statistical methods in QSAR; pp. 191–229. [Google Scholar]
- 48.Norinder U, Carlsson L, Boyer S, et al. Introducing conformal prediction in predictive modeling. A transparent and flexible alternative to applicability domain determination. J Chem Inf Model. 2014;54:1596–1603. doi: 10.1021/ci5001168. [DOI] [PubMed] [Google Scholar]
- 49.Landrum G RDKit: open-source cheminformatics. https://www.rdkit.org/. Accessed 12 Jan 2017
- 50.Bender A, Jenkins JL, Scheiber J, et al. How similar are similarity searching methods? A principal component analysis of molecular descriptor space. J Chem Inf Model. 2009;49:108–119. doi: 10.1021/ci800249s. [DOI] [PubMed] [Google Scholar]
- 51.Koutsoukas A, Paricharak S, Galloway WRJD, et al. How diverse are diversity assessment methods? A comparative analysis and benchmarking of molecular descriptor space. J Chem Inf Model. 2013;54:230–242. doi: 10.1021/ci400469u. [DOI] [PubMed] [Google Scholar]
- 52.Jones E, Oliphant E, Peterson P et al (2001) SciPy: open source scientific tools for python. http://www.scipy.org/
- 53.Pedregosa F, Varoquaux G, Gramfort A, et al. Scikit-learn: machine learning in python. J Mach Learn Res. 2011;12:2825–2830. [Google Scholar]
- 54.Sheridan RP. Using random forest to model the domain applicability of another random forest model. J Chem Inf Model. 2013;53:2837–2850. doi: 10.1021/ci400482e. [DOI] [PubMed] [Google Scholar]
- 55.Sheridan RP. Three useful dimensions for domain applicability in QSAR models using random forest. J Chem Inf Model. 2012;52:814–823. doi: 10.1021/ci300004n. [DOI] [PubMed] [Google Scholar]
- 56.Cortés-Ciriano I, van Westen GJP, Bouvier G, et al. Improved large-scale prediction of growth inhibition patterns on the NCI60 cancer cell-line panel. Bioinformatics. 2016;32:85–95. doi: 10.1093/bioinformatics/btv529. [DOI] [PMC free article] [PubMed] [Google Scholar]
- 57.Winer B, Brown D, Michels K. Statistical principles in experimental design. 3. New York: McGraw-Hill; 1991. [Google Scholar]
- 58.Kosub S. A note on the triangle inequality for the Jaccard distance. Pattern Recognit Lett. 2019;120:36–38. doi: 10.1016/j.patrec.2018.12.007. [DOI] [Google Scholar]
- 59.Patterson DE, Cramer RD, Ferguson AM, et al. Neighborhood behavior: a useful concept for validation of “molecular diversity” descriptors. J Med Chem. 1996;39:3049–3059. doi: 10.1021/jm960290n. [DOI] [PubMed] [Google Scholar]
- 60.Kalliokoski T, Kramer C, Vulpetti A, Gedeck P. Comparability of mixed IC50 data—a statistical analysis. PLoS ONE. 2013;8:e61007. doi: 10.1371/journal.pone.0061007. [DOI] [PMC free article] [PubMed] [Google Scholar]
- 61.Rücker C, Rücker G, Meringer M. y-Randomization and its variants in QSPR/QSAR. J Chem Inf Model. 2007 doi: 10.1021/CI700157B. [DOI] [PubMed] [Google Scholar]
- 62.Cortés-Ciriano I, Bender A, Malliavin TE, et al. Comparing the influence of simulated experimental errors on 12 machine learning algorithms in bioactivity modeling using 12 diverse data sets. J Chem Inf Model. 2015;55:1413–1425. doi: 10.1021/acs.jcim.5b00101. [DOI] [PubMed] [Google Scholar]
- 63.Cortés-Ciriano I, Bender A. Improved chemical structure–activity modeling through data augmentation. J Chem Inf Model. 2015;55:2682–2692. doi: 10.1021/acs.jcim.5b00570. [DOI] [PubMed] [Google Scholar]
- 64.Kuz’min VE, Polishchuk PG, Artemenko AG, Andronati SA. Interpretation of QSAR models based on random forest methods. Mol Inform. 2011;30:593–603. doi: 10.1002/minf.201000173. [DOI] [PubMed] [Google Scholar]
- 65.Safikhani Z, Freeman M, Smirnov P, et al. Revisiting inconsistency in large pharmacogenomic studies. F1000Research. 2017;5:2333. doi: 10.12688/f1000research.9611.3. [DOI] [PMC free article] [PubMed] [Google Scholar]
- 66.Haibe-Kains B, El-Hachem N, Birkbak NJ, et al. Inconsistency in large pharmacogenomic studies. Nature. 2013;504:389–393. doi: 10.1038/nature12831. [DOI] [PMC free article] [PubMed] [Google Scholar]
- 67.Fallahi-Sichani M, Honarnejad S, Heiser LM, et al. Metrics other than potency reveal systematic variation in responses to cancer drugs. Nat Chem Biol. 2013;9:708–714. doi: 10.1038/nchembio.1337. [DOI] [PMC free article] [PubMed] [Google Scholar]
- 68.Hafner M, Niepel M, Chung M, Sorger PK. Growth rate inhibition metrics correct for confounders in measuring sensitivity to cancer drugs. Nat Meth. 2016;13:521–527. doi: 10.1038/nmeth.3853. [DOI] [PMC free article] [PubMed] [Google Scholar]
- 69.Consortium TG of DS in CCLE. Consortium TG of DS in CCLE. Stransky N, et al. Pharmacogenomic agreement between two cancer cell line data sets. Nature. 2015;528:84–87. doi: 10.1038/nature15736. [DOI] [PMC free article] [PubMed] [Google Scholar]
- 70.Módos D, Bulusu KC, Fazekas D, et al. Neighbours of cancer-related proteins have key influence on pathogenesis and could increase the drug target space for anticancer therapies. NPJ Syst Biol Appl. 2017;3:2. doi: 10.1038/s41540-017-0003-6. [DOI] [PMC free article] [PubMed] [Google Scholar]
- 71.Garnett MMJ, Edelman EEJ, Heidorn SJS, et al. Systematic identification of genomic markers of drug sensitivity in cancer cells. Nature. 2012;483:570–575. doi: 10.1038/nature11005. [DOI] [PMC free article] [PubMed] [Google Scholar]
- 72.Rodríguez-Antona C, Taron M. Pharmacogenomic biomarkers for personalized cancer treatment. J Intern Med. 2015;277:201–217. doi: 10.1111/joim.12321. [DOI] [PubMed] [Google Scholar]
- 73.Konecny GE, Kristeleit RS. PARP inhibitors for BRCA1/2-mutated and sporadic ovarian cancer: current practice and future directions. Br J Cancer. 2016;115:1157–1173. doi: 10.1038/bjc.2016.311. [DOI] [PMC free article] [PubMed] [Google Scholar]
- 74.Bitler BG, Watson ZL, Wheeler LJ, Behbakht K. PARP inhibitors: clinical utility and possibilities of overcoming resistance. Gynecol Oncol. 2017;147:695–704. doi: 10.1016/J.YGYNO.2017.10.003. [DOI] [PMC free article] [PubMed] [Google Scholar]
- 75.Underhill C, Toulmonde M, Bonnefoi H. A review of PARP inhibitors: from bench to bedside. Ann Oncol. 2011;22:268–279. doi: 10.1093/annonc/mdq322. [DOI] [PubMed] [Google Scholar]
- 76.Curtin N. PARP inhibitors for anticancer therapy. Biochem Soc Trans. 2014;42:82–88. doi: 10.1042/BST20130187. [DOI] [PubMed] [Google Scholar]
- 77.Nguyen L, Naulaerts S, Bomane A, et al (2018) Machine learning models to predict in vivo drug response via optimal dimensionality reduction of tumour molecular profiles. bioRxiv 277772. 10.1101/277772
- 78.Gulhan DC, Lee JJ-K, Melloni GEM, et al. Detecting the mutational signature of homologous recombination deficiency in clinical samples. Nat Genet. 2019;51:912–919. doi: 10.1038/s41588-019-0390-2. [DOI] [PubMed] [Google Scholar]
- 79.Dry JR, Yang M, Saez-Rodriguez J. Looking beyond the cancer cell for effective drug combinations. Genome Med. 2016;8:125. doi: 10.1186/s13073-016-0379-8. [DOI] [PMC free article] [PubMed] [Google Scholar]
- 80.Bulusu KC, Guha R, Mason DJ, et al. Modelling of compound combination effects and applications to efficacy and toxicity: state-of-the-art, challenges and perspectives. Drug Discov Today. 2015;21:225–238. doi: 10.1016/j.drudis.2015.09.003. [DOI] [PubMed] [Google Scholar]
- 81.Sidorov P, Naulaerts S, Ariey-Bonnet J, et al (2018) Predicting synergism of cancer drug combinations using NCI-ALMANAC data. bioRxiv 504076. 10.1101/504076 [DOI] [PMC free article] [PubMed]
- 82.Menden MP, Wang D, Mason MJ, et al. Community assessment to advance computational prediction of cancer drug combinations in a pharmacogenomic screen. Nat Commun. 2019;10:2674. doi: 10.1038/s41467-019-09799-2. [DOI] [PMC free article] [PubMed] [Google Scholar]
Associated Data
This section collects any data citations, data availability statements, or supplementary materials included in this article.
Supplementary Materials
Additional file 1: Figure S1. Distribution of pIC50 values for all data sets modelled in this study. Figure S2. Model performance on the test set as a function of the number of trees in the Random Forest models for a random selection of 18 data sets. Figure S3. R2test values calculated with models trained on each of the 11 descriptor types considered across the 43 data sets modelled in this study (related to Fig. 4). We trained 50 models for each combination of descriptor type and data set, each time holding a different subset of the data as test set. Figure S4. Y-scrambling experiments. R2test values calculated for models trained after shuffling the response variable are shown. Figure S5. RMSEtest values as a function of the fraction of the training data used as test set for all data sets. Figure S6. Mean variable importance +/− standard deviation averaged across 50 replicates. Only the top 20 descriptors are shown for each data set. Figure S7. Examples of compounds that were predicted with higher error by models trained on Morgan2 fingerprints than by models trained on rv-QAFFP 440. The predictions were calculated on the test set across 50 replicates. The mean and the standard deviation across these 50 replicates are shown. The data set is indicated below the compounds ChEMBL IDs. Figure S8. Predicted pIC50 values using models trained on the fingerprint type indicated in x-axis, against the predicted pIC50 values calculated using models trained using the fingerprint type indicated in the y-axis. The plot shows the predictions for 50 replicates for data set A2780. Similar results were obtained for the other data sets. Overall, it can be seen that the predictions generated by models trained using Morgan2 fingerprints and the rv-QAFFP 440 versions considered are highly correlated across the entire bioactivity range modelled.
Additional file 2: Table S1 Value and significance for the coefficients of the linear model used to assess the performance of the 11 descriptor types considered. The code and the 43 data sets used in this study are provided at https://github.com/isidroc/QAFFP_regression.