Abstract
New spectrophotometers and cuvettes have been designed to allow the measurement of absorbance values from samples using microliter volume sizes. These measurements are done using short pathlengths to decrease the sample volumes required. The major applications for these spectrophotometers and cuvettes are samples that are difficult to obtain in large amounts, such as proteins and nucleic acids that absorb light in the ultraviolet range. Existing ultraviolet absorbance standards have been designed for longer pathlength measurements. Standard Reference Material (SRM) 2082 was developed to validate the pathlengths of short-pathlength cuvettes and instruments using materials with absorbance spectra that are similar to the most commonly used samples. SRM 2082 consists of three individual components: a blank buffer solution, a solution of the amino acid tryptophan in the buffer, and a solution of the nucleobase uracil in the buffer. The tryptophan solution has an absorbance spectrum (peak at 280 nm) similar to proteins, and the uracil has an absorbance spectrum (peak at 260 nm) similar to nucleic acids. The absorbance values of these solutions were determined using a series of cuvettes with pathlengths from 0.1 mm to 2 mm. The pathlengths of the cuvettes used for the absorbance measurements were determined at the National Institute of Standards and Technology by physical and optical measurements. The effects of temperature and spectral bandwidth variations on the absorbance values of SRM 2082 were also investigated.
Keywords: absorbance, certified reference material, nucleic acid, pathlength, protein, spectrophotometer, standard, visible UV
1. Introduction
Absorbance spectroscopy is an essential measurement tool for the measurement and analysis of proteins [1] and nucleic acids [2]. However, these substances are often only available in very small amounts. The shorter pathlengths and limited areas of the sample available to measure represent significant challenges to ensure accurate concentration measurements. A major application of the new generation of microliter volume spectrophotometers is the analysis of valuable samples available in limited amounts. These spectrophotometers utilize short pathlengths and confined geometries to reduce the volume of sample required.
Standard Reference Material (SRM) 2082 is designed to validate the pathlength for reduced-pathlength spectrophotometers and cuvettes based on the absorbance values, and data are provided to correct for differences in the temperature of the measurements and spectral bandwidth of the spectrophotometer. We chose materials that have an absorbance spectrum in the ultraviolet (UV) range and that have similar absorbance characteristics to the biological samples that are frequently used with these instruments and devices. We chose low-molecular-weight molecules that comprise nucleic acids and proteins. This avoids changes in the three-dimensional structure that can cause changes in the observed absorbance, such as if a complex protein or nucleic acid standards were to be used. Uracil and tryptophan have similar UV absorbance spectra to nucleic acids and proteins, respectively, and they are stable in solution. They are both readily available in highly pure forms. Uracil is one of the bases found in ribonucleic acid (RNA) and has an absorbance spectrum (peak at 260 nm) that is similar to RNA and deoxyribonucleic acid (DNA) [3–6]. The amino acid tryptophan is one of the 20 amino acids naturally occurring in proteins, and it is the amino acid mainly responsible for the characteristic absorbance of proteins in the middle of the UV region (peak at 280 nm) [7, 8].
2. Materials and Methods
2.1. Samples
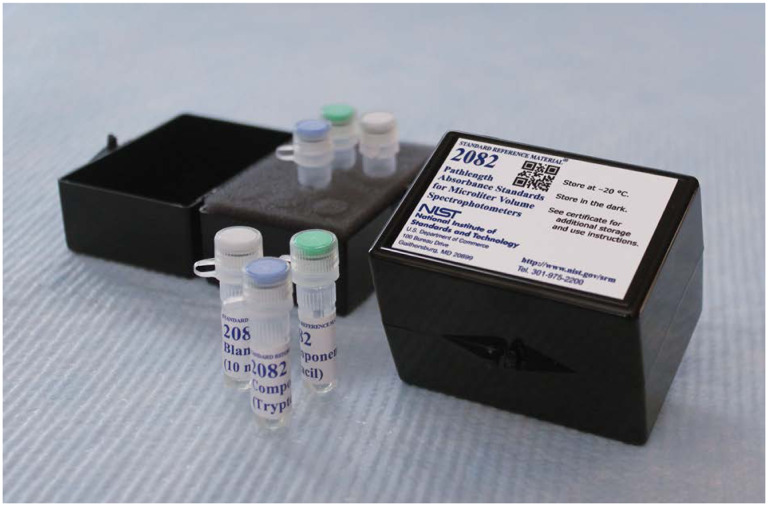
A solution consisting of 0.010 mol/L 2-amino-2-hydroxymethyl-propane-1,3 diol (TRIS) pH 8.0 buffer (TRIS buffer) was used to dissolve the components and was used as the blank. Component A was a solution of 0.0015 mol/L tryptophan in TRIS buffer. Component B was a solution of 0.001 mol/L uracil in TRIS buffer. Tryptophan and uracil were obtained from Sigma Chemical Company (St. Louis, MO, USA).1 Each solution (1.8 mL) was dispensed into 2 mL polypropylene screw-top (captured O-ring) vials. Figure 1 shows the components of SRM 2082. The SRM was stored frozen at −20 °C and in the dark to prevent degradation of the samples. The samples were warmed to room temperature and thoroughly mixed by inversion (20 times) before measuring.
Fig. 1.
Packaging of SRM 2082 showing the TRIS buffer, component A (tryptophan), and component B (uracil).
2.2. Certified Values Measured Using Calibrated Short-Pathlength Cuvettes
Cuvettes constructed from Spectrosil quartz were ordered from Starna (Atascadero, CA, USA) with pathlengths of 0.5 mm, 1 mm, and 2 mm. A second set of quartz cuvettes was obtained from Precision Cell. Inc. (Staten Island, NY, USA), with nominal pathlengths of 0.2 mm and 0.1 mm. The cuvettes were laser etched with identification codes to readily identify different cuvettes with the same nominal pathlength. The pathlengths of the 0.5 mm, 1.0 mm, and 2.0 mm cuvettes were measured by the National Institute of Standards and Technology (NIST) Dimensional Metrology Group using a Coordinate Measuring Machine with a fiber probe having a tip with an ellipsoidal geometry. The uncertainty for this instrument has been shown to have a standard deviation of ± 0.11 μm for measurements in one dimension.
Pathlengths for the 0.5 mm, 0.1 mm, and 0.2 mm cells were determined by using interference fringes in the near-infrared spectrum. The near-infrared spectra were measured with a Bruker Vertex 70 spectrophotometer, between 5500 cm−1 and 9800 cm−1. The pathlength for a cell was determined by the formula: , where b is the pathlength of the gap, r is the refractive index of air, and N is the number of fringes counted between wavenumbers v1 and v2. The cuvettes were found to be not completely parallel, since the calculated pathlength varied depending on the location on the cuvette where the measurement was made. Thus, to obtain a more reliable value for the pathlength, the near-infrared spectra of the cuvettes were acquired in the location where the beam for the Cary 6000 transfer instrument spectrophotometer intersected the cuvette [9]. The measurements assume that the cuvette walls are not completely parallel in the region investigated. The reduced height beam for the Cary spectrophotometer is approximately 5 mm high, and the near-infrared measurements were taken at the center of the beam path and at the two outside points of the beam path (2 mm from center). For a given cuvette, the average pathlength was estimated by assuming a linear change of the pathlength of the cell over the 5 mm distance where the beam would intersect the cuvette. For the set of points measured, confidence intervals were calculated over the beam path. The total uncertainty was calculated from the confidence intervals. Cuvettes were cleaned in 35 % nitric acid, rinsed with deionized water, and then vacuum dried prior to and in-between measurements.
2.3. Absorbance Measurements of NIST SRM 2082
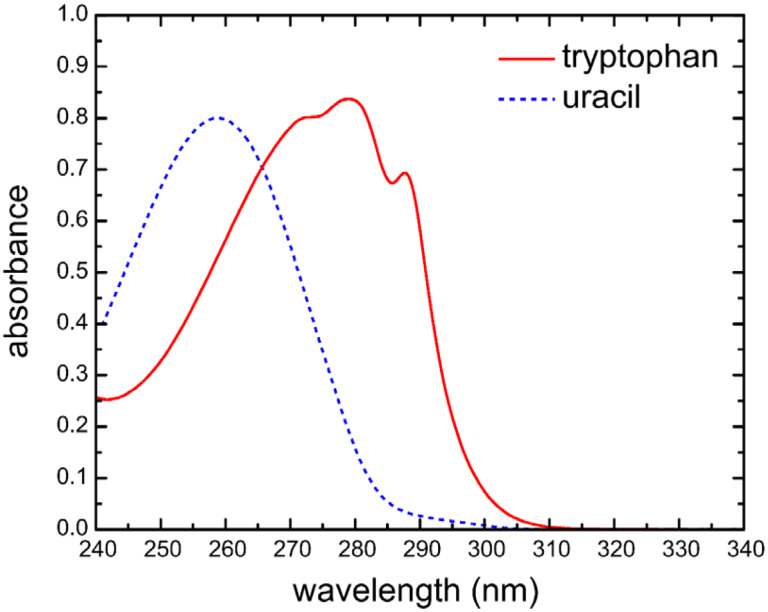
Primary absorbance measurements were made on the NIST Material Measurement Laboratory Cary transfer spectrophotometer that is traceable to the NIST high-accuracy spectrophotometer. The instrument was operated in double beam mode with a spectral bandwidth of 0.8 nm. The absorbance spectra were measured from 240 nm to 340 nm, at a scan rate of 20 nm/min and wavelength interval of 0.5 nm. Figure 2 shows the UV absorbance spectra for uracil and tryptophan. Measurements were made in the cuvette holder that was temperature controlled at 22 °C (± 0.05 °C), except when temperature-dependent measurements were made at the specified temperatures.
Fig. 2.
Absorbance spectrum of SRM 2082 component A (tryptophan) and component B (uracil) from 240 nm to 340 nm, over a 1 mm pathlength at 22 °C and 0.8 nm spectral bandwidth.
3. Results
3.1. Absorbance of Tryptophan and Uracil Components of SRM 2082
Absorbance measurements were made on the TRIS buffer, tryptophan solution, and uracil solution using the calibrated short-pathlength cuvettes on the Cary transfer spectrophotometer. It is important to make the measurements when the samples have come up to ambient temperature and are thoroughly mixed. A scan of the buffer (10 mM TRIS pH 8) was used to correct the absorbance spectrum of the tryptophan and uracil components. Figure 2 shows the absorbance spectra of the tryptophan and uracil components.
Replicate measurements were made by removing the old sample and adding a fresh sample to the cuvette. Absorbance measurements for each pathlength were bias corrected to the high-accuracy spectrophotometer. The data were baseline corrected using the buffer as a reference, which was subtracted from the uracil and tryptophan solutions. Since it was found that the absorbance spectra of the tryptophan and the uracil were the same as the buffer between 330 nm and 340 nm, the value of the spectrum for both solutions was set to 0 absorbance units (AU) at 340 nm.
The plots of both uracil and tryptophan versus pathlength show that for the cuvette pathlengths used in the certification process, the data are linear and thus obey the Beer-Lambert law (Fig. 3). From these data, we are then able to derive equations of the absorbance as a function of pathlength. The equation for absorbance with respect to pathlength, l, for each compound is as follows:
| (1) |
| (2) |
where the constants of the equations can be expressed as generic constant Ec. The equations given here were fit to the data using an orthogonal fitting method with the y-intercept set at 0. Uncertainty values for the equations can be derived from the standard deviation of the individual absorbance measurements and from the uncertainty of the instrument bias. The final expression for the absorbance and the associated uncertainty was determined using the R program for the statistical analysis.
Fig. 3.
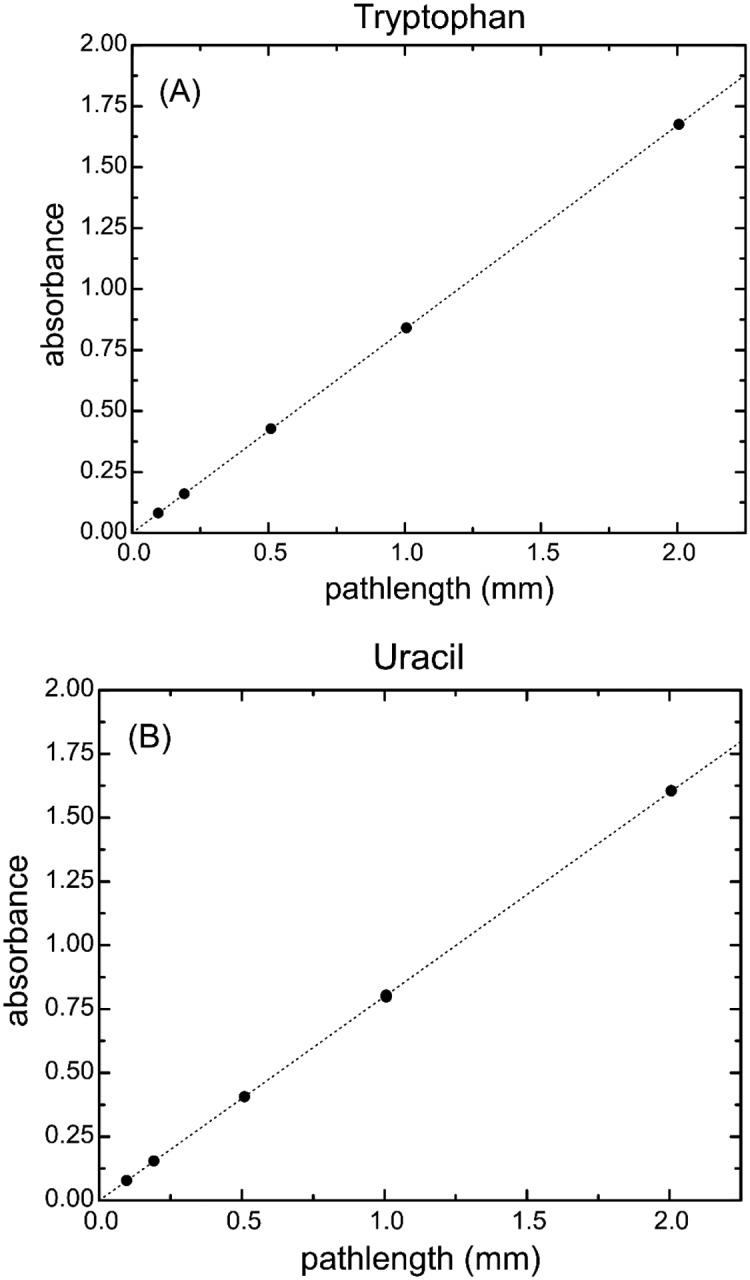
Bias-corrected absorbance versus cuvette pathlength for (A) the tryptophan solution at 280 nm and (B) the uracil solution at 260 nm. Standard deviations and the associated uncertainties for each measurement are smaller than the symbol size and are not shown in the figure.
3.2. Effect of Temperature on SRM 2082
The effect of temperature upon the absorbance of each solution was investigated between 18 °C and 30 °C for a 1 mm pathlength. The nominal temperature of the temperature controller was recorded against a calibrated thermistor inside a cuvette to obtain a calibration curve.
Samples were placed in the cuvette and then allowed to come to equilibrium at the current temperature before the measurement was made. The temperature controller was then set to the new temperature, and the sample was equilibrated to the new temperature before the measurement was done. The measurements were repeated for the buffer and the tryptophan and uracil SRM components. Subtraction of the buffer was made as described previously.
The absorbance change with respect to the reference temperature of 22 °C was calculated using the relation ΔtA = A22 °C – At, where At is the absorbance at temperature t (°C). The change in absorbance due to temperature was linear in the range from 18 °C to 30 °C, as can be seen in Fig. 4. While the tryptophan and uracil solutions showed a different response to the change in temperature, the temperature corrections may be expressed in the generic form:
| (3) |
where t is the temperature (°C), and a1 and a0 are constants, assuming a 1 mm pathlength. While the corrections are at most 0.004 absorbance units in the extreme case, this is an important factor and a potential source of error. For pathlengths other than 1 mm, the correction factor should be multiplied by the new pathlength (in mm) to obtain the proper value.
Fig. 4.
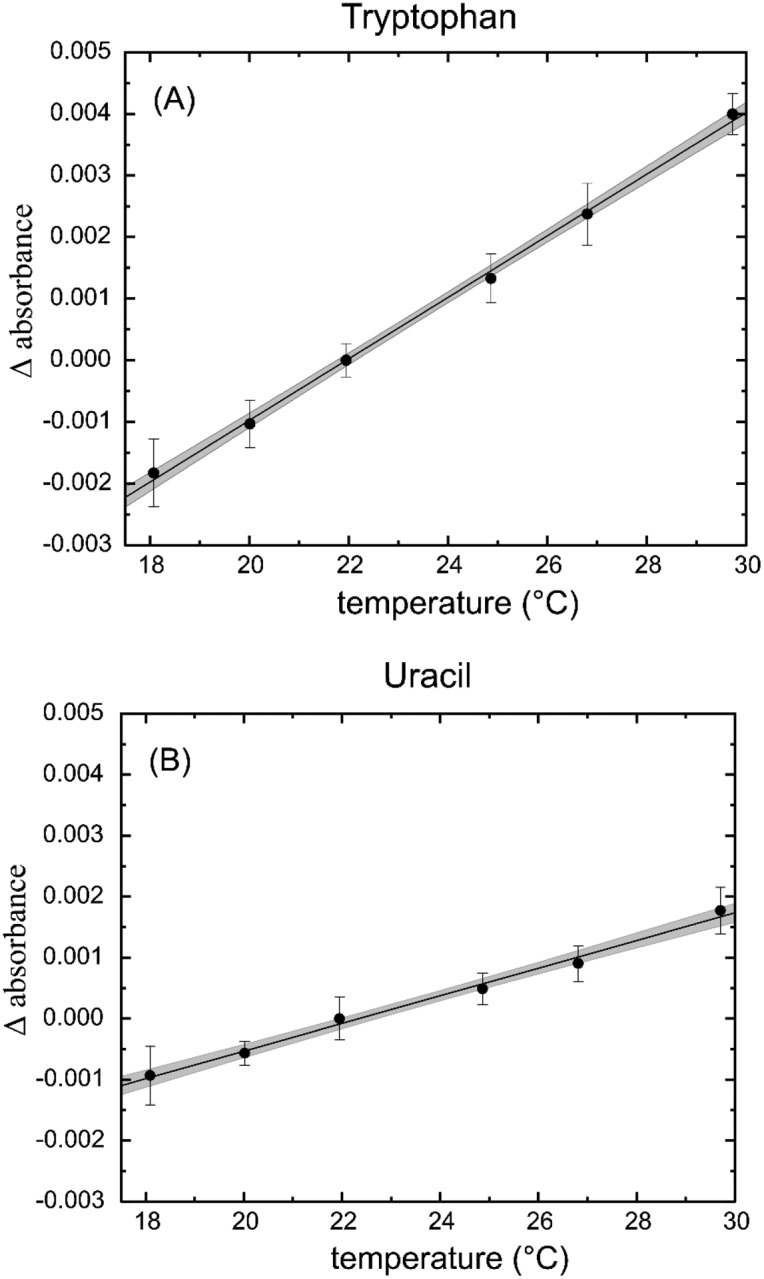
Change in absorbance due to temperature for (A) tryptophan at 280 nm and (B) uracil at 260 nm. The change in absorbance (Δ Absorbance) is calculated by ΔtA = A22 °C − At, where t is the measured temperature in degrees Celsius. The error bars are 1 standard deviation of the mean. The gray area around the line is the 95 % uncertainty calculation for the fit of the line to the data.
3.3. Effects of Spectral Bandwidth on SRM 2082
A final correction function for the absorbance measurements involves the effect of the spectral bandwidth (SBW) on the observed absorbance. Most reduced-pathlength spectrometers have a fixed spectral bandwidth larger than the 0.8 nm SBW used for the primary measurements.
The SBW of the transfer spectrophotometer was determined from 0.8 nm to 5.0 nm using the transmittance of two mercury lines at 253 nm and 297 nm. The full width at half maximum values of the peaks were calculated and used as the actual spectral bandwidth.
To determine the influence of the SBW on the SRM 2082, both the buffer and the standard solutions were measured at 22 °C as a function of SBW at 1 mm and 0.5 mm. The buffer-subtracted absorbance values of the tryptophan and uracil solutions for each SBW were calculated as before. The variations in absorbance with respect to the spectral bandwidth, ΔBA = A0.8 nm − Abandwidth, for the tryptophan and uracil solutions at 0.5 mm and 1 mm pathlengths are shown in Fig. 5.
Fig. 5.
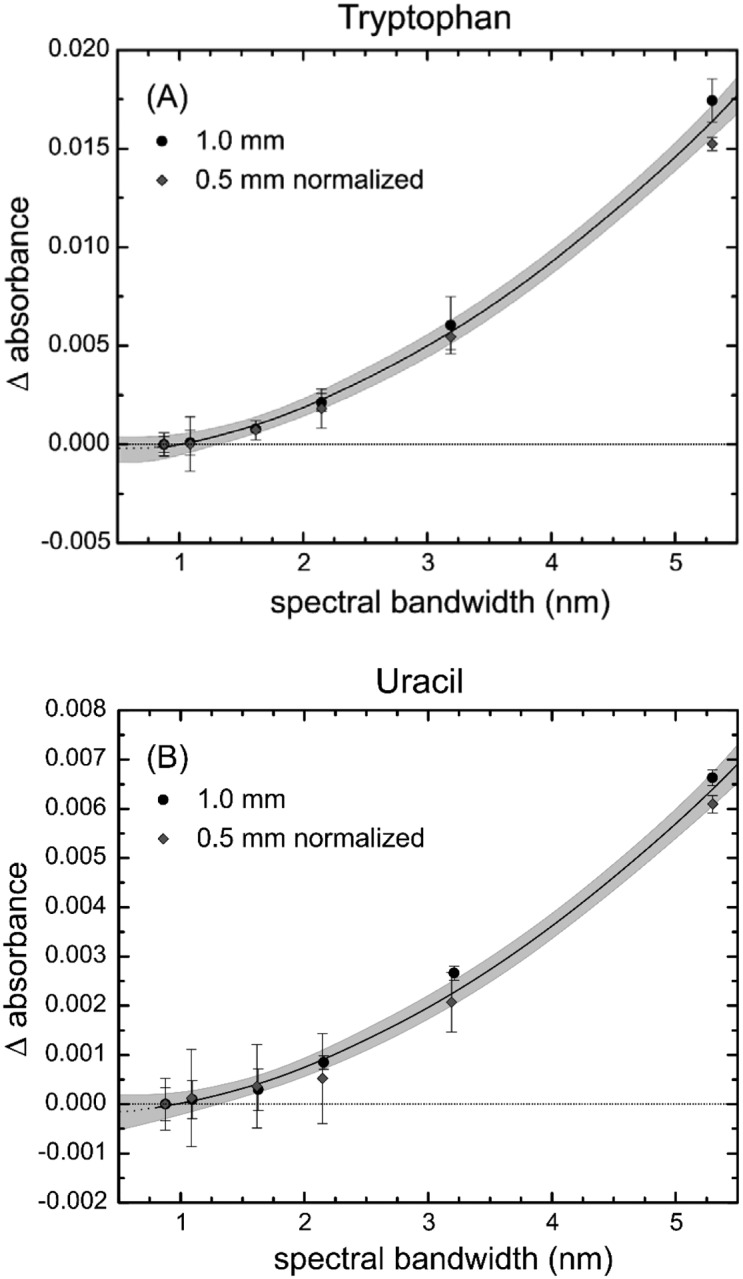
Change in absorbance as a function of spectral bandwidth for (A) tryptophan at 280 nm and (B) uracil at 260 nm. Data shown are for 1 mm pathlength and for 0.5 mm pathlength that has been normalized to 1 mm. Here, the change in absorbance (Δ Absorbance) is calculated by ΔBA = A0.8 nm − Abandwidth, where B is the spectral bandwidth in nm. The error bars are 1 standard deviation of the mean. The gray area around the line is the 95 % uncertainty calculation for the fit of the line to the data.
The correction factor for the spectral bandwidth between 0.8 nm and 5 nm for both tryptophan and uracil may be fit to a quadratic equation of the form:
| (4) |
where b2, b1, and b0 are constants, and Bλ is the spectral bandwidth (in nm). This correction factor can then be used in conjunction with the temperature correction to obtain the corrected absorbance of the solutions, and thus the pathlength.
3.4. Homogeneity and Stability of SRM 2082
The vials of SRM were stored frozen in the order originally filled for sampling purposes. Homogeneity measurements were made using 12 out of the total 600 units initially produced for SRM 2082. The units selected were chosen using a step randomization method based on the filling order, where two random units were selected out of every sequential 100 units.
To test for homogeneity, the 12 samples were all measured at 22 °C, at a SBW of 0.8 nm, using the same 0.5 mm cuvette. Each component of a unit was measured under these conditions with four replicates (refilling of the sample), and each replicate had four repeat scans by the spectrophotometer. After subtraction of the buffer, the absorbance values for the tryptophan and uracil solutions of each unit were determined. The buffer-subtracted absorbance measurements of tryptophan and uracil are shown in Fig. 6.
Fig. 6.
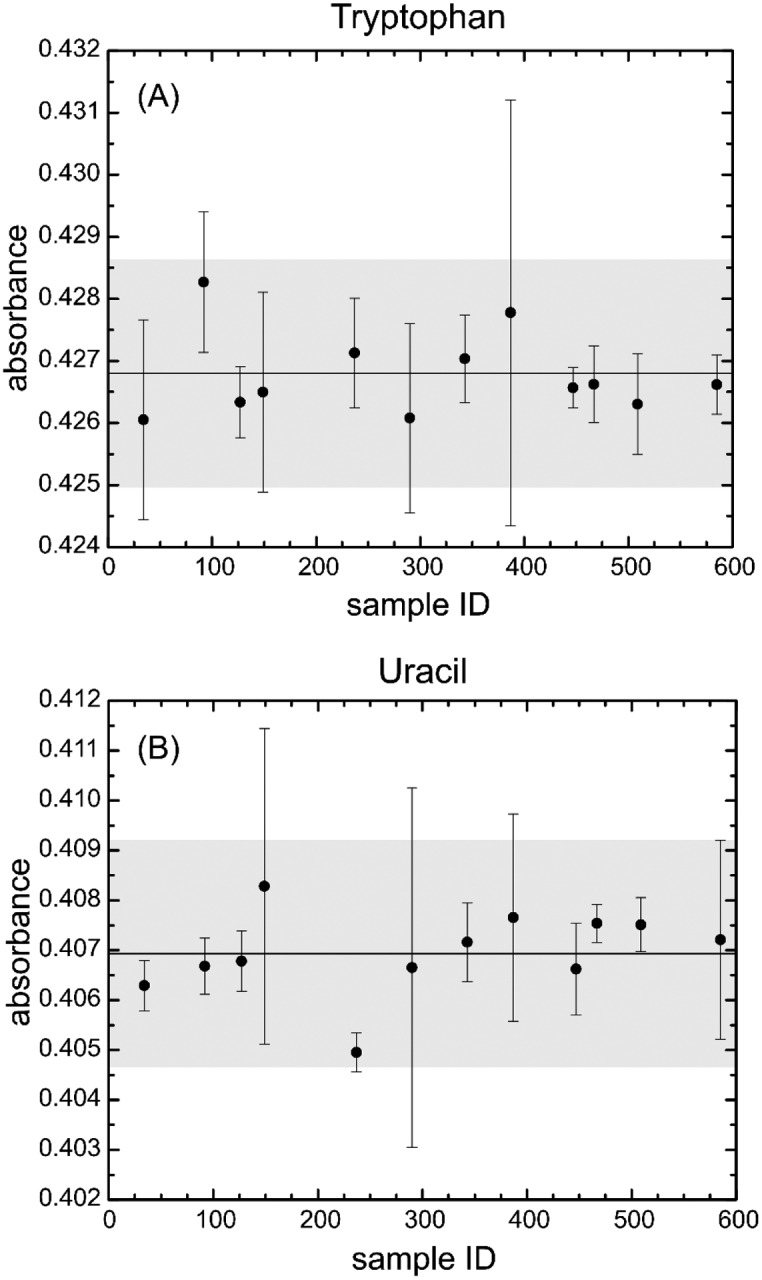
Homogeneity measurements of SRM 2082 from a sample of 12 units measured at 0.5 mm pathlength, 22 °C, and 0.8 nm spectral bandwidth for (A) tryptophan at 280 nm and (B) uracil at 260 nm. The center line denotes the average value, and the upper and lower lines designate the uncertainty at 95 % confidence bands. The error bars are 1 standard deviation of the mean. The gray area around the line is the 95 % uncertainty calculation for the fit of the line to the data.
The average value of the tryptophan from the 12 samples was 0.4268 AU, with an uncertainty (95 %) of 0.0018. For uracil, the average absorbance was 0.4069, with an uncertainty of 0.0022. The uncertainty for each replicate was on the order of uncertainty observed from experiments of removal and replacement of the same cuvette without changing solution. There was no correlation of absorbance with unit number, and the units appeared to be homogeneous throughout the lot of the SRM (Fig. 6).
The effects of long-term storage at various conditions were studied to help determine the shelf life of the candidate SRM. Initial test solutions showed that after 15 d at temperatures of 22 °C and higher, significant changes in absorbance appeared in both solutions.
The primary stability study involved absorbance measurements of the candidate SRM when stored at −20 °C and 4 °C for more than a year. After initial absorbance measurements were conducted, the solutions were stored at −20 °C and 4 °C. The SRM vials stored at −20 °C were measured after 10 months, 16 months, and 24 months. Absorbance measurements of the vials stored at 4 °C were taken after 3 months, 12 months, and 18 months (Fig. 7).
Fig. 7.
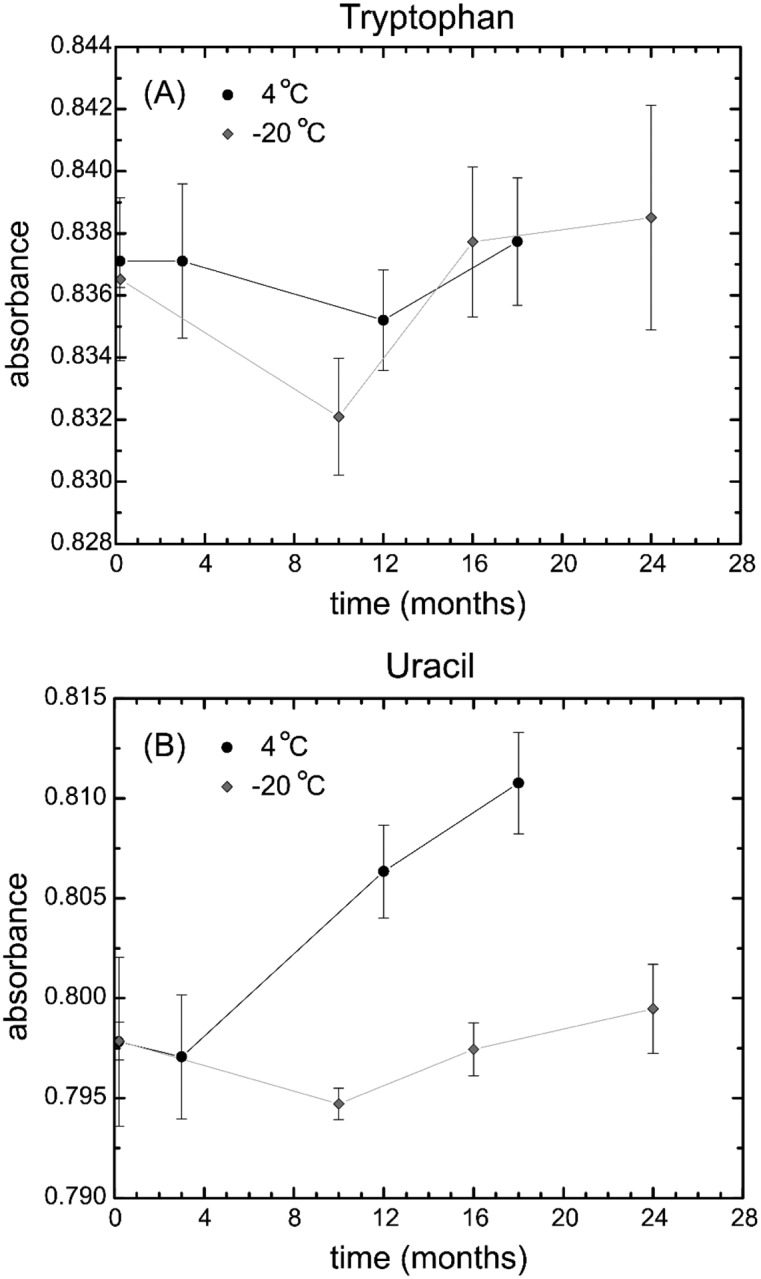
Stability comparison of the absorbance measurements of the standard solutions of the SRM 2082 for (A) tryptophan and (B) uracil measured at −20 °C and 4 °C. Data were normalized to 1 mm pathlength for comparison. The error bars are 1 standard deviation of the mean.
An analysis of variance (ANOVA) of the data showed that there was no significant change in absorbance of the frozen vials over 24 months, indicating that the solutions were stable at −20 °C. For the solutions stored at 4 °C, ANOVA analysis showed that there was no significant change to the tryptophan over 18 months. In this study, the uracil solution was stable for up to 3 months at 4 °C. The stability studies indicated that SRM 2082 can be stored at 4 °C in the dark for up to 3 months.
3.5. Error Analysis of SRM 2082
The overall uncertainty in the absorbance measurements can be calculated from the uncertainties and sources of error in the individual contributing components. The sources of error for the SRM result from the cuvette pathlengths, the uncertainty in absorbance of the NIST Material Measurement Laboratory transfer spectrophotometer, uncertainty of the spectrophotometer spectral bandwidth, error in the spectral bandwidth absorbance measurements, uncertainty in the absolute temperature, the error in the temperature-based absorbance measurements, and the error in absorbance measurements based on sampling and the filling and replacement of the sample cuvettes. The individual sources of error may be classified as type A uncertainties, since they have been directly measured at NIST.
The uncertainty of the temperature correction derives from the uncertainty of the constants a1 and a0 in Eq. (3). Since the constants are interrelated and dependent on the temperature, the uncertainty is determined as a function of t using the covariance between the uncertainties of a1 and a0. The square of uncertainty of the temperature correction, u(ΔtA), as a function of t is a quadratic equation of the form:
| (5) |
where au2, au1, and au0 are constants derived from the covariance.
Similarly, the uncertainty of the spectral bandwidth correction derives from the covariance of the uncertainty of the constants b2, b1, and b0 from Eq. (4). Like the uncertainty of the temperature correction, the square of the uncertainty of the spectral bandwidth, u (ΔBA), can be simplified as a polynomial as a function of the spectral bandwidth that has the form:
| (6) |
where bu4, bu3, bu2, bu1, and bu0 are constants.
4. Conclusions
Our data confirm that SRM 2082 will be useful to validate the pathlength for reduced-pathlength spectrophotometers and cuvettes based on the absorbance values. Methods are provided to correct for differences in temperature used and for different spectral bandwidths of the spectrophotometers used. The absorbance, A, of the solutions follows the Beer-Lambert law, so the pathlength can be determined from A = EC·l, where EC represents the constants of Eq. (1) and Eq. (2). An overall correction factor for the absorbance from Eq. (3) and Eq. (4) can be expressed as:
| (7) |
where t and Bλ are temperature and spectral bandwidth, respectively. The pathlength is then calculated by the equation:
| (8) |
The certified values and standard uncertainties of EC and the variables to correct for temperature and spectral bandwidth effects are listed in Table 1. A spreadsheet file is provided with the SRM that simplifies calculation of the pathlength of the spectrometer used.
Table 1.
Certified values and standard uncertainties of EC and the correction factors for temperature and spectral bandwidth.
| Component A Tryptophan A280 | Uncertainty | Component B Uracil A260 | Uncertainty | |
|---|---|---|---|---|
| Ec | 0.834 98 (mm−1) | 0.000 297 | 0.799 03 (mm−1) | 0.000 304 |
| a1 | 0.000 499 7 | 2.648 × 10⁻⁴ | 0.000 226 6 | 2.469 × 10⁻⁴ |
| a0 | −0.010 97 | 1.108 × 10⁻⁵ | −0.005 066 | 1.033 × 10⁻⁵ |
| b2 | 6.104 × 10⁻⁴ | 6.560 × 10⁻⁴ | 2.374 × 10⁻⁴ | 2.770 × 10⁻⁴ |
| b1 | −2.656 × 10⁻⁵ | 5.428 × 10⁻⁴ | −9.160 × 10⁻⁶ | 2.286 × 10⁻⁴ |
| b0 | −6.198 × 10⁻⁴ | 8.602 × 10⁻⁵ | −2.210 × 10⁻⁴ | 3.623 × 10⁻⁵ |
The uncertainty of the calculated pathlength can be calculated by the propagation of errors method. Since the equation for the pathlength (Eq. [8]) has a closed form, the Guide to the Expression of Uncertainty in Measurement (GUM) [10] provides the calculation uncertainty of the pathlength, u(l), as:
| (9) |
where u(Ec) is the uncertainty of the absorbance with respect to pathlength (see Eq. [1] and Eq. [2]), u(ΔtA) is the uncertainty of the temperature correction (Eq. [5]), u(ΔBA) is the uncertainty of the spectral bandwidth correction (Eq. [6]), and u(A) is the uncertainty of the measured absorbance. The uncertainty constants associated with Eq. (9) are given in Table 2.
Table 2.
Coefficients for the determination of the uncertainty of the pathlength of SRM 2082 utilizing Eq. (9) for component A (tryptophan) and component B (uracil) at 280 nm and 260 nm, respectively. The constant u(Ec) corresponds to the uncertainty of Eq. (1) and Eq. (2). Coefficients au2, au1, and au0 are used in Eq. (5) to map the uncertainty of change in absorbance due to temperature, u(ΔtA). Coefficients bu3, bu2, bu1, and bu0 are from Eq. (6) for the uncertainty of the change in absorbance from the spectral bandwidth, u(ΔBA). Refer to the SRM 2082 certificate of analysis for further guidance.
| Tryptophan A280 | Uracil A260 | |
|---|---|---|
| u(Ec) | 0.000 297 | 0.000 304 |
| au2 | 1.2271 × 10⁻¹⁰ | 1.0671 × 10⁻¹⁰ |
| au1 | −5.7849 × 10⁻⁹ | −5.0309 × 10⁻⁹ |
| au0 | −7.0128 × 10⁻⁸ | 6.0988 × 10⁻⁸ |
| bu4 | 7.4002 × 10⁻⁹ | 1.3126 × 10⁻⁹ |
| bu3 | −9.1491 × 10⁻⁸ | −1.6227 × 10⁻⁸ |
| bu2 | 3.9443 × 10⁻⁷ | 6.9996 × 10⁻⁸ |
| bu1 | −6.7305 × 10⁻⁷ | −1.1970 × 10⁻⁷ |
| bu0 | 4.3012 × 10⁻⁷ | 7.6621 × 10⁻⁸ |
The advantages of SRM 2082 over existing UV absorbance standards are that it was designed for the short-pathlength measurements used in the new generation of microliter volume spectrophotometers and cuvettes, the samples are stable and nontoxic, and the components match the absorbance spectrum of proteins and nucleic acids, the most popular applications. We are currently evaluating the use of SRM 2082 and comparing the results to real-life samples, including genomic DNA, synthetic oligonucleotides, and a monoclonal antibody, using microliter volume spectrophotometers and cuvettes.
Biography
About the authors: Brian Lang is a research chemist in the Chemical Sciences Division in the Materials Measurement Laboratory. Aaron Urbas is a research chemist in the Chemical Sciences Division in the Materials Measurement Laboratory. Paul DeRose is a research chemist in the Biosystems and Biomaterials Division in the Materials Measurement Laboratory. His research focuses on the development of quantitative standards for flow cytometry and other fluorescence-based clinical assays. Hung-Kung Liu is a statistician in the Statistical Engineering Division in the Information Technology Laboratory. John Travis is resident scientist emeritus and was formerly the technical project leader for the photometric UV-visible optical filter SRM program and calibration service. Steve Choquette is the director of the Office of Reference Materials and helped in the planning, design, and execution of the research that led to the development of this SRM. Kenneth Cole is the leader of the Bioassay Methods Group in the Biosystems and Biomaterials Division and works on developing standards for the quantitative measurement of biomarkers for health care and basic research applications. The National Institute of Standards and Technology is an agency of the U.S. Department of Commerce.
Footnotes
Supplemental Materials
The spreadsheet for calculations can be found at https://wwws.nist.gov/srmors/certificates/documents/2082_PathlengthCalculator_2016-02-09.xlsm
Certain commercial equipment, instruments, or materials are identified in this paper to foster understanding. Such identification does not imply recommendation or endorsement by the National Institute of Standards and Technology, nor does it imply that the materials or equipment identified are necessarily the best available for the purpose.
5. References
- [1].Grimsley GR, Pace CN (2003) Spectrophotometric determination of protein concentration. Current Protocols in Protein Science Supplement 33:3.1.1–3.1.9. 10.1002/0471140864.ps0301s33 [DOI] [PubMed] [Google Scholar]
- [2].Cavaluzzi MJ, Borer PN (2004) Revised UV extinction coeficients for nucleoside-5’-monophosphates and unpaired DNA and RNA. Nucleic Acids Research 32:e13 (11–19). 10.1093/nar/gnh015 [DOI] [PMC free article] [PubMed] [Google Scholar]
- [3].Ploeser JM, Loring HS (1949) The ultraviolet absorption spectra of the pyrimidine ribonucleosides and ribonucleotides. Journal of Biological Chemistry 178:431–437. http://www.jbc.org/content/178/1/431.full.pdf [PubMed] [Google Scholar]
- [4].Voet D, Gratzer WB, Cox RA, Doty P (1963) Absorbance spectra of nucleotides, polynucleotides, and nucleic acids in the far ultraviolet. Biopolymers 1:193–208. 10.1002/bip.360010302 [DOI] [Google Scholar]
- [5].Shugar D, Fox J (1952) Spectrometic studies of nucleic acid derivates and related compounds as a function of pH. I. Pirymidines. Biochemica et Biophysica Acta 9:199–218. 10.1016/0006-3002(52)90147-9 [DOI] [PubMed] [Google Scholar]
- [6].Dunn DB, Hall RH (1975) Purines, pyrimidines, nucleosides, and nucleotides: Physical constants and spectral properties Handbook of Biochemistry and Molecular Biology, Volume 1. Nucleic Acids, ed Fasman G (CRC Press, Cleveland, OH: ), 3rd Ed, pp 65–215. [Google Scholar]
- [7].Mihalyi E (1968) Numerical values of the absorbances of the aromatic amino acids in acid, neutral and alkaline solutions. Journal of Chemical & Engineering Data 13:179–182. 10.1021/je60037a011 [DOI] [Google Scholar]
- [8].Edelhoch H (1967) Spectroscopic determination of tryptophan and tyrosine in proteins. Biochemistry 6:1948–1954. 10.1021/bi00859a010 [DOI] [PubMed] [Google Scholar]
- [9].Travis JC, Smith MV, Choquette SJ, Liu H-K (2011) Certified Transmittance Density Uncertainties for Standard Reference Materials using a Transfer Spectrophotometer. U.S. Department of Commerce, Washington, D.C., NIST Technial Report 1715. http://ws680.nist.gov/publication/get_pdf.cfm?pub_id=908914 [Google Scholar]
- [10].Bureau International des Poids et Mesures. Guide to the Expression of Uncertainty in Measurement, http://www.bipm.org/en/publications/guides/gum.html


