Abstract
The National Institute of Standards and Technology (NIST), through a collaboration with Perseus, a global provider of telecommunication services, is providing accurate, traceable, and verifiable time synchronization to stock exchanges in the United States, Europe, and Asia. The paper describes why accurate time is necessary for fair and equitable financial markets and summarizes current and proposed future synchronization requirements in the financial sector. We discuss reference time sources and provide a technical overview of how NIST transfers time to data center hosted stock exchange. We also discuss how Perseus distributes NIST time to financial market customers and describes how the time is verified. Measurement data are presented, along with a discussion of measurement uncertainty.
Keywords: stock market, synchronization, time transfer, traceability
1. Introduction
Since the inception of the direct electronic trading of financial instruments in the 1990s [1] the speed of financial market transactions has increased at an exponential rate, leading to the present situation where trading decisions are made and trades are executed in a small number of microseconds. The world’s financial markets now operate as high performance distributed systems where the time stamp of any particular trade can have a huge influence on the financial fortunes of both large and small investors.
Recording each transaction with an accurate time stamp is an essential part of operating a fair and equitable financial market. When multiple traders attempt to buy or sell a stock at a given price it is important to ensure that the first request received by the market is given precedence over the requests that arrive later. With distributed systems, this can only be done if every computer system involved in the transaction maintains an accurate clock. The level of accuracy required is determined both by the application and by the regulators of each market.
Institutions that interact with financial exchanges require high accuracy time for several reasons. One reason is that accurate time is necessary for institutions to control their own trading traffic. Each institution time stamps every trading request before transmitting it to the financial exchange. Once the request is processed, the results are returned to the originating trader, with a time stamp from the exchange. Knowing the latency of their requests to the exchange is a key factor in improving trading performance. The goal is to tune the systems so that their trading requests will arrive at the financial exchange before their competitor’s requests.
Accurate time is also required to settle disagreements and to prevent fraud. The time stamps collected by each institution must be examined when there are disagreements or errors in processing trades. Perhaps the most famous example of this occurred during the Flash Crash of 2010 [2], when several stock exchanges fluctuated wildly and then halted trading. Once the systems had been halted, all market participants had to work together to pick up the pieces and determine who really did and did not trade during the crash. The only way to make sense of the millions of transactions that had passed through the financial exchanges was to believe that the time stamps on the trades were accurate, and to then reverse or “break” trades that didn’t meet specific timing criteria.
1.1. Why Accurate Time is Necessary for Fair and Equitable Financial Markets
To help understand why accurate time is necessary to maintain fair and equitable financial markets, this section briefly introduces some basic concepts and terminology that pertain to all stock market transactions. Numerous references provide a more comprehensive view of basic stock market terminology, including Refs. [3–6].
All buyers and sellers in stock markets are familiar with the terms bid and ask. The bid is the maximum price that a buyer is currently willing to pay for a stock. For example, if a buyer submits an order for 100 shares of ACME Corporation stock and offers to pay, at most, $10 per share, they are submitting a bid of $10. The ask is the minimum price that a seller is willing to accept for a stock. In the above example, if the ask on ACME Corporation stock is $10.05, the buyer’s bid won’t be accepted unless it is increased to meet the ask. A transaction can only occur when the buyer and seller agree on a price. The general rule that is often quoted by investors is simply—“buy at the ask and sell at the bid.” This means that at the moment of a transaction, the buyer is paying the current ask price and the seller is receiving the current bid price. Of course, the bid and ask prices are rapidly changing, based on the current level of demand between buyers and sellers.
The difference between the bid and the ask is called the bid/ask spread or simply the spread. Investors can often get an idea of the liquidity of the stock, or how easy it is to buy or sell, by looking at the size of the spread. A small spread, $0.01 on a $10 stock, for example, often means that a stock is very liquid, with a large amount of demand amongst both buyers and sellers. A large spread, especially one that exceeds 1 % of the stock price, might mean that a stock is thinly traded and that the few buyers and sellers who are currently interested cannot agree on a price.
The spread also represents the amount of the profit received by the organization that facilitates the transaction, known as the market maker. When an investor sells, a market maker buys, and when an investor buys, a market maker sells. Thus, market makers reverse what investors do; they buy at the bid and sell at the ask. If the market maker buys ACME Corporation stock for $10 per share and sells it for $10.05, their profit is $0.05 per share.
The widespread usage of electronic trading platforms and automated stock exchanges that began in the late 1990s has fundamentally changed the way that stock transactions take place. The market makers are no longer individuals working the telephones or physically waiting in line to place orders. Instead, computers automatically execute trades, buying and selling stocks to each other, based on software algorithms. Due to automation, the number of exchanges competing against each other increased substantially (each offering their own bid/ask prices to attract business), and both the amount of time required to execute a transaction and the size of the spreads decreased substantially. Spread size was also reduced by the decimalization of stock prices which began on the New York Stock Exchange (NYSE) and National Association of Securities Dealers Automated Quotations (NASDAQ) stock markets in 2001. Prior to decimalization, stock prices were listed in fractional dollars, which kept the spread large; for example, if a stock traded in price increments of 1/8 of a dollar the spread would be at least 12.5 cents, but decimalization reduced the minimum price increment to one cent [7]. Smaller spreads improved the stock market’s liquidity, but it also created the incentive for market makers, now dealing with reduced profits from tighter spreads, to execute more trades [8]. Each of these factors have contributed to the widespread practice of high frequency trading (HFT) where a much larger number of transactions can occur in a given time period than before. At least half of all the transactions in today’s stock markets are the result of HFT, with trades executed in intervals measured in microseconds by automated trading platforms [9, 10].
The practice of HFT made it essential for all stock exchanges and trading platforms to be able to document that their time stamps are accurate, to avoid stock market fraud and manipulation. To illustrate the importance of accurate time stamps, consider a hypothetical situation where a retail investor, trading from a home computer, is preparing to submit an order for 100 shares of ACME Corporation stock. Before submitting the order, the investor checks the display of their online trading software and notes that the current bid is $19.23 and the current ask is $19.25. The display also indicates that no one else is in line to buy the stock. Thus, they understandably assume that the ask price, $19.25 per share, is the price they will pay and “click” to submit the order. A fraction of a second later a large investor (such as a hedge fund or investment bank), submits an order to buy 1,000,000 shares of ACME Corporation stock. This large order arrives at the stock exchange after the small order, but the exchange, for reasons unknown to the retail investor, elects to execute the large trade first. The large trade immediately raises both the bid and the ask price by 15 cents, to $19.38 and $19.40, respectively. This action causes the investor to instantly lose money. If they have entered a market order, meaning that they’ll accept the current ask price regardless of what it is, they’ll pay $19.40 for the stock they were expecting to buy at $19.25. If they have entered a limit order, indicating that $19.25 was the most they will pay, they miss out on the trade completely because their order will not be filled. Meanwhile, the large investor who “cut ahead in line” has the option of selling at least some of the shares they just purchased at the new bid price, taking an instant profit. Cutting in line is called “front running” and is illegal.
Conducting this type of fraudulent activity is possible if distributed trading platforms do not have clocks that are synchronized to a common reference. It is also possible if the resolution of the time stamps on each transaction is coarser than the execution times of the trade. For example, if trades are being stamped with a resolution of one second, it means that the time stamp can display 12:22:01 (12 h, 22 min, and 1 s) and 12:22:02, but nothing in between. Thus, a time stamp of 12:22:01.5 cannot be recorded. With HFT, a stock exchange can potentially execute many thousands of trades within a one second interval, all having the same time stamp, and reorder them in a way that suits their purposes. The time stamp documentation will make it appear that the orders arrived at the same time, and there is no way for an auditor reviewing the transaction logs to prove which order arrived first. In recent years, much emphasis has been placed on high speed connections that reduce the transit time between the order desk and the stock exchange [10, 11]. However, the potential advantage gained by “getting there first” still requires time stamps to be synchronized to a reference clock and to have the necessary resolution to eliminate the possibility of fraud. Concern by regulators in the 1990s that trades were not always being executed in the best interest of customers led to the establishment of order audit trail systems (OATS) and rules for the synchronization of stock market clocks, as described in the next section.
2. An Overview of Past, Current, and Future Time Synchronization Requirements for Stock Market Transactions
Prior to the advent of distributed electronic trading platforms and HFT, many of the clocks maintained by brokerage houses were mechanical devices that physically stamped the time, in ink, onto the paper documents used to record transactions. These clocks were not always synchronized and seldom had the ability to display seconds. Similar to the punch clocks and payroll clocks still in use at many businesses today, their resolution was very limited, sometimes to one minute. Some models utilized decimal time formats including hundredths of an hour (36 s resolution) or tenths of a minute (6 s resolution). By the late 1990s, it was obvious that the performance of these clocks was far too limited to ensure fair and equitable financial markets, and synchronization requirements for stock markets in the U.S. were implemented as described in Secs. 2.1 to 2.3. Section 2.4 discusses European standards.
2.1. NASD OATS Rule 6953 (1998)
In August 1996, the U.S. Securities and Exchange Commission (SEC) issued a report [12] that included findings from an investigation of the practices of the National Association of Securities Dealers (NASD) and the NASDAQ stock market. The report alleged that the NASD and NASDAQ did not always act in the best interest of customers—trades were improperly executed and collusion existed among market makers. A financial settlement was reached between the SEC and NASD that also included new regulations; the NASD was required to improve market surveillance and to develop an enhanced OATS. To comply with the new regulations, the NASD issued a series of rules, numbered as 6950 through 6957, that were approved by the SEC in March 1998 and went into effect in August of that same year.
One of the rules, number 6953, was entitled “Synchronization of Member Business Clocks” [13]. It required computer system and mechanical clocks to be synchronized every business day before the stock market opened to ensure that event time stamps are accurate. The synchronization requirements were as follows:
- All computer system clocks and mechanical time stamping devices must be synchronized to within three seconds of the National Institute of Standards and Technology (NIST) atomic clock. Any time provider may be used for synchronization, however, all clocks and time stamping devices must remain accurate within a three-second tolerance of the NIST clock. This tolerance includes all of the following:
- The difference between the NIST standard and a time provider’s clock;
- Transmission delay from the source; and
- The amount of drift of the member firm’s clock.
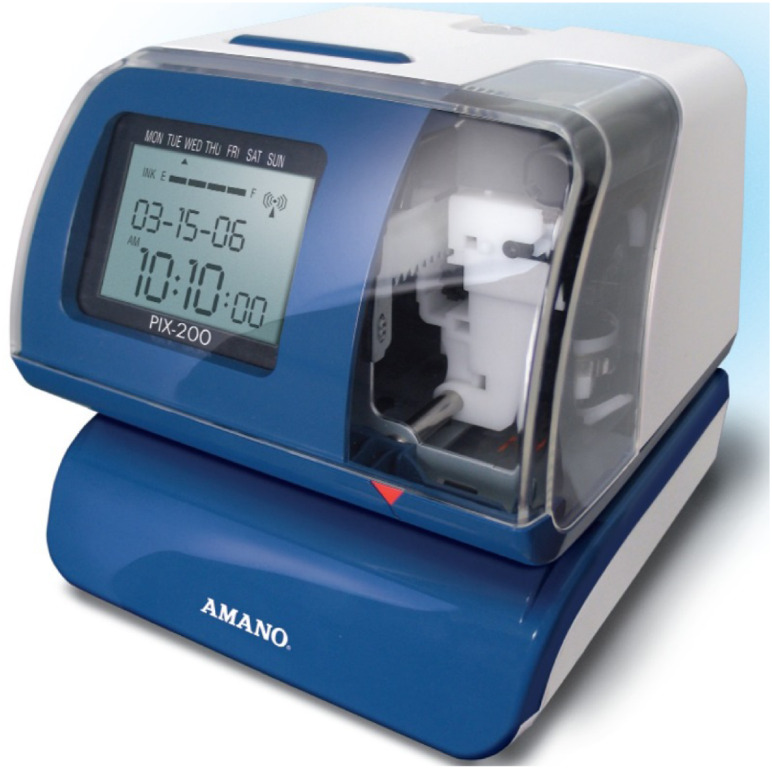
Several practical considerations contributed to the Rule 6953 requirements. The three second synchronization requirement that it introduced was not particularly stringent, but it at least forced the removal of old clocks that could not display seconds, such as the decimal time clocks discussed earlier. Prior to the writing of the rule, the NASDAQ had begun using clocks that were referenced to the Geostationary Operational Environmental Satellite (GOES) time code service that was then operated by NIST [14]. The original authors of the rule thus wanted the requirement to be “GOES Time,” but after consultations with the NIST staff and learning that NIST offered numerous other time services, the requirement was changed to simply NIST time. The requirement was originally enforced only for the NASDAQ stock market, but the NYSE, through Rule 132A [15], adopted requirements identical to NASD Rule 6953 in 2003. Figure 1 shows an OATS compliant clock, still available at this writing, that can obtain NIST time from either radio station WWVB at 60 kHz [16] or from the NIST Internet Time Service (ITS) [17].
Fig. 1.
An OATS compliant clock used to time stamp financial transactions (courtesy of Amano).
2.2. FINRA OATS Rule 7430 (2008)
The Financial Industry Regulatory Authority (FINRA) issued new requirements for stock market synchronization that superseded Rule 6953 in 2008 for the NASDAQ and in 2011 for the NYSE. These requirements are contained in FINRA OATS Rule 7430 [18] which had the same title as its predecessor, “Synchronization of Member Business Clocks.” Like the previous requirements, the new requirements list NIST time as the official reference for stock market transactions. However, the new rule reduced the synchronization requirement by a factor of three, from three seconds to within one second of NIST time, and also required that one second synchronization be maintained at all times when the market was open. The wording of FINRA OATS Rule 7430 is as follows:
Rule 7430 requires any FINRA member firm that records order, transaction or related data to synchronize all business clocks used to record the date and time of any market event. Clocks, including computer system clocks and manual time stamp machines, must record time in hours, minutes and seconds with to-the-second granularity and must be synchronized to a source that is synchronized to within one second of the National Institute of Standards’ (NIST) atomic clock. Clocks must be synchronized once a day prior to the opening of the market, and remain in synch throughout the day. In addition, firms are to maintain a copy of their clock synchronization procedures on-site. Clocks not used to record the date and time of market events need not be synchronized [18].
Reducing the synchronization requirement from three seconds to one second was done in response to the increasingly widespread use of automated trading platforms and HFT, but was deemed by many to be too coarse a requirement to prevent HFT fraud. Thus, FINRA Regulatory Notice 14–47 [19] was sent out for comments in November 2014 with a comment period that closed in February 2015. This document proposed tightening the time requirement by a factor of 20, to within 0.05 s (50 ms) of NIST time. Not all firms who responded during the request for comments were in favor of the new requirements and approval was delayed until August 15, 2016, with an implementation date of February 20, 2017 [20]. On that date, 50 ms will become the synchronization requirement for stock market transactions in the United States.
2.3. Consolidated Audit Trail (CAT)
On July 11, 2012, the SEC, through Rule 613, voted to require FINRA and stock exchanges in the United States to establish a consolidated audit trail (CAT) that would enable regulators to be able to monitor and analyze trading activity. The CAT would require FINRA and the stock exchanges to collect and accurately identify every order for all stocks and stock options across all U.S. markets, and to send complete documentation about the order to a central repository by 8 a.m. Eastern Time the day following the trade [21].
The CAT “National Market System Plan Request for Proposal” first appeared in 2013 and has gone through several subsequent revisions. Section 6.8 of the document lists the requirements for time stamps and the synchronization of business clocks. For automated orders it requires that business clocks be synchronized “at a minimum to within fifty (50) milliseconds of the time maintained by the National Institute of Standards and Technology, and maintain such a synchronization.” NIST time is also the reference for manual orders but the synchronization requirement is reduced to 1 s [22]. The 50 ms requirement for automated orders is the same as FINRA Regulatory Notice 16–23 [19] and the 1 s requirement is identical to FINRA OATS Rule 7430 [18].
The CAT plan requirements go further than previous rules, however, as they also require time stamps with millisecond resolution. CAT requires industry members to “report information required by SEC Rule 613 and this Agreement to the Central Repository in milliseconds. To the extent that any Participant utilizes timestamps in increments finer than the minimum required in this Agreement, such Participant shall utilize such finer increment when reporting CAT Data to the Central Repository so that all Reportable Events reported to the Central Repository can be adequately sequenced.” The millisecond resolution time stamps are required at five places in the audit trail; the time of order origination, the time when the order is routed, the time when the order is received, the time when the order was modified or cancelled, and the time when the order was executed [22].
2.4. MiFID II (European Standard)
The Market in Financial Instruments Directive (MiFID) has been applicable across the European Union (EU) since November 2007, with the current version, known as MiFID II [23], appearing in 2014. The European Securities and Markets Authority (ESMA), who is empowered by MiFID to draft regulatory technical standards, is somewhat analogous to the SEC in the United States, having the goal of ensuring fair and equitable markets and protecting the investor.
The proposed synchronization requirements drafted by ESMA, expected to go into effect in January 2017, are more stringent than current U.S. requirements. The synchronization requirement is 1 s for voice trading systems and other systems that require human intervention, but just 1 ms for all other trading activities that do not qualify as HFT. In both cases, the required time stamp resolution is equivalent to the synchronization requirement. For HFT the synchronization requirement is 0.1 ms (100 μs) and the required resolution of the time stamps is 1 μs [24].
In addition, the MiFID II requirements do not specify NIST as the reference timing source. This is understandable because NIST is the national metrology institute (NMI) of the United States, and each of the 28 member nations of the EU have their own NMI. Thus, the emphasis is on traceability to Coordinated Universal Time (UTC) and any timing laboratory that contributes to UTC (to be described in Sec. 3.1) can serve as the reference time source [24]. NIST, of course, is a UTC contributor.
Table 1 provides a summary of all current and proposed stock market synchronization requirements. Now that we have discussed why accurate time is important to financial markets and have summarized the synchronization requirements, let’s turn our attention to the actual practice of keeping accurate time. The following sections describe how financial markets can comply with synchronization requirements, beginning with an overview of reference time sources.
Table 1.
Stock market synchronization requirements
| Rule Number | Author | Year of Origin | Current Status | Reference Time Source | Synchronization Requirements with Respect to Reference Time Source | |
|---|---|---|---|---|---|---|
| OATS Rule 6953 | NASD | 1998 | Superseded by 7430 | NIST | All clocks | 3 s |
| NYSE Rule 132A | NYSE | 2003 | Superseded by 7430 | NIST | All clocks | 3 s |
| OATS Rule 7430 | FINRA | 2008 | In effect | NIST | All clocks | 1 s |
| Regulatory Notice 16–23 | FINRA | 2016 | In effect in 2017 | NIST | Computer clocks | 50 ms |
| Mechanical clocks | 1 s | |||||
| CAT NMS Plan | SEC | 2012 | Proposed | NIST | Automated orders | 50 ms |
| Manual orders | 1 s | |||||
| Time stamp resolution | 1 ms | |||||
| MiFID II | ESMA | 2015 | Proposed | UTC | Manual orders | 1 s |
| Automated orders, non-HFT | 1 ms | |||||
| HFT | 0.1 ms | |||||
| HFT time stamp resolution | 1 μs | |||||
3. Reference Time Sources
The second is the base unit of time interval and time is kept by counting seconds. The current definition of the second in the International System (SI) has been internationally recognized since 1967. The second is defined as the duration of 9 192 631 770 periods of the radiation corresponding to the two hyperfine levels of the cesium 133 atom ground state [25]. This definition marked the beginning of the atomic timekeeping era, after many centuries of referencing time to astronomical observations. Atomic clocks keep time by first establishing the duration of the second based on counting the frequency of the transitions between two energy levels in an atom (a frequency of 9.192631770 GHz in the case of the cesium atom), and by then counting seconds to form longer time intervals such as minutes, hours, and days. The second had previously been defined by first establishing long astronomical intervals, such as the mean solar day and the tropical year, and then dividing to obtain shorter intervals [26–28].
Once the definition of the atomic second was agreed upon internationally, atomic clocks became the references for the world’s timekeeping laboratories. The official world time scale, Coordinated Universal Time or UTC, is obtained by averaging the time kept by atomic clocks at the world’s major timekeeping laboratories, as described in the next section.
3.1. Coordinated Universal Time (UTC) and UTC(NIST)
The official world time scale, UTC, is calculated at the Bureau International des Poids et Mesures (BIPM) in Sevres, France, from clock data that are contributed by timing laboratories from around the world. Currently, more than 70 timing laboratories are contributing data from more than 400 atomic clocks to the BIPM, and UTC is obtained by taking a weighted average of all of the submitted clock data [29].
UTC is a post-processed, virtual time scale that does not produce a physical signal. However, the timing laboratories that contribute to UTC operate local time scales that do produce physical signals. These local realizations of UTC can be used as measurement references for real-time applications, such as providing time to financial markets. The local UTC time scales are referred to by the BIPM as UTC(k), where k is the acronym of the laboratory. Each month, the BIPM publishes a document called Circular T that lists the UTC – UTC(k) time differences for each laboratory that contributes to UTC. A time difference value, along with the measurement uncertainty associated with the value, is provided for each laboratory every five days [30]. The Circular T document allows each participating laboratory to know the recent difference of its local UTC time scale with respect to UTC, and to thus establish traceability to UTC and to the SI second.
NIST maintains a local realization of UTC(NIST) at its laboratories in Boulder, Colorado. The UTC(NIST) time scale consists of an ensemble of cesium beam and hydrogen maser clocks that is periodically calibrated by a cesium fountain primary frequency standard [31].
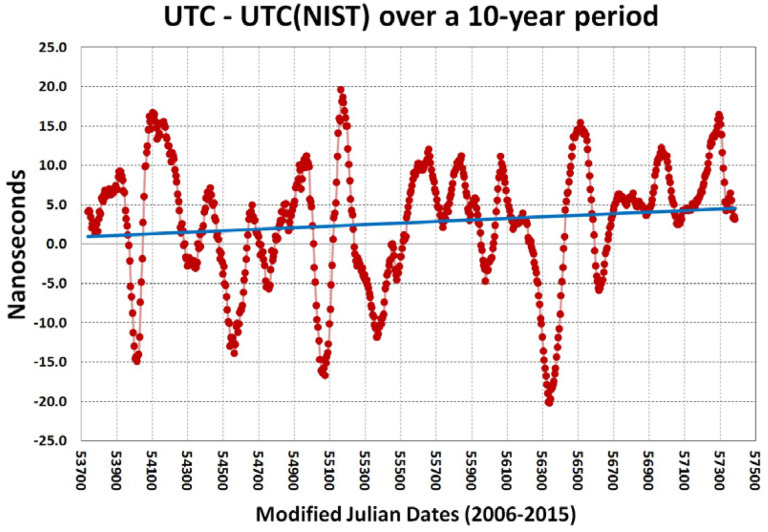
The UTC(NIST) time scale is kept in close agreement with UTC, as shown in Fig. 2, which compares UTC(NIST) to UTC over the 10-year period from 2006 to 2015. The data used to construct Fig. 2 were obtained from the BIPM Circular T documents. The average UTC – UTC(NIST) difference during this 10-year period is 4.2 ns, and the time difference rarely exceeded 20 ns. The average frequency difference between UTC and UTC(NIST) over this period, as indicated by the slightly positive slope of the blue linear least squares line in Fig. 2, is near +1 × 10⁻¹⁷. The BIPM has reported the uncertainty of the UTC – UTC(NIST) comparisons as being near 5 ns during the entire 10-year period (the actual reported uncertainties ranged from 4.8 to 5.1 ns).
Fig. 2.
The time difference between UTC and UTC(NIST) over a 10-year period (2006–2015).
As indicated in the discussion of FINRA OATS Rule 7430 in Sec. 2.2, UTC(NIST) is the official time for financial exchanges in the United States. Because UTC(NIST) is a close real-time approximation of UTC, it can also be utilized as an official time source for financial exchanges throughout the world. NIST distributes UTC(NIST) to the general public through a variety of services that operate over various mediums including WWV, WWVH, and WWVB, which broadcast time signals via high frequency (HF) and low frequency (LF) radio signals [16, 32]; by the Automated Computer Time Service (ACTS), which broadcasts time codes via ordinary telephone lines [33]; and by the Internet Time Service (ITS), which broadcasts billions (109) of time codes per day via the public Internet [17]. However, due to uncompensated propagation delays, each of these services delivers time to the user that is far less accurate than the time kept at NIST. In fact, they deliver time to users with an accuracy that is typically no better than one millisecond, about a factor of a million (106) worse than the nanosecond accuracy maintained in the NIST laboratories. These services have been utilized since 1998 to meet OATS requirements and continue to do so, but they cannot meet all of the proposed requirements discussed in Sec. 2. In addition, while it is possible to verify the accuracy of the time transmitted by these services, it is usually not possible to verify the accuracy of the received time for documentation purposes. Thus, to meet the accuracy requirements of HFT platforms and to verify that NIST time is accurate when it reaches the customer, it was necessary to replicate UTC(NIST) at financial market sites as described in the following sections.
4. Transferring UTC(NIST) to Financial Markets with NIST Disciplined Clocks
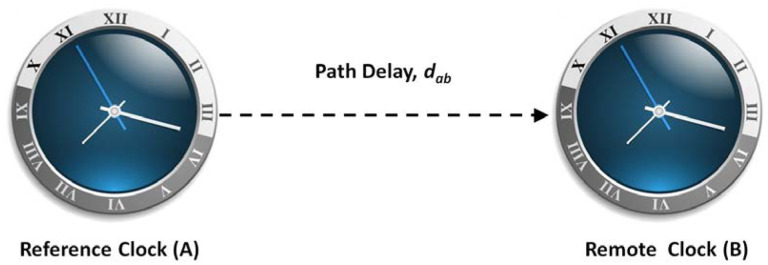
Time transfer, the science of transferring time at high accuracies from one location to another, is an important and well researched area of time and frequency metrology. All time transfer systems have a reference clock at their source (point A). Information from the reference clock is encoded on a signal that is transmitted through a wired or wireless medium to its destination (point B), where the remote clock is located. In the simplest form of time transfer, the “one-way” technique (Fig. 3), the remote clock is then synchronized with the time from the reference clock, which for best results is corrected to include the path delay through the medium, dab. Even if the reference clock is a nearly perfect source of UTC, the accuracy of the time transferred to the remote clock can be no better than the uncertainty of the path delay measurement [34]. This simple fact can be thought of as the first principle of time transfer.
Fig. 3.
A simple “one-way” time transfer system.
An effective method for reducing time transfer uncertainties is the common-view measurement technique. This technique compares two clocks located at different sites to a common-view signal, CVS, broadcast from an independent transmitter. The measurement at site A produces the time difference Clock A – CVS, and the measurement at site B produces the time difference Clock B – CVS. When the two measurements are subtracted from each other, the result is the time difference between the two clocks, or Clock A – Clock B.
To better understand how the common-view technique works, imagine two people living at opposite ends of town who want to compare the times displayed by the clocks in their homes. The problem would be easy to solve if the two clocks could be transported to the same place and compared side by side, but moving the clocks isn’t practical. Instead of moving the clocks, each person agrees to write down the time displayed by their clock when a siren, located midway between them, is heard in their town; an event that happens periodically. When they hear the siren they call or text each other to exchange the time readings. If Clock A displayed 08:01:07 and Clock B displayed 08:01:22 when the siren was heard, then simple subtraction tells them that Clock A is 15 seconds behind Clock B. The time when the siren sounds is unimportant, it only matters that it was heard simultaneously at both clock locations. As this simplified example illustrates, the CVS doesn’t have to be accurate because it does not supply the reference time, it is simply a vehicle used to transfer time from the reference to the remote clock.
The common-view technique was practiced by time metrologists long before Global Positioning System (GPS) satellites were available [35], but GPS satellites have typically served as the CVS source for several decades [36]. Common-view GPS measurements involve a GPS satellite (S), and two receiving sites (A and B), each containing a GPS receiver and a local clock (Fig. 4). The satellite transmits a signal that is received at both A and B, and A and B each compare the received signal to their local clock. The measurement at site A compares the GPS signal received over the path dSA to the local clock, Clock A – S. Site B receives GPS over the path dSB and measures Clock B – S. The difference between the two measurements is an estimate of Clock A – Clock B. Delays that are common to both paths dSA and dSB cancel even if they are unknown, but uncorrected delay differences between the two paths add uncertainty to the measurement result. The basic equation for a CVGPS measurement is
| (1) |
Fig. 4.
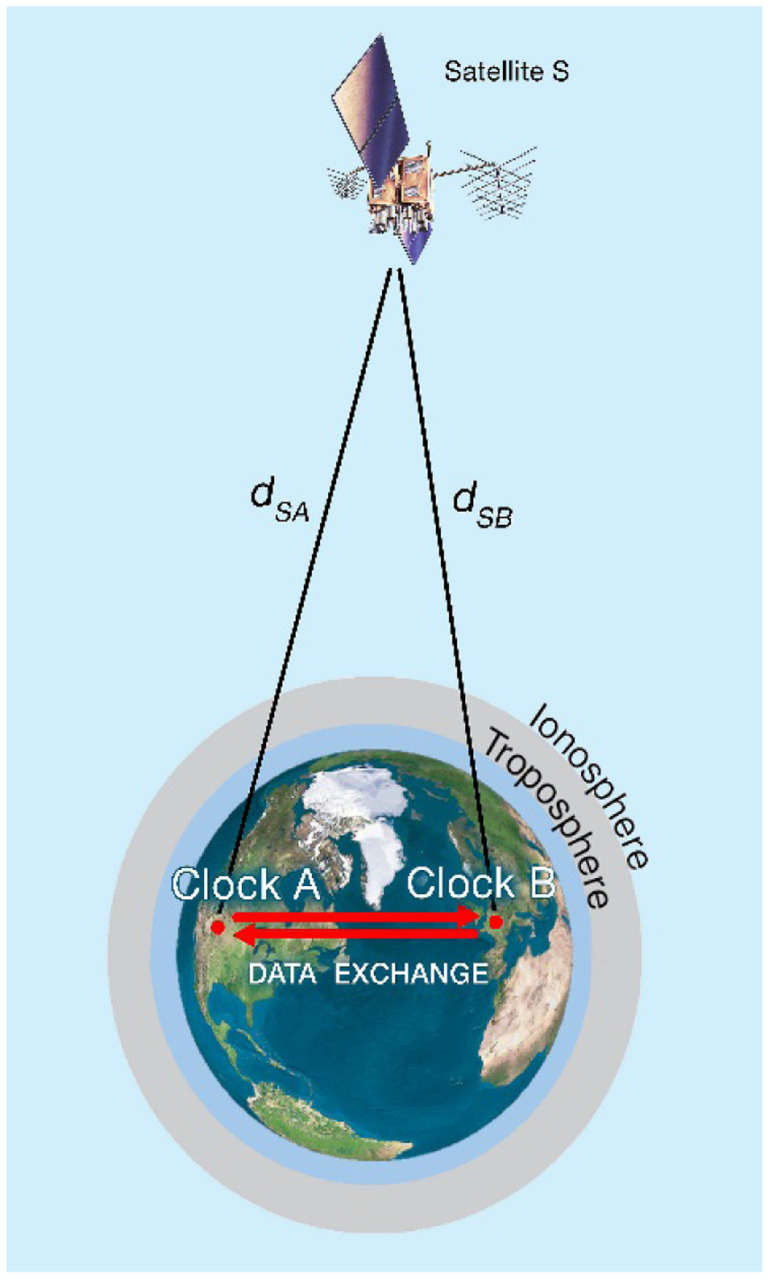
Common-view time transfer via satellite.
The components that make up the (eSA – eSB) error term include delay differences between the two sites caused by ionospheric and tropospheric delays, multipath signal reflections, environmental conditions, or errors in the GPS antenna coordinates. These factors are either measured or estimated and applied as a correction to the measurement. It is also necessary to calibrate the systems used at both sites and to account for the delays in the receiver, antenna, and antenna cable.
Time transfer techniques were first used, and are still used today, to simply measure the frequency and/or time offset of a remote clock. It was obvious to early researchers, however, that if a remote clock’s frequency and time could be measured, it could also be controlled [37]. Accurate disciplined oscillators and clocks have existed for many decades, based on one-way time transfer (Fig. 3) obtained via LF radio or satellite signals. The concept and demonstration of a common-view disciplined clock, however, is relatively new [38] and was first implemented as an option to the NIST Time Measurement and Analysis service in 2010 [39]. This service is used to replicate UTC(NIST) near the site of financial market exchanges, as described in the following sections.
4.1. Description of NIST Disciplined Clock
Delivering NIST time to financial markets at accuracies measured in nanoseconds requires a NIST disciplined clock (NISTDC) to be installed as close to the electronic trading platform as possible, which means installation in a data center co-located with the servers that handle stock market transactions. The NISTDC consists of a rack mounted instrument with an integrated computer that runs software developed at NIST; a network interface card, a 12-channel L1 band GPS receiver, a time interval counter with sub-nanosecond resolution, an atomic clock, and a distribution amplifier for the atomic clock signals. The NISTDC distributes frequency (10 MHz) and time (1 pulse per second, pps) signals that are in phase with each other and have equivalent stability and accuracy. The 1 pps outputs are synchronized to UTC(NIST) and serve as the reference for the time servers described in Sec. 5.
The NISTDC is connected to a “pinwheel” type GPS antenna [40] that is mounted on the roof of the data center. Because data centers often are housed in tall buildings, low-loss antenna cable (signal loss is about 5 dB per 30 m at the L1 frequency of 1575 MHz) is used to allow for cable lengths that sometimes exceed 100 m. The antenna was chosen because it has the necessary gain (> 30 dB) to drive long cables and also because it can effectively mitigate multipath signal reflections from nearby buildings and other objects.
The NISTDC is also connected to the Internet. For security purposes, only a few network operations are allowed, and the primary purpose of the network interface is to transmit data files to servers operated by NIST. Data files are transmitted every 10 minutes and this continuous file transfer allows common-view data subtraction to be performed in real-time.
4.2. Delay Calibration of NIST Disciplined Clock
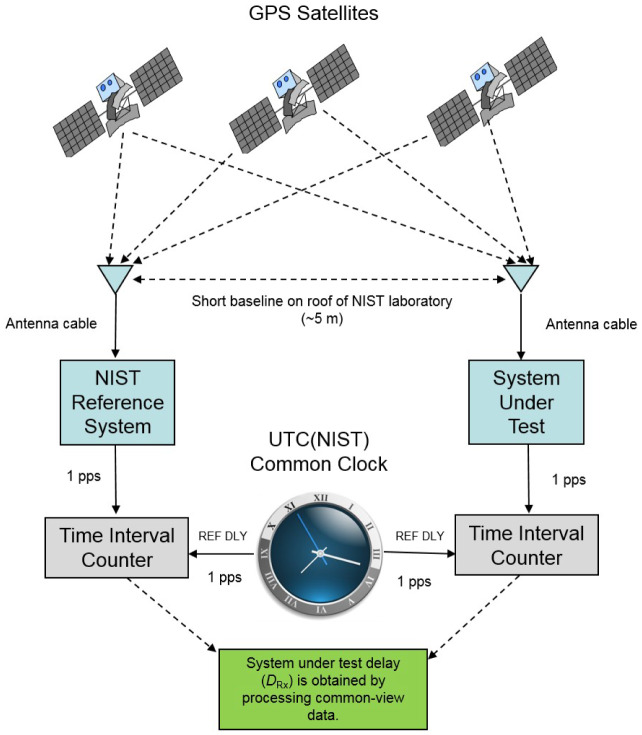
Prior to shipment to the data center, each NISTDC is calibrated at NIST in Boulder, Colorado. The instrument is calibrated with the same antenna and cable (with the necessary cable length determined prior to shipment) that will be delivered to the data center site. The calibration is performed via the common-clock method, where the system under test and the reference system at NIST are both measuring the same clock, a 1 pps signal from the UTC(NIST) time scale (Fig. 5). The cables that connect both the reference system and the system under test to UTC(NIST) are carefully calibrated so that their delay is known with an uncertainty of about 0.1 ns.
Fig. 5.
Common-clock calibration of a NISTDC prior to shipment.
The antenna for the system under test is mounted on a pole on the roof of the NIST laboratories that has coordinates known to within 20 cm. These coordinates were obtained through surveys conducted with geodetic receivers and a differential position service. The known antenna coordinates are entered into the system under test prior to the calibration. The system under test has its antenna located just a short baseline away (~5 m) from the reference system antenna.
Each calibration lasts for 10 days (240 hours). The results are obtained with software written at NIST that processes the data recorded by both the reference system and the system under test and produces the average time difference between them. This difference, DRx, is entered into the NISTDC system prior to shipment to compensate for its internal delays. The calibration is accepted only if there are no significant outliers, no signal outages or equipment interruptions, and if the time deviation [41] of the reduced common-view data is less than 1 ns at an averaging period of one day.
4.3. Technical Overview of the NIST Disciplined Clock Method
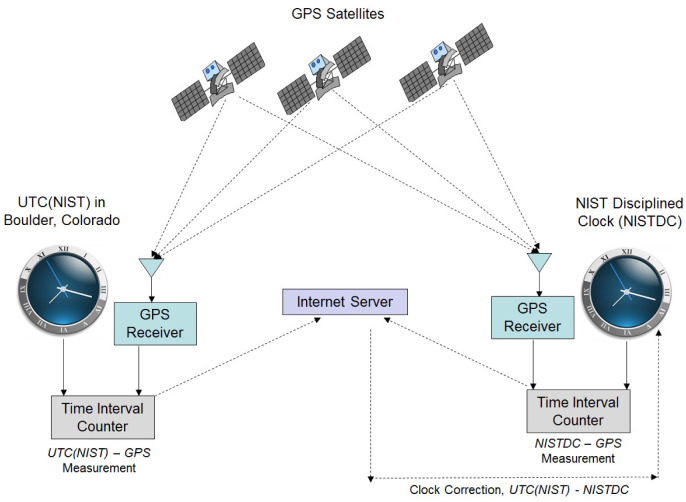
The NISTDC continuously adjusts its local atomic clock. The local atomic clock is either a rubidium or a cesium clock, but rubidium clocks are typically used at financial market sites. The adjustments are made by applying frequency and time corrections obtained through common-view GPS measurements. As illustrated in Fig. 6, the measurements performed at NIST produce the time difference UTC(NIST) – GPS, and the measurements performed at the remote site produce NISTDC – GPS. As previously noted, the GPS signals are simply a vehicle used to transfer time from one site to the other, and when the two measurements are subtracted from each other, the result is an estimate of UTC(NIST) – NISTDC. The data are collected by having the measurement systems at both sites average time interval counter readings for 10 minutes. At the end of each 10-minute period the reference NIST system and the NISTDC systems simultaneously upload their measurements to an Internet server located at NIST in Boulder, Colorado.
Fig. 6.
NIST disciplined clock system.
An adaptive proportional-integral-derivative (PID) controller implemented in software disciplines the rubidium clock. It does so by correcting the error between a measured process variable and a desired set point. The process variable is TD, the last measured time difference between the rubidium clock and UTC(NIST), and the desired set point is 0, because the goal is simply to make the two clocks agree by removing any time difference. To obtain TD, the PID controller invokes applications on the Internet server that immediately perform the common-view data processing and return the results. Two different applications can be selected on the server depending upon the distance of the NISTDC from NIST. The first application, called CVDIFF, aligns and differences data collected from the individual satellite tracks, discards data collected from satellites that are not receivable at both sites, and only uses data from the satellites that are visible at both locations to produce TD. A second application, called AVDIFF, implements the “all-in-view” method, where the satellite tracks are not aligned and no tracks are discarded. Instead, AVDIFF collects the average time difference from all available satellites at both sites, and TD is simply the difference between the two averages. CVDIFF often provides slightly better performance, but has a limited coverage area. At distances greater than about 5000 km from Boulder, Colorado, there may be occasional periods when no satellites are receivable at both sites, rendering CVDIFF unusable. AVDIFF removes these limitations and allows a NISTDC to be deployed anywhere on Earth [42].
Once TD is obtained, it is converted to a dimensionless frequency correction that is sent to the atomic clock. This “measure and correct” process is repeated every 10 minutes to maintain lock with UTC(NIST). The NISTDC indicates a lock condition when the atomic clock is accurate to within 50 ns of UTC(NIST) and stable to within 5 ns as estimated with the time deviation, σx(τ), at τ = 10 minutes. Internally, however, the software distinguishes between a “soft lock” based on the 50/5 criteria, and a “hard lock”, which is reached when the accuracy is within 10 ns and the time deviation is less than 2 ns. The “hard lock” criterion is desired and under normal conditions is always maintained.
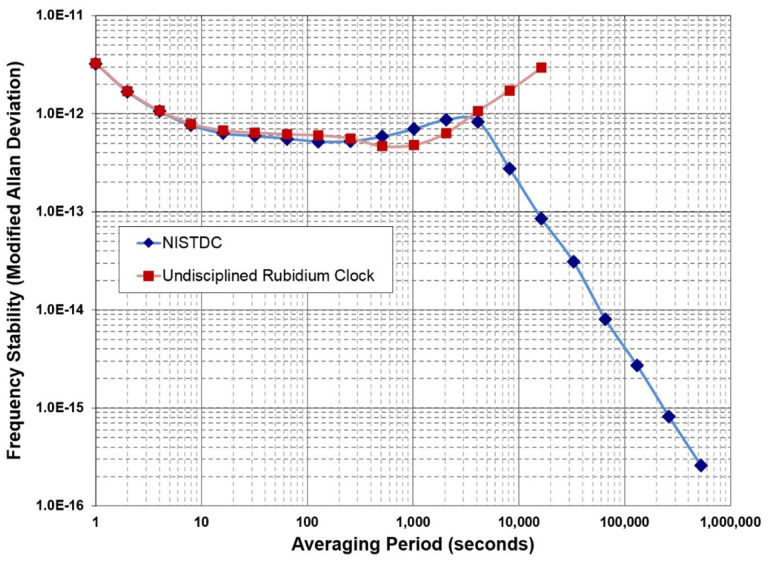
Figure 7 shows the frequency stability of both the undisciplined (free running) rubidium atomic clock and the NISTDC when compared to UTC(NIST). The short term stability of both the disciplined and undisciplined clocks is essentially the same, largely because no common-view correction data is available at intervals shorter than 10 minutes. However, the undisciplined clock reaches a noise floor near 5 × 10⁻¹³, as estimated with the Modified Allan deviation, Mod σy(τ) [41], at an averaging period, τ, of about 1000 s. Due to the effects of frequency drift and aging, the clock’s stability with respect to UTC(NIST) then begins to rapidly get worse. However, at this point the NISTDC control loop takes over, reaching a stability of less than 1 × 10⁻¹⁴ at τ = 1 day, replicating UTC(NIST) performance for all practical purposes. The frequency stability of NISTDC will continue to average down indefinitely, because any differences between UTC(NIST) and the NISTDC are being compensated for by the common-view corrections.
Fig. 7.
Comparison of frequency stability of NISTDC to undisciplined rubidium clock, with respect to UTC(NIST).
4.4. Uncertainty Analysis of NIST Disciplined Clock
The ultimate verification of any time transfer system would require bringing the two clocks being compared into the same laboratory, where they could be directly compared to each other. Direct comparisons are impossible in the case of clocks separated by large distances, which is why time transfer links are necessary in the first place. A time transfer system, regardless of how well it is designed, cannot improve upon the results of a direct comparison. Equaling the result of a direct clock comparison can only be achieved if there are no systematic errors (biases) in the time transfer system calibration, and if the amount of time transfer noise is smaller than the amount of clock noise during the period of the comparison.
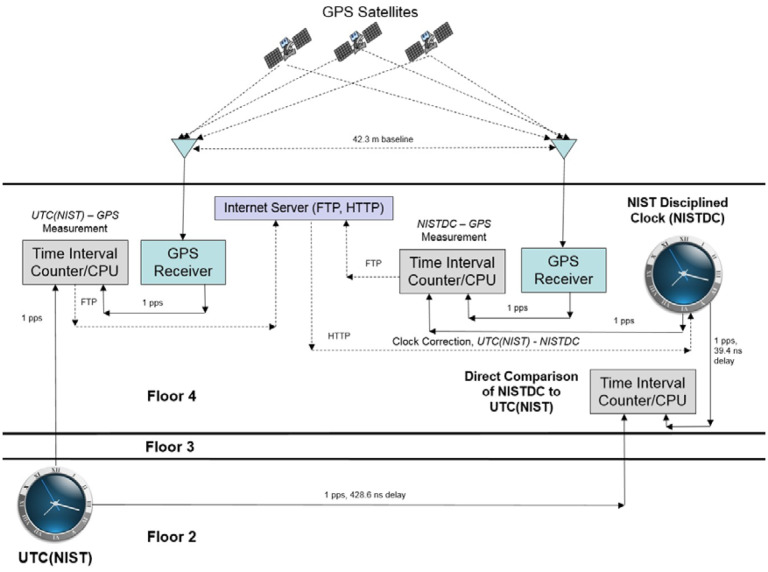
In the case of a newly constructed NISTDC, a direct comparison to UTC(NIST) is possible, and is routinely done in the period after calibration and prior to shipment. During this period, each NISTDC is tested and locked and its 1 pps output is compared to the 1 pps output of UTC(NIST). Figure 8 shows the measurement configuration used to conduct simultaneous common-view and direct comparisons. The two GPS antennas are each located on the roof of the NIST laboratories, separated by a baseline of 42.3 m. The NISTDC is located on the fourth floor of the NIST laboratories and the UTC(NIST) time scale is located on the second floor. A calibrated cable was run from the time scale through a distribution amplifier to a time interval counter located near the NISTDC. The total delay from UTC(NIST) to the time interval counter, including cables and distribution amplifiers, was 428.6 ns. Another calibrated cable, with a delay of 39.4 ns, connected the NISTDC to the same time interval counter. A 5 MHz signal from UTC(NIST) served as the time interval counter’s time base. The time interval readings were collected every second and corrected by software to account for cable and distribution amplifier delays [42].
Fig. 8.
Measurement configuration for direct comparison of a NISTDC to UTC(NIST).
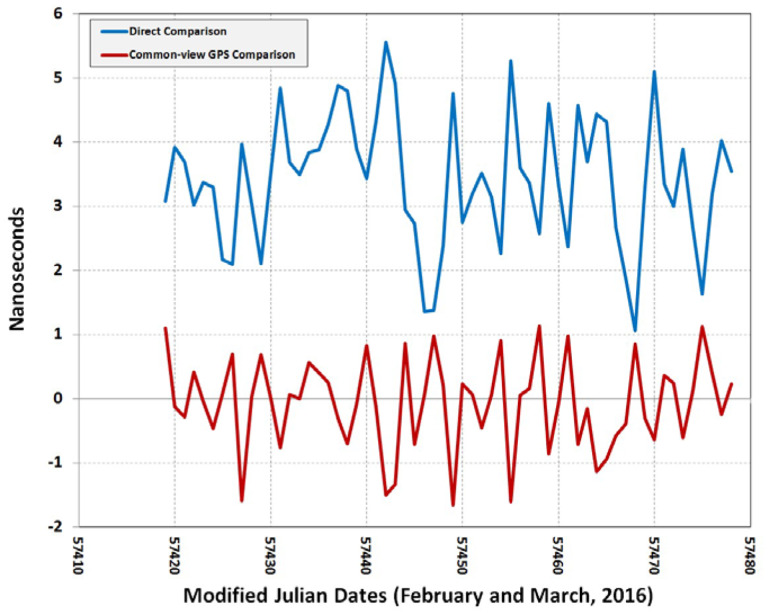
Figure 9 shows the results of a 60-day comparison (February and March 2016) between a NISTDC located in Boulder, Colorado and UTC(NIST). The blue line shows the results of the direct comparison and the red line shows the results of the common-view comparison. For the 60-day interval, the average value of NISTDC – UTC(NIST) was −0.1 ns for the common-view comparison, and 3.4 ns for the direct comparison, a difference of 3.5 ns. This difference is primarily due to biases introduced by the uncertainty of the common-clock calibration (Fig. 5), but other factors, including environmental changes since the time of the calibration, might have also contributed to the difference. The common-view comparison will always produce a smaller time difference because the PID controller, as noted earlier, adjusts the rubidium towards a set point of 0, providing compensation that can hide biases in the calibration.
Fig. 9.
Direct and Common-View Comparisons of a NISTDC at NIST prior to shipment.
Without requiring any measurement uncertainty analysis, the direct comparison results verify that a NISTDC can replicate the accuracy of UTC(NIST) to within a few nanoseconds, limited mostly by the uncertainty of the delay calibration. Once a NISTDC is delivered to a financial market data center and installed in a non-controlled environment, it becomes necessary to mathematically estimate the measurement uncertainty of the common-view comparison method. This is done routinely, and monthly reports of measurement uncertainty are prepared at NIST for each NISTDC.
We identify eight contributors to measurement uncertainty, one of which is evaluated with the Type A method and seven others that are evaluated with the Type B method [43, 44]. Each uncertainty is discussed below and a summary is provided in Table 2.
Table 2.
Measurement Uncertainties of NIST Disciplined Clocks (all values are in nanoseconds)
| Uncertainty Component | Best Case (independent antenna survey, intracontinental baseline) | Worst Case (self-survey of antenna, intercontinental baseline) |
|---|---|---|
| UAN, Time Transfer Noise | 2 | 2 |
| UBA, Antenna Coordinates | 1 | 25 |
| UBC, Calibration | 5 | 5 |
| UBE, Environment | 3 | 3 |
| UBI, Ionospheric Delay | 1 | 3 |
| UBM, Multipath | 2 | 2 |
| UBD, Reference Delay | 0.5 | 0.5 |
| UBR, Resolution | 0.05 | 0.05 |
| UC, k = 2 | 13.3 | 52.0 |
UAN, Time Transfer Noise.
Time transfer noise is evaluated with the Type A method. We use the time deviation [40] at τ = 1 day, which is an established metric for estimating time stability and time transfer noise when the dominant type is white phase noise or flicker phase noise. During normal operation, time transfer noise at τ = 1 day is less than 2 ns, so a value of 2 ns is used for the analysis.
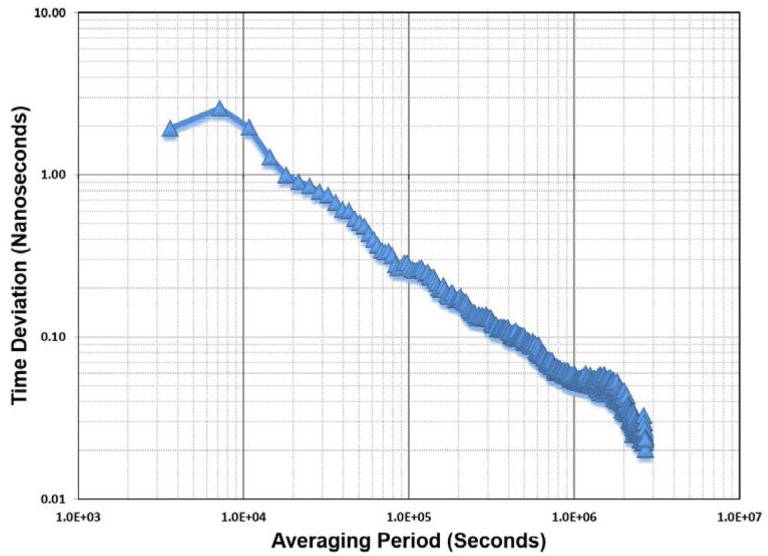
Over short baselines, the time transfer noise can drop well below 1 ns. Figure 10 shows a time deviation graph of a NISTDC operated in Minnesota (1117 km from Boulder) [42]. In this example, the time stability with respect to UTC(NIST) drops below 0.3 ns at τ = 1 day and below 0.1 ns after about one week of averaging.
Fig. 10.
Time stability of a NISTDC with respect to UTC(NIST).
UBA, Antenna Coordinates.
If precise antenna coordinates are not available at the NISTDC site, the system can self-survey its antenna position by averaging position fixes for 24 hours. This method can determine horizontal position (latitude and longitude) to within less than 20 cm. However, because the NISTDC utilizes a single frequency (L1 band) GPS receiver, the self-survey often does a poor job of determining vertical position (elevation). If the antenna has been independently surveyed, typically by use of a dual frequency geodetic GPS receiver, we are confident that both the horizontal and vertical positions have sub-meter uncertainties, and assign a timing uncertainty of 1 ns. If the NISTDC has self-surveyed its antenna we assume a timing uncertainty of 25 ns, based on historical results which indicate that the uncertainty in vertical position can be as large as 10 m.
UBC, Calibration.
The uncertainty of the common-clock calibration performed at NIST (Sec. 4.2) is limited by environmental factors, particularly the temperature inside the laboratory and outdoors near the antenna, that can cause daily values to vary by several nanoseconds. To allow for these variations, we assign an uncertainty of 5 ns to the calibration, based on a rectangular distribution. However, results obtained at NIST from multiple calibrations of the same device indicate that the system delay is likely to be very repeatable when obtained from a 10-day average, and will usually not vary by significantly more than 1 ns.
UBE, Environment.
The NISTDC hardware is subject to delay changes as a function of environmental factors, in particular, changes in temperature. Even though they are located indoors, the GPS receiver and the local atomic clock are more sensitive to temperature changes than either the outdoor antenna or antenna cable. For example, if sudden or gradual changes in the temperature of the data center occur, the system delay can change by several nanoseconds, usually returning to its previous delay when the temperature returns to normal. For these reasons, we assign an uncertainty of 3 ns to account for equipment delay changes caused by the environment.
UBI, Ionospheric Delay.
The NISTDC applies an ionospheric delay correction to the signals broadcast from the GPS satellites based on the model developed by Klobuchar [45]. This model is expected to remove about 50 % of the ionospheric delay. For a common-view disciplined clock operating over an intracontinental baseline, ionospheric delay is less of a problem than with a GPS disciplined clock. This is because the residual amount of ionospheric delay that remains after the correction is applied is similar at both receiving sites and largely cancels out when the common-view data processing is performed. However, the magnitude of ionospheric delay is much larger during the daytime hours than it is during the nighttime, and this introduces additional uncertainty over intercontinental baselines when there are long periods when it is dark at NIST and still daytime at the NISTDC site, or vice versa. When averaged over a 24-hour period, the uncertainty contributed by ionospheric delay is near 1 ns for NISTDCs located in North America and from 2 to 3 ns for devices located on other continents.
UBM, Multipath.
Uncertainty due to multipath is contributed by GPS signals that are reflected from surfaces near the antenna. These reflected signals can interfere with, or be mistaken for, the signals that travel a straight line path from the satellite, resulting in delay changes. When possible, NISTDC antennas are mounted in areas with a clear, unobstructed view of the sky on all sides, and the antenna itself was designed to mitigate multipath [40]. This typically limits the uncertainty introduced by multipath to about 2 ns.
UBD, Reference Delay and UBR, Resolution.
These two uncertainties are normally insignificant but are included in the uncertainty analysis for completeness. The reference delay represents the cable delay from the rubidium clock to the time interval counter. This delay is measured at NIST with an uncertainty estimated as 0.5 ns. The NISTDC software limits the resolution of all entered delay values to 0.1 ns, which is roughly equivalent to the single-shot resolution of the time interval counter. This contributes an insignificant resolution uncertainty of 0.05 ns.
Table 2 shows the “best case” and “worst case” uncertainties of the NISTDC with respect to UTC(NIST). The primary difference is the uncertainty in antenna coordinates when a self-survey is performed, although the uncertainty contributed by ionospheric delay is increased from 1 to 3 ns in the “worst case” example to accommodate for long intercontinental baselines. The combined uncertainty, Uc, is obtained with the root sum of squares method [43, 44], where k is the coverage factor, as
| (2) |
The combined uncertainty (k = 2) for an intracontinental baseline if the antenna position is known with sub-meter uncertainty is estimated as 13.3 ns. If the antenna is self-surveyed, the combined uncertainty is estimated as 52.0 ns.
4.5. Failure Modes and Holdover Capability
The primary cause of failure for a NISTDC, other than hardware failures or power outages at the data center sites, is the loss of data from the UTC(NIST) time scale. This can occur for variety of reasons, including an Internet outage at either the NIST laboratories or the NISTDC site, a NIST server failure, a GPS reception problem that prevents the common-view comparison measurements from occurring, or if no data is being transmitted from UTC(NIST). A software switch was implemented in July 2015 that prevents the transmission of incorrect data from UTC(NIST), so that incorrect data, which had previously caused time errors on several occasions, now has the same effect as no data. When the loss of data occurs, the rubidium clocks at each site go into “holdover” mode where they free run without being disciplined. The stability of an undisciplined rubidium clock operated in a controlled environment was shown in Fig. 7, but rubidium clocks do not provide identical performance when operated in uncontrolled data center environments. This was made evident on October 17, 2015 when a hardware failure prevented UTC(NIST) data from being transmitted for 9 hours and 18 minutes, from 06:34 to 15:52 UTC causing NISTDCs to exceed their normal 50 ns lock threshold. During the UTC(NIST) outage the maximum time differences with respect to UTC(NIST) ranged from 69 ns to 394 ns at seven data center sites (an eighth data center site was performing maintenance on that day), as summarized in Table 3. Based on this analysis and other measurements conducted both at NIST and at customer sites, it is known that a NISTDC can maintain 1 μs synchronization in holdover mode for about one day in the worst case, and for several days in the best case.
Table 3.
Maximum time error of NIST disciplined clocks during a 9-hour holdover period
| NISTDC Data Center Location | Maximum time error during holdover period |
|---|---|
| Aurora, Illinois | 69 ns |
| London, England (LD4) | 103 ns |
| New York, New York | 132 ns |
| Tokyo, Japan (TY3) | 147 ns |
| Frankfurt, Germany (FR2) | 260 ns |
| London, England (LHC) | 387 ns |
| Chicago, Illinois | 394 ns |
Recently new features have been added to the NISTDC to decrease the likelihood of going into holdover mode. In the event of a UTC(NIST) time scale failure, a NISTDC can now switch common-view links and utilize the NIST backup time scale [46]; located 78 km from Boulder in Fort Collins, Colorado, as its reference clock. Switching to the backup time scale will result in a small time shift, typically less than 20 ns. If a network outage occurs, which would temporarily stop common-view data from being processed, a NISTDC can convert itself to a GPS disciplined clock until network connectivity is restored. Although this action temporarily breaks the direct connection to NIST time, the resulting time shift will, again, typically be less than 20 ns. If GPS cannot be received, due to interference or other causes, the NISTDC will enter holdover mode until reception is restored. However, holdover performance far better than that shown in Table 3 can be achieved if the customer elects to purchase and install cesium clocks (the NISTDC software can control either a cesium or a rubidium clock).
A much rarer type of NISTDC failure occurred on January 26, 2016 when 15 GPS satellites, or half of the available constellation, transmitted an incorrect UTC offset parameter for a period of about 12 hours. When processed by the receivers, this incorrect data introduced a time error of approximately 13 μs. If the same incorrect information had been broadcast by all of the satellites, the NISTDCs would not have been affected, because the common-view data processing would have cancelled the error. However, even though UTC(NIST) did not transmit any bad data during the period when GPS was in error, most of the NISTDC sites did periodically receive bad GPS data when NIST was simultaneously transmitting good data, resulting in errors in the common-view measurements. As a result, NISTDCs at seven of the eight data center sites periodically applied large frequency corrections to compensate for the apparent 13 μs time offset. Several strategies are now being considered to prevent the possibility of future failures related to GPS broadcast errors.
5. Delivering Time Stamps to Financial Market Computers
As described in Secs. 3 and 4, a NISTDC installed in a data center near a stock exchange can routinely keep time that is accurate to within nanoseconds of UTC(NIST) and UTC. To meet the synchronization requirements described in Sec. 2, however, all of the computers involved in the operations of the stock exchange must also keep accurate time. Dedicated time servers, located adjacent to a NISTDC and referenced to a 1 pps signal, are utilized to transfer time to the computers that perform and record the financial transactions.
Two industry standard time code protocols are used to transfer accurate time to stock market computers. The first protocol, known as the Network Time Protocol (NTP), was originally developed by David Mills and was one of the first applications and standard protocols distributed via the Internet [47]. Its most recent implementation, version 4, is documented in Ref. [48]. Client software for NTP is included with many operating systems and is easy to obtain for most others. The second protocol, the Precision Time Protocol (PTP) is defined by version 2 of the IEEE-1588 standard [49]. Originally designed for industrial measurement and control applications where various instruments and machines needed a common clock [50, 51], PTP is now commonly utilized in financial markets and other settings to deliver accurate time stamps to computer systems.
The two protocols have many similarities. Both are designed to transfer time information via data packets containing time stamps, and both transmit these packets over network connections. The format of the packets themselves does not give either system an inherent accuracy advantage. Instead, the timing accuracy ultimately obtained with NTP and PTP depends upon other factors; including the accuracy of the source clock, the frequency of the synchronization requests, the holdover capability of the client, software stack delays in both the server and the client, and the asymmetry of the network. The first factor, the accuracy of the source clock, is now often equivalent for both NTP and PTP because both protocols are commonly supported by the same server and referenced to the same clock. However, PTP is typically more accurate than NTP due to advantages in the other mentioned areas. For example, PTP makes more frequent synchronization requests (unlike NTP, the server initiates the synchronization request rather than the client). In multicast mode, PTP synchronization requests may only occur once per second, but NTP synchronization requests typically only occur at intervals measured in minutes or hours. Thus, PTP consumes more bandwidth than NTP but collects more information about network delays. PTP is generally implemented with hardware installed inside the client computer, including better clock hardware and specially designed network interface cards which gives client computers better holdover capability and less uncertainty due to operating system latency. In contrast, NTP is generally implemented entirely in software on client computers. Finally, because PTP is nearly exclusively implemented on local area networks (LANs) where routing is tightly controlled and traffic is limited, it typically delivers time with lower uncertainties than NTP, which is usually implemented on wide area networks (WANs) such as the public Internet, where both the packet routing and the traffic constantly vary.
Both protocols use the well-established method of measuring the round trip delay between the server and the client, assuming that the one-way delay from the server to the client is equal to half of the round trip delay, and then correcting the time received by the client by the one-way delay. This correction compensates for the propagation delay between the server and the client.
To illustrate how this works at a financial exchange location, consider the following example. An NTP server, operated by Perseus, is referenced to a 1 pps signal from a NISTDC that is kept within nanoseconds of NIST time. The client is a computer system that is part of an automated trading platform. The client computer initiates a synchronization request by sending a packet via the user datagram protocol/Internet protocol (UDP/IP) to port 123 of the NTP server. The packet includes the time of the request, T1, as obtained from the client computer’s clock.
The server responds to the timing request by returning a data packet to the client. The NTP client software decodes this data packet, which includes three time stamps. One of the time stamps returned by the server simply echoes back T1, the time when the client made the request (measured by the client). Two other time stamps contain the time, T2, when the request was received by the server, and the time, T3, when the server transmitted its response. When the client receives the packet, it again queries its own clock and records a fourth time stamp, T4, the time of the packet’s arrival. The time difference, TD, between the server and client clocks [47] is then computed as
| (3) |
Using these same four time stamps, the round trip delay between the client and server [47] is computed by the client as
| (4) |
Note that the time interval required for the server to process the NTP request, T3 – T2, is subtracted from the round trip delay because it is a measurement of server processing time and not of propagation delay.
The “divide by 2” in Eq. (3) assumes that the delay from the server to the client is equal to one half of the round trip delay. If this assumption were true, the path delays to and from the server would be equal and dividing by two would fully compensate for all delays. In practice networks are asymmetric, which means that the incoming and outgoing delays are not equal, and this asymmetry adds uncertainty to the time received by the client. The maximum possible time uncertainty that can be added by network asymmetry would equal 50 % of the round trip delay [52], a situation that could only occur if 100 % of the delay was in one direction. To reduce the maximum possible uncertainty that can be contributed by the network, the round trip delay should be made as small as possible. This is done by locating the time servers very close to the stock exchange; ideally in an adjacent equipment rack in the same data center, and by reducing the number of network devices (such as switches, routers, and hubs) between the server and client to a minimum.
Measurements of NTP servers conducted at NIST via the public Internet [53] and several LAN configurations [54] have shown that some asymmetry is always present, even in the simplest of networks. As a very general rule, the time uncertainty caused by asymmetry seldom exceeds 10 % of the round trip delay on the public Internet or a few percent of the round trip delay on a private LAN. This means, for example, that if a client computer anywhere in the continental United States requests time via the public Internet from an NTP server at NIST in Boulder, it is likely that the time error will be less than 10 ms because it is also likely that the round trip delay will be less than 100 ms. If verified, this performance level is sufficient for meeting current synchronization requirements in the United States [20, 22] but not all proposed requirements [24]. If the same server is placed adjacent to the stock exchange, and the round trip delay on a LAN between the server and client is only a few hundred microseconds, the client’s synchronization uncertainty should be on the order of 10 μs [54]. Thus, a NTP server properly synchronized to NIST time via a NISTDC and located close to the stock exchange can meet all existing and proposed clock synchronization requirements. A PTP client computer, when additional hardware has been added and with the configuration advantages discussed earlier, can obtain sub-microsecond time stamp synchronization [55, 56]. However, software only PTP solutions are likely to provide results similar to NTP and performance will vary as a function of the load placed on the operating system [57, 58].
By use of commercial NTP/PTP servers that are synchronized to NIST via NISTDCs and located in data centers adjacent to stock exchanges (with very small round trip delays), Perseus is able to offer its customers computer clock synchronization ranging from 25 μs to 50 μs for NTP and from 1 μs to 50 μs for PTP. Section 6 discusses how the time accuracy is verified.
6. Verification of Time Accuracy
To ensure traceability, the time information sent to financial exchanges should be measured and verified at every link in the chain that connects NIST to the financial market customer. This involves verifying that UTC(NIST) is correct by comparing it to other UTC time scales (Sec. 6.1), and then comparing each NISTDC (Sec. 6.2) and the time stamp packets transmitted by the NTP and PTP servers (Sec. 6.3) to UTC(NIST).
6.1. Comparing UTC(NIST) to other UTC Time Scales
As previously described in Sec. 3.1, the UTC(NIST) time scale is continuously compared to all of the world’s major time scales via the BIPM key comparisons [29, 30]. However, the results of these comparisons are post processed and not available in real time, meaning that they cannot be used to verify that the time currently being transmitted to the stock market is correct. To verify the currently transmitted time, UTC(NIST) is continuously compared to the national time scales of nations in North, Central, and South America, via the Interamerican Metrology System Time Network (SIMTN) [59]. New results from the SIMTN are available every 10 minutes.
To verify that UTC(NIST) is working properly, an alarm system was constructed at NIST based on the SIMTN. This system continuously compares UTC(NIST) in Boulder, via common-view GPS measurements to seven independent time scales; including the national time standards of Argentina, Brazil, Canada, Costa Rica, Mexico, and Panama, and the NIST backup time scale in Fort Collins. It is not unusual for one or two of these time scales to occasionally differ from UTC(NIST) by more than 50 ns, but if four of the seven differ by more than 50 ns, it is highly likely that UTC(NIST) itself is out of tolerance. Thus, when this situation occurs, text message alarms are sent to NIST staff members and will continue to be sent at 10 minute intervals until the time scale is restored to normal operation. At the same time, the NISTDCs will switch to a backup time reference, if necessary, as described in Sec. 4.5. To verify that the alarm system itself is working, daily alarm status text messages are sent to the NIST staff members.
6.2. Comparing each NISTDC to UTC(NIST)
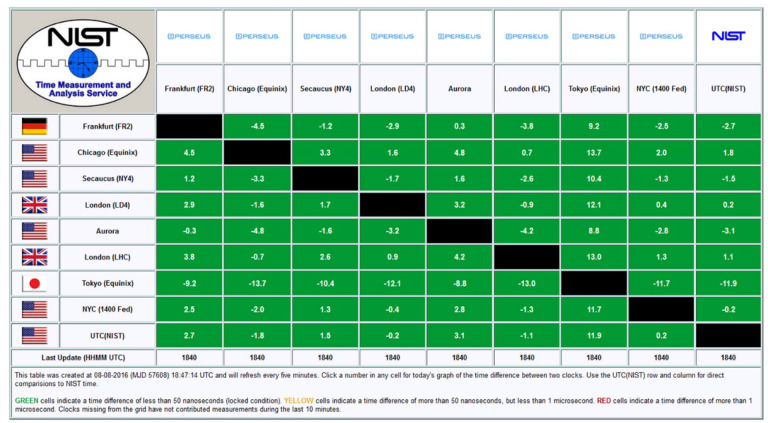
Each of the NISTDCs located at financial system data centers are compared to NIST and to each other via near real-time common-view measurements, a technique first implemented at NIST when developing the SIMTN [59]. Every 10 minutes, each NISTDC uploads its latest measurement results to a NIST server, and the data are processed by applications running on the server. The number of clock comparisons performed every 10 minutes is equivalent to , where n is the number of common-view nodes in the timing network. In the current configuration, with a master system connected to the NIST time scale in Boulder and eight NISTDCs deployed at data centers by Perseus, n = 9, and thus there are 36 continuously processed time comparisons. The results are made available to Perseus in the form of a grid that updates every 10 minutes and is pictured in Fig. 11.
Fig. 11.
Grid displaying the most recently measured time differences between NISTDCs and UTC(NIST).
The grid allows both NIST and Perseus to check the current status of the system at a glance. The values in the grid are in units of nanoseconds (each value has an associated measurement uncertainty that is estimated using the analysis provided in Sec. 4.4 and reported by NIST to Perseus via monthly reports). Under normal operation, the cells in the grid will have a green background indicated that the NISTDC is locked and the time difference displayed in that cell is less than 50 ns. A yellow cell indicates that the current time difference for a particular comparison is between 50 ns and 1000 ns (1 μs), and a red cell indicates a time difference that exceeds 1 μs. A yellow cell is usually not serious and can be caused by a brief loss of lock due a short network outage or other factors. A red cell generally indicates a failure condition that requires immediate attention by NIST and/or Perseus. Clicking on any number in the grid displays a graph of the time comparison between the two selected clocks.
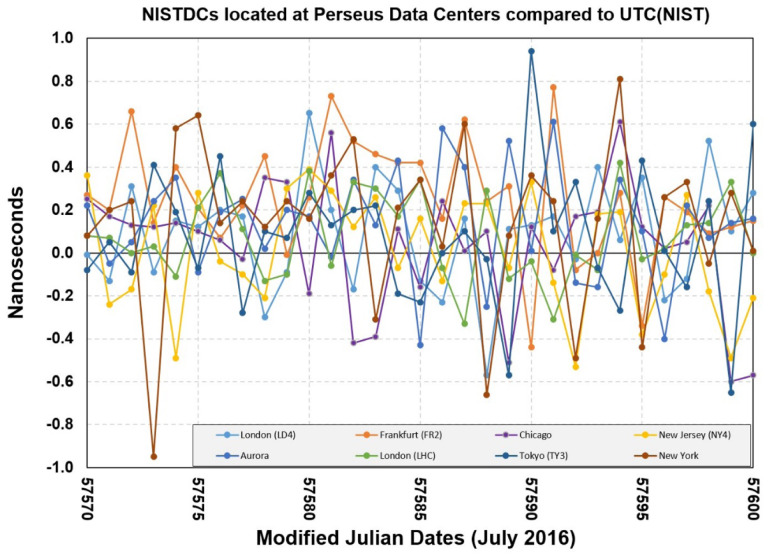
Figure 12 is a graph of the eight NISTDCs located at Perseus data center sites compared to UTC(NIST) for the month of July 2016. The measured average daily time offset of each NISTDC was always within ±1 ns and the average time offset for the month was near 0 at all locations. Note that the measurement uncertainty associated with each of these measurements (Sec. 4.4) is larger than the average daily time offset, but is usually less than 15 ns if the antenna coordinates have been surveyed to within 1 m.
Fig. 12.
The average daily time offsets between eight NISTDCs at Perseus data centers and UTC(NIST).
6.3. Comparing Time Stamp Packets to UTC(NIST)
Electronic trading platforms are automated by computers, and when a financial market transaction is recorded, a time stamp is written to a log file. The accuracy of this time stamp, and not the accuracy of the source clock, determines whether or not the stock market synchronization requirements described in Sec. 2 are being met.
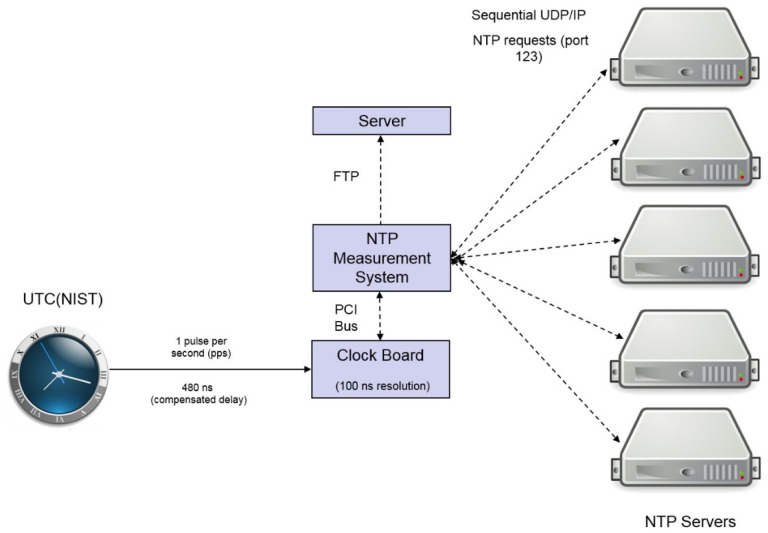
NIST has developed a system, previously described in [53], for comparing received NTP time packets to UTC(NIST) and the development of a similar system for PTP is now under consideration. The system (Fig. 13) contains an internal clock board with 100 ns resolution that is continuously synchronized by a 1 pps (pulse per second) signal from the UTC(NIST) time scale. The cable connecting the measurement system to UTC(NIST) has a calibrated (and compensated) delay of 480 ns. The time kept by the clock board is compared to the time stamps in the NTP packets transmitted by the servers to estimate the uncertainty of the server’s clock.
Fig. 13.
System for measuring the accuracy of received NTP time stamps.
The NTP measurement system requests the time from each NTP server being monitored every 10 s. The request is made by sending a 48-byte packet via the user datagram protocol/Internet protocol (UDP/IP) to port 123 of each server. The last eight bytes of the packet include the time of the request, T1, as obtained from UTC(NIST) via the clock board. The servers respond by returning a data packet that the measurement system decodes. As previously discussed in Sec. 5, the packet includes three 64-bit time stamps; including an echo back of T1, the time when the request was received by the server, T2, and the time when the server sent its response, T3. When the measurement system receives the packet, it again queries the clock board to record T4, the time of the packet’s arrival. The difference between the time transmitted by the server and UTC(NIST) is then computed with Eq. (3), and the round trip delay is computer and recorded by use of Eq. (4).
Figure 14 shows the time differences resulting from a 7-day comparison between UTC(NIST) and a commercial NTP server similar to those used by Perseus. The NTP measurement system and the server are located on the same LAN. Each data point is a 10-minute average obtained by averaging 60 NTP requests taken at 10 s intervals. The average time offset with respect to the NIST time scale is just 2.2 μs, but the range of the time stamp data is 114 μs. The time deviation at τ = 10 minutes is 9.1 μs. The average round trip delay for the 7-day period was 549 μs, meaning that the average time offset was less than 1 % of the average round trip delay, meeting the expected criterion for LAN performance that was discussed in Sec. 5. This type of LAN measurement can be done within any data center where a NISTDC is located by delivering an NTP measurement system to the same site. The NTP measurement system and the NTP server are then each referenced to 1 pps signals from the NISTDC, and the measurement system sends client requests to the server and records the results.
Fig. 14.
Time differences between NTP time stamps transmitted via a LAN and UTC(NIST).
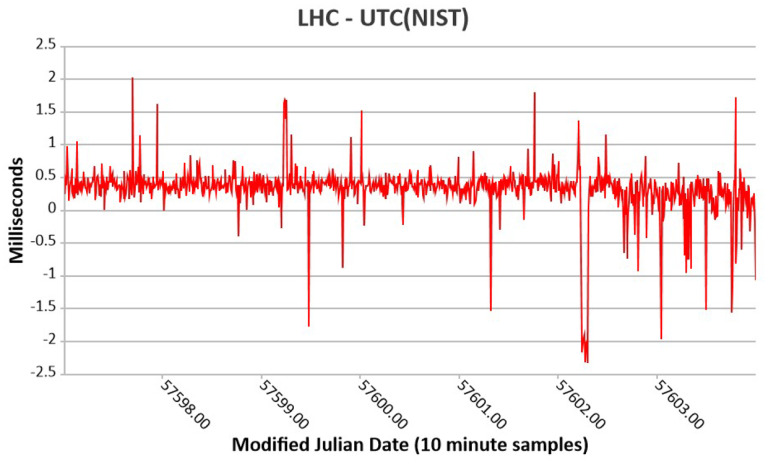
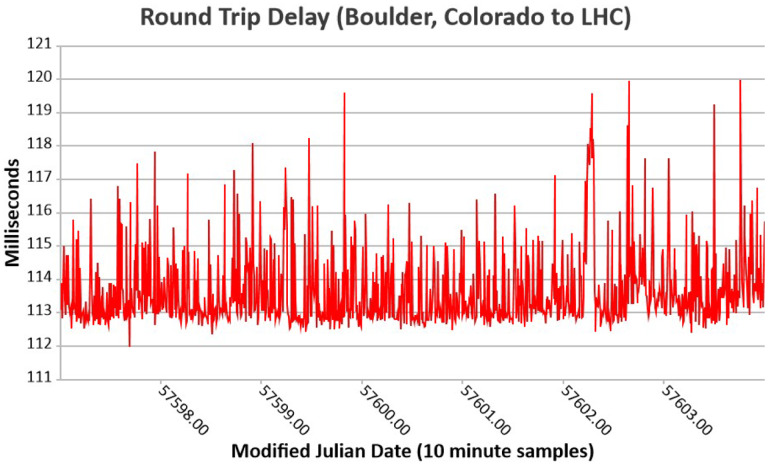
In order to provide end point to end point verification, NIST continuously measures the performance of some Perseus NTP servers from Boulder, Colorado. The uncertainty of these comparisons is limited by the asymmetry in the public Internet, but these measurements provide verification that the time packets being transmitted by the servers are synchronized to UTC(NIST) if the uncertainties fall within an expected range. For example, Fig. 15 shows the time differences resulting from a 7-day comparison between UTC(NIST) and a commercial NTP server operated by Perseus in London that is referenced to a NISTDC. The NTP measurement system is located at NIST in Boulder, Colorado. Each data point is a 10-minute average obtained by averaging 60 NTP requests taken at 10 s intervals. The average time offset with respect to the NIST time is 0.3 ms, but the range of the time stamp data is 4.4 ms. The time deviation at τ = 10 minutes is 256 μs. The average round trip delay for the 7-day period was 113.7 ms with a few outliers exceeding 119 ms (Fig. 16). Even though this measurement involved a trans-Atlantic comparison via the public Internet, the average time offset was much less than 1 % of the average round trip delay. Because asymmetry in the public Internet is both common and reasonable to expect, and because the server is referenced to a NISTDC that is continuously measured and adjusted to agree with UTC(NIST), it is highly likely that nearly all of the 0.3 ms measured time offset is caused by network asymmetry and that the variation in the time received by financial market customers over a LAN would be similar to the data shown in Fig. 14.
Fig. 15.
Time differences between NTP time stamps transmitted from a Perseus server in London and UTC(NIST) as measured in Boulder, Colorado.
Fig. 16.
Round trip delay via public Internet between NIST in Boulder, Colorado and Perseus NTP server in London.
7. Summary
In collaboration with Perseus, NIST provides accurate, traceable, and verifiable time synchronization to world financial markets. This task is accomplished by installing a replica of the UTC(NIST) time scale, in the form of a NISTDC, as close as possible to the stock exchange. The frequency uncertainty of a NISTDC is less than 1 × 10⁻¹⁴ after one day of averaging, and the time uncertainty is less than 15 ns, with respect to UTC(NIST) and UTC. Although this uncertainty is increased by nearly a factor of 1000 into the 1 to 10 μs region by the NTP and PTP servers that transfer time to computer system clients over local area networks, it is still more than 1000 times smaller than the recently approved FINRA OATS requirement in the United States [20] and at least 10 times smaller than the most stringent requirement proposed thus far, the MiFID II requirement in Europe [24] for HFT. Because NISTDCs are continuously measured and compared to national and international time standards, clients who utilize this system can provide verification to auditors and regulators that they are in full compliance with all requirements for financial market time synchronization.
Acknowledgments
The authors thank John Lowe, Jeff Sherman, and Victor Zhang of NIST, as well as the journal’s outside peer reviewers, for their review of this manuscript and for their corrections and comments.
Biography
About the authors: Michael Lombardi and Andrew Novick are staff members in the Services group of the Time and Frequency Division of the National Institute of Standards and Technology (NIST) in Boulder, Colorado. Their research interests include frequency and time transfer and remote calibrations. Michael Lombardi is the project manager for the Time Measurement and Analysis Service (TMAS) and the division quality manager. Andrew Novick is an electronics engineer.
George Neville-Neil is the owner of Neville-Neil Consulting in New York City and a consultant to Perseus. He has worked on the open source Precision Time Protocol (PTP) daemon since 2008 and is the co-author of the 2nd edition of “The Design and Implementation of the FreeBSD Operating System.”
Ben Cooke is the Chief Technical Officer (CTO) for Perseus and the designer of their global precision timing services network. He has been instrumental in the development of low latency networks and infrastructure for high frequency financial trading since 1999. Perseus is a provider of global managed services and high-precision, high-speed connectivity for financial markets.
The National Institute of Standards and Technology is an agency of the U.S. Department of Commerce.
8. References
- [1].Massimb MN. Phelps BD(1994) EElectronic Trading, Market Structure and Liquidity. Financial Analysts Journal 50(1):39–50. 10.2469/faj.v50.n1.39 [DOI] [Google Scholar]
- [2].Easley D, Lopez de Prado MM, O’Hara M (2011) The Microstructure of the “Flash Crash”: Flow Toxicity, Liquidity Crashes, and the Probability of Informed Trading. The Journal of Portfolio Management 37(2):118–128. http://ssrn.com/abstract=1695041 [Google Scholar]
- [3].Engel L, Hecht HR (1994) How to buy stocks (Little, Brown, Boston, MA: ) 8th Ed. [Google Scholar]
- [4].Harris L (2003) Trading and exchanges: market microstructure for practitioners (Oxford University Press, Oxford; New York: ). [Google Scholar]
- [5].Turner T (2007) A Beginner’s Guide To Day Trading Online (Adams Media, Avon, MA: ) 2nd Ed. [Google Scholar]
- [6].Farrell CA (2009) Day trade online (Wiley, Hoboken, NJ: ) 2nd Ed. [Google Scholar]
- [7].Bessembinder H (2003) Trade Execution Costs and Market Quality after Decimalization. The Journal of Financial and Quantitative Analysis 38(4):747–777. 10.2307/4126742 [DOI] [Google Scholar]
- [8].Menkveld AJ (2013) High frequency trading and the new market makers. Journal of Financial Markets 16(4):712–740. 10.1016/j.finmar.2013.06.006 [DOI] [Google Scholar]
- [9].Goldstein MA, Kumar P, Graves FC (2014) Computerized and High-Frequency Trading. Financial Review 49(2):177–202. 10.1111/fire.12031 [DOI] [Google Scholar]
- [10].Laughlin G, Aguirre A, Grundfest J (2014) Information Transmission between Financial Markets in Chicago and New York. Financial Review 49(2):283–312. 10.1111/fire.12036 [DOI] [Google Scholar]
- [11].Angel JJ (2014) When Finance Meets Physics: The Impact of the Speed of Light on Financial Markets and Their Regulation. Financial Review 49(2):271–281. 10.1111/fire.12035 [DOI] [Google Scholar]
- [12].United States Securities and Exchange Commission (1996) Report Pursuant to Section 21(a) of the Securities Exchange Act of 1934 Regarding the NASD and the NASDAQ Market, (SEC, Washington, D.C.). [Google Scholar]
- [13].National Association of Securities Dealers (1998) OATS Reporting Technical Specifications, (NASD, Inc; Rockville, MD: ). [Google Scholar]
- [14].Lombardi MA, Hanson DW (2005) The GOES time code service, 1974–2004: A retrospective. J Res Natl Inst Stan 110(2):79–96. 10.6028/jres.110.008 [DOI] [PMC free article] [PubMed] [Google Scholar]
- [15].United States Securities and Exchange Commission (2003) Self-Regulatory Organizations; Order Approving Proposed Rule Change by the New York Stock Exchange, Inc. Relating to Order Tracking, (SEC, Washington, D.C.), Release No. 34–47689, File No. SR-NYSE-99–51. [Google Scholar]
- [16].Lombardi MA, Nelson GK (2014) WWVB: A Half Century of Delivering Accurate Frequency and Time by Radio. J Res Natl Inst Stan 119:25–54. 10.6028/jres.119.004 [DOI] [PMC free article] [PubMed] [Google Scholar]
- [17].Sherman JA, Levine J (2016) Usage Analysis of the NIST Internet Time Service. J Res Natl Inst Stan 121 10.6028/jres.121.003 [DOI] [PMC free article] [PubMed] [Google Scholar]
- [18].Financial Industry Regulatory Authority (2016) OATS Reporting Technical Specifications, (FINRA, Rockville, MD: ). [Google Scholar]
- [19].Financial Industry Regulatory Authority (2014) Equity Trading Initiatives: Synchronization of Business Clocks (FINRA, Rockville, MD: ), Regulatory Notice 14–47. [Google Scholar]
- [20].Financial Industry Regulatory Authority (2016) Clock Synchronization, (FINRA, Rockville, MD: ), Regulatory Notice 16–23. [Google Scholar]
- [21].United States Securities and Exchange Commission (2012) Consolidated Audit Trail, (SEC, Washington, D.C.), Release No. 67457, File No. S7–11-10, 77 FR 45722. [Google Scholar]
- [22].United States Securities and Exchange Commission (2016) National Market System Plan Governing the Consolidated Audit Trail Pursuant to Rule 613 of Regulation NMS under the Securities Exchange Act of 1934, draft copy (SEC, Washington, D.C.). [Google Scholar]
- [23].Union European (2014) Directive 2014/65/EU of the European Parliament and of the Council of 15 May 2014 on markets in financial instruments and amending Directive 2002/92/EC and Directive 2011/61/EU. Official Journal of the European Union 57:349–496. http://data.europa.eu/eli/dir/2014/65/oj [Google Scholar]
- [24].Securities European and Authority Markets (2015), Regulatory technical and implementing standards – Annex I: MiFID II / MiFIR, (ESMA, Paris, France: ), ESMA/2015/1464. [Google Scholar]
- [25].Comptes Rendus de la 13e CGPM (1967/68), p.103 Available at http://www.bipm.org/utils/common/pdf/CGPM/CGPM13.pdf. Accessed October 3, 2016.
- [26].McCarthy DD, Seidelmann KP (2009) Time: From Earth Rotation to Atomic Physics (Wiley, Germany: ). [Google Scholar]
- [27].Audoin C, Guinot B (2001) The Measurement of Time: Time, Frequency and the Atomic Clock (Cambridge University Press, Cambridge, Massachusetts: ). [Google Scholar]
- [28].Sigfrido L (2005) The definition of the ‘atomic’ second. Metrologia 42(3):S10–19. 10.1088/0026-1394/42/3/S03 [DOI] [Google Scholar]
- [29].Bureau International des Poids et Mesures (2014) BIPM Annual Report on Time Activities (BIPM, Cedex, France: ), Vol. 9. [Google Scholar]
- [30].Arias EF (2005) The metrology of time. Philos T Roy Soc A 363(1834):2289–2305. 10.1098/rsta.2005.1633 [DOI] [PubMed] [Google Scholar]
- [31].Parker TE, Jefferts SR, Heavner TP, Donley EA (2005) Operation of the NIST-F1 caesium fountain primary frequency standard with a maser ensemble, including the impact of frequency transfer noise. Metrologia 42(5):423–430. 10.1088/0026-1394/42/5/013 [DOI] [Google Scholar]
- [32].Nelson GK, Lombardi MA, Okayama DT (2005) NIST Time and Frequency Radio Stations: WWV, WWVH, and WWVB, (U.S. Department of Commerce, Washington, D.C.), NIST Special Publication 250–67. 10.6028/NIST.SP.250-67 [DOI] [Google Scholar]
- [33].Levine J, Weiss M, Davis DD, Allan DW, Sullivan DB (1989) The Nist Automated Computer-Time Service. J Res Natl Inst Stan 94(5):311–321. 10.6028/jres.094.029 [DOI] [PMC free article] [PubMed] [Google Scholar]
- [34].Jespersen JL (1970) A Survey of Time and Frequency Dissemination Techniques. In Proceedings of the 1970 Frequency Control Symposium, pp 322–324. [Google Scholar]
- [35].Mitchell AM (1963) Frequency Comparison of Atomic Standards by Radio Links. Nature 198(488):1155–1158. 10.1038/1981155a0 [DOI] [Google Scholar]
- [36].Allan DW, Weiss MA (1980) Accurate Time and Frequency Transfer During Common-View of a GPS Satellite. In Proceedings of the 1980 Frequency Control Symposium, pp 334–346. [Google Scholar]
- [37].Pierce JA (1957) Intercontinental Frequency Comparison by Very Low-Frequency Radio Transmission. Proc IRE 45(6):794–803. 10.1109/JRPROC.1957.278477 [DOI] [Google Scholar]
- [38].Lombardi MA, Dahlen AP (2010) A common-view disciplined oscillator. Rev Sci Instrum 81(5). 10.1063/1.3430071 [DOI] [PubMed] [Google Scholar]
- [39].Lombardi MA (2010) A NIST Disciplined Oscillator: Delivering UTC(NIST) to the Calibration Laboratory. NCSLI Measure 5(4):46–54. 10.1080/19315775.2010.11721537 [DOI] [Google Scholar]
- [40].Kunysz W (2000) High Performance GPS Pinwheel Antenna. In Proceedings of the International Technical Meeting of The Satellite Division of the Institute of Navigation. [Google Scholar]
- [41].Institute of Electrical and Electronics Engineers (2008) IEEE Standard Definitions of Physical Quantities for Fundamental Frequency and Time Metrology---Random Instabilities. IEEE Std Std 1139–2008:c1–35. 10.1109/IEEESTD.2008.4797525 [DOI] [Google Scholar]
- [42].Lombardi MA, A. Novick N, J López-Romero JM, Ramos R (2012) Replicating UTC(NIST) at Remote Sites. In Proceedings of the 44th Annual Precise Time and Time Interval Systems and Applications Meeting, pp 79–90. [Google Scholar]
- [43].Bureau International des Poids et Mesures-Joint Committee for Guides in Metrology (2008) Evaluation of measurement data – Guide to the expression of uncertainty in measurement. JCGM 100:2008 Available at http://www.bipm.org/utils/common/documents/jcgm/JCGM_100_2008_E.pdf. Accessed October 3, 2016. [Google Scholar]
- [44].Taylor BN, Kuyatt CE (1994) Guidelines for Evaluating and Expressing the Uncertainty of NIST Measurement Results, (U.S. Department of Commerce, Washington, D.C.), NIST Technical Note 1297. 10.6028/NIST.TN.1297 [DOI] [Google Scholar]
- [45].Klobuchar JA (1987) Ionospheric Time-Delay Algorithm for Single-Frequency GPS Users. IEEE Transactions on Aerospace and Electronic Systems AES-23(3):325–331. 10.1109/TAES.1987.310829 [DOI] [Google Scholar]
- [46].Levine J (2008) Realizing UTC(NIST) at a remote location. Metrologia 45(6):S23–S33. 10.1088/0026-1394/45/6/S04 [DOI] [Google Scholar]
- [47].Mills DL (2006) Computer Network Time Synchronization: The Network Time Protocol (CRC Press, Boca Raton, FL: ). [Google Scholar]
- [48].Internet Engineering Task Force (2010) Network Time Protocol Version 4: Protocol and Algorithms Specification, (IETF Trust, Fremont, CA: ), RFC 5905. [Google Scholar]
- [49].Institute of Electrical and Electronics Engineers (2008) IEEE Standard for a Precision Clock Synchronization Protocol for Networked Measurement and Control Systems. IEEE Std 1588–2008 (Revision of IEEE Std 1588–2002):1–269. 10.1109/IEEESTD.2008.4579760. [DOI] [Google Scholar]
- [50].Eidson JC, Fischer M, White J (2002) IEEE-1588 Standard for a Precision Clock Synchronization Protocol for Networked Measurement and Computer Systems. In Proceedings of the 34th Annual Precise Time and Time Interval Systems and Applications Meeting, pp 243–253. [Google Scholar]
- [51].Eidson JC, Kang L (2003) Sharing a common sense of time. IEEE Instrumentation & Measurement Magazine 6(1):26–32. 10.1109/MIM.2003.1184276 [DOI] [Google Scholar]
- [52].Levine J (2016) An Algorithm for Synchronizing a Clock When the Data Are Received Over a Network With an Unstable Delay. Ieee T Ultrason Ferr 63(4):561–570. 10.1109/Tuffc.2015.2495014 [DOI] [PMC free article] [PubMed] [Google Scholar]
- [53].Lombardi MA, Levine J, Lopez JM, Jiménez F, Bernard J, Gertsvolf M, Sanchez H, Fallas OG, Forero LCH, Carvalho RJd, Fittipaldi MN, Solis RF, Espejo F (2014) International Comparisons of Network Time Protocol Servers. In Proceedings of the 46th Annual Precise Time and Time Interval Systems and Applications Meeting, pp 57–66. [Google Scholar]
- [54].Novick AN, Lombardi MA (2015) Practical limitations of NTP time transfer. 2015 Joint Conference of the IEEE International Frequency Control Symposium & the European Frequency and Time Forum, pp 570–574. 10.1109/FCS.2015.7138909 [DOI] [Google Scholar]
- [55].Li Z, Zhong S, Zhu W, Qin B (2013) A Hardware Time Stamping Method for PTP Messages Based on Linux System. Telkomnika 11(9):5105–5111. 10.11591/telkomnika.v11i9.3255 [DOI] [Google Scholar]
- [56].I Chao IC, Lin SY, Lee KB, Proctor F, Shen CC, Chang FR (2014) Precise latency measurement of unidirectional-data-flow network equipment. 2014 IEEE International Frequency Control Symposium (FCS), pp 1–3. 10.1109/FCS.2014.6859840 [DOI] [Google Scholar]
- [57].Cochran R, Marinescu C, Riesch C (2011) Synchronizing the Linux system time to a PTP hardware clock. In Proceedings of the 2011 International IEEE Symposium on Precision Clock Synchronization for Measurement Control and Communication, pp 87–92. 10.1109/ISPCS.2011.6070158 [DOI] [Google Scholar]
- [58].Kovácsházy T, Ferencz B (2012) Performance evaluation of PTPd, a IEEE 1588 implementation, on the x86 Linux platform for typical application scenarios. In Proceedings of the 2012 IEEE International Instrumentation and Measurement Technology Conference, pp 2548–2552. 10.1109/I2MTC.2012.6229387 [DOI] [Google Scholar]
- [59].Lombardi MA, Novick AN, Lopez JM, Jimenez F, Lopez ED, Boulanger JS, Pelletier R, de Carvalho RJ, Solis R, Sanchez H, Quevedo CA, Pascoe G, Perez D, Bances E, Trigo L, Masi V, Postigo H, Questelles A, Gittens A (2011) The SIM Time Network. J Res Natl Inst Stan 116(2):557–572. 10.6028/jres.116.005 [DOI] [PMC free article] [PubMed] [Google Scholar]


