Abstract
Deposition of mineral dust into ocean fertilizes ecosystems and influences biogeochemical cycles and climate. In-situ observations of dust deposition are scarce, and model simulations depend on the highly parameterized representations of dust processes with few constraints. By taking advantage of satellites’ routine sampling on global and decadal scales, we estimate African dust deposition flux and loss frequency (LF, a ratio of deposition flux to mass loading) along the trans-Atlantic transit using the three-dimensional distributions of aerosol retrieved by spaceborne lidar (CALIOP) and radiometers (MODIS, MISR, and IASI). On the basis of a ten-year (2007–2016) and basin scale average, the amount of dust deposition into the tropical Atlantic Ocean is estimated at 136 – 222 Tg yr-1. The 65–83% of satellite-based estimates agree with the in-situ climatology within a factor of 2. The magnitudes of dust deposition are highest in boreal summer and lowest in fall, whereas the interannual variability as measured by the normalized standard deviation with mean is largest in spring (28–41%) and smallest (7–15%) in summer. The dust deposition displays high spatial heterogeneity, revealing that the meridional shifts of major dust deposition belts are modulated by the seasonal migration of the intertropical convergence zone (ITCZ). On the basis of the annual and basin mean, the dust LF derived from the satellite observations ranges from 0.078 to 0.100 d−1, which is lower than model simulations by up to factors of 2 to 5. The most efficient loss of dust occurs in winter, consistent with the higher possibility of low-altitude transported dust in southern trajectories being intercepted by rainfall associated with the ITCZ. The satellite-based estimates of dust deposition can be used to fill the geographical gaps and extend time span of in-situ measurements, study the dust-ocean interactions, and evaluate model simulations of dust processes.
Keywords: aerosol, dust deposition, long-range transport, satellite remote sensing
1. Introduction
North Africa is by far the largest source of mineral dust to the global atmosphere [Prospero et al., 2002; Engelstaedter et al., 2006]. Massive dust lifted by strong winds from the deserts can be transported long distances across the tropical Atlantic Ocean, reaching the Americas [Prospero, 1999; Prospero et al., 2014; Yu et al., 2015a, 2015b]. Along the dust’s transit across the Atlantic, some is lost into the ocean, on account of cloud and precipitation scavenging (collectively referred to as wet deposition), as well as turbulent diffusion and gravitational settling (collectively referred to as dry deposition). Airborne dust can degrade air quality, perturb the radiation budget, modulate cloud lifecycles and properties, and influence large scale circulations and the water cycle [e.g., Prospero, 1999; Yuan et al., 2016; Kok et al., 2017; Lou et al., 2017; Yang et al., 2017; Song et al., 2018]. Nutrients associated with the deposited dust have been linked to the biological productivity of marine ecosystems, thus modifying the uptake of atmospheric CO2, global biogeochemical cycles, and climate [Mills et al., 2004; Jickells et al., 2005; Moore et al., 2009].
Dust deposition is highly heterogeneous both in space and time, due to the sporadic nature of dust events and large variability of atmospheric transport and removal processes that, in turn, are controlled by meteorological conditions (e.g., precipitation, winds, and atmospheric stability) [Prospero et al., 1987]. To quantify such large variability requires observations over extensive areas and on a long-term basis (e.g., multiple years or even decades) [Schulz et al., 2012]. However, in-situ measurements of dust deposition are extremely challenging and are particularly scarce in open oceans [Schulz et al., 2012; Anderson et al., 2016]. Connecting these sparse observations through global modeling is possible, however, the current parameterizations of dust processes including emissions, transport, and removals are highly uncertain [Huneeus et al., 2011; Kim et al., 2014]. For example, there is a strong and complex dependence of dry deposition velocity on surface properties, dust size distribution, wind speed and atmospheric turbulence [Duce et al., 1991] for which models cannot yet emulate. Wet deposition (precipitation scavenging) is also poorly constrained in models due to a lack of observations and complicated, meteorologically controlled microphysical processes among aerosol particles, cloud condensation nuclei, and raindrops [Ridley et al., 2012; Wang et al., 2013]. When comparing about a dozen global aerosol models to the observed dust deposition, there are overall discrepancies of up to a factor of 10 [Huneeus et al., 2011] with even larger discrepancies when attempting to separate the relative contributions of wet and dry deposition processes [Prospero et al., 2010].
Satellites, because of their extensive spatial and temporal coverage, can be used to characterize and quantify the intercontinental transport of dust and other aerosol types [Yu et al., 2013]. Current satellite-derived products include near-global estimates of aerosol optical depth (AOD) as well as aerosol vertical distribution [Yu et al., 2006; Winker et al., 2010; Yu & Zhang, 2013]. Enhanced remote sensing capabilities enables us to derive particle shape, size, and absorption information, which helps to distinguish dust from combustion and marine aerosols [Kaufman et al., 2005; Kahn et al., 2007; Kahn & Gaitley, 2015; Tanre et al., 2011; Yu et al., 2009, 2015a]. Since measurement of AOD and particle properties tend to be more accurate over ocean than over land, it is feasible to quantify the aerosol transported from one continent to another [Kaufman et al., 2005; Rudich et al., 2008; Yu et al., 2008, 2012, 2015a, 2015b]. However, while such studies have offered a glimpse into the bulk deposition of dust into the ocean basin [Yu et al., 2013], details of the fate of dust on sub-basin scales remain elusive. It is important to note that satellite observations of AOD and dust optical depth (DOD) cannot be directly used as proxies for dust deposition, because dust deposition depends strongly on the vertical profile of dust and is a balance between the change of mass loading and the zonal/meridional transport [Schepanski et al., 2009; Yu et al., 2013; Yu et al., 2015b].
This study explores the use of multiple satellite products to characterize the seasonal dust deposition into the tropical Atlantic Ocean at 5° (longitude) by 2° (latitude) spatial resolution over a decadal time span of 2007–2016. Satellite products include retrievals of aerosol loading, particle properties, and vertical profiles from the Cloud-Aerosol Lidar with Orthogonal Polarization (CALIOP), the Moderate Resolution Imaging Spectroradiometer (MODIS), the Multiangle Imaging Spectroradiometer (MISR), and the Infrared Atmospheric Sounding Interferometer (IASI). These distinct satellite products provide independent characterizations of atmospheric dust. While it is tempting to integrate these data to achieve a more complete characterization of dust transport and deposition, lack of quantitative understanding of differences among the instruments and datasets make the integration premature and impractical. In this study, the only integration performed is combining the dust vertical profile from CALIOP with dust column loading from MODIS, MISR, and IASI. Thus, we use the variation of independent assessments from the different sensors as a starting point for estimating the uncertainty of the results. Section 2 briefly describes the satellite data and approaches to integration and characterizing dust three-dimensional distributions and estimating dust deposition. The temporal and spatial variations of DOD, dust deposition and dust loss frequency, including comparisons with those in literature, are presented in Section 3. Section 4 discusses limitations of the method, uncertainties in the estimated dust deposition, and potential applications of the data sets. Major findings learned from this multi-satellite analysis are summarized in Section 5.
2. Data and Approaches
2.1. Satellite characterizations of dust
Mineral dust particles are generally large in size and irregular in shape, which provides a basis for distinguishing dust from other aerosol types (e.g., marine aerosol, combustion aerosol). This study uses remote sensing data of aerosol loading (e.g., AOD, extinction coefficient, and backscatter coefficient) and particle properties (e.g., size, and shape) derived from the optical measurements from spaceborne lidar (CALIOP) and radiometers (MODIS, MISR, and IASI) to characterize the dust distributions. Each of these sensors has its unique characteristics and observables. Below is a brief description of the data and methods used to separate dust from other aerosol types. This is a prerequisite for estimating the dust deposition from satellites.
CALIOP:
CALIOP is a two-wavelength (532 and 1064 nm), polarization lidar onboard the Cloud-Aerosol Lidar and Infrared Pathfinder Satellite Observation (CALIPSO) satellite [Hunt et al., 2009]. Since June 2006, the lidar has been collecting an almost continuous record of high-resolution (as fine as 30 m in the vertical) profiles of aerosol and clouds, day and night, covering 82°N to 82°S [Winker et al., 2009; 2010]. In this study, we use nighttime, clear-sky data from the CALIOP Version 4, level-2 aerosol profile product [Young et al., 2018]. Though measurements from the other satellites are available for daytime only, the nighttime CALIOP measurements have the advantage of the enhanced signal to noise ratios (SNRs), thus better quality than the day time measurements. To further assure the use of only high-quality data for the analysis, we also apply a data screening scheme using a set of quality assurance flags similar to Yu et al. [2015a] but with a much stricter range of cloud-aerosol discrimination (CAD) score between [−100, −90] (instead of [−100, −20] for earlier versions of CALIOP data as used in our previous studies [Yu et al., 2010; 2012; 2015a, 2015b]). Although the CALIOP data portal provides AOD for “dust” and dust mixtures (i.e., “polluted dust”, “dusty marine”), it is difficult to extract dust component from these dust mixtures. Using just “dust” will underestimate dust loading in the atmosphere, while using the full value of the mixtures will overestimate the loading. Therefore, we derive dust extinction and optical depth as follows.
Given that mineral dust is largely coarse in size and non-spherical in shape, it has a much larger depolarization ratio than primarily spherical marine and combustion-generated particles. We partition the aerosol backscatter coefficient at 532 nm into dust and non-dust components by using pre-determined thresholds of particulate depolarization ratio (PDR) for dust and non-dust particles, respectively. Considering the natural variability of dust properties, two sets of PDR threshold values (δd = 0.20 and 0.30 for dust and δnd = 0.07 and 0.02 for non-dust aerosol) have been used to represent the most optimal separation of dust and non-dust aerosols, following Yu et al. [2015a, 2015b]. Data with PDR values in between the thresholds of dust and non-dust are considered as a mixture, and a fraction of dust in such mixture is derived from the definition of PDR [Yu et al., 2012, 2015a]. Dust extinction is then calculated by multiplying the so-obtained dust backscatter coefficient by the characteristic dust lidar ratio of 44 sr, consistent with the number used in the CALIOP V4 product [Kim et al., 2018]. Finally, CALIOP DOD is calculated by integrating the dust extinction profile in the vertical.
MODIS:
MODIS, onboard both the Terra (10:30 AM equatorial overpassing and since 2000) and Aqua (1:30 PM equatorial overpassing and since 2002) satellites, is a multi-wavelength imager with 36 discrete channels ranging from 0.41 to 14.4 μm. It acquires nearly global and daily aerosol observations with a swath of 2330 km. Due to its wide spectral range and the simplicity of the dark ocean surface, MODIS has the capability of retrieving AOD with a relatively high accuracy as well as information about particle size over oceans [Remer et al., 2005]. One of such size parameters in the MODIS Dark Target (DT) retrieval product is the fine-mode fraction (FMF), that reports the fractional contribution of fine-mode (submicron) particles to total AOD at 550 nm [Remer et al., 2005].
In this study, we derive daily over-ocean DOD from the Aqua/MODIS Collection 6 (C6) product [Levy et al., 2013; 2018] at 1°x1° resolution, following a method first developed by Kaufman et al. [2005] and then modified by Yu et al. [2009]. Briefly, this method partitions AOD into three components: dust, marine aerosol and combustion (or pollution) aerosol. DOD and combustion AOD can then be derived from MODIS-retrieved AOD and FMF by setting characteristic FMF values for the individual components based on MODIS, and parameterizing marine AOD as a function of surface wind speed. It is worth noting that at no point is dust assumed to be purely coarse mode or that combustion aerosol is purely fine mode. In this study, we re-derive Aqua-MODIS C6-specific characteristic FMFs following the approach described in previous work [Kaufman et al., 2005] to maximize the self-consistent use of the MODIS DT product [Yu et al., 2009]. The characteristic FMF so-derived is 0.31, 0.48, and 0.89 for dust, marine, and combustion aerosol, respectively. These Aqua-MODIS C6-specific characteristic FMFs are somewhat different from the values based on Terra-MODIS Collection 5 [Yu et al., 2009] and the earlier Collection 4 version [Kaufman et al., 2005], which presumably reflects the sensitivity of aerosol retrievals to the details of instrument calibration and aerosol models that evolve with different versions of Collections. Marine aerosol optical depth in this study is assumed to increase with surface wind speed. Following an average of the relationships from Kiliyanpilakkil & Meskhidze [2011] and Mulcahy et al. [2008], we derive a global ocean mean AOD for marine aerosol of 0.066 at 0.55 μm, which agrees with the climatology based on the Aerosol Robotic Network (AERONET) observations [Kaufman et al., 2001; Smirnov et al., 2002].
MISR:
MISR is a multiangle spectroradiometer that has been acquiring data onboard the sun-synchronous Terra satellite since 2000 along with MODIS. It measures radiances reflected by the surface-atmosphere system at four wavelengths (centered at 0.446, 0.558, 0.672, and 0.866 μm) and from nine angles, with global coverage acquired over a period of about a week [Diner et al., 1998]. As a result, it retrieves AOD and particle properties over both dark and bright surfaces, including non-spherical fraction, single-scattering albedo, and particle size [Kalashnikova et al., 2005, Kalashnikova & Kahn, 2006; 2008; Kahn et al., 2007; Kahn & Gaitley, 2015]. The AOD component fractions from the MISR Dark Water retrieval have an uncertainty of ~20% for all MISR viewing geometries when the AOD exceeds about 0.1 [Kahn et al., 2001], however the MISR non-sphericity product can be contaminated by sub-visible cirrus [Pierce et al., 2010; Kalashnikova et al., 2013]. The thin cirrus contamination is not expected to be a major problem in the tropical Atlantic. In this study we use MISR Version 23 [Garay et al, 2017; Witek et al., 2018] non-spherical AOD at 0.558 μm to represent DOD over ocean.
IASI:
IASI, launched on the European Meteorological Operation (MetOp) satellite series (A and B), measures infrared radiation in 8461 spectral channels between 3.63 μm and 15.5 μm at high spectral resolution of 0.50 cm-1. The instrument has been operating since July 2007 and provides near-global coverage twice a day (crossing Equator at 9:30 AM and 9:30 PM) with a swath of about 2200 km and a spatial resolution of 12 km at nadir [Hilton et al., 2012]. In this study, we use the Version 2.2 AOD product developed at the CNRS LMD, which is retrieved from IASI onboard MetOP-A [Peyridieu et al., 2013; Capelle et al., 2014]. The 0.5°x0.5° monthly AOD data covering 60°S-60°N were produced by aggregating retrievals at the satellite pixel resolution, day and night [Capelle et al., 2018]. Because of negligible extinction by small combustion particles at the thermal infrared (TIR) wavelengths and the generally low altitude of marine aerosol (hence not readily distinguishable from the surface), IASI is primarily sensitive to dust layers, in particular, coarse mode dust particles. We thus use the retrieved AOD from IASI at 10 μm to represent DOD at that wavelength. Note that the IASI DOD at 10 μm should be smaller than DOD in the mid-visible as retrieved from CALIOP, MODIS, and MISR, with the difference depending on the size distribution of dust particles and as well as on the refractive index [e.g., Capelle et al., 2014]. We reconcile the wavelength difference based on observations of dust size distribution, which is discussed later in 3.1.
2.2. Estimates of dust transport, deposition, and loss frequency
We estimate dust transport and deposition by following four steps, similar to the method described in our previous studies [Yu et al., 2008, 2012, 2015a, 2015b], First, we derive the three-dimensional (3-D) dust extinction distribution from the datasets described in section 2.1. We use CALIOP data to derive standalone 3-D distributions of dust extinction on a monthly basis, which can be used to estimate the dust transport and deposition. Second, we derive the dust mass concentration by using observation-based dust mass extinction efficiency (MEE), as the dust extinction is the product of dust mass concentration and MEE. MEE is strongly dependent on the dust density and particle size distribution (PSD) [Mahowald et al., 2014]. Kaufman et al. [2005] adopted a MEE at 0.55 μm of 0.37 m2 g−1 based on several observations of dust size distribution and density over the eastern tropical Atlantic Ocean [Maring et al., 2003; Haywood et al.., 2003]. This value is in close agreement with the 0.39 m2/g [Ryder et al., 2013] and 0.32 m2 g−1 [Ryder et al., 2018] calculated from more recent aircraft observations of dust PSD in the Saharan Air Layer off the African coast. Due to the preferential removal of large particles from the atmosphere, dust PSD would shift to smaller particle sizes and MEE is expected to increase with distance traveled. In this study, we assume that dust MEE increases linearly with dust transport distance, from 0.37 m2 g−1 near the African coast (east to the 20°W) to 0.60 m2 g−1 at 100°W, to account for possible preferential removal of larger dust particles during transport. The MEE of 0.60 m2 g−1 is consistent with the Goddard Chemistry Aerosol Radiation Transport (GOCART) model in the region [Kim et al., 2014]. We also assume that dust MEE does not change with altitude and ambient relative humidity. In addition to this default setting of dust MEE, we adopt two additional scenarios with constant MEE values across the ocean basin of 0.37 m2 g−1 and 0.60 m2 g−1, respectively, to assess the sensitivity of our dust deposition estimate to the assumed MEE. Third, once the dust mass concentrations are determined, we calculate the monthly dust mass fluxes in both the zonal and meridional directions by using monthly average wind vector profiles from the reanalysis meteorological fields of the Modern-Era Retrospective analysis for Research and Applications, Version 2 (MERRA2) [Gelaro et al., 2017]. Fourth, by assuming that there is no leak at the top of the atmospheric columns, we calculate the divergence of dust zonal and meridional fluxes to derive the dust deposition into ocean. Given that the trans-Atlantic dust layer seldom reaches 10 km or higher, we set the top of atmospheric column at 10 km. In this way the veering of dust from one grid cell to its neighboring cells is accounted for.
Passive sensors have much better sampling coverage than lidars and are able to capture episodic dust events more readily. It is thus intriguing to utilize MODIS, MISR, and IASI data and compare them with CALIOP observations. On the other hand, MODIS and MISR provide only column-integrated dust extinction or DOD. Concerning IASI, although the mean dust layer altitude is also retrieved in the V2.2 product, only the DOD product is used here. Thus, we distribute the MODIS, MISR, and IASI DOD in the vertical by applying the shape information (not the absolute values) of dust extinction profiles from CALIOP, similar to Yu et al. [2012]. In other words, the CALIOP 3-D dust extinction profile is normalized with DOD from MODIS, MISR, and IASI. Then we follow the same procedures described above to estimate the dust deposition flux. Although the CALIOP vertical profiles are used in estimating the dust deposition from MODIS, MISR, and IASI, we refer the dust deposition so-derived as MODIS, MISR, and IASI, respectively, for brevity.
We also calculate the dust loss frequency (LF, with a unit of d−1) as a ratio of the dust deposition rate (g m−2 d−1) to dust mass loading in the atmosphere (= DOD/MEE, g m−2) from the same satellite measurements. Although dust deposition is an “extensive property” that depends not only on the deposition rate but also on the amount of dust in the atmosphere, dust loss frequency is an “intensive property” that is independent of dust amount but only measures how efficiently dust is removed from the atmosphere by all deposition processes collectively (or deposition rate). The larger the LF, the more efficiently dust is deposited into ocean. The dust interacting with or below clouds is more likely to be removed by wet scavenging processes and thus has a higher LF than elevated dust in the dry Saharan Air Layer. As discussed earlier, estimates of both dust mass loading and dust deposition depend on the assumed dust MEE. However, these MEE-related uncertainties largely cancel out when calculating dust LF by the definition. Thus, the derived dust LF tends to have better accuracy than the estimated dust deposition flux. The LF is a particularly useful diagnostic for guiding the model improvements, as this variable makes it possible to disentangle the dust transport and removal processes from the dust emissions in source regions when identifying the major factors contributing to differences among different products, including observation derived and model calculated dust deposition. Note that by definition, the reciprocal of LF represents a timescale that is needed to remove airborne dust in the atmospheric column to ocean surface at a rate of the satellite-derived removal. This timescale tends to be longer than the dust residence time in the grid cell because potential dust export out of the grid cell is not accounted for. It is also different from dust lifetime or transport time reported in the literature.
2.3. In-situ measurement based climatology of dust deposition
Dust depositions can be observed directly at the surface and from sediment traps in the water, or estimated from atmospheric sampling of dust or dust proxies (with some assumptions) [Anderson et al., 2016]. Such in-situ based climatologies of dust deposition are generally scarce, and limited in temporal and spatial coverage. In this study, we compile a dataset (see Table S1 in Supplementary Online Materials or SOM for details) by taking from a widely used pre-compiled dataset [Albani et al., 2014; and references therein] complemented by some recent observations in the studied region [Friese et al., 2017; Korte et al., 2017]. See Table S1 in Supplementary Online Materials or SOM for details. A total of 23 sites (Figure 1) are compiled, and are used to evaluate the satellite-based estimates of dust deposition. This practice would serve as a cross-check among different methods rather than a rigorous validation of satellite observations, because a majority of these sediment-trap observations (16 out of 23) were carried out in the 1980s and early 1990s, when African dust was more active, but before the availability of the satellite products. We also note that these in situ observations of dust deposition are subject to large uncertainties [Albani et al., 2014; Korte et al., 2017].
Figure 1:
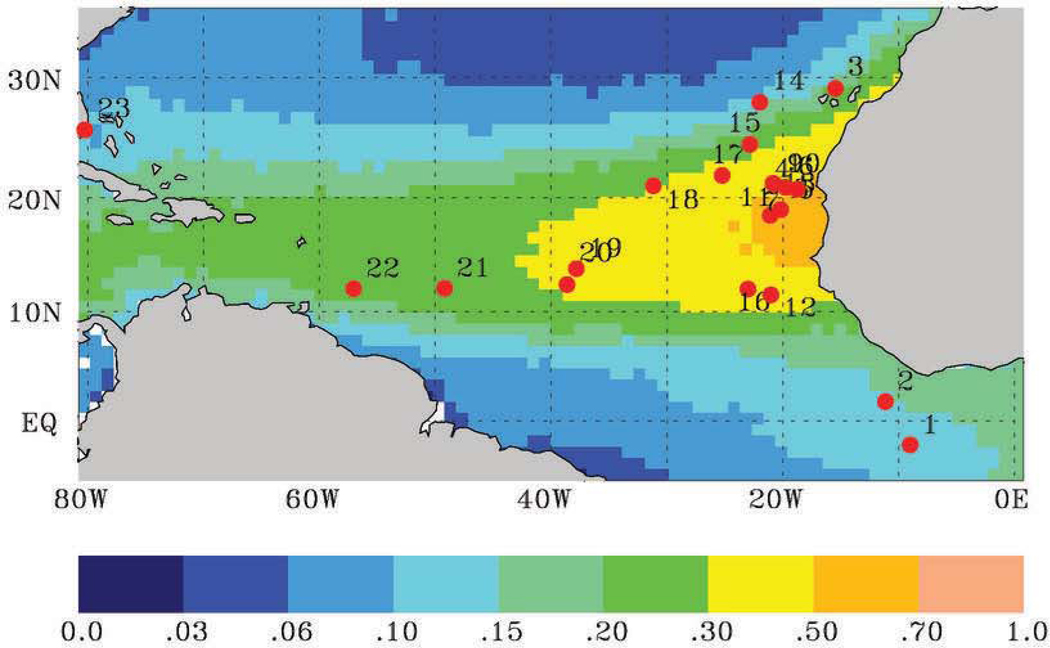
Locations of the surface-based dust deposition climatology measurements (Table S1 of SOM) overlaying a summertime (June-July-August) DOD climatology derived from MODIS/Aqua observations.
3. Results
3.1. Dust optical depth and vertical distribution
The CALIOP observations are used to characterize the dust 3-D distribution. Figure 2 shows the 2007–2016 climatology of seasonal-mean dust extinction profiles (left panels) and DOD (right panels) along the trans-Atlantic transit from West Africa to the Americas (from 20°E to 80°W). Due to CALIOP’s narrow cross-track coverage, individual CALIOP profiles have been aggregated into the 5°x2° grids to increase the representativeness of sampling. The dust extinction profile at each 5° longitude interval represents an average over the equator to 20°N band that encompasses the major dust source regions and transport routes. Throughout the paper, we refer the winter, spring, summer, and fall seasons to December of the prior year–January- February (DJF), March–April-May (MAM), June–July-August (JJA), and September-October- November (SON), respectively. Figure 2 clearly shows the evolution of dust vertical distribution with seasonal distinctions from the source regions downwind to the tropical Atlantic Ocean and Caribbean Basin, a result consistent with those documented in previous studies [e.g., Huang et al., 2010; Ben-Ami et al., 2012; Yu et al., 2010, 2015a]. Over source regions (east to about 17°W), the dust is lifted by turbulence and convection up to an altitude that is higher in summer than winter. For example, the upper bound for the 20 Mm−1 dust extinction isoline over the source region reaches about 2.8, 4.5, 5.1, and 3.2 km in winter, spring, summer, and fall, respectively. Further downwind, over the tropical Atlantic Ocean and Caribbean basin, the dust is transported at higher altitudes in summer than in winter. It is also evident that along the trans-Atlantic transit, dust plumes are initially stable when leaving the African continent, but descend rapidly just west of 35°W.
Figure 2:
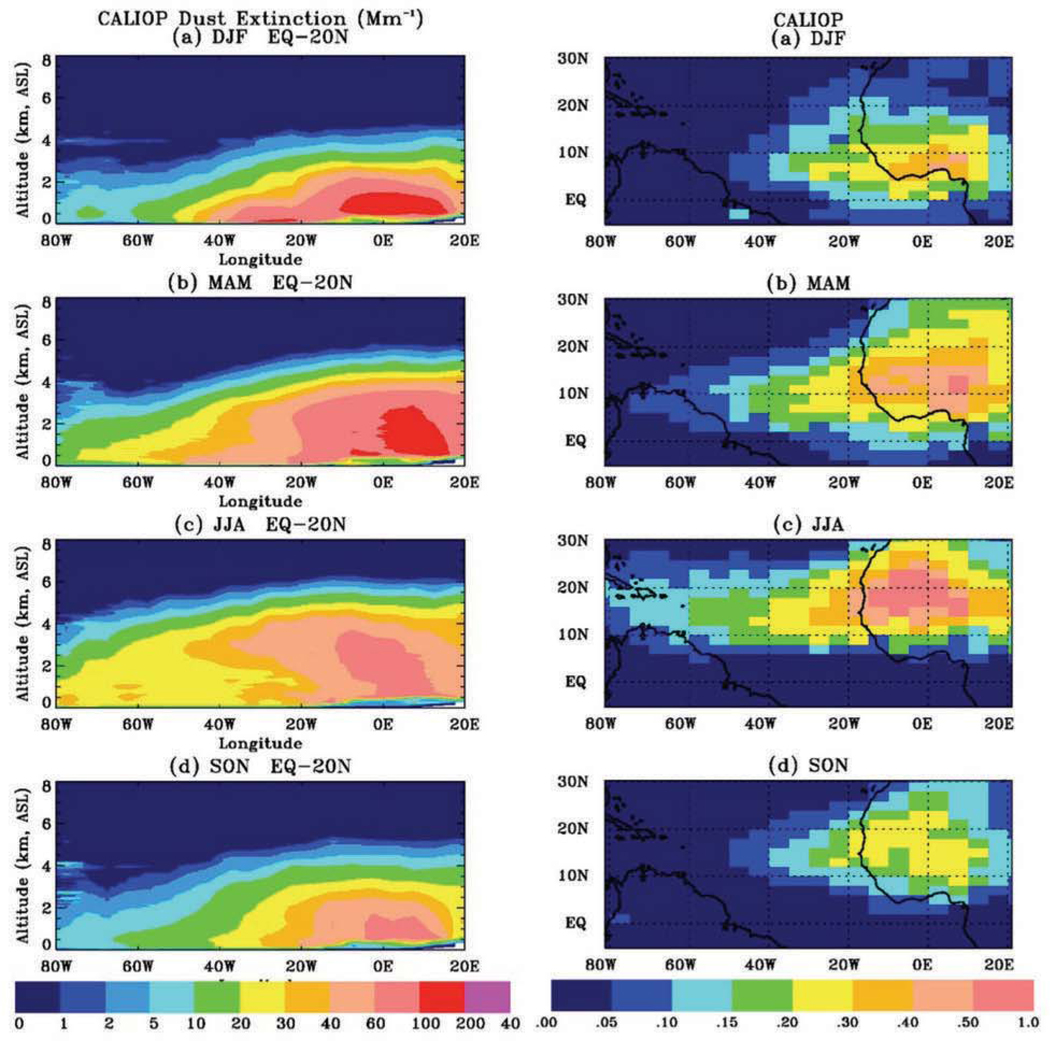
CALIOP 2007–2016 seasonal climatology of dust extinction (unit: 10−6 m−1 or Mm−1) profiles in the altitude-longitude plane (averaged over 0°N-20°N, left panels) and DOD (right panels) in (a) DJF, (b) MAM, (c) JJA, and (d) SON.
The seasonal migration of trans-Atlantic dust plumes is demonstrated by the DOD derived from CALIOP, as well as that derived from the MODIS, MISR, and IASI observations (Figure 3). In the winter season, strong northeasterly winds (so-called Harmattan) in West Africa carry the dust southwestward to the Gulf of Guinea [Engelstaedter et al., 2006]. This southwest-tilted dust plume then takes a route between the equator and 10°N and eventually reaches northern part of South America including the Amazon Basin [Huang et al., 2010; Prospero et al., 2014; Yu et al., 2015b]. In the following months, the northward progression of southwesterly winds associated with the ITCZ pushes the trans-Atlantic dust plume northward. In the summer season, the dust is transported mainly along the 10°−20°N route, reaching the Caribbean Basin, the southern US and Mexico [Prospero et al., 2014; Prospero, 1999]. In the fall season, the dust plume moves southward along with the retreat of the ITCZ.
Figure 3:
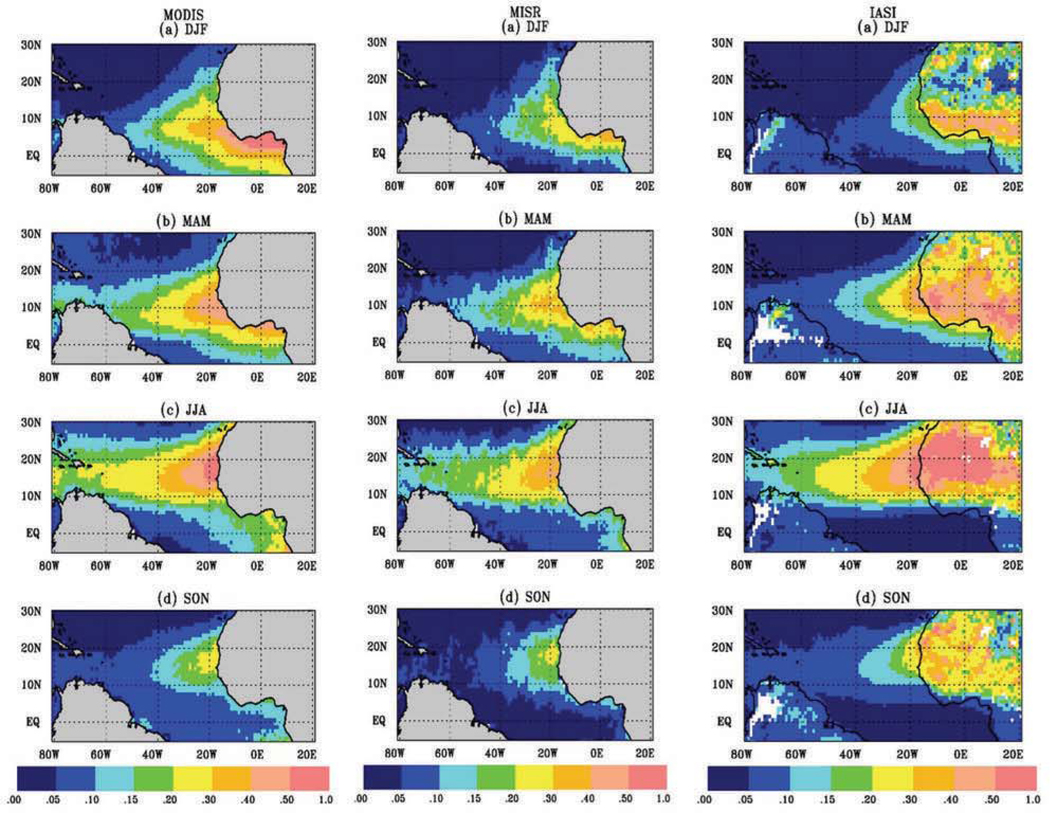
The seasonal climatology of DOD derived from MODIS (left panels), MISR (middle panels), and IASI (right panels) in (a) DJF, (b) MAM, (c) JJA, and (d) SON. Note that the IASI DOD at the 10 μm has been multiplied by 1.54 to approximate DOD at 0.55 μm and facilitate comparison with MODIS, MISR, and CALIOP DOD at about 0.55 μm.
The DODs over the Atlantic Ocean showing in Figures 2 and 3 are derived from the four satellite sensors with different characteristics and assumptions. As discussed earlier, these datasets provide a consistent picture of trans-Atlantic dust transport. Here we further undertake a more quantitative assessment of the agreement among them. Figure 4 shows inter-comparisons of DOD among the sensors in eastern Atlantic Ocean over the 2007–2016 period, in which each data point represents the seasonal average DOD over a 5°x2° grid (total number of data points = 3983). On the basis of seasonal and regional (5°x2°) average, DODs derived from the different sensors consistently show high correlations (R2 > 0.7), but with clear offsets in the magnitude. As shown in Figures 4a and 4b, DOD derived from MISR (at 0.558 μm) and CALIOP (at 0.532 μm) is on average about 27% and 22% lower than MODIS DOD (at 0.55 μm), respectively. The scatterplot of IASI DOD (at 10 μm) against MODIS DOD (at 0.55 μm) apparently shows two branches with different slopes that are largely associated with different seasons. Thus, we plot the IASI and MODIS data separately for DJF and MAM (Figure 4c) and JJA and SON (Figure 4d). The correlation coefficient of R2 is 0.932 in JJA and SON, which is significantly higher than R2 of 0.705 in DJF and MAM. The slope of DOD (i.e., IASI relative to MODIS) is 0.650 in JJA and SON, which is also higher than the slope of 0.411 in DJF and MAM. We believe that these season-dependent correlations between IASI and MODIS could be attributed to larger uncertainties in DJF and MAM. The IASI retrieval is sensitive to the dust layer altitude. The higher the dust layer, the greater the IASI sensitivity. The lower dust layer during DJF and MAM (Figure 2) may suggest the possibility that IASI has less sensitivity to the dust layer and hence underestimates DOD. Further, at 10 μm, IASI is less sensitive to small-sized particles than MODIS, so if lower wind conditions in the source region and/or lower plume altitude in winter skew the dust distribution toward smaller sizes, this would also reduce the IASI DOD relative to MODIS. On the other hand, it is also possible that the MODIS-based approach could be complicated by the co-existence of dust and biomass burning smoke from equatorial Africa in DJF and MAM [Yu et al., 2009]. We thus believe that the IASI and MODIS correlation is more reliable in JJA and SON. The IASI to MODIS DOD ratio of 0.65 better reflects the wavelength dependence of DOD, which has been used to convert IASI TIR DOD to DOD at 0.55 μm (shown in Figure 3) for dust deposition calculations. This wavelength dependence also agrees well with recent radiative transfer modeling [Song et al., 2018] that yields the DOD 10 μm to 0.5 μm ratio of about 0.7 when the particle size distribution for the transported dust is taken from a recent aircraft campaign [Ryder et al., 2013]. However, the same study using the size distribution retrieved from AERONET observations yields a much smaller ratio of 0.4 [Song et al., 2018], because the AERONET retrieval is arguably biased toward smaller sizes as a result of limited sun photometer spectral coverage.
Figure 4:
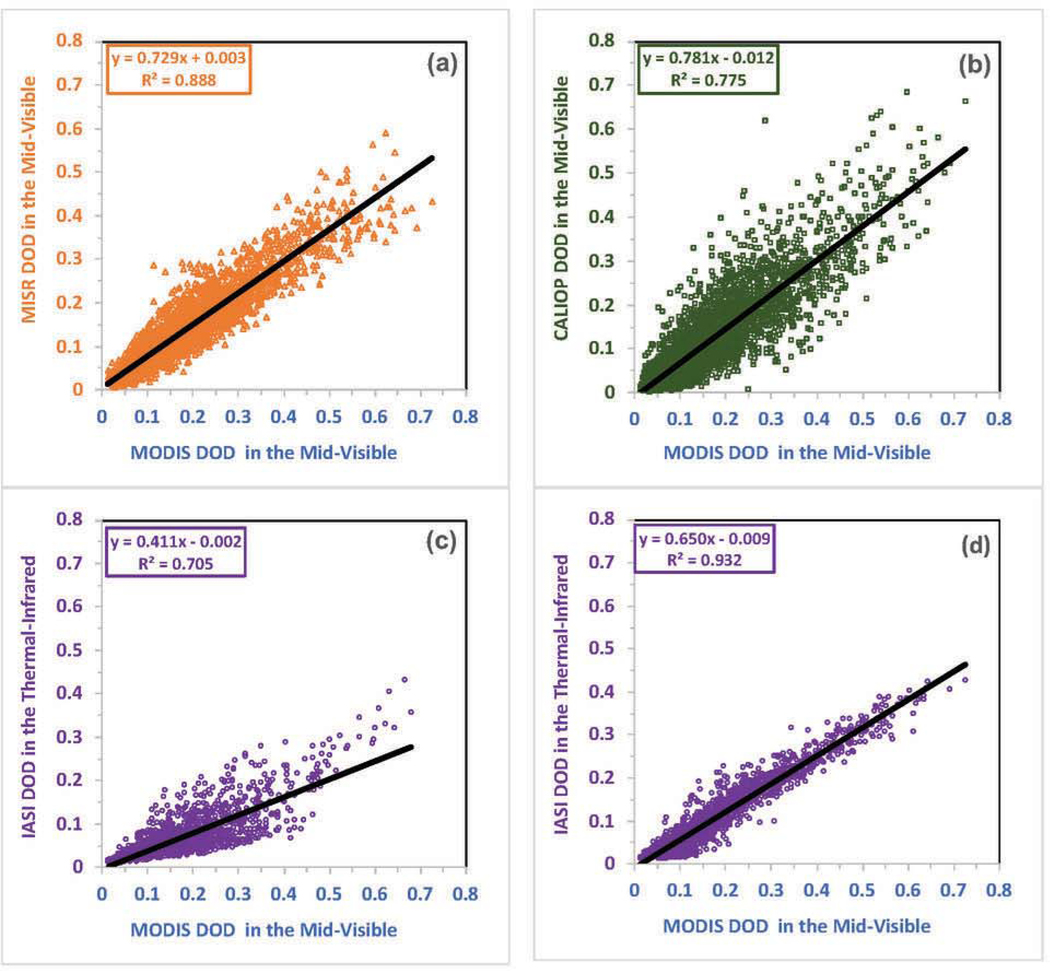
Comparisons of MODIS-derived DOD at 0.55 μm with that derived from MISR (a, including all seasons, at 0.558 μm), CALIOP (b, including all seasons, at 0.532 μm), and IASI (c for DJF and MAM, and d for JJA and SON; at 10 μm) over eastern Atlantic Ocean (20W-50W, 0–30N). Each point in the scatterplots represents a seasonal mean DOD in one of the 5°x2° grids for a particular year.
3.2. Dust deposition flux
To estimate the dust deposition, both zonal and meridional dust mass fluxes in the atmospheric column are calculated. Figure 5 shows a composite of vertical-column integrated zonal and meridional dust flux rate (i.e., dust flux per unit length of latitude and longitude, respectively) derived from the CALIOP 2007–2016 climatology, which is overlaid on the seasonal mean precipitation rate (gray contours) from the Global Precipitation Climatology Project (GPCP) Climate Data Record, Version 2.3 [Adler et al., 2018]. The figure depicts the magnitude (color bar and vector length) and direction (arrow of vector) of dust transport and its seasonal variations. Clearly, the trans-Atlantic dust transport is more intense and reaches further west in summer and spring than in fall and winter. The dust takes a southern route and is transported to South America in winter. With the northward migration of the ITCZ from winter to summer, the dust plume also moves north and increasingly influences the Caribbean Sea and southern US. It is evident that the dust flux is substantially reduced when interacting with precipitation. It is interesting to note the transport patterns of dust from the Bodélé Depression in Chad. In winter, the Bodélé dust is mainly transported to the Gulf of Guinea by the northeasterly winds. Much of the dust is then intercepted by precipitation and does not reach the Amazon Basin. In spring, while a portion of the Bodélé dust undergoes the similar fate as in winter, some are apparently mixed with dust from other West Saharan sources and transported to northern part of South America. Although it is difficult to quantify the share of the Bodélé dust reaching the Amazon Basin from the satellite data alone, the data can be used in conjunction with dust models to better assess the amount of Bodélé dust reaching the Amazon Basin and contribute to an ongoing debate of the role of Bodélé dust in maintaining the health of Amazon rainforest [Tegen et al., 2006; Koren et al., 2006; Ansmann et al., 2009; Ben-Ami et al., 2010; Abouchami et al., 2013; Gläser et al., 2015].
Figure 5:
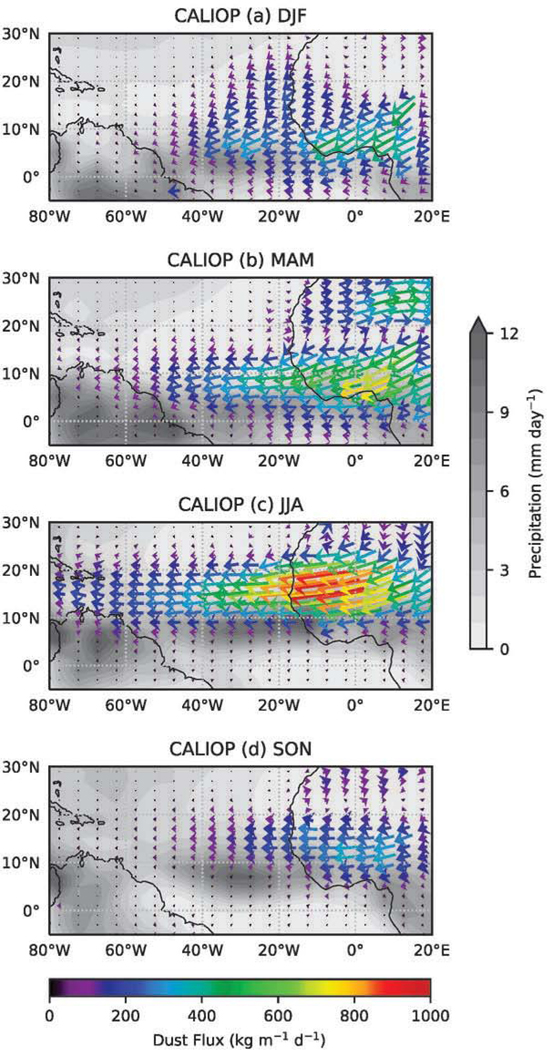
A composite of vertical-column integrated zonal and meridional dust flux rates (kg m−1 d−1) derived from the CALIOP 2007–2016 climatology, showing the magnitude (color scale and vector length) and direction (arrow of vector) of dust transport in the atmosphere and its seasonal variations. The dust flux is overlaid on the GPCP precipitation rate (gray contours).
Dust deposition into the ocean is derived from both zonal and meridional dust mass fluxes with the “mass balance” approach as described in 2.2, and the results are shown in Figures 6 (CALIOP and MODIS) and 7 (MISR and IASI). The spatial pattern of dust deposition shown here is not always consistent with that of DOD in Figures 2 and 3, as well as dust mass flux throughout the atmosphere in Figure 5, because the dust deposition is determined by the divergence of dust mass flux or the horizontal gradient of DOD, instead of DOD itself. Generally, the dust deposition pattern skews southward relative to that of DOD, because precipitation associated with the ITCZ effectively washes out dust from the southern edge of dust plumes. Although some differences in details exist among the satellites, these satellite observations reveal consistently the meridional shifts of the major dust deposition belt, as modulated by the seasonal shifts of the ITCZ. In the winter and spring, the trans-Atlantic dust transport follows a southern trajectory at lower altitudes (Figures 2 and 3), which makes the dust more susceptible to dry deposition as well as scavenging by precipitation associated with the ITCZ. This produces a large amount of dust deposition into the Gulf of Guinea and near the coast of West Africa south to 10°N. Relatively high values of dust deposition flux also appear in the middle of the tropical Atlantic and even off the northeastern coast of South America, where rainfall is intense, as shown in the CALIOP, MODIS, and MISR derived products. For comparison, the high dust deposition belt in IASI observations does not extend as far west as the other observations, due to the poorer IASI dust fine mode detection limit (Figure 3), the coarse particles being preferentially removed during transport, even if still present. In the summer season, the dust deposition belt has migrated northward to 10°−20°N latitudes, consistent with the seasonal migration of the ITCZ. The dust deposition shows a maximum near the coast of North Africa, and generally decreases with distance from the coast. In the fall season, the dust deposition belt remains in the 10°−20°N band, with much smaller deposition flux. Overall, all the satellite observations show quite a consistent pattern of dust deposition seasonal migration, controlled by the atmospheric circulations and ITCZ.
Figure 6:
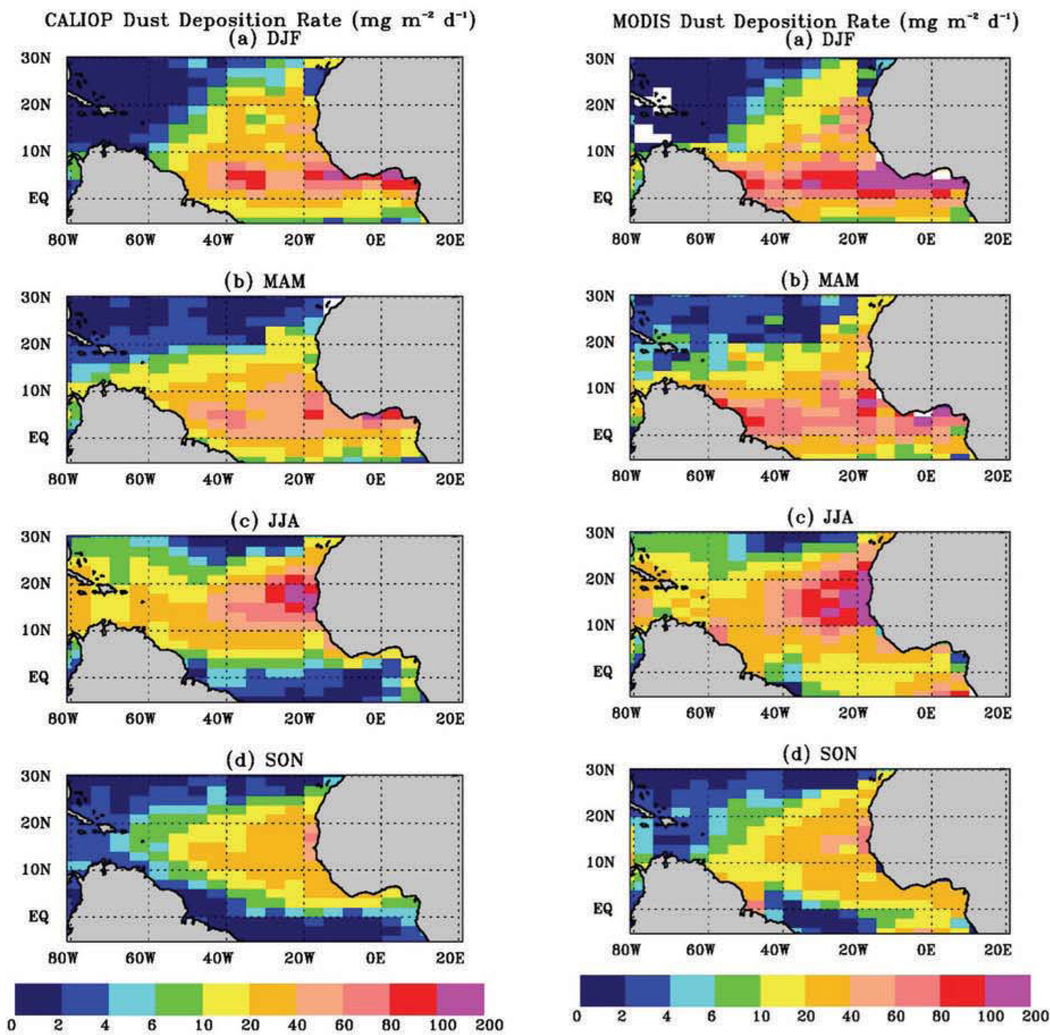
Seasonal dust deposition rate (mg m−2 d−1) derived from CALIOP (left panels) and MODIS (right panels) observations.
Figure 8 shows the 2007–2016 average yearly dust deposition fluxes (unit: mg m−2 d−1) derived from CALIOP, MODIS, MISR, and IASI satellite observations of dust. Overlaid on the maps is the in-situ based climatology of dust deposition collected from a variety of sources in the literature (section 2.3 and Table S1). The four satellite-based estimates of dust deposition show a generally consistent spatial patterns, with some differences in details. All four of the satellites show the largest dust deposition in the Gulf of Guinea and along the coast of West Africa, although differences exist in the details. For example, in the Gulf of Guinea, in comparison to MODIS, MISR, and CALIOP, the IASI-based dust deposition is smaller in magnitude and also has a sharper meridional gradient, which is more in line with the sediment trap data. This may suggest a possibility that DOD derived from satellite observations in the mid-visible is somewhat contaminated by biomass burning smoke in the region. Over this complex region of dust-smoke mixture, separating dust from smoke remains challenging [Yu et al., 2009]. Figure 9 compares the satellite-based estimates of yearly dust deposition (2007–2016 average) with the in-situ based climatology on a site-by-site basis (site numbers and locations in Figure 1). Generally, the dust deposition estimates from different platforms are much more scattered near the coast of North Africa than further downwind, which is likely due to greater heterogeneity of dust plume close to the sources and the scattered nature of wet deposition [Mahowald et al., 2011]. For two equatorial sites (1 and 2) in the Gulf of Guinea, the MODIS and MISR-based estimates of dust deposition are larger than the in-situ based climatology by more than a factor 2, whereas the IASI-based estimates agree with the in-situ climatology within 20%. The CALIOP-based estimates are in between, about 63–97% larger. In the African costal region (east to 25°W and north to 10°N), 14 sites (from 3 through 16) are clustered, of which most were sampled in 1988–1992 except three sites (4, 11, 16) in 2013–2015. Except over 4 sites (no. 4 – 7), the satellite-based estimates generally agree with the in-situ climatology quite well. Although MODIS agrees better with the in-situ climatology over sites 4, 5, and 7, CALIOP, IASI, and MISR have much better agreement with in-situ observation at site 6. The larger in-situ and satellite discrepancy this region could have resulted from different spatial sampling in this more heterogenous region of dust distribution. In mid-Atlantic Ocean (sites 17 – 20), the satellite-based estimates are generally larger than the surface-based climatology, with the largest difference, a factor of 2 to 3, at site 19. In the West Atlantic and Caribbean basin (sites 21–23), the satellite-based estimates are smaller than the in-situ based climatology by within 25% in sites 21 and 23, but a factor of 4–5 in site 22. The ocean-based dust deposition of 52 mg m−2 d−1 in site 22 (remote from African dust sources) is comparable to observations near the African coast, which likely alludes to a high bias in the in-situ observation. Overall, 65–83% of satellite-based dust deposition estimates agree with the in-situ based climatology within a factor of 2. On a basis of average of all the sites, satellite-based estimates of dust deposition are lower than the in-situ based climatology by no more than 20%. This result is promising, given that these estimates were performed over different time spans and spatial scale. Based on a long-term model simulation with GOCART [Chin et al., 2014], the dust deposition averaged over 1986–1992 is about 14% higher than the average over 2007–2009 (see Figure S1) or over 2007–2016 (as can be inferred from Table S2). Finally, differences in the size range of dust deposition in the data sets further complicate the comparison, which is however difficult to assess because of the unavailability of the information.
Figure 8:
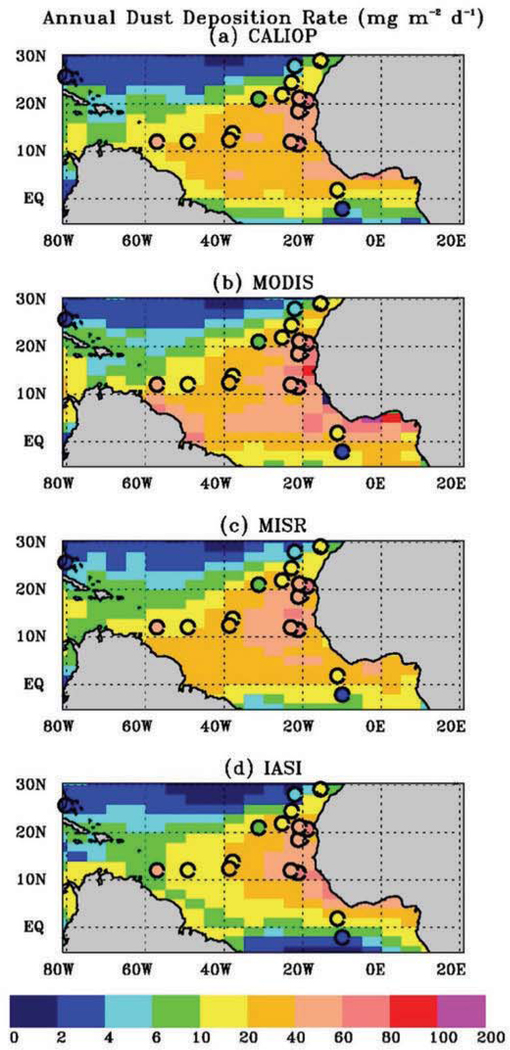
2007–2016 average yearly dust deposition flux (unit: mg m−2 d−1) derived from aerosol observations by CALIOP (a), MODIS (b), MISR (c), and IASI (d). Black circles filled with colors representing the surface-based dust deposition climatology (see Table S1 for details) are overlaid on the maps.
Figure 9:
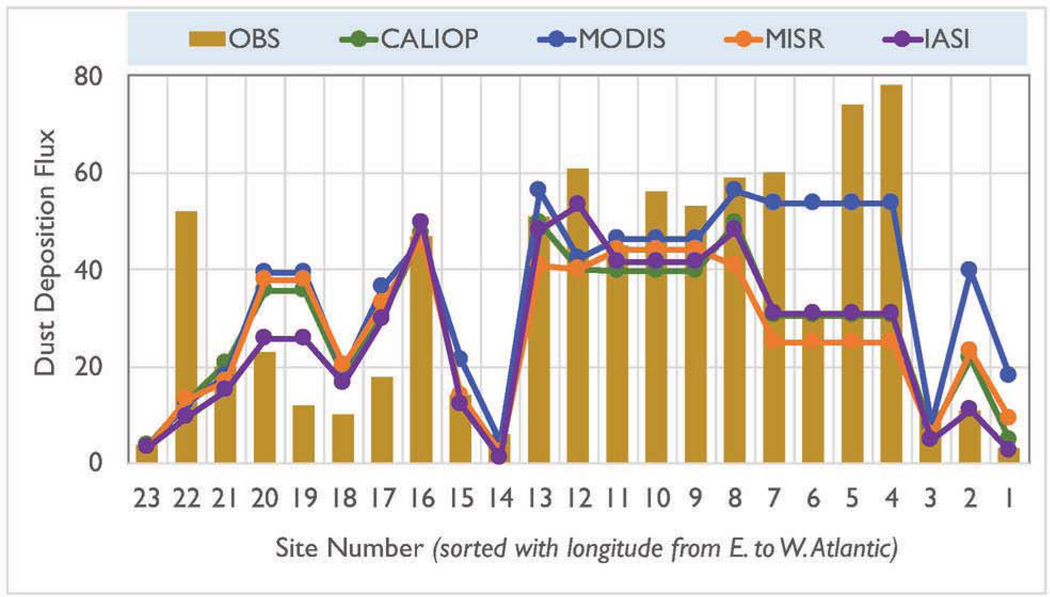
Comparison of satellite-based estimates (colored lines) of annual dust deposition flux (unit: mg m−2 d−1) with the surface-based climatology (gray bars, denoted as OBS) at individual locations (the observation sites are sorted by longitude and numbered in ascending order from East Atlantic to West Atlantic, see Figure 1).
Figure 10 displays the 10-year average seasonal dust deposition into the ocean, stratified by three sub-basins, namely the Eastern Atlantic Ocean (EAT, 5°S-30°N, 17°W-60°W), the Gulf of Guinea (GOG, 10°E-17°W, 5°S-10°N), and the Caribbean (CAR, 8°N-30°N, 60°W-80°W). Clearly, the four satellites are consistent in depicting seasonal variations of dust deposition in each of individual sub-basins, such as summer maximum in EAT and CAR, but winter/spring maximum in GOG. On the basis of whole basin, CALIOP, MISR and IASI are consistent in showing largest deposition in summer and smallest in fall. On the other hand, MODIS shows slightly larger deposition in winter than in summer, most likely due to the contamination of biomass burning smoke in our derived dust optical depth. Dust deposition varies from year to year, which presumably results from changes in dust emissions and the atmospheric processes controlling dust transport and removal, in particular, dust lifting by winds and wet removal associated with rainfall. Seasonal dust deposition fluxes in individual years are listed in Table S2 of SOM. Figure 10e shows the interannual variability of dust deposition, calculated as a ratio of standard deviation of seasonal dust deposition over the 2007–2016 period to the 10-year mean. The larger the normalized standard deviation, the greater the interannual variability. The satellite observations show consistently that the interannual variability is largest in spring, with the normalized standard deviation between 0.28 (IASI) and 0.41 (CALIOP). This is presumably resulted from large variability of rainfall and winds during the monsoon transition from winter to summer in Wes Africa. In summer, dust deposition has the least interannual variability with the normalized standard deviation of 0.07 – 0.15, although summertime dust deposition is the largest in magnitude.
Figure 10:
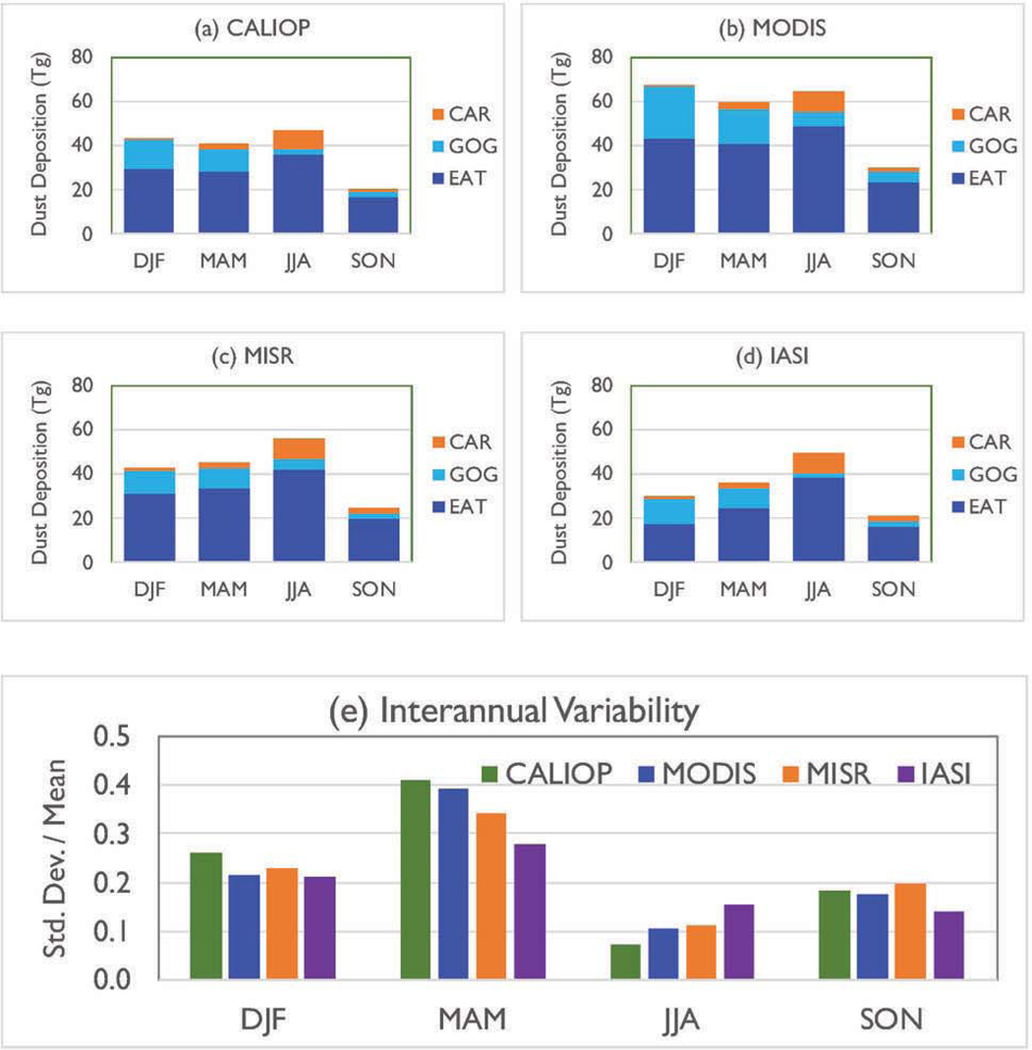
2007–2016 average seasonal dust deposition (Tg, 1 Tg = 1012 g) into the tropical Atlantic Ocean basin estimated from (a) CALIOP, (b) MODIS, (c) MISR, and (d) IASI. The seasonal dust deposition is stratified by three sub-basins, namely the Eastern Atlantic Ocean (EAT, 5°S-30°N, 17°W-60°W), the Gulf of Guinea (GOG, 10°E-17°W, 5°S-10°N), and the Caribbean (CAR, 8°N-30°N, 60°W-80°W). The interannual variability of yearly dust deposition into the basin is calculated as a ratio of standard deviation to the mean (e).
Table 1 lists the satellite-based estimates of annual dust deposition into the ocean basin and three partitioning into the three sub-basins EAT, GOG, and CAR as defined earlier. On the basin-scale, yearly dust deposition is estimated at 151.6, 221.5, 168.0, and 136.0 Tg (1 Tg = 1012 g) from the CALIOP, MODIS, MISR, and IASI observations, respectively. In CAR, the four sensors give a consistent estimate of 13.1 – 14.8 Tg. The higher estimate from MODIS comes from that in EAT and GOG. In EAT, MODIS dust deposition of 155.8 Tg is higher than CALIOP, MISR, and IASI estimate by 40%, 23%, and 61%, respectively. In GOG, the MODIS estimate of 50.9 Tg is nearly 2 times of that from the other sensors. It is likely that the MODIS derived DOD is contaminated by biomass burning smoke in GOG and to some extent in EAT.
Table 1:
Satellite-based estimates of annual dust deposition (Tg, lTg = 1012 g) into the ocean basin and their partitioning into the three sub-basins (EAT, GOG, and CAR). Dust MEE is assumed to increase from 0.37 m2 g−1at the coast of North Africa to 0.60 m2 g−1 in the Caribbean Basin.
| Instrument | EAT | GOG | CAR | Basin total |
| CALIOP | 111.3 | 27.2 | 13.1 | 151.6 |
| MODIS | 155.8 | 50.9 | 14.8 | 221.5 |
| MISR | 127.0 | 26.7 | 14.3 | 168.0 |
| IASI | 96.9 | 24.9 | 14.2 | 136.0 |
3.3. Dust loss frequency
Having obtained estimates of dust mass loading and dust deposition, we can also estimate the dust loss frequency LF. Figure 11 shows spatial and seasonal variations of the MODIS-based estimate of dust LF (left panels) and GPCP precipitation rate (right panels). The seasonal and spatial pattern of dust LF derived from CALIOP, MISR, and IASI observations (not shown) are similar to the MODIS observations, and hence are not discussed separately. The figure reveals large seasonal and spatial variations of dust LF that differ substantially from the DOD (Figure 3), dust transport (Figure 5), and dust deposition flux (Figure 6). Instead, the dust loss frequency is better related to the precipitation rate and dust vertical distribution. In winter and spring, dust emitted from the deserts is carried by the northeastern trade wind toward South America [Yu et al., 2015a, b] and generally at lower altitudes (c.f., Figure 2), increasing the possibility that the dust plume is intercepted and scavenged by the intense rainfall belt associated with the ITCZ. There is clear correspondence between the large dust LF and the intense precipitation rate. In particular, the largest dust loss frequency occurs south to 10°N and far away from the African continent (even closer to South America). However, in the summer and fall seasons, the pattern of dust loss frequency is relatively uniform and shows no resemblance to the precipitation rate. It is known that the dust plumes are pushed northward by the atmospheric circulations [Yu et al., 2015a] and transported across the Atlantic Ocean in a nearly zonal direction, to influence the Caribbean Basin and southern US. In summer, a large portion of dust is carried in the dry and hot Saharan Air Layer, which is higher in altitude than in winter (Figure 2). Both these factors would reduce the possibility of dust being intercepted and efficiently removed by the rainfall associated with the ITCZ. The dust is mainly removed by dry deposition and gravitational settling at a substantially lower rate.
Figure 11:
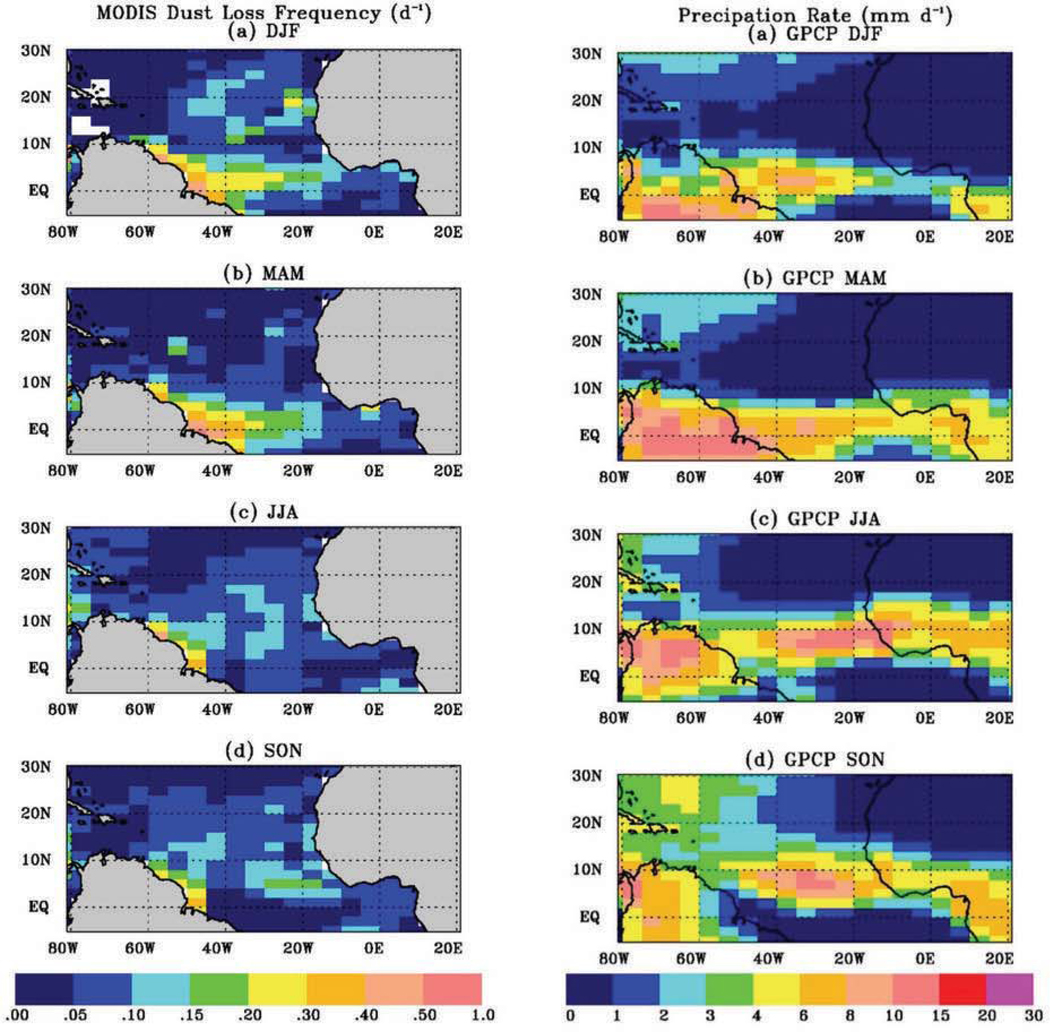
Seasonal and spatial variations of dust loss frequency (unit: d−1) estimated from the MODIS observations (left panels) and the GPCP-based precipitation rate (unit: mm d−1) (right panels).
Figure 12 shows seasonal variations of dust LF derived from CALIOP, MODIS, MISR, and IASI estimates of dust deposition rate and dust mass loading over the basin scale. It shows that the dust LF is consistently largest in winter, with CALIOP-based estimate of 0.148 d−1 larger than that estimated from the other three sensors by 18–26%. Each of the four satellites yields similar LF in spring, summer, and fall. The winter LF is 60%, 67%, 40%, and 34% higher than the mean of three other seasons for CALIOP, MODIS, MISR, and IASI, respectively. On the annual basis (right panel), the basin-scale dust LF is estimated at 0.100. 0.078, 0.091, and 0.098 d−1 from CALIOP, MODIS, MISR, and IASI observations, respectively.
Figure 12:
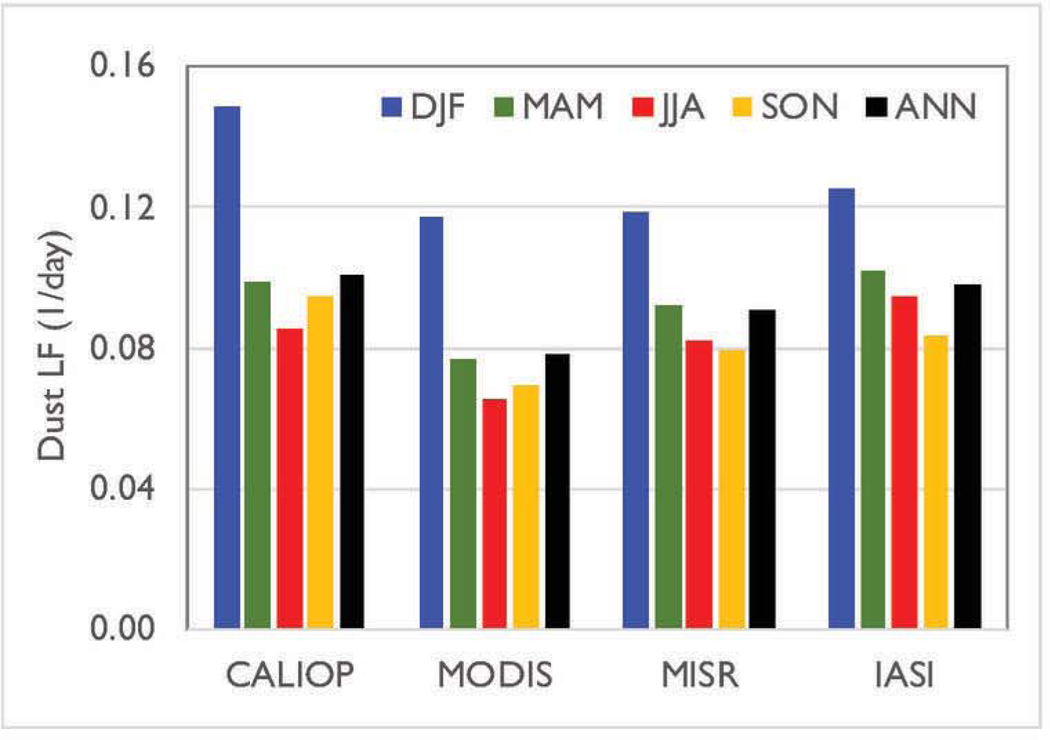
Seasonal and annual mean dust LF (unit: d−1) derived from CALIOP, MODIS, MISR, and IASI estimates of dust deposition and dust mass loading.
4. Discussions
4.1. Assumptions in the satellite-based approach
Ideally, one would estimate the dust deposition by following the temporal evolution of a dust plume through the creative use of different satellite observations, and then considering a change of dust optical depth during the evolution as the amount of dust being deposited into ocean. This Lagrangian approach, however, is formidable when applied to different polar-orbiting satellite measurements, because differences in DOD exist among satellites due to the differences in viewing locations, instrument uncertainty, and retrieval methods. Observed differences in DOD at two different times from two different sensors may be attributed to deposition between those times, but might also be attributed to inherent biases and offsets between the two sensors themselves, and/or their particular space-time sampling. Furthermore, there are the problems in maintaining the identity of the plume through clouds and as the plume dissipates, and accounting for total plume mass if it branches into multiple transport routes. There is also the difficulty of aggregating many individual plume characterizations to form long-term statistics.
Given these difficulties, we developed a more practical method to estimate dust transport and deposition from the satellite-observed monthly dust spatial distributions in three dimensions, similar to the method described in our previous studies [Yu et al., 2008, 2012, 2015a, 2015b]. Although atmospheric mixing can dilute the dust plume in both horizontal and vertical directions, a change in the vertically and horizontally integrated dust loading or DOD, if calculated over scales covering the entirety of the dust plume, does indicate how much dust is removed from the atmosphere. To account for the veering of dust into neighboring grid cells, we calculate dust mass flux in both zonal and meridional directions. The inherent assumptions that go into our method include: (1) no strong diurnal signatures to the deposition that cannot be mitigated by the temporal averaging over a longer time scale such as a month or season, (2) no dust sources over the ocean, (3) no transport of dust out of the top of the grid cells, and (4) no systematic correlation between dust loading (DOD) and cloud systems that obstruct the ability to perform aerosol retrievals.
Our method requires sufficiently temporal averaging to obtain meaningful dust spatial distributions. Such the temporal averaging introduces uncertainty or bias in the estimated dust transport flux when dust concentration correlates strongly with wind fields. Kaufman et al. [2005] estimate that such an error is about 5% on average but higher in the spring season. Here we use one-year (12/2012–11/2013) of MERRA-2 aerosol reanalysis [Randles et al., 2017; Buchard et al., 2017] to calculate the monthly dust mass flux as a product of monthly average dust and wind, similar to our satellite-based method. On a seasonal basis, the so-derived dust mass flux is about 10–23% lower than the MERRA2 dust mass flux accumulated from the instantaneous dust mass flux at each model time step, as shown in Figure 13. Near the coast of North Africa (20°W), the low-bias in spring and fall is about twice of that in winter and summer. Further away from the coast (50°W) the calculated flux is biased low by 11–15%. The estimated dust LF is also biased low by a similar magnitude. We further assess potential bias in the estimated dust deposition based on the seasonal averaging by using the CALIOP, MODIS, MISR, and IASI observations. It is found that the dust deposition derived from the seasonal averaging is 10–16% lower than that derived from the monthly averaging.
Figure 13:
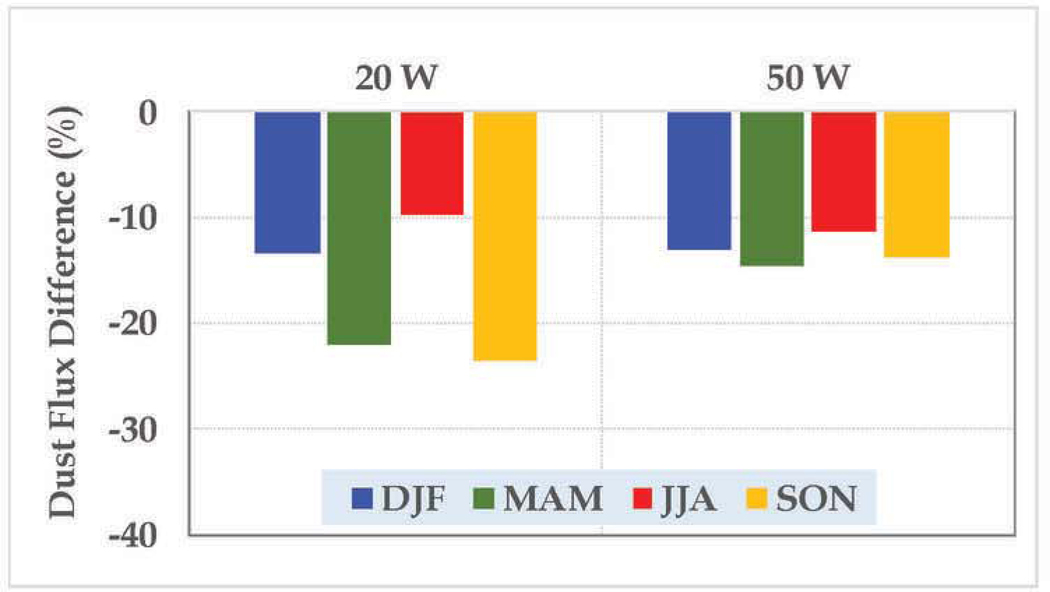
Dust mass flux derived from the monthly dust and monthly wind field introducing a low bias of −10% to −23%, compared to that being aggregated up from instantaneous dust mass flux at each time step of MERRA2 simulation. MERRA2 outputs over one-year (12/2012–11/2013) are analyzed to compare the zonal dust mass fluxes integrated over the atmosphere columns between 0°N-30°N at longitudes of 20°W and 50°W, respectively.
Our approach of estimating dust deposition from satellite measurements has several limitations. The need to aggregate satellite observations over monthly time scales suggests that it is impractical to estimate dust deposition flux on a daily or weekly time scale. Our approach is based on the balance between horizontal dust mass fluxes in a grid cell and inherent assumptions of no dust sources at surface and no loss of dust through the top of troposphere. Thus, the method cannot be applied to estimate the dust deposition in North Africa because transported vs. locally emitted dust cannot be uniquely distinguished from satellite observations alone. Also, the dust deposition so-derived represents the collective loss of dust by all removal processes. We cannot accurately separate dry deposition from wet deposition, because the dry and wet removal processes can work together to remove the dust from the air. From the perspective of dust-biogeochemistry interactions, distinguishing wet deposition from dry deposition is essential because nutrients associated with wet-deposited dust are much more bioavailable than those associated with dry-deposited dust [Korte et al., 2018].
4.2. Uncertainties of dust deposition estimate
We showed in section 3.2 that, overall 65–83% of satellite-based annual dust deposition estimates agree with the in-situ based climatology within a factor of 2. When averaging the 23 sites, satellite-based estimates of dust deposition are lower than the in-situ based climatology by no more than 20%. Although this comparison is promising, there are several caveats. The in-situ based climatology is also subject to large uncertainties and was performed over different time spans and spatial scales. Dust deposition depends strongly on the size range of the deposited dust deposition; this is difficult to assess because information about the sampled dust size is generally unavailable.
The diversity among the independent assessments from the four satellite sensors also provides a starting point for estimating the uncertainty of the results. Our multi-sensor analysis shows that the range of satellite-based basin-scale dust deposition accounts for about 50% of the four-sensor average. The discrepancies among the satellite sensors depend on region or sub-basin. Although the four sensors agree with each other within 12% in the estimated dust deposition into Caribbean Basin, they can differ by a factor of about 2 in the Gulf of Guinea. The highest estimate is obtained from MODIS, due mainly to high dust deposition in winter and spring. This alludes to the possibility that the derived dust optical depth could be contaminated by biomass burning smoke.
Further, estimates of dust deposition from satellite observations is subject to significant uncertainties resulting from the uncertainty in a range of other factors such as satellite-derived DOD, dust vertical profile, dust MEE, and satellite sampling (e.g., lack of measurements of aerosol in full diurnal cycle and below clouds) [Kaufman et al., 2005; Yu et al., 2008, 2012, 2013]. The amount of dust deposition derived from satellite observations is sensitive to the assumed dust MEE, as shown in Figure 14. MEE converts the remotely sensed dust optical properties (DOD, extinction coefficient) to dust mass concentration. For the same DOD and at a local scale, the larger the MEE, the smaller the implied dust loading and dust deposition. This sensitivity to MEE is clearly seen when comparing MEE = 0.37 m2 g−1 and MEE = 0.60 m2 g-1. The increase of MEE from 0.37 to 0.60 m2g−1 yields a 39–41 % decrease in derived dust deposition. When comparing the dust deposition between the varying MEE and MEE = 0.37 m2 g−1 assumptions, however, the difference is only 2–9%, due to the compounding effect of the dust deposition spatial pattern. The spatial patterns shown in Figures 6 and 7 suggest that dust deposition over the eastern tropical Atlantic accounts for a much larger fraction of the basin-scale dust deposition than that over the western tropical Atlantic and Caribbean Basin. Thus, assuming a constant MEE of 0.37 m2 g−1 throughout the whole region yields only a small increase in the total deposition. The dust deposition also depends strongly on the wind profiles. Although assimilated meteorology is used in this study, it is important to bear in mind that the quality of the assimilated winds still depends on the density of available observations. Yu et al. [2015a] estimated that uncertainty in the CALIOP dust mass flux over Atlantic Ocean is 45–70%. The CALIOP dust deposition estimate of this study would have similar magnitude of uncertainty.
Figure 14:
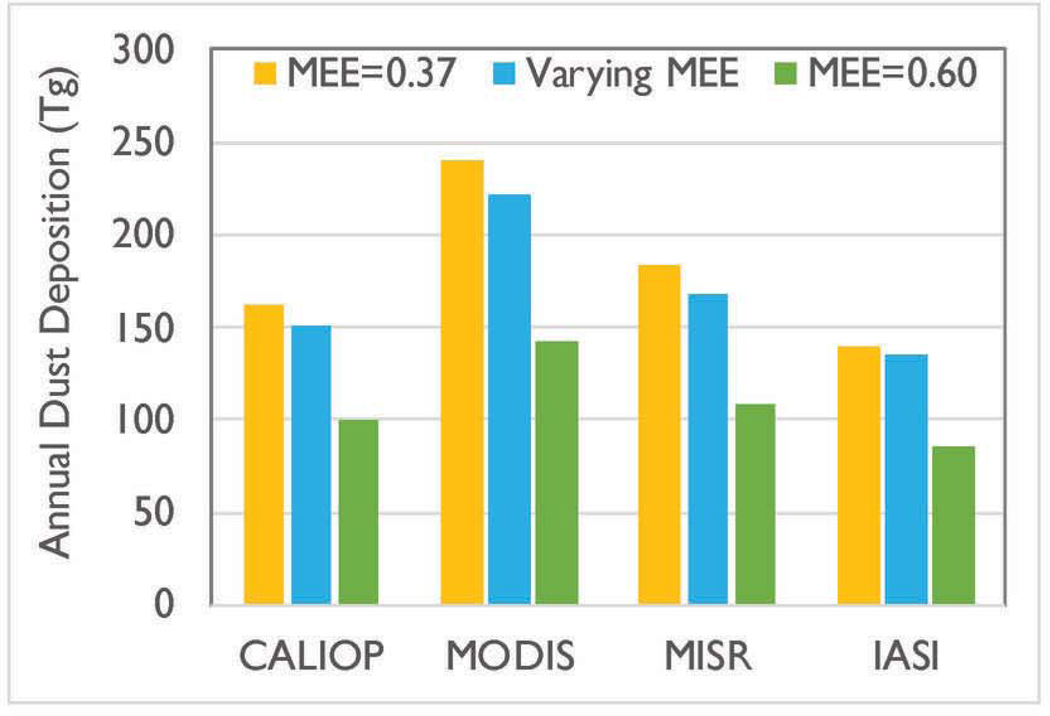
Sensitivity of 2007–2016 average dust deposition into the tropical Atlantic Ocean to different assumed values of dust MEE as marked with different color.
Figure 7:
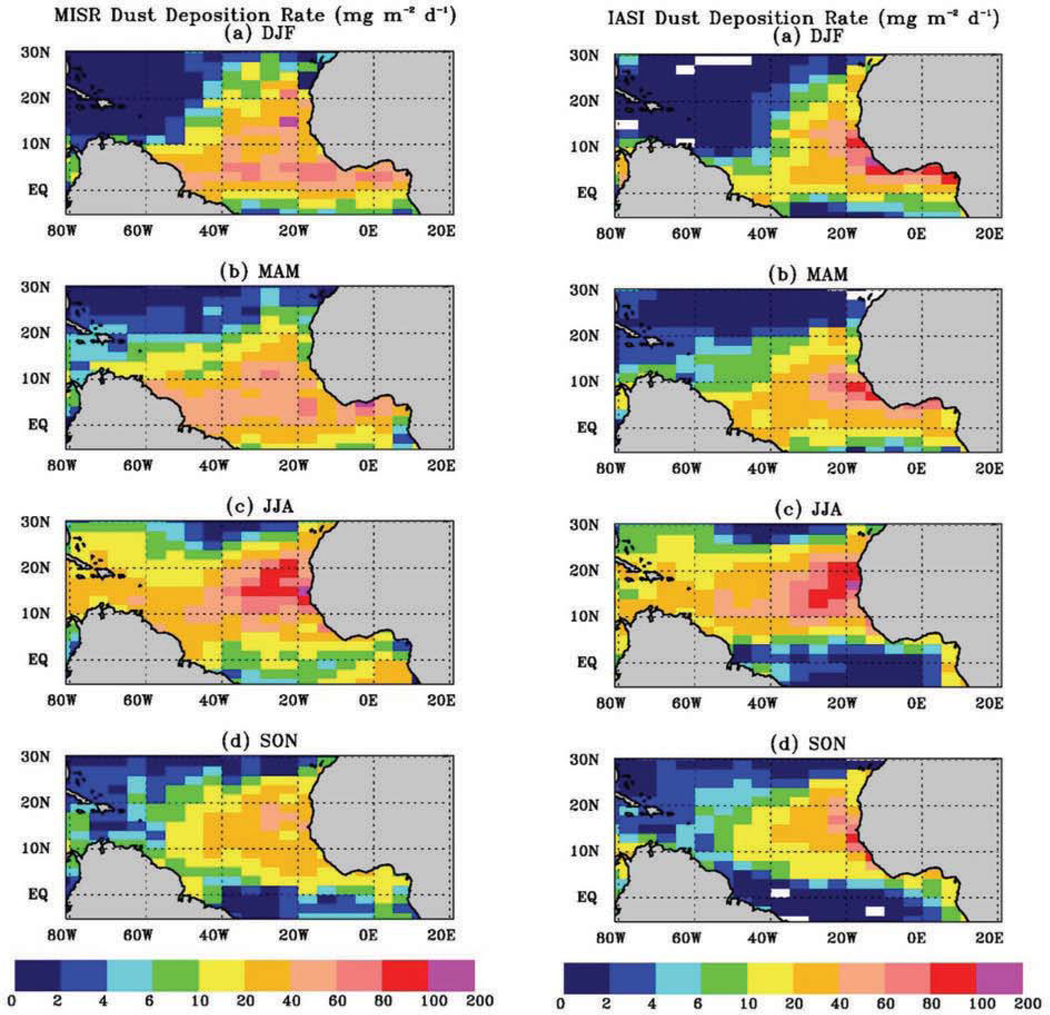
same as Figure 6, but from MISR (left panels) and IASI (right panels).
To reduce the uncertainties in dust deposition, future satellites need to have enhanced capabilities (e.g., measurements of polarization and over broad spectral range) that can improve the characterization of particle properties (e.g., especially size parameters and shape) and hence, improve ability to separate dust from other aerosol types. In addition, surface and aircraft measurements of dust particle properties and loading, along with their natural variability in the real atmosphere, are desperately needed in order to vigorously evaluate and validate satellite retrievals [Kahn et al., 2017]. The values of MEE assumed in this study are based on limited measurements, mostly near the coast of Africa. The evolution of dust particle size and MEE along the trans-Atlantic transport route has been simplified. The high sensitivity of dust deposition flux to the dust MEE (thus size distribution) discussed earlier calls for a better quantification of these variables with new sub-orbital measurements.
4.3. Potential applications of the dust deposition dataset
Despite the limitations and uncertainties discussed above, the dust deposition flux and dust loss frequency datasets derived from multiple satellite observations reveal important features of dust deposition seasonal and interannual variability of dust deposition in the tropical Atlantic Ocean over the decadal time span. In-situ measurements of dust deposition are scarce, especially over remote oceans. The satellite-based estimates described in this study can fill geographical gaps in the in-situ measurements and extend their limited temporal coverage to the decadal time scale.
The satellite-based dust deposition dataset could be used to evaluate model simulations. Figure 15 shows a preliminary comparison of dust deposition (a) and dust LF (b) between our satellite-derived estimates and five model simulations as documented in Kim et al. [2014]. To be consistent with the model simulations, only dust deposition and LF over the EAT and CAR regions are used. The model simulations of total dust deposition vary by a factor of 5 and the partitioning between dry and wet components also varies significantly among the models. The satellite-based estimates of dust deposition of 111 −171 Tg fall inside the much larger range of model simulation (70 – 349 Tg). The differences in the dust deposition between satellites and models, and among models, can result from uncertainties in model representations of both emissions and transport/removal processes. Dust LF, which is derived with higher accuracy than the dust deposition itself, is a useful diagnostic for identifying uncertainties associated with dust transport and removal processes. As shown in Figure 15b, the satellite-based dust LF of 0.078–0.100 d−1 is consistently lower than the model simulations: 0.28 d−1 (GOCART), 0.42 d−1 (GISS), 0.22 d−1 (SPRINTAS), 0.37 d−1 (ECHAM5), and 0.16 d−1 (HadGEM2). Except for HadGEM2 model, the satellite-based estimates of LF are factors of 2–5 smaller than the majority of model simulations. A comparison of both dust deposition and LF along the entire tropical Atlantic Basin could provide useful insights into model deficiencies and guiding the model improvement. For example, HadGEM2’s lower dust deposition and higher LF may suggest that the dust emissions in the model are substantially lower than other model estimates. On the other hand, GOCART’s a factor of 2–3 larger dust deposition may come mainly from more efficient atmospheric removal (high LF). The ECHAM5 model simulates a dust deposition that is closer to satellite-based estimates. However, the model’s dust LF is a factor 3–4 larger than the satellite-based estimates. This may suggest a possibility that the underestimate of dust emissions is compensated by more efficient removal in this particular model.
Figure 15:
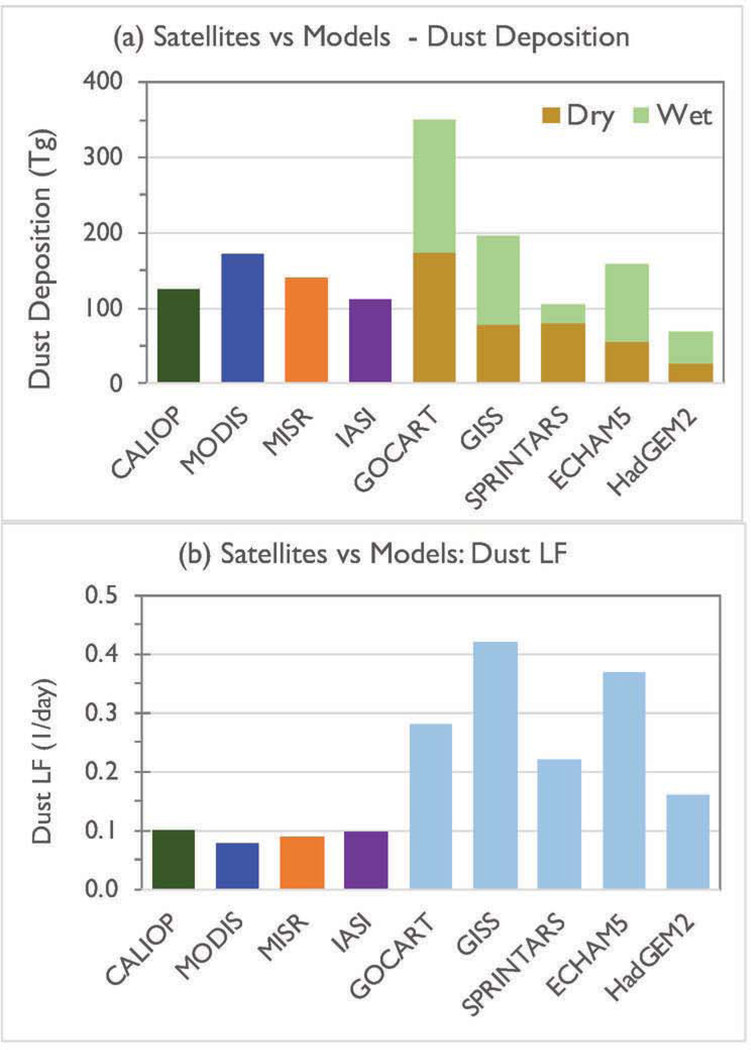
Comparisons of (a) dust deposition (Tg) and (b) dust LF (d−1) between the satellites (this study) and five models in the literature (Kim et al., 2014).
A comprehensive evaluation of model simulations with the dataset produced in this study is beyond the scope of this paper. We plan to carry out the multi-model and satellite comparisons in future under the framework of the Aerosol Comparisons between Observations and Models (AeroCom). Such an effort shall greatly benefit from thorough and systematic evaluation of many variables, including not only dust extensive properties such as DOD, extinction profile, and deposition flux, but also intensive properties like dust size distribution, MEE, and LF. Dust size distribution and MEE, critical parameters that link model simulations of dust mass with satellite optical measurements, are needed to better understand potential differences in DOD and dust deposition flux between models and satellites. These quantities can only be acquired from sub-orbital measurements. Arguably the substantial disparity in the dust LF between satellites and models could be associated with such factors as the parameterizations of dry and wet dust deposition, model simulations of rainfall rate, and vertical distributions of dust, among others. To further attribute the LF uncertainty to individual processes, it is necessary to first thoroughly evaluate model simulations of dust vertical profiles and rainfall rates with available observations (e.g., CALIOP, GPCP). Built on the outcome of this evaluation, one can then assess uncertainty in the model parameterizations of dust removal processes. Insights gained from such strategic efforts would provide guidance on improving model simulations of trans-Atlantic transport of North African dust and its roles in the climate system.
5. Conclusions
Advances in satellite remote sensing offer a promising perspective on addressing critical science questions relating to ocean-atmosphere interactions, though significant challenges still remain for future endeavors [Neukermans et al., 2018]. The deposition of aeolian dust into the ocean, among the major exchanges of materials at the ocean-atmosphere interface, has important implications for ocean biogeochemical cycles and climate change. This study demonstrates the feasibility of characterizing sub-basin and seasonal variations of dust deposition into the tropical Atlantic Ocean over a decadal time scale through integrating existing active (CALIOP) and passive (MODIS, MISR, IASI) measurements of the three-dimensional distribution of atmospheric aerosol. Observations from these four satellite sensors produce generally consistent characterizations of DOD, dust deposition, and dust LF, with some differences existing in details. It is important to note that spatial patterns of DOD, dust deposition flux, and dust LF are not the same, because dust deposition is determined by the horizontal gradient of DOD and depends on the vertical profile of dust and rainfall rate. In other words, one cannot use DOD distribution alone to represent the spatial variability of dust deposition and loss frequency. In this paper we developed a practical Eulerian approach to estimate monthly average dust deposition into tropical Atlantic Ocean based on the balance between horizontal dust mass flux in a grid cell and inherent assumptions of no dust sources at surface and no loss of dust through the top of troposphere.
On the basis of a ten-year (2007–2016) average, we estimated from the four satellite sensors that the amount of dust deposited into the eastern Atlantic Ocean, Gulf of Guinea, and Caribbean Basin (including water body over the domain of 5°S-30°N, 10°E-80°W) is 136 – 222 Tg yr-1. 65–83% of satellite-based annual dust deposition estimates agree with an in-situ based climatology within a factor of 2, with the overall low bias of within 20%. The deposition is generally highest in summer and lowest in fall. In winter and spring, the dust deposition is slightly smaller than that in summer. Dust deposition also varies significantly from year to year, which is seasonally dependent. The interannual variability (as measured by normalized standard deviation) shows that the springtime dust deposition variation accounts for about 28–41% of the 10-year mean. This large springtime interannual variability is presumably due to the large variability of atmospheric circulations and rainfall distributions during the transition of winter to summer West African monsoon. The summer dust deposition shows the smallest interannual variability, with the standard deviation accounting for 7 – 15% of the mean. The dust deposition displays high spatial heterogeneity. The satellite observations consistently reveal meridional and zonal shifts of the major dust deposition belts, modulated by the seasonal migration of the ITCZ.
We also derived the dust LF based on satellite observations, which has a better accuracy than the dust deposition itself and is a particularly useful metric for better understanding satellite-model and model-model discrepancies in the estimated dust deposition. The most efficient loss of dust, i.e., the highest LF, occurs in the winter season, consistent with the greater likelihood that low-altitude dust transport along the southern trajectory in winter is intercepted by rainfall associated with the ITCZ. On the basis of annual mean and basin-scale aggregation, the dust LF derived from the satellite observations of DOD and dust deposition falls in the range from 0.078 to 0.010 d−1, which is smaller than most of the model simulations in the literature by factors of 2–5.
The dataset generated in this study from multiple satellite observations has several potential applications. It can fill geographical gaps of in-situ measurements and extend their limited temporal coverage to a decadal time scale. The dataset provides the first order constraint on dust deposition that is needed to study dust impacts on ocean biogeochemical cycles, although the bioavailable nutrients associated with the dust deposition also need to be constrained with other observations. The dataset can further be used to evaluate model simulations of dust deposition and to identify possible processes (e.g., emissions vs transport/removals) contributing to the similarities and differences between satellite and model results. Such efforts would greatly benefit from thorough, systematic, and strategic evaluation of a variety of dust and meteorological variables in the multi-model framework, complemented by sub-orbital measurements of dust particle properties, such as size distribution and MEE and their potential change during the long-range transport.
Supplementary Material
Three Key Points:
Multiple satellite data are used to generate a unique ten-year product of dust deposition into the tropical Atlantic Ocean.
The dust deposition into the tropical Atlantic Ocean is estimated at 136 – 222 Tg yr−1, with large heterogeneity in space and time.
The satellite-based estimates of dust loss frequency are lower than model simulations by up to factors of 2 to 5.
Acknowledgements:
This work was supported by the National Aeronautics and Space Administration’s (NASA) CALIPSO/CloudSat Science Team project to HY administered by Dr. David Considine. LR would like to acknowledge support from NASA’s The Science of Terra, Aqua, Suomi-National Polar-orbiting Partnership administered by Dr. Paula Bontempi. We are grateful to Dr. Hua Song for helping with generating Figure 5 and numerous researchers who have contributed to the production of datasets used in this study. All datasets of aerosol and meteorology were obtained from a variety of sources with public access: The MODIS Dark Target aerosol data were obtained from the NASA Level-1 and Atmosphere Archive and Distribution System (LAADS) webpage (https://ladsweb.nascom.nasa.gov/). The CALIOP and MISR aerosol products were obtained from NASA Langley Research Center Atmospheric Science Data Center (https://eosweb.larc.nasa.gov/). The IASI data were downloaded from http://ara.abct.lmd.polytechnique.fr/index.php?page=aerosol-climatology managed by scientists at the LMD/CNES. The MERRA-2 wind profiles and aerosol reanalysis were obtained from the NASA Goddard Earth Sciences (GES) Data and Information Services Center (DISC) https://disc.gsfc.nasa.gov/datasets?keywords=%22MERRA-2%22&page=1&source=Models%2FAnalyses%20MERRA-2. The GPCP rainfall data were downloaded from https://www.esrl.noaa.gov/psd/data/gridded/data.gpcp.html.
References
- Abouchami W, et al. (2013), Geochemcial and isotopic characterization of the Bodele Depression dust source and implications for transatlantic dust transport to the Amazon Basin, Earth Planet. Sci. Lett, 380, 112–123. [Google Scholar]
- Adler R et al. (2018), The Global Precipitation Climatology Project (GPCP) Monthly Analysis (New Version 2.3) and a Review of 2017 Global Precipitation, Atmosphere, 9, 138, 10.3390/atmos9040138. [DOI] [PMC free article] [PubMed] [Google Scholar]
- Albani S, Mahowald NM, Perry AT, Scanza RA, Zender CS, Heavens NG, Maggi V, Kok JF & Otto-Bliesner BL (2014). Improved dust representation in the Community Atmosphere Model, J. Adv. Model. Earth Syst, 6, 541–570. [Google Scholar]
- Anderson RF, et al. (2016). How well can we quantify dust deposition to the ocean? Phil. Trans. R. Soc. A 374, 20150285, 2016. 10.1098/rsta.2015.02852016. [DOI] [PMC free article] [PubMed] [Google Scholar]
- Ansmann A, et al. (2009), Dust and smoke transport from Africa to South America: Lidar profiling over Cape Verde and the Amazon rainforest, Geophys. Res. Lett, 36, L11802. [Google Scholar]
- Ben-Ami Y, et al. (2010), Transport of North African dust from the Bodele depression to the Amazon Basin: A case study, Atmos. Chem. Phys, 10, 7533–7544. [Google Scholar]
- Ben-Ami Y, Koren I, Altaratz O, & Lehahn Y (2012), Discernable rhythm in the spatial/temporal distributions of transatlantic dust. Atmospheric Chemistry and Physics, 12, 2253–2262. [Google Scholar]
- Buchard V, et al. (2017), The MERRA-2 aerosol reanalysis, 1980 onward. Part II: Evaluation and case studies, J. Clim, 30, 6851–6872, doi: 10.1175/JCLI-D-16-06013.1. [DOI] [PMC free article] [PubMed] [Google Scholar]
- Capelle V, Chedin A, Siméon M, Tsamalis C, Pierangelo C, Pondrom M, Armante R, Crevoisier C, Crépeau L & Scott NA (2014), Evaluation of IASI derived dust aerosols characteristics over the tropical belt. Atmos. Chem. Phys, 14, 9343–9362. [Google Scholar]
- Capelle V, Chédin A, Pondrom M, Crevoisier C, Armante R, Crépeau L & Scott NA (2018), A decade of IASI infrared dust aerosol characteristics: comparison with AERONET and analysis of the infrared to visible AOD ratio, Remote Sens. Environ, 206, 15–32. [Google Scholar]
- Chin M, et al. (2014), Multi-decadal aerosol variations from 1980–2009: a perspective from observations and a global model, Atmos. Chem. Phys, 14, 3657–3690. [Google Scholar]
- Diner DJ, Beckert JC, Reilly TH, Bruegge CJ, Conel JE & Kahn RA (1998), Multi-angle Imaging SpectroRadiometer (MISR) instrument description and experiment overview. IEEE Trans. Geosci. Remote Sens, 36, 1072–1087. [Google Scholar]
- Duce RA, et al. (1991), The atmospheric input of trace species to the world ocean, Global Biogeochemical Cycle, 5, 193–259. [Google Scholar]
- Engelstaedter S, Tegen I & Washington R (2006), North African dust emissions and transport, Earth-Sci. Rev, 79, 73–100. [Google Scholar]
- Friese CA, van Hateren JA, Vogt C, Fischer G & Stuut JW (2017), Seasonal provenance changes in present-day Saharan dust collected in and off Mauritania, Atmos. Chem. Phys, 17, 10163–10193. [Google Scholar]
- Garay MJ, Kalashnikova OV, & Bull MA (2017), Development and assessment of a higher-spatial-resolution (4.4 km) MISR aerosol optical depth product using AERONET- DRAGON data, Atmos. Chem. Phys, 17, 5095–5106, 10.5194/acp-17-5095-2017. [DOI] [Google Scholar]
- Gelaro R et al. (2017), The Modern-Era Retrospective Analysis for Research and Application, Version 2 (MERRA-2), J. Climate, 30, 5419–5454. [DOI] [PMC free article] [PubMed] [Google Scholar]
- Gläser G, Wernli H, Kerkweg A & Teubler F (2015), The transatlantic dust transport from North Africa to the Americas—Its characteristics and source regions, J. Geophys. Res. Atmos, 120, 11,231–11,252, doi: 10.1002/2015JD023792. [DOI] [Google Scholar]
- Haywood J, Francis P, Osborne S, Glew M, Loeb N, Highwood E, Tanre D, Myhre G, Formenti P & Hirst E (2003), Radiative properties and direct radiative effect of Saharan dust measured by the C-130 aircraft during SHADE: 1. Solar spectrum, J. Geophys. Res, 108, 8577, doi: 10.1029/2002JD002687. [DOI] [Google Scholar]
- Hilton F, et al. (2012), Hyperspectral Earth Observation from IASI: Five years of accomplishment, Bull. Am. Meteorol. Soc, 93, 347–370. [Google Scholar]
- Huang J, Zhang C & Prospero JM (2010), African dust outbreaks: A satellite perspective of temporal and spatial variability over the tropical Atlantic Ocean, J. Geophys. Res, 115, D05202, doi: 10.1029/2009JD012516. [DOI] [Google Scholar]
- Huneeus N et al. (2011), Global dust model intercomparison in AeroCom Phase I, Atmos. Chem. Phys, 11, 7781–7816. [Google Scholar]
- Hunt WH, Winker DM, Vaughan MA, Powell KA, Lucker PL, & Weimer C , CALIPSO lidar description and performance assessment, J. Atmos. Ocean Tech, 26, 1214–1228, 10.1175/2009JTECHA1223.!. [DOI] [Google Scholar]
- Jickells TD, et al. (2005), Global iron connections between desert dust, ocean biogeochemistry, and climate, Science, 308, 67–71, doi: 10.1126/science.1105959. [DOI] [PubMed] [Google Scholar]
- Kahn RA, P. Banerjee P & McDonald D (2001), The Sensitivity of Multiangle Imaging to Natural Mixtures of Aerosols Over Ocean, J. Geophys. Res, 106, 18219–18238. [Google Scholar]
- Kahn RA, et al. (2007), Aerosol source plume physical characteristics from space-based multiangle imaging, J. Geophys. Res, 112, D11205. [Google Scholar]
- Kahn RA, Gaitley BJ, Garay MJ, Diner DJ, Eck T, Smirnov A & Holben BN (2010), Multiangle Imaging SpectroRadiometer global aerosol product assessment by comparison with the Aerosol Robotic Network. J. Geophys. Res, 115, D23209, doi: 10.1029/2010JD014601. [DOI] [Google Scholar]
- Kahn RA, & Gaitley BJ (2015), An analysis of global aerosol type as retrieved by MISR. J. Geophys. Res. Atmos. 120, doi: 10.1002/2015JD023322. [DOI] [Google Scholar]
- Kahn RA, et al. (2017), SAM-CAAM: A Concept for Acquiring Systematic Aircraft Measurements to Characterize Aerosol Air Masses. Bulletin of the American Meteorological Society 98 (10): 2215–2228 [10.1175/bams-d-16–0003.1]. [DOI] [PMC free article] [PubMed] [Google Scholar]
- Kalashnikova OV, Kahn RA, Sokolik IN & Li W-H (2005), Ability of multiangle remote sensing observations to identify and distinguish mineral dust types: Optical models and retrievals of optically thick plumes, J. Geophys. Res, 110, D18S14, doi: 10.1029/2004JD004550. [DOI] [Google Scholar]
- Kalashnikova OV & Kahn RA (2006), Ability of multiangle remote sensing observations to identify and distinguish mineral dust types: 2. Sensitivity over dark water, J. Geophys. Res, 111, D11207. [Google Scholar]
- Kalashnikova OV & Kahn RA (2008), Mineral dust plume evolution over the Atlantic from combined MISR/MODIS aerosol retrievals, J. Geophys. Res, 113, D24204, doi: 10.1029/2008JD010083. [DOI] [Google Scholar]
- Kalashnikova OV, Garay MJ, Martonchik JV, & Diner DJ (2013): MISR Dark Water aerosol retrievals: operational algorithm sensitivity to particle non-sphericity, Atmos. Meas. Tech, 6, 2131–2154, 10.5194/amt-6-2131-2013. [DOI] [Google Scholar]
- Kaufman YJ, Smirnov A, Holben BN & Dubovik O (2001), Baseline maritime aerosol: methodology to derive the optical thickness and scattering properties, Geophys. Res. Lett, 28, 3251–3254. [Google Scholar]
- Kaufman YJ, Koren I, Remer LA, Tanre D, Ginoux P & Fan S (2005), Dust transport and deposition observed from the Terra-Moderate Resolution Imaging Spectroradiometer (MODIS) spacecraft over the Atlantic Ocean, J. Geophys. Res, 110, D10S12. [Google Scholar]
- Kiliyanpilakkil VP, & Meskhidz N (2011), Deriving the effect of wind speed on clean marine aerosol optical properties using the A-Train satellites, Atmos. Chem. Phys, 11, 11401–11413. [Google Scholar]
- Kim D, Chin M, Yu H, Diehl T, Tan Q, Kahn RA, Tsigaridis K, Bauer S, Takemura T, Pozzoli L, et al. (2014), Sources, sinks, and transatlantic transport of North African dust aerosol: A multi-model analysis and comparison with remote-sensing data, J. Geophys. Res. Atmos, 119, 6259–6277, doi: 10.1002/2013JD021099. [DOI] [Google Scholar]
- Kim M, Omar A, et al. (2018), The CALIPSO version 4 automated aerosol classification and lidar ratio selection algorithm, Atmos. Meas. Tech, 11, 6107–6135. [DOI] [PMC free article] [PubMed] [Google Scholar]
- Kok JF, Ridley DA, Zhou Q, Miller RL, Zhao C, Heald CL, Ward DS, Albani S, and Haustein K (2017), Smaller desert dust cooling effect estimated from analysis of dust size and abundance, Nature Geoscience, 10, 274–278. [DOI] [PMC free article] [PubMed] [Google Scholar]
- Koren I, et al. (2006), The Bodele Depression: A single spot in the Sahara that provides most of the mineral dust to the Amazon forest, Environ. Res. Lett, 1, 014005. [Google Scholar]
- Korte LF, et al. (2017), Downward particle fluxes of biogenic matter and Saharan dust across the equatorial North Atlantic, Atmos. Chem. Phys, 17, 6023–6040. [Google Scholar]
- Korte LF, et al. (2018), effects of dry and wet Saharan dust deposition in the tropical North Atlantic Ocean, Biogeosciences Discuss, 10.5194/bg-2018-484. [DOI] [Google Scholar]
- Levy R, Mattoo S, Munchak LA, Remer LA, Sayer AM & Hsu N (2013), The Collection 6 MODIS aerosol products over land and ocean, Atmos. Meas. Tech. 6, 2989–3034. [Google Scholar]
- Levy RC, Mattoo S, Sawyer V, Shi Y, Colarco PR, Lyapustin AI, Wang YJ & Remer LA (2018), Exploring systematic offsets between aerosol products from the two MODIS sensors, Atmos. Meas. Tech, 11, 4073–4092. [DOI] [PMC free article] [PubMed] [Google Scholar]
- Lou S, Russell LM, Yang Y, Liu Y, Singh B, and Ghan SJ (2017), Impacts of interactive dust and its direct radiative forcing on interannual variations of temperature and precipitation in winter over East Asia, J. Geophys. Res. Atmos, 122, 8761–8780, doi: 10.1002/2017JD027267. [DOI] [Google Scholar]
- Mahowald N, et al. (2011), Model insight into glacial-interglacial paleo dust records. Quaternary Science Reviews, 30, 7–8, 832–854, doi: 10.1016/j.quascirev.2010.09.007. [DOI] [Google Scholar]
- Mahowald N, Albani S, Kok JF, Engelstaeder S, Scanza R, Ward D & Flanner M (2014), The size distribution of desert dust aerosols and its impacts on the Earth system, Aeolian Res, 15, 53–71. [Google Scholar]
- Maring H, Savoie DL, Izaguirre MA, Custals L & Reid JS (2003). Mineral dust aerosol size distribution change during atmospheric transport, J. Geophys. Res, 108, 8592. [Google Scholar]
- Mills MM, Ridame C, Davey M, Richard JL & Geider J (2004), Iron and phosphorus co-limit nitrogen fixation in the eastern tropical North Atlantic, Nature, 429, 292–294. [DOI] [PubMed] [Google Scholar]
- Moore CM, et al. (2009), Large-scale distribution of Atlantic nitrogen fixation controlled by iron availability, Nature Geosci, 2, 867–871. [Google Scholar]
- Mulcahy JP, O’Dowd CD, Jennings SG & Ceburnis D (2008), Significant enhancement of aerosol optical depth in marine air under high wind conditions, Geophys. Res. Lett, 35, L16810, doi: 10.1029/2008GL034303. [DOI] [Google Scholar]
- Neukermans G, et al. (2018), Harnessing remote sensing to address critical science questions on ocean-atmosphere interactions, Elementa Science of the Anthropocene, 6:71, 1–46, doi: 10.1525/elementa.331. [DOI] [Google Scholar]
- Peyridieu S, et al. (2013), Characterization of dust aerosols in the infrared from IASI and comparison with PARASOL, MODIS, MISR, CALIOP, and AERONET observations, Atmos. Chem. Phys, 13, 6065–6082. [Google Scholar]
- Pierce JR, Kahn RA, Davis MR & Comstock JM (2010), Detecting thin cirrus in Multiangle Imaging Spectroradiometer aerosol retrievals, J. Geophys. Res, 115, D08201, doi: 10.1029/2009JD013019. [DOI] [Google Scholar]
- Prospero JM, Nees RT & Uematsu M (1987), Deposition rate of particulate and dissolved aluminum derived from Saharan dust in precipitation at Miami, Florida, J. Geophys. Res, 92, 14723–14731. [Google Scholar]
- Prospero JM, et al. (1996), Atmospheric deposition of nutrients to the North Atlantic Basin, Biogeochemistry, 35, 27–73. [Google Scholar]
- Prospero JM (1999), Long-range transport of mineral dust in the global atmosphere: Impact of African dust on the environment of the southeastern United States, Proc. Natl. Acad. Sci. U.S.A, 96, 3396–3403. [DOI] [PMC free article] [PubMed] [Google Scholar]
- Prospero JM, Ginoux P, Torres O, Nicholson SE & Gill TE (2002), Environmental characterization of global sources of atmospheric soil dust identified with the Nimbus 7 Total Ozone Mapping Spectrometer (TOMS) absorbing aerosol product, Rev. Geophys, 40, 1002, doi: 10.1029/2000RG000095. [DOI] [Google Scholar]
- Prospero JM, & Lamb PJ (2003), African droughts and dust transport to the Caribbean: Climate change implications, Science, 302, 1024–1027. [DOI] [PubMed] [Google Scholar]
- Prospero JM, Landing WM & Schulz M (2010), African dust deposition to Florida:Temporal and spatial variability and comparisons to models, J.Geophys. Res, 115, D13304, doi: 10.1029/2009JD012773. [DOI] [Google Scholar]
- Prospero JM, Collard F-X, Molinie J & Jeannot A (2014), Characterizing the annual cycle of African dust transport to the Caribbean Basin and South America and its impact on air quality and the environment, GlobalBiogeochem. Cycles, 29, 757–773, doi: 10.1002/2013GB004802. [DOI] [Google Scholar]
- Randles C, et al. (2017), The MERRA-2 aerosol reanalysis, 1980 onward, Part I: System description and data assimilation evaluation. J. Climate, 30, 6823–6850, doi: 10.1175/JCLI-D-16-0609.1. [DOI] [PMC free article] [PubMed] [Google Scholar]
- Remer LA, et al. (2005), The MODIS aerosol algorithm, products, and validation, J. Atmos. Sci, 62, 947–973. [Google Scholar]
- Ridley DA, Heald CL & Ford B (2012), North African dust export and deposition: A satellite and model perspective, J. Geophys. Res, 117, D02202, doi: 10.1029/2011JD016794. [DOI] [Google Scholar]
- Ryder CL, Highwood EJ, Lai TM, Sodemann H & Marsham JH (2013), Impact of atmospheric transport on the evolution of microphysical and optical properties of Saharan dust, Geophys. Res. Lett, 40, 2433–2438. [Google Scholar]
- Ryder CL, et al. (2018), Coarse-mode mineral dust size distributions, composition and optical properties from AER-D aircraft measurements over the tropical eastern Atlantic, Atmos. Chem. Phys, 18, 17225–17257. [Google Scholar]
- Rudich Y, Kaufman YJ, Dayan U, Yu H & Kleidman RG (2008), Estimation of transboundary transport of pollution aerosols by remote sensing in the eastern Mediterranean, J. Geophys. Res, 113, D14S13, doi: 10.1029/2007JD009601. [DOI] [Google Scholar]
- Schepanski K, Tegen I & Macke A (2009), Saharan dust transport and deposition towards the tropical northern Atlantic, Atmos. Chem. Phys, 9, 1173–1189, doi: 10.5194/acp-9-1173-2009. [DOI] [Google Scholar]
- Schulz M, et al. (2012), Atmospheric transport and deposition of mineral dust to the ocean: Implications for research needs, Environ. Sci. Technol, 46, 10390–10404. [DOI] [PubMed] [Google Scholar]
- Smirnov A, et al. (2002), Optical properties of atmospheric aerosol in marine environments, J. Atmos. Sci, 59, 501–523. [Google Scholar]
- Song Q, Zhang Z, Yu H, Kato S, Yang P, Colarco P, Remer LA & Ryder CL (2018), Net radiative effects of dust in tropical North Atlantic based on integrated satellite observations and in situ measurements, Atmos. Chem. Phys, 18, 11303–11322. [Google Scholar]
- Tanré D, et al. (2011), Remote sensing of aerosols by using polarized, directional and spectral measurements within the A-Train: the PARASOL mission. Atmos. Meas. Tech, 4, 1383–1395. [Google Scholar]
- Tegen I, et al. (2006), Modelling soil dust aerosol in the Bodele depression during the BoDEx campaign, Atmos. Chem. Phys, 6, 4345–4359. [Google Scholar]
- Wang H, et al. (2013), Sensitivity of remote aerosol distributions to representation of cloud- aerosol interactions in a global climate model, Geosci. Model Dev, 6, 765–782. [Google Scholar]
- Winker DM, et al. (2009), Overview of the CALIPSO mission and CALIOP data processing algorithms, J. Atmos. Ocean Tech, 26, 2310–2323, https://doi.Org/10.1175/2009JTECHA1281.1. [Google Scholar]
- Winker DM, et al. (2010), The CALIPSO Mission: A Global 3D View of Aerosols and Clouds. Bull. Amer. Meteor. Soc, 91, 1211–1229. [Google Scholar]
- Witek ML, Garay MJ, Diner DJ, Bull MA & Seidel FC (2018), New approach to the retrieval of AOD and its uncertainty from MISR observations over dark water, Atmos. Meas. Tech, 11, 429–439, 10.5194/amt-11-429-2018. [DOI] [Google Scholar]
- Yang Y, Russell LM, Lou S, Liao H, Guo J, Liu Y, Singh B, and Ghan SJ (2017), Dustwind interactions can intensify aerosol pollution over eastern China, Nat. Commun, 8, 15333, doi: 10.1038/ncomms15333. [DOI] [PMC free article] [PubMed] [Google Scholar]
- Young SA, Vaughan MA, Garnier A, Tackett JL, Lambeth JD & Powell KA (2018), Extinction and optical depth retrievals for CALIPSO’s Version 4 data release, Atmos. Meas. Tech, 11, 5701–5727, 10.5194/amt-11-5701-2018. [DOI] [Google Scholar]
- Yu H, et al. (2006), A review of satellite-based assessments of the aerosol direct radiative effect and forcing, Atmos. Chem. Phys, 6, 613–666. [Google Scholar]
- Yu H, Remer LA, Chin M, Bian H, Kleidman RG & Diehl T (2008), A satellite-based assessment of transpacific transport of pollution aerosol, J. Geophys. Res, 113, D14S12, doi: 10.1029/2007JD009349. [DOI] [Google Scholar]
- Yu H, Chin M, Remer LA et al. (2009), Variability of marine aerosol fine-mode fraction and estimates of anthropogenic aerosol component over cloud-free oceans from MODIS, J. Geophys. Res, 114, D10206. [Google Scholar]
- Yu H, et al. (2010), Global view of aerosol vertical distributions from CALIPSO lidar measurements and GOCART simulations: Regional and seasonal variations, J. Geophys. Res, 115, D00H30. [Google Scholar]
- Yu H, Remer LA, Chin M, Bian H, Tan Q, Yuan T & Zhang Y (2012), Aerosols from overseas rival domestic emissions over North America. Science, 337, 566–569. [DOI] [PubMed] [Google Scholar]
- Yu H, Remer LA, Kahn RA, Chin M & Zhang Y (2013), Satellite perspective of aerosol intercontinental transport: from qualitative tracking to quantitative characterization, Atmos. Res, 124, 73–100. [Google Scholar]
- Yu H, & Zhang Z (2013), New Directions: Emerging satellite observations of above-cloud aerosols and direct radiative forcing, Atmos. Environ, 72, 36–40. [Google Scholar]
- Yu H, Chin M, Bian H, et al. (2015a), Quantification of trans-Atlantic dust transport from seven-year (2007–2013) record of CALIPSO lidar measurements, Remote Sens. Environ, 159, 232–249, doi: 10.1016/j.rse.2014.12.010. [DOI] [Google Scholar]
- Yu H, Chin M, Yuan T, et al. (2015b), The fertilizing role of African Dust in the Amazon Rainforest: A first multiyear assessment based on CALIPSO lidar observations. Geophys. Res. Lett, 42,1984–1991 doi: 10.1002/2015GL063040.\ [DOI] [Google Scholar]
- Yuan TL, Oreopoulos L, Zelinka M, Yu H, Norris J, Chin M, Platnick SE, and Meyer KG (2016). Positive low cloud and dust feedbacks amplify tropical North Atlantic multidecadal oscillation. Geophys. Res. Lett, 43 (3), 1349–1356 doi: 10.1002/2016gl067679. [DOI] [PMC free article] [PubMed] [Google Scholar]
Associated Data
This section collects any data citations, data availability statements, or supplementary materials included in this article.


