

Abstract
Background
While Roux-en-Y gastric bypass (RYGB) is one of the most effective and durable treatment options for obesity and its comorbidities, it is complicated by long-term weight regain in over 20% of patients.
Aims
We sought to determine the metabolite signatures of serum samples of patients with weight regain (RYGB-WR) after RYGB and features distinguishing these patients from patients with sustained weight loss (RYGB-SWL).
Methods
We prospectively analyzed serum samples from 21 RYGB-WR patients, 14 RYGB-SWL patients and 11 unoperated controls. The main outcome measure was their serum metabolite profile.
Results
Weight regain after RYGB was associated with a unique serum metabolomic fingerprint. Most of the statistically different metabolites were involved in amino acid metabolism, one-carbon metabolism and related nucleotide metabolism. A principal component analysis identified groups of metabolites that correlate with weight regain. Specifically, weight regain was associated with lower serum levels of metabolites related to the serine, glycine and threonine pathway, phenylalanine metabolism, tricyclic acid cycle, alanine and glutamate metabolism, and higher levels of other amino acids.
Conclusions
Weight regain after RYGB is associated with unique serum metabolite signatures. Metabolite profiling may eventually help us to identify markers that could differentiate the patients who will regain weight vs. those who will likely sustain weight loss.
Keywords: Gastric bypass, bariatric surgery, obesity, weight regain, metabolomics
Introduction
More than 35% of the U.S. population suffers from obesity, and the rate is steadily rising [1]. While Roux-en-Y gastric bypass surgery (RYGB) is one of the best treatment options, it is complicated by long-term weight regain in over 20% of patients [2,3]. The precise reason for the loss of efficacy of the procedure in these patients remains unclear. Current theories include anatomic changes (e.g., larger pouch or gastrojejunal anastomosis diameter) [4], dietary indiscretion, psychiatric disease, and hormonal factors [2].
Using the highly parallel assay system of metabolite profiling, prior studies characterizing the metabolic responses in the serum after RYGB have helped to delineate the significant metabolic alterations that occur after this surgery [5]. Metabolite profiling can delineate the time course of essentially thousands of metabolites simultaneously and also allows for the integrated analysis of multiple metabolites as composite measures, along with their correlation with clinical outcomes. Laferrere et al. compared patients after RYGB versus dieting and were the first to point out the significance of serum amino acid metabolic signatures in clinical outcomes after surgery [6]. Mutch et al. examined patients before and three and six months after gastric bypass surgery and found significant differences in the levels of sphingosines, unsaturated fatty acids, and branched chain amino acids [7]. Longer term studies have explored changes that occur one year post-surgery [8]. We have also recently confirmed that RYGB is associated with a serum amino acid profile that is consistent with increased amino acid utilization or protein deprivation [9].
Studying treatment failures after RYGB may allow us to better identify markers that can be used to monitor patients after RYGB, especially those who may be at risk of developing weight regain, and additionally may provide important clues about the mechanisms of action of RYGB. This approach is in contrast to comparing postoperative to preoperative or control metabolic profiles, which conveys significant information about the metabolic effects of RYGB but does not seek to understand differential responses to the surgery. Therefore, in this study we sought to determine the metabolite signatures of serum samples of patients with ≥20% weight regain (RYGB-WR) after RYGB, compared to signatures from patients with sustained weight loss (RYGB-SWL).
Methods
Patient selection.
The study was conducted with approval of the Institutional Review Board at Brigham and Women’s Hospital and Boston Children’s Hospital. Forty-seven adult patients, 36 with RYGB and 11 controls, who presented for evaluation at our outpatient clinic or who were referred for an endoscopy were prospectively enrolled after obtaining informed consent. RYGB patients must have had their surgery more than six months prior to their initial enrollment and must have seen at the nadir of weight loss, a percentage of excess weight loss of at least 50% after their initial surgery. Patients with weight regain (RYGB-WR) were approached first for recruitment in the study. Patients were classified as RYGB-WR if they had experienced a weight regain ≥20% of the maximum weight loss. Then, every effort was made to match the patients in the RYGB-WR group to patients who had sustained weight loss after RYGB (RYGB-SWL) and to a group of unoperated controls with obesity for age, gender, preoperative BMI and comorbidities. Patients were excluded if they exhibited any of the following criteria: significant comorbidities, including hypothyroidism, celiac disease, chronic pancreatitis, inflammatory bowel disease or malignancy; significant pathology during the procedure, such as large marginal ulcers or fistula; were prescribed any medications for obesity; or had active psychiatric disorders.
Sample collection and metabolite profiling.
After an overnight fast, blood was obtained, placed on ice and processed for serum collection. Samples were flash frozen on dry ice. There was no difference in the time of the day the samples were collected (mean time 10:38AM ± 49min for controls, 11:07 ± 56 min for RYGB-SWL 10:03AM ± 40 min for RYGB-WR group).
Liquid chromatography tandem mass spectrometry (LC-MS)-based analytical methods were used to measure the metabolome, as described previously [10]. These methods included the following:
C8-pos. This method measures lipids of known identity and thousands of unknown peaks. Lipids and nonpolar metabolites were extracted from 10μL serum using 190μL of isopropanol (IPA) containing an internal standard. They were then separated using reversed phase C8 ultrahigh performance chromatography (U-HPLC) and analyzed using high resolution, full scan MS in the positive ion mode.
C18-neg. This method measures free fatty acids, lipid-derived mediators (eicosanoids), bile acids, and metabolites of intermediate polarity. They were extracted from 30μL plasma or biofluid using 90μL of methanol (MeOH) containing an internal standard, then separated using reversed phase C18 U-HPLC, and analyzed using high resolution, full scan MS in the negative ion mode.
HILIC-pos. This method measures amino acids, amino acid metabolites, acylcarnitines, dipeptides, and other cationic polar metabolites. They were extracted from 10μL serum using 90μL of 25% methanol/75% acetonitrile (MeOH/ACN) containing two internal standards, then separated using hydrophilic interaction liquid chromatography (HILIC), and analyzed using high resolution, full scan MS in the positive ion mode.
IC-neg. This method measures intermediates in the glycolytic pathway, TCA cycle, organic acids and thousands of unknown peaks. Organic acids and sugar phosphates were extracted from 10μL serum using 90μL of (MeOH) containing internal standards, then separated using ion chromatography, and analyzed using high resolution, full scan MS in the negative ion mode.
HILIC-neg. This analysis measures sugars, organic acids, purines, pyrimidines, and other anionic polar metabolites. They were extracted from 30μL serum using 120μL of methanol containing internal standards and analyzed using either high resolution, full scan MS in the positive ion mode or targeted MS using triple quadruple MS system.
Statistics and datasets.
Pairwise comparisons and pathway and enrichment analyses of the collected metabolomics datasets were performed with Metaboanalyst. We used logarithmic transformation and auto-scaling of the data (raw values were mean-centered and divided by the standard deviation of each variable). We used the Benjamini – Hochberg adjustment for multiple testing, which was implemented with the GraphPad Prism 8.1.0. For FDR = 25%, the calculated threshold was P < 0.049. GraphPad was also used for graphs. SAS and SPSS were used for the principal component and the correlation and regression analyses. When appropriate, patients were compared using Chi-Square. We also performed a post-hoc power analysis to evaluate the achieved power of the study, using G*Power software version 3.1.9.4 (Supplementary Figure 1) [11].
The clinical dataset used for the regression analyses (SPSS or text files) and the raw metabolomics data are available at https://figshare.com/s/5bade55b30cdc6aec695 (please note that the link will be replaced by DOI, which will be available upon acceptance of the paper).
Results
Clinical characteristics
We recruited 14 patients who underwent Roux-en-Y gastric bypass surgery and had sustained weight loss (RYGB-SWL), 22 patients who exhibited weight regain after the procedure (RYGB-WR) and 11 unoperated controls. A blood sample was collected after an overnight fast, and the serum metabolite profile was analyzed (Methods). All but one of the samples (from the RYGB-WR group) passed the quality control and were included in the final analysis. The characteristics of the patients are summarized in Table 1.
Table 1.
Patients’ characteristics.
| Variable | Controls | RYGB-SWL | RYGB-WR |
|---|---|---|---|
| N (serum) | 11 | 14 | 21 |
| Age, years | 49.6±15.0 | 42.0±11.1 | 47.9±10.7 |
| Gender (% Female) | 81.8% | 100% | 95.5% |
| Race (%) | |||
| White | 81.8% | 71.4% | 45.5% |
| African-American | 9.1% | 7.1% | 9.1% |
| Hispanic | 9.1% | 14.3% | 40.9% |
| Asian | 0.0% | 7.1% | 0.0% |
| Other | 0.0% | 0.0% | 4.5% |
| Diabetes (n, %) | 2, 18.2% | 1, 7.1% | 2, 9.1% |
| Initial BMI (kg/m2) | 36.4±6.8 | 47.7±8.6 | 49.9±7.3 |
| Nadir BMI (kg/m2) | N/A | 28.2±4.8 | 28.9±2.9 |
| Current BMI (kg/m2) | 36.4±6.8 | 29.4±4.6*# | 37.9±5.7 |
| Current weight (kg) | 101.8±21.5 | 80.1±13.5*# | 102.1±19.9 |
| Years since surgery | N/A | 5.0±3.7* | 8.9±3.0 |
| Weight regain (kg) | N/A | 10.6±4.9 | |
| % EWL regained | N/A | 40±15.0% |
denotes p<0.05 for control versus RYGB-SWL
denotes p<0.05 for RYGB-S versus RYGB-WR
EWL- excess weight loss
Results are mean ± standard deviation
The groups did not differ significantly by age, gender (82–100% female) or race. Interestingly however, in the RYGB-WR group there was a trend towards overrepresentation of Hispanic population (p<0.08). Each group included 1–2 patients with type 2 diabetes. The control group had an average weight of 101.8 ±21.5 kg (BMI 36.4±6.8 kg/m2). Two patients in this group were awaiting endoscopic weight loss procedures and one was pre-bariatric surgery. These controls had not yet started an intensive diet and exercise program. The remaining controls were being evaluated for abdominal pain and reflux and no history of weight loss was reported.
The RYGB-SWL group weighed significantly less than the control group at 80.0±13.5 kg (BMI 29.4±4.6 kg/m2). As would be expected, the RYGB-WR group weighed significantly more than the RYGB-SWL group at 102.7±20.1 kg (BMI 38.1±5.8 kg/m2), but there was no difference compared to the body weight of the controls. In addition, patients with RYGB-WR had their surgery significantly earlier than RYGB-SWL patients.
Weight regain after RYGB is associated with a unique serum metabolomic fingerprint
A total of 376 metabolites were detected in the serum. In the first pairwise comparison, we analyzed both RYGB-treated groups together (RYGB-SWL and RYGB-WR) against the control group and we found that there were 61 metabolites that were significantly different (Supplementary Data File 1). Eighty-nine metabolites were significantly different between controls and RYGB-SWL (Figure 1). Of these 89 metabolites, 23 were also different between RYGB-WR and controls, suggesting that the differences in these metabolites are most likely due to the Roux-en-Y reconfiguration of the intestinal tract. A closer look at these 23 serum metabolites showed that the Roux-en-Y intestinal configuration induces changes in metabolites that are primarily related to amino acid metabolism and especially the metabolism of essential amino acids. Serine, an amino acid that is important for one-carbon metabolism, was also altered after RYGB irrespective of body weight. Other body weight-independent metabolites included the essential nutrient choline as well as several others related to nucleotide metabolism and intermediates of the TCA cycle.
Figure 1.

Metabolites whose levels were found to be statistically significantly different between RYGB-SWL and the control group (left column). Using this set of metabolites, we conducted multiple pairwise comparisons (from left to right): Control vs. RYGB-WR, RYGB-WR vs. RYGB-SWL and Control vs RYGB analyzed together (both SWL + WR). A. Heatmap showing the log2 fold difference between the various groups. B. Heatmap showing the p values of the comparisons between the groups; grey cells denote p>0.05. C: Control group.
The remaining 66 metabolites were uniquely affected in the RYGB-SWL as compared to the control group, but not in RYGB-WR patients. Thus, the differences in these metabolites could be accounted for by the lower body weight (42% difference in EWL) between the two RYGB-treated groups. A catalogue of the metabolites and the various comparisons can be found in Supplementary data file 1.
Sustained weight loss was associated with depletion of metabolites of fatty acid metabolism, including triacylglycerols (TAG), diaglycerols (DAG) and cholesterol esters (CE). Enrichment analysis confirmed that DAG and TAG pathways were significantly depleted in these patients. Several lipids related to plasma membrane composition were significantly enriched in RYGB-SWL compared to controls, including lysophaphatidylethanolamlines (LPE), lysophosphatidylcholines (LPC), phosphatidylcholines (PC), phosphatidylserines (PS), and sphingomyelins (SM). However, most of these metabolites were not significant between RYGB-WR and the control group. Beta-hydroxybutyrate, a ketone body, was significantly elevated in RYGB-SWL patients vs. controls, but not in RYGB-WR vs. controls, suggesting that the RYGB-SWL group may have higher metabolic needs and fatty acid oxidation. Similarly, acetylglycine was also increased only in patients with sustained weight loss after RYGB.
We then directly compared the metabolite profiles of RYGB-SWL and RYGB-WR patients and we found that there were significant differences in 98 metabolites (Figure 2). Unsurprisingly, several metabolites of fatty acid metabolism varied between the two groups and sustained weight loss after RYGB is associated with depletion of metabolites of fatty acid metabolism including TAGs, DAG and CEs. While beta-hydroxybutyrate was a metabolite whose levels were not statistically different between RYGB-WR and controls, it was still significantly elevated in RYGB-SWL patients compared to RYGB-WR, further suggesting that the patients with sustained weight loss may have higher metabolic needs and fatty acid oxidation. Similarly, glycine levels were notably significantly higher in RYGB-SWL compared to RYGB-WR, further suggesting a role of the nutrients of one-carbon metabolism in the weight loss effects of RYGB. Consistently, a pathway analysis showed that most of the statistically different metabolites between RYGB-SWL and RYGB-WR groups are involved in amino acid metabolism, one-carbon metabolism and the related nucleotide metabolism (Figure 2C).
Figure 2.

Comparison of the serum metabolite profile between patients who regained body weight (RYGB-WR) and those who exhibited sustained weight loss (RYGB-SWL). A. Volcano plot showing the metabolites with significantly different levels (red) between the two groups. B. Heat map showing the average log2 fold difference of the metabolites in the two groups. C. Pathway analysis showing the biochemical context of the statistically different metabolites. There is over-representation of these metabolites in many pathways related to amino acid metabolism, one carbon metabolism and processes related to growth. D. Scree plot showing all the principal components of the serum metabolite dataset.
To further explore the differences in metabolite signatures of the serum of patients with sustained weight loss (RYGB-SWL) and those who regained weight after RYGB (RYGB-WR), we performed a principal component analysis. As shown in Figure 2D, PC1 explained 24%, PC2 11% and PC3 8% of the variance of the signatures. The remaining components were noticeably smaller, so we decided to analyze the three-factor solution. Of the 313 unique and known metabolites that were included in the analysis, 135 were most strongly aligned with PC1. Another 107 metabolites were aligned with PC2, whereas PC3 comprised the other 71 metabolites. The list of the metabolites of this component and the pathways that are associated with them are shown in Figures 3 and 4. By correlating the individual study participants’ PC scores with the clinical variables using regression analysis, we found that weight regain was associated with both PC1 and PC2, adjusting for years since surgery (Table 2). Specifically, there was a positive correlation with PC1 and a negative correlation with PC2. PC3, which was comprised mostly of sphingomyelins, was not significantly associated with weight regain. Given the correlation of PC1 and PC2 with weight regain, we sought to further analyze the metabolites of each component. As shown in Figure 3A, fatty acid metabolites such as TAGs and DAGs were positively aligned with PC1 and thus positively correlated with weight regain. In contrast, the metabolites that negatively aligned with PC1 included those of the serine, glycine and threonine pathway, phenylalanine metabolism, tricyclic acid (TCA) cycle, and alanine and glutamate metabolism. Since these metabolites were decreased in patients with weight regain, this analysis suggests that the lower the levels of these metabolites, the higher the degree of weight regain after RYGB. We then analyzed the metabolites of PC2 (Figure 3B). Metabolites associated with TCA and fatty acid biosynthesis were positively aligned with PC2, while amino acids were strongly associated, but in the opposite direction. Amino acid levels were noted to be higher in RYGB-treated patients with weight regain and negatively aligned with PC2, suggesting that higher serum levels of these metabolites are related to higher weight regain after the procedure. In contrast, the decrease in TCA metabolites in patients with weight regain compared to patients with sustained weight loss suggests the lower the levels of these metabolites, the higher the degree of weight regain.
Figure 3.
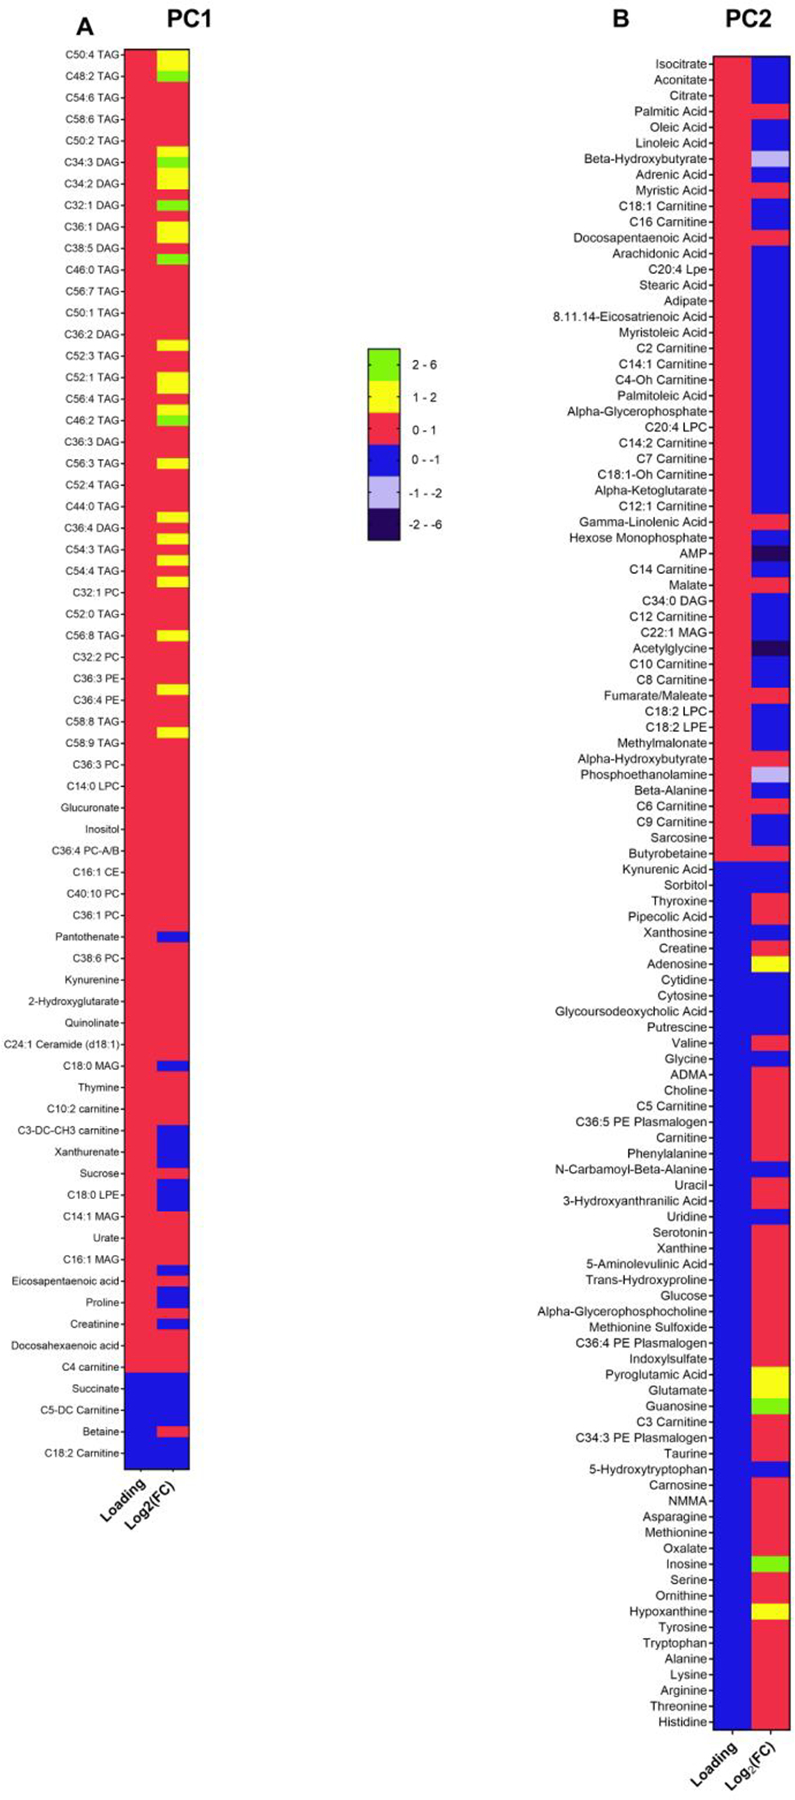
Principal components (PCs) 1 and 2 (PC1 and PC2) correlated with weight regain. Metabolites of PC1 (A) and PC2 (B) respectively. The first column is the loading of each metabolite and the second is the log2 fold difference in the levels of each metabolite between RYGB-WR and RYGB-SWL. PCA is a technique that reduces a large dataset of hundreds of metabolites into the PCs. Each PC is a composite measure of those metabolites that correlate highly with each other. Importantly, the PCs are constructed without any a priori hypothesis. In each PC, the loading of each metabolite is a measure of the correlation of the metabolite and the principal component in which the metabolite belongs. The higher the value of the loading, the higher the correlation with (and thus its contribution to) the PC.
Figure 4.
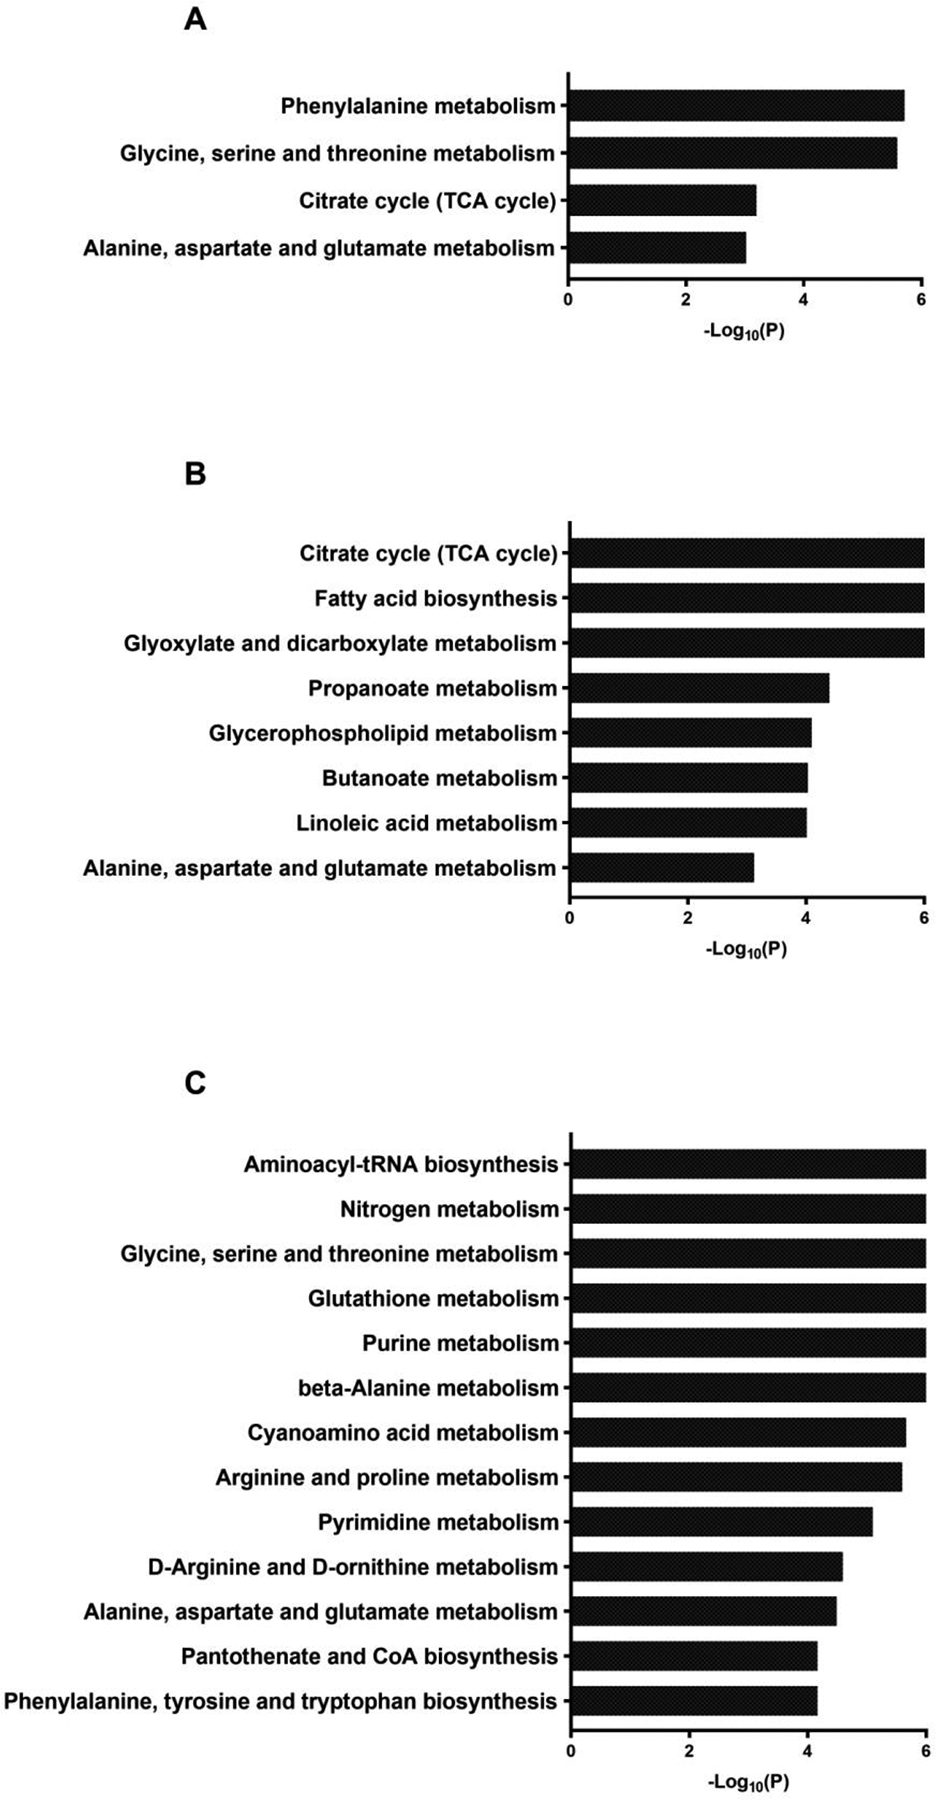
Pathway analysis showing the biochemical context of the metabolites that are negatively aligned with PC1 (A), positively aligned with PC2 (B) and negatively aligned with PC2 (C).
Table 2.
Regression models.
| Model | PC1 | PC2 | Time from Sx | Pre-Sx BMI | Ethnicity | Constant | R2 |
|---|---|---|---|---|---|---|---|
| Unstd B (SE)/Std B | Unstd B (SE)/Std B | Unstd B (SE)/Std B | Unstd B (SE)/Std B | Unstd B (SE)/Std B | Unstd B (SE) | ||
| 1 | 0.101** (0.034)/0.456 | 0.273 (0.034) | 0.208 | ||||
| 2 | −0.088* (0.035)/−0.395 | 0.273 (0.035) | 0.156 | ||||
| 3 | 0.032** (0.009)/0.532 | 0.043 (0.072) | 0.283 | ||||
| 4 | 0.101** (0.031)/0.456 | −0.088** (0.031)/−0.395 | 0.273 (0.031) | 0.364 | |||
| 5 | 0.084** (0.029)/0.379 | −0.067* (0.029)/−0.304 | 0.023** (0.008)/0.384 | 0.107 (0.064) | 0.497 | ||
| 6 | 0.084** (0.029)/0.381 | −0.068* (0.030)/−0.308 | 0.022* (0.008)/0.377 | 0.01 (0.004)/0.025 | 0.076 (0.182) | 0.498 | |
| 7 | 0.101** (0.032)/0.454 | −0.082* (0.034)/−0.369 | 0.031 (0.068)/0.069 | 0.230 (0.102) | 0.369 |
Dependent variable: Weight Regain.
Degrees of freedom: 34
Unstd B: Unstandardized coefficient
Std B: Standardized coefficient
SE: Standard error
Sx: Surgery
p<0.05
p<0.001
Discussion
The fundamental findings of this study are the differences in the serum metabolite signatures of the patients who underwent RYGB and exhibited either weight regain or had sustained weight loss.
Metabolomic profiles associated with patients with sustained weight loss after RYGB were characterized by differences in metabolites of amino acids, pyruvate, and the TCA cycle. Intriguingly, one-carbon metabolism appeared to be enriched in these patients. This finding may be important because one-carbon metabolism affects epigenetic programs, which may be associated with the pathogenesis of several obesity-related comorbidities, such as NAFLD [12]. An increase in the concentration of glycine and serine has been described as a striking feature in conditions of protein restriction [13]. In rodents, the increase is a result of increased biosynthesis and suggests a high demand for processes related to cell proliferation, the synthesis of other amino acids and the synthesis of lipid molecules such as phosphatidylserine and ceramides [13]. A limitation of our study is that the food intake or the use of medications and vitamins were not prospectively recorded and therefore could not be controlled for. A future study would need to take these factors into account as they may affect the metabolite signatures and especially micronutrient metabolism. Other differences between RYGB-treated patients with sustained weight loss or weight regain included the serum depletion of fatty acid metabolism (DAGs and TAGs), which are likely related to the patient’s weight rather than the change in intestinal anatomy.
By study design, patients in the RYGB-SWL group had a significantly lower body weight compared to both the control and RYGB-WR groups, while the average body weight of the control and RYGB-WR patients were not significantly different. This design offers the unique benefit of the comparing changes in patients who have had RYGB but have the same weight as the control patients (control vs. RYGB-WR). It therefore allows us to separate the changes that occur after RYGB that are merely due to weight loss from those specific to the change in intestinal anatomy. Since weight regain typically occurs several years after the initial procedure, a prospective, longitudinal study is impractical. However, our cross sectional study design has limitations. We performed a post-hoc power analysis to evaluate the achieved power of the study and to guide the design of future similar studies comparing patients with weight regain and those with sustained weight loss after RYGB. Although the power of the regression analyses that we performed (Table 2) was over 80% (for the observed R2, the sample size of the study and alpha 0.05), the power of the individual metabolite pairwise comparisons depended on the platform and the selected FDR cutoff. For the pairwise comparison of serum metabolites of patients with weight regain vs. patients with sustained weight loss, the power was significantly higher for HILIC-neg than for HILIC-pos, C8-pos and C18-neg. Thus, based on our data, future studies with the goals of achieving 80% power and detecting differences with FDR lower than 10% will need to include 70, 300 and 800 patients per group for techniques measuring HILIC-neg, HILIC-pos and C8-pos, respectively, while no differences can be detected on C18-neg (Supplementary Figure 1). This means that patients with sustained weight loss compared to those with weight regain differ more in metabolites that are sugars, organic acids, purines, pyrimidines, and other anionic polar metabolites, while essentially there are no differences in lipids, lipid mediators and non-polar metabolites. Stratification and analyses based on medical history and comorbidities will be even more challenging. In terms of patient population, our study differs significantly from prior metabolomics studies in that samples were collected much later after their surgery [5,14]. In part, this cannot be avoided, because patients with weight regain present relatively later, several years after the initial procedure. The advantage is that this should eliminate any changes that occur in the acute period 3–12 months after surgery.
Interestingly, the weight regain group appeared to have a trend towards larger than expected Hispanic population. Prior studies have reported that outcomes of RYGB are worse in African American [15,16] and Hispanic patients [16], and it may be worth conducting future studies with a larger population to confirm this finding and better delineate all possible factors that may leave these patients at higher risk of weight regain.
In conclusion, our study is an initial effort to identify the differences of serum metabolite signatures in human patients who have undergone Roux-en-Y gastric bypass surgery and experienced either sustained weight loss or weight regain. It can serve as a guide for future studies and can help design analyses with appropriate statistical power per metabolomic technique. Such studies will need to take into account the micronutrient status and vitamin consumption of the participants. In addition, it would be very helpful to further correlate the metabolite signatures with measures of insulin sensitivity, since insulin affects both amino acid and fatty acid metabolism. These analyses may further facilitate the understanding of the underlying mechanisms of the surgery by differentiating factors that are related to weight regain and potential worsening of glucose metabolism vs. those related to the altered anatomy itself. Eventually, metabolite profiling may help identify markers early after gastric bypass surgery that could differentiate the patients who will likely regain weight from those who will likely sustain weight loss.
Supplementary Material
Supplementary Figure 1. Post-hoc power analyses for the comparison between the two groups (RYGB-WR vs. RYGB-SWL) for the different metabolomic platforms that we used for serum metabolite profiling.
Acknowledgments
This study was supported by: R01-DK108642 (NS), Edward Mallinckrodt Jr. Foundation (NS), Diabetes Action Research and Education Foundation (NS). We would like to thank Hannah Whitley for administrative assistance.
Footnotes
Publisher's Disclaimer: This Author Accepted Manuscript is a PDF file of an unedited peer-reviewed manuscript that has been accepted for publication but has not been copyedited or corrected. The official version of record that is published in the journal is kept up to date and so may therefore differ from this version.
The authors report no conflict of interest
References
- 1.Ogden CL, Carroll MD, Fryar CD, Flegal KM. Prevalence of Obesity Among Adults and Youth: United States, 2011–2014 NCHS Data Brief. 2015:1–8; [PubMed] [Google Scholar]; Malik VS, Willett WC, Hu FB. Global obesity: trends, risk factors and policy implications Nat Rev Endocrinol. 2013;9:13–27. [DOI] [PubMed] [Google Scholar]
- 2.Riva P, Perretta S, Swanstrom L. Weight regain following RYGB can be effectively treated using a combination of endoscopic suturing and sclerotherapy Surg Endosc. 2017;31:1891–1895. [DOI] [PubMed] [Google Scholar]
- 3.Keith CJ, Gullick AA, Feng K, Richman J, Stahl R, Grams J. Predictive factors of weight regain following laparoscopic Roux-en-Y gastric bypass Surg Endosc. 2018;32:2232–2238; [DOI] [PubMed] [Google Scholar]; Velapati SR, Shah M, Kuchkuntla AR et al. Weight Regain After Bariatric Surgery: Prevalence, Etiology, and Treatment Curr Nutr Rep. 2018; [DOI] [PubMed] [Google Scholar]; Shantavasinkul PC, Omotosho P, Corsino L, Portenier D, Torquati A. Predictors of weight regain in patients who underwent Roux-en-Y gastric bypass surgery Surg Obes Relat Dis. 2016;12:1640–1645. [DOI] [PubMed] [Google Scholar]
- 4.Abu Dayyeh BK, Lautz DB, Thompson CC. Gastrojejunal stoma diameter predicts weight regain after Roux-en-Y gastric bypass Clin Gastroenterol Hepatol. 2011;9:228–233. [DOI] [PMC free article] [PubMed] [Google Scholar]
- 5.Tulipani S, Griffin J, Palau-Rodriguez M et al. Metabolomics-guided insights on bariatric surgery versus behavioral interventions for weight loss Obesity (Silver Spring). 2016;24:2451–2466. [DOI] [PubMed] [Google Scholar]
- 6.Laferrere B, Reilly D, Arias S et al. Differential Metabolic Impact of Gastric Bypass Surgery Versus Dietary Intervention in Obese Diabetic Subjects Despite Identical Weight Loss Science Translational Medicine. 2011;3:80re82–80re82. [DOI] [PMC free article] [PubMed] [Google Scholar]
- 7.Mutch DM, Fuhrmann JC, Rein D et al. Metabolite profiling identifies candidate markers reflecting the clinical adaptations associated with Roux-en-Y gastric bypass surgery PLoS One. 2009;4:e7905. [DOI] [PMC free article] [PubMed] [Google Scholar]
- 8.Narath SH, Mautner SI, Svehlikova E et al. An Untargeted Metabolomics Approach to Characterize Short-Term and Long-Term Metabolic Changes after Bariatric Surgery PLoS One. 2016;11:e0161425. [DOI] [PMC free article] [PubMed] [Google Scholar]
- 9.Ben-Zvi D, Meoli L, Abidi WM et al. Time-Dependent Molecular Responses Differ between Gastric Bypass and Dieting but Are Conserved Across Species Cell Metab. 2018;28:310–323.e316. [DOI] [PMC free article] [PubMed] [Google Scholar]
- 10.Esko T, Hirschhorn JN, Feldman HA et al. Metabolomic profiles as reliable biomarkers of dietary composition Am J Clin Nutr. 2017;105:547–554. [DOI] [PMC free article] [PubMed] [Google Scholar]
- 11.Faul F, Erdfelder E, Lang AG, Buchner A. G*Power 3: a flexible statistical power analysis program for the social, behavioral, and biomedical sciences Behav Res Methods. 2007;39:175–191. [DOI] [PubMed] [Google Scholar]
- 12.Hardy T, Mann DA. Epigenetics in liver disease: from biology to therapeutics Gut. 2016;65:1895–1905; [DOI] [PMC free article] [PubMed] [Google Scholar]; Mentch SJ, Locasale JW. One-carbon metabolism and epigenetics: understanding the specificity Ann N Y Acad Sci. 2016;1363:91–98; [DOI] [PMC free article] [PubMed] [Google Scholar]; Lee JH, Friso S, Choi SW. Epigenetic mechanisms underlying the link between non-alcoholic fatty liver diseases and nutrition Nutrients. 2014;6:3303–3325; [DOI] [PMC free article] [PubMed] [Google Scholar]; Anstee QM, Day CP. The genetics of NAFLD Nat Rev Gastroenterol Hepatol. 2013;10:645–655. [DOI] [PubMed] [Google Scholar]
- 13.Kalhan SC, Uppal SO, Moorman JL et al. Metabolic and genomic response to dietary isocaloric protein restriction in the rat J Biol Chem. 2011;286:5266–5277. [DOI] [PMC free article] [PubMed] [Google Scholar]
- 14.Samczuk P, Ciborowski M, Kretowski A. Application of Metabolomics to Study Effects of Bariatric Surgery J Diabetes Res. 2018;2018:6270875. [DOI] [PMC free article] [PubMed] [Google Scholar]
- 15.Istfan N, Anderson WA, Apovian C, Ruth M, Carmine B, Hess D. Racial differences in weight loss, hemoglobin A1C, and blood lipid profiles after Rouxen-Y gastric bypass surgery Surg Obes Relat Dis. 2016;12:1329–1336; [DOI] [PubMed] [Google Scholar]; Baldridge AS, Pacheco JA, Aufox SA et al. Factors Associated With Long-Term Weight Loss Following Bariatric Surgery Using 2 Methods for Repeated Measures Analysis Am J Epidemiol. 2015;182:235–243. [DOI] [PMC free article] [PubMed] [Google Scholar]
- 16.Coleman KJ, Huang YC, Hendee F, Watson HL, Casillas RA, Brookey J. Three-year weight outcomes from a bariatric surgery registry in a large integrated healthcare system Surg Obes Relat Dis. 2014;10:396–403. [DOI] [PubMed] [Google Scholar]
Associated Data
This section collects any data citations, data availability statements, or supplementary materials included in this article.
Supplementary Materials
Supplementary Figure 1. Post-hoc power analyses for the comparison between the two groups (RYGB-WR vs. RYGB-SWL) for the different metabolomic platforms that we used for serum metabolite profiling.