

Abstract
Purpose:
To evaluate the effects of metreleptin in patients with partial lipodystrophy (PL).
Methods:
Patients aged ≥6 months with PL, circulating leptin <12.0 ng/mL, and diabetes mellitus, insulin resistance, or hypertriglyceridemia received metreleptin doses (once or twice daily) titrated to a mean of 0.124 mg/kg/day. Changes from baseline to month 12 in glycated hemoglobin (HbA1c) and fasting serum triglycerides (TGs; coprimary endpoints), fasting plasma glucose (FPG), and liver volume were evaluated. Additional assessments included the proportions of patients achieving target decreases in HbA1c or fasting TGs at month 12, long-term treatment effects, and treatment-emergent adverse events (TEAEs).
Results:
Significant (p<0.05) reductions in HbA1c (−0.6%), fasting TGs (−20.8%), FPG (−1.2 mmol/L), and liver volume (−13.4%) were observed in the overall PL population at month 12. In a subgroup of patients with baseline HbA1c ≥6.5% or TGs ≥5.65 mmol/L, significant (p<0.05) reductions were seen in HbA1c (−0.9%), fasting TGs (−37.4%), FPG (−1.9 mmol/L), and liver volume (−12.4%). In this subgroup, 67.9% of patients had a ≥1% decrease in HbA1c or ≥30% decrease in fasting TGs, and 42.9% had a ≥2% decrease in HbA1c or ≥40% decrease in fasting TGs. Long-term treatment in this subgroup led to significant (p<0.05) reductions at months 12, 24, and 36 in HbA1c, fasting TGs, and FPG. Metreleptin was well tolerated with no unexpected safety signals. The most common TEAEs were abdominal pain, hypoglycemia, and nausea.
Conclusions:
In patients with PL, treatment with metreleptin was well tolerated and resulted in improvements in glycemic control, hypertriglyceridemia, and liver volume.
Keywords: diabetes mellitus, leptin, lipodystrophy, metreleptin, partial lipodystrophy
Introduction
Lipodystrophy syndromes are rare, heterogeneous, and often life-threatening disorders of body fat deficiency [1]. There are 4 main subtypes, defined by the etiology (genetic or acquired) and extent of adipose tissue loss (generalized or partial): congenital generalized lipodystrophy (CGL), familial partial lipodystrophy (FPLD), acquired generalized lipodystrophy (AGL), and acquired partial lipodystrophy (APL) [1,2].
FPLD encompasses a group of mostly autosomal dominant disorders characterized by fat loss in select areas of the body [1]. Subcutaneous fat loss in FPLD is often observed in the limbs and gluteal region and may be associated with accumulation of excess fat in the face, neck, and intra-abdominal region [1,3,4]. The severity and prognosis of FPLD can vary on the basis of subtype and the range of different organ manifestations [5,6]. FPLD is often missed clinically in men because many unaffected men have a muscular physique [7] or truncal obesity, and men with FPLD appear to have less severe metabolic complications than women with FPLD [8]. There are many known genetic subtypes of FPLD. In addition, patients without an identifiable single gene are classified as having FPLD type 1.
Some patients with partial lipodystrophy (PL) present without any family history and may have been classified as having APL. Many are later reclassified as AGL if progressive fat loss occurs, or as FPLD type 1 if additional family history suggests familial inheritance. These patients are different than those with the distinctive APL syndrome also known as Barraquer-Simons syndrome or cephalocaudal lipodystrophy syndrome, who tend to progressively lose fat in the face, neck, arms, and trunk and accumulate fat in the lower extremities [1]. The etiology of Barraquer-Simons syndrome is unknown, but it has been associated with autoimmune diseases.
In patients with lipodystrophy, the lack of normal fat depots for storage of excess calories can result in lipid overflow, causing ectopic fat deposition in the liver and muscle [9,10]. This leads to insulin resistance, diabetes mellitus, and hypertriglyceridemia [9]. In generalized lipodystrophy (GL), widespread deficiency of adipose tissue leads to low levels of circulating leptin, an adipokine that signals overall body energy availability [11,12]. Because the extent of fat loss is variable in PL, leptin levels and body fat percentages are often within normal ranges [13]. Metabolic abnormalities in patients with PL, including diabetes, insulin resistance, hypertriglyceridemia, and hepatic steatosis, may not be as severe as those in GL syndromes [2,6,14]. However, some patients with PL have metabolic abnormalities, morbidity, and mortality as severe as those with GL. Occasionally, distinguishing between PL and GL may be challenging if fat loss in PL is extensive and there is no obvious increased adiposity of the residual depots.
Metreleptin, a recombinant analogue of human leptin, is the only drug approved for the management of metabolic complications associated with lipodystrophy [1]. In the United States, metreleptin is approved specifically as an adjunct to diet as replacement therapy to treat complications of leptin deficiency in patients with generalized forms of lipodystrophy (CGL or AGL) [15]. In the European Union, metreleptin was approved in 2018 as an adjunct to diet as replacement therapy to treat complications of leptin deficiency in adults and children aged ≥2 years with confirmed CGL or AGL or in adults and children aged ≥12 years with confirmed FPLD or APL for whom standard treatments have not achieved adequate metabolic control [16].
An open-label pilot study at the National Institutes of Health (NIH) (NIH 991265 [ClinicalTrials.gov identifier: NCT00005905]) and its long-term extension (NIH 20010769 [NCT00025883]) were integrated to analyze the long-term efficacy and safety of metreleptin treatment in patients with GL or PL. Interim data from these studies have been previously reported [13,17–22], as well as the final data in patients with GL [23]. Here, we report the final data of the long-term efficacy and safety of metreleptin in patients with PL from the combined study, including subgroups with significant metabolic abnormalities.
Patients and methods
Study design and participants
Two prospective, non-randomized, open-label clinical trials of metreleptin in lipodystrophy were conducted. The pilot study was conducted from 2000 to 2003, and the long-term study was initiated in 2001 and continued through 2014. Because the studies used similar protocols and almost all patients in the pilot study continued into the long-term study, these are considered 1 study. Detailed study designs have been published previously [23]. Inclusion criteria were age ≥6 months with clinically significant PL, circulating leptin <12.0 ng/mL (female patients) or <8.0 ng/mL (male patients), and ≥1 of the following metabolic abnormalities: presence of diabetes according to the 1997 American Diabetes Association’s (ADA) criteria, fasting insulin >208.4 pmol/L, or fasting triglycerides (TGs) >2.26 mmol/L (>200 mg/dL).
Informed consent was obtained from all patients or their legal guardians. The study was conducted in accordance with the Declaration of Helsinki and Good Clinical Practice and was approved by the National Institute of Diabetes and Digestive and Kidney Diseases and the National Institute of Arthritis and Musculoskeletal and Skin Diseases institutional review boards.
All patients were admitted to the NIH Clinical Center for screening and baseline assessments. Patients or caregivers administered metreleptin subcutaneously. Metreleptin dosing was weight, sex, and age dependent (Table 1). Doses were titrated per protocol in the pilot study and were based on clinician judgment and clinical response in the long-term study.
Table 1.
Metreleptin dosing in the pilot and long-term studies
| Pilot study: NIH 991265 (ClinicalTrials.gov identifier: NCT00005905) | Long-term extension: NIH 20010769 (ClinicalTrials.gov identifier: NCT00025883) |
|---|---|
| • Weight-based dosing (sex and age dependent) • Total daily dose was divided into morning and evening administrations • Regimen ⚬ Month 1 (50% target dose) – 0.02 mg/kg/day in female patients aged ≥18 years – 0.015 mg/kg/day in female patients aged <18 years – 0.01 mg/kg in male patients ⚬ Month 2 (100% target dose) – 0.04 mg/kg/day in female patients aged ≥18 years – 0.03 mg/kg/day in female patients aged <18 years – 0.02 mg/kg in male patients ⚬ Months 3–4 (200% target dose) – 0.08 mg/kg/day in female patients aged ≥18 years – 0.06 mg/kg/day in female patients aged <18 years – 0.04 mg/kg in male patients |
• Weight-based dosing (sex and age dependent) • Total daily dose could be given once or twice daily • Regimen ⚬ Starting dose was initially the same as in the pilot study ⚬ Dose was later modified to – 0.08–0.10 mg/kg/day in female patients ≥5 years of age – 0.06 mg/kg/day in female patients aged <5 years and in all male patients • Dose escalations ⚬ Based on clinical response and clinician judgment ⚬ Could be initiated after the 6-month follow-up visit ⚬ Performed in increments of 0.02 mg/kg/day in female patients aged ≥10 years and 0.01 mg/kg/day in all other patients ⚬ Capped at 0.24 mg/kg/day ⚬ Dose was not to be increased above 0.12 mg/kg/day in patients aged >5 years without a clear decline in metabolic status without explanations for the change (eg, infection, nonadherence, dietary indiscretion) |
NIH National Institutes of Health
Vital signs and laboratory assessments were recorded at baseline and at scheduled postbaseline visits. All patients were followed up at the NIH. However, because of the wide geographic distribution of patients both within and outside the United States, some patients were unable to attend all protocol-scheduled visits. Therefore, patients could undergo clinical laboratory testing at their primary care physician’s office as needed. Visits were scheduled more frequently during the first year of treatment (every 4 months until 2003, then every 6 months after 2003) and then every 12 months after month 12.
The analysis populations are shown in Table 2. The safety analysis set comprised all enrolled patients who received ≥1 dose of study drug. The full analysis set included all patients in the safety analysis set who had measurements for either of the coprimary efficacy variables at baseline and at ≥1 postbaseline visit. The controlled concomitant medication full analysis set comprised all patients in the full analysis set with controlled concomitant medication use (ie, no change or a decrease in baseline concomitant medications [glucose-lowering or lipid-lowering therapies]) before month 12.
Table 2.
Study analysis populations
| Overall PL population | PL subgroup 1a | |
|---|---|---|
| Safety analysis setb | 41 | 31 |
| Full analysis setc | 40 | 30 |
| Controlled concomitant medication full analysis setd | 31 | 23 |
HbA1c glycated hemoglobin, PL partial lipodystrophy, TG triglycerides
Patients with significant metabolic abnormalities associated with their disease as evidenced by baseline HbA1c ≥6.5% or TGs ≥5.65 mmol/L
All enrolled patients who received ≥1 dose of study drug
All patients in the safety analysis set who had either of the coprimary efficacy variables measured at baseline and ≥1 postbaseline visit
All patients in the full analysis set with controlled concomitant medication use (ie, no change or a decrease in baseline antidiabetic or lipid-lowering therapies) before month 12
In addition to the overall PL population, all efficacy and safety endpoints were evaluated in a subgroup of patients with glycated hemoglobin (HbA1c) ≥6.5% or TGs ≥5.65 mmol/L (≥500 mg/dL) (PL subgroup 1). The coprimary efficacy endpoints were also evaluated in a subgroup of patients exceeding the ADA glycemic target recommendations with HbA1c ≥8.0% or TGs ≥5.65 mmol/L at baseline (PL subgroup 2).
Endpoints
The coprimary efficacy endpoints were the actual change from baseline in HbA1c at month 12 and the percent change from baseline in fasting serum TGs at month 12. Key secondary endpoints were the proportions of patients achieving target decreases in HbA1c or fasting serum TGs from baseline (HbA1c ≥1% or TGs ≥30%, HbA1c ≥1.5% or TGs ≥35%, and HbA1c ≥2% or TGs ≥40%) and actual and percent changes in fasting plasma glucose (FPG) from baseline at month 12. Additional secondary endpoints included the proportion of patients with baseline HbA1c ≥7% who achieved HbA1c <7% or a ≥1% decrease from baseline, the proportion of patients with baseline TGs ≥2.26 mmol/L who achieved TGs <2.26 mmol/L or a ≥30% decrease from baseline, and the proportion of patients with baseline TGs ≥5.65 mmol/L who achieved TGs <5.65 mmol/L or a ≥30% decrease from baseline. Changes from baseline to month 12 in liver volume (measured by magnetic resonance imaging), alanine aminotransferase (ALT), and aspartate aminotransferase (AST) were also evaluated.
Safety endpoints included metreleptin exposure, incidence of treatment-emergent adverse events (TEAEs), and changes from baseline in laboratory parameters. TEAEs were coded by preferred term using the Medical Dictionary for Regulatory Activities, version 19.0. Events possibly associated with hypersensitivity (to study medication or other substance) were evaluated and defined using a standardized Medical Dictionary for Regulatory Activities query for angioedema, anaphylactic reaction, anaphylactic/anaphylactoid shock conditions, and severe cutaneous reactions.
Statistical analyses
All efficacy endpoints were evaluated in the full analysis set, and safety endpoints were measured in the safety analysis set. Primary endpoints and key secondary endpoints were also analyzed in the controlled concomitant medication full analysis set. All analyses were conducted in the overall PL population and PL subgroup 1. The coprimary endpoints were also evaluated in PL subgroup 2 (full analysis set). Baseline demographics and disease characteristics, metreleptin exposure, changes from baseline in efficacy endpoints, and incidence of TEAEs were reported with descriptive statistics.
P-values for changes from baseline to month 12 were computed using paired t-tests (after visual inspection of data to check normal distribution) with a 1-sided α level of 0.025. The analysis visit interval from baseline to month 12 was day 365 (±65) days. Missing month-12 values were imputed using the last observation carried forward (LOCF) method with results only from ≥6 months postbaseline.
To evaluate changes over time, a mixed-effects model for repeated measures (MMRM) analysis assessed average levels of HbA1c, fasting TGs, and FPG across all assessment time points from baseline to months 12, 24, and 36; the overall MMRM analysis assessed the average levels across all visits. The number and percentage of patients achieving target decreases in HbA1c and fasting TGs were evaluated with 2-sided exact binomial 95% confidence intervals.
Results
Patient disposition and baseline demographics
A total of 41 patients with a PL diagnosis were enrolled, including 31 patients with HbA1c ≥6.5% or TGs ≥5.65 mmol/L at baseline who comprised PL subgroup 1 (Table 2) and 22 patients with HbA1c ≥8.0% or TGs ≥5.65 mmol/L at baseline who comprised PL subgroup 2. Overall, 85.4% of patients were initially classified as having FPLD and 14.6% as having APL (none with Barraquer-Simons syndrome). During the study period, disease categorization became more precise (Table 3). Over the 14-year study period, 15 patients (36.6%) in the overall PL population and 11 (35.5%) in PL subgroup 1 discontinued the study. Reasons for discontinuation among the overall PL population and PL subgroup 1, respectively, included nonadherence (n=6 [14.6%] and n=6 [19.4%]), lack of efficacy (n=5 [12.2%] and n=3 [9.7%]), transfer to another metreleptin treatment program (n=2 [4.9%] and n=1 [3.2%]), and death (n=1 [2.4%] and n=1 [3.2%]).
Table 3.
Baseline demographics and patient characteristics in the safety analysis set for PL subgroups and overall population
| Overall PL population (N = 41) | PL subgroup 1a(n = 31) | PL subgroup 2b (n = 22) | |
|---|---|---|---|
| Sex, n (%) | |||
| Female | 40 (97.6) | 30 (96.8) | 21 (95.5) |
| Male | 1 (2.4) | 1 (3.2) | 1 (4.5) |
| Race, n (%) | |||
| White | 36 (87.8) | 26 (83.9) | 18 (81.8) |
| Black | 0 | 0 | 0 |
| Asian | 1 (2.4) | 1 (3.2) | 0 |
| Native American | 0 | 0 | 0 |
| Hispanic | 2 (4.9) | 2 (6.5) | 2 (9.1) |
| Other | 2 (4.9) | 2 (6.5) | 2 (9.1) |
| Age, years, median (min, max) | 34.0 (10.0, 64.0) | 38.0 (15.0, 64.0) | 35.5 (15.0, 64.0) |
| Lipodystrophy subtype, n (%) | |||
| Acquiredc | 6 (14.6) | 4 (12.9) | 4 (18.2) |
| Familial | 35 (85.4) | 27 (87.1) | 18 (81.8) |
| Medical history, n (%) | |||
| Hypertriglyceridemia | 38 (92.7) | 29 (93.5) | 21 (95.5) |
| Diabetes mellitusd | 32 (78.1) | 26 (83.9) | 18 (81.8) |
| Hypertension | 21 (51.2) | 17 (54.8) | 12 (54.5) |
| Hepatic steatosise | 14 (34.1) | 12 (38.7) | 9 (40.9) |
| Pancreatitis | 15 (36.5) | 12 (38.7) | 10 (45.5) |
| NASH or steatohepatitis | 13 (31.7) | 8 (25.8) | 6 (27.3) |
| Polycystic ovary | 11 (26.8) | 7 (22.6) | 5 (22.7) |
| Fasting leptin, ng/mL, mean (SD) | 6.4 (3.5) | 6.7 (3.7) | 6.5 (3.9) |
| HbA1c, %, mean (SD) | 8.0 (2.2) | 8.8 (1.9) | 9.4 (1.9) |
| Fasting TGs, mmol/L, mean (SD) mg/dL, mean (SD) | 12.0 (22.9) | 14.8 (25.7) | 19.6 (29.4) |
| 1063.2 (2024.3) | 1314.5 (2278.1) | 1735.0 (2602.1) | |
| FPG, mmol/L, mean (SD) mg/dL, mean (SD) | 8.7 (4.4) | 9.9 (4.3) | 10.8 (4.4) |
| 157.0 (78.3) | 178.5 (78.1) | 194.2 (79.6) | |
| Liver volume, mL, mean (SD)f,g | 2624.6 (936.2) | 2411.7 (731.9) | NA |
| (n = 9) | (n = 8) | ||
| ALT, U/L, mean (SD) | 54.0 (57.5) | 38.6 (27.8) | 39.3 (31.9) |
| ALT above ULN, n (%) | 14 (34.1) | 9 (29.0) | 6 (27.3) |
| AST, U/L, mean (SD) | 37.7 (33.3) | 31.3 (19.6) | 32.3 (22.0) |
| AST above ULN, n (%) | 10 (24.4) | 7 (22.6) | 6 (27.3) |
| On glucose-lowering medications, n (%) | 37 (90.2) | 30 (96.8) | 21 (95.5) |
| Insulin alone | 6 (14.6) | 6 (19.4) | 6 (27.3) |
| Insulin plus oral agent | 13 (31.7) | 10 (32.3) | 7 (31.8) |
| Oral agent only | 15 (36.6) | 12 (38.7) | 8 (36.4) |
| On lipid-lowering medications, n (%) | 34 (82.9) | 26 (83.9) | 19 (86.4) |
| Fibrates | 21 (51.2) | 17 (54.8) | 12 (54.5) |
| Statins | 13 (31.7) | 12 (38.7) | 8 (36.4) |
| Other lipid-lowering agents | 19 (46.3) | 15 (48.4) | 10 (45.5) |
ALT alanine aminotransferase, AST aspartate aminotransferase, BL baseline, FPG fasting plasma glucose, HbA1c glycated hemoglobin, NA not applicable, NASH nonalcoholic steatohepatitis, PL partial lipodystrophy, SD standard deviation, TG triglycerides, ULN upper limit of normal
HbA1c ≥6.5% or TGs ≥5.65 mmol/L at BL
HbA1c ≥8.0% or TGs ≥5.65 mmol/L at BL
Subsequently, 2 patients classified as having acquired PL were reclassified as having acquired generalized lipodystrophy on the basis of progressive fat loss. Another patient classified as having acquired PL was later found to have a recessive mutation and therefore had familial PL, and 2 additional patients were likely to have familial PL with an unknown genetic mutation. These reclassifications are unlikely to have meaningfully affected the analyses. No patient classified as having acquired PL had Barraquer-Simons syndrome.
Based on medical history documentation
By clinical assessment
Full analysis set
Measured by magnetic resonance imaging
Table 3 shows baseline demographics for the overall PL population and PL subgroups 1 and 2. Almost all patients were female, most were white, and the median age in the overall PL population was 34 years. Most patients had hypertriglyceridemia or diabetes. Mean (standard deviation [SD]) baseline fasting leptin levels in the overall PL population, PL subgroup 1, and PL subgroup 2 were 6.4 (3.5), 6.7 (3.7), and 6.5 (3.9) ng/mL, respectively. Individual patient listings of HbA1c, TGs, and FPG at baseline and month 12 for the overall PL population are included in the Online Resource.
The mean (SD) overall duration of metreleptin exposure was 48.1 (44.1) months in the overall PL population and 47.5 (47.1) months in PL subgroup 1. The mean (SD) weighted average daily dose of metreleptin in the overall PL population and PL subgroup 1 was 0.123 (0.030) mg/kg/day (equivalent to 8.4 [2.5] mg/day) and 0.124 (0.030) mg/kg/day (equivalent to 8.4 [2.4] mg/day), respectively.
Efficacy
In the overall PL population full analysis set, metreleptin treatment led to a 0.6% mean actual reduction in HbA1c from 7.9% at baseline to 7.4% at month 12/LOCF (p=0.005; Fig. 1a). Because of an extreme outlying result for 1 patient (later withdrawn from the study due to nonadherence), fasting TG results showed a small mean percent increase between baseline and month 12/LOCF. When calculated without the outlier, fasting TGs decreased by 20.8%, from a mean (median) of 12.5 (4.6) mmol/L at baseline to 5.4 (3.5) mmol/L at month 12/LOCF (p=0.013; Fig. 1b). Mean FPG decreased by 6.1%, from 8.8 mmol/L at baseline to 7.5 mmol/L at month 12/LOCF (p=0.219; Fig. 1c). Although reductions from baseline were observed for HbA1c, fasting TGs, and FPG in the controlled concomitant medication full analysis set, these were not statistically significant (Fig. 1a, b, c).
Fig. 1.


Mean values at baseline and month 12/LOCF in a HbA1c, b fasting TGs, c FPG, and d liver volume in the overall PL population, and mean changes in e HbA1c, f fasting TGs, g FPG, and h liver volume among patients in PL subgroup 1. a Mean values for HbA1c were 7.9% at baseline and 7.4% at month 12 in the FAS and 7.5% at baseline and 7.2% at month 12 in the CFAS. b Mean (median) values for fasting TGs were 12.5 (4.6) mmol/L at baseline and 5.4 (3.5) mmol/L at month 12 in the FAS and 11.0 (4.7) mmol/L at baseline and 5.1 (3.9) mmol/L at month 12 in the CFAS. c Mean FPG was 8.8 mmol/L at baseline and 7.5 mmol/L at month 12 in the FAS and 8.0 mmol/L at baseline and 7.4 mmol/L at month 12 in the CFAS. d Mean liver volume was 2624.6 mL at baseline and 2169.9 mL at month 12. e Mean values for HbA1c were 8.7% at baseline and 7.9% at month 12 in the FAS and 8.2% at baseline and 7.6% at month 12 in the CFAS. f Mean (median) values for fasting TGs were 15.7 (5.7) mmol/L at baseline and 6.0 (3.4) mmol/L at month 12 in the FAS and 12.6 (5.7) mmol/L at baseline and 5.4 (3.9) mmol/L at month 12 in the CFAS. g Mean FPG was 10.0 mmol/L at baseline and 8.1 mmol/L at month 12 in the FAS and 9.2 mmol/L at baseline and 8.1 mmol/L at month 12 in the CFAS. h Mean liver volume was 2411.7 mL at baseline and 2013.3 mL at month 12. Error bars show the standard deviation. One patient was withdrawn from the study for nonadherence to study drug administration and had a >1000% increase from baseline to month 12 in fasting TG level and was thus excluded from the fasting TG analysis. *p=0.005; †p=0.013; ‡p=0.004; §p<0.001; ║p=0.008; #p=0.023; ‡**p=0.011. Δ change from BL, BL baseline, CFAS controlled concomitant medication full analysis set, FAS full analysis set, FPG fasting plasma glucose, HbA1c glycated hemoglobin, LOCF last observation carried forward, PL partial lipodystrophy, TG triglycerides
In PL subgroup 1, treatment with metreleptin led to clinically meaningful and statistically significant reductions in HbA1c in the full analysis set, from 8.7% at baseline to 7.9% at month 12/LOCF (mean actual reduction, 0.9%; p<0.001; Fig. 1e). Fasting TGs decreased by 37.4% (p<0.001) in the full analysis set, from a mean (median) of 15.7 (5.7) mmol/L at baseline to 6.0 (3.4) mmol/L at month 12/LOCF (Fig. 1f). Mean FPG decreased by 13.2%, from 10.0 mmol/L at baseline to 8.1 mmol/L at month 12/LOCF (p=0.023; Fig. 1g). Results in the controlled concomitant medication full analysis set were very similar to those in the full analysis set, with an actual decrease in HbA1c of 0.7%, from 8.2% at baseline to 7.6% at month 12/LOCF (p=0.008; Fig. 1e). Mean (median) TG concentrations in the controlled concomitant medication full analysis set were reduced by 34%, from 12.6 (5.7) mmol/L at baseline to 5.4 (3.9) mmol/L at month 12/LOCF (p<0.001; Fig. 1f). FPG did not significantly change (p=0.6; Fig 1g).
Analysis of the coprimary endpoints in patients with HbA1c ≥8.0% or TGs ≥5.65 mmol/L (PL subgroup 2) found significant reductions in HbA1c and fasting TGs after 12 months of metreleptin therapy. The mean actual decrease in HbA1c in this subgroup was 1.0%, from 9.4% at baseline to 8.4% at month 12/LOCF (p=0.003). The mean percent decrease in fasting TGs was 42.8% (p<0.001), from 20.4 mmol/L at baseline to 7.1 mmol/L at month 12/LOCF.
MMRM analysis of metreleptin effects across all time points in the overall PL population showed a mean actual decrease in HbA1c of 0.4% overall (p=0.007; Fig. 2a); reductions were statistically significant at month 12 (0.5%; p=0.024) but not at months 24 (0.7%) and 36 (0.6%). Percent changes in fasting TGs at months 12, 24, and 36 were also not statistically significant (−16.7%, −9.4%, and 4.4%, respectively), with an overall decrease of 8.3% (p=0.131; Fig. 2b). Least-squares mean changes in FPG were statistically significant at months 12, 24, and 36 (−1.2, −1.9, and −3.0 mmol/L, respectively; p<0.05 for all), with an overall decrease of 0.8 mmol/L (p=0.002; Fig. 2c).
Fig. 2.
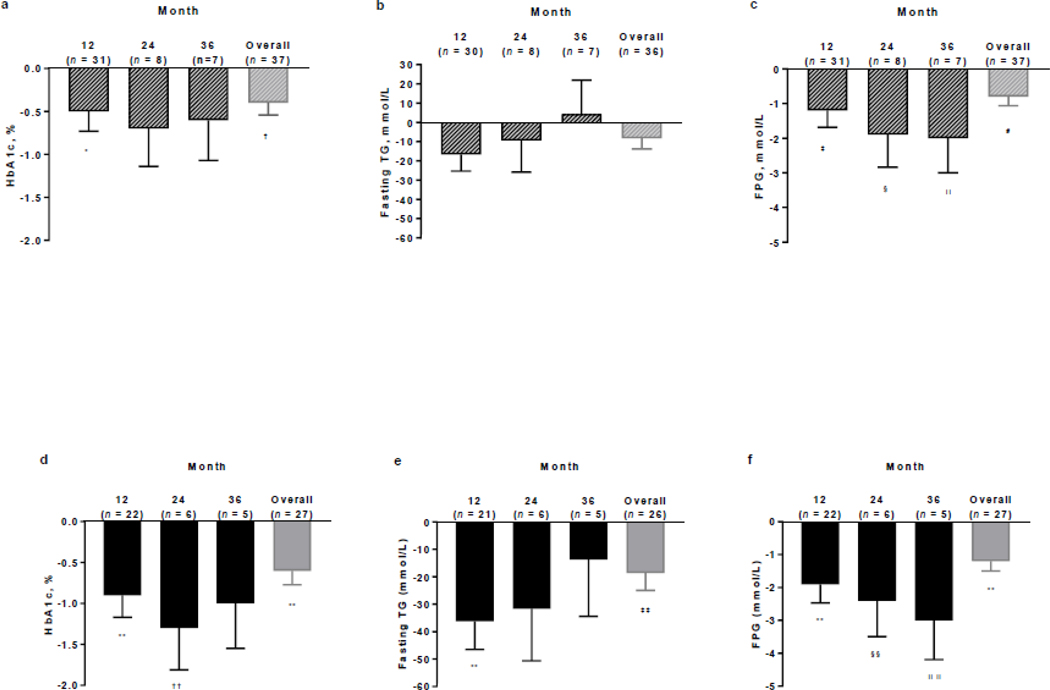
MMRM analysis of the least squares mean change from baseline at months 12, 24, and 36 and the overall MMRM analysis in a HbA1c, b fasting TGs, and c FPG in the FAS of the overall PL population, and d HbA1c, e fasting TGs, and f FPG in the FAS of PL subgroup 1. Error bars show the standard error of the mean. One patient was withdrawn from the study for nonadherence to study drug administration and had a >1000% increase from baseline to month 12 in TG levels and was thus excluded from the fasting TG analysis. *p=0.024; †p=0.007; ‡p=0.014; §p=0.044; ║p=0.049; #p=0.002; **p<0.001; ††p=0.009; ‡‡p=0.004; §§p=0.027; ║║p=0.011. FAS full analysis set, FPG fasting plasma glucose, HbA1c glycated hemoglobin, MMRM mixed-effects model for repeated measures, PL partial lipodystrophy, TG triglycerides
In PL subgroup 1, MMRM analysis showed that long-term treatment with metreleptin led to clinically meaningful and statistically significant reductions in all metabolic parameters over time. The mean actual decrease in HbA1c was 0.9%, 1.3%, and 1.0% at months 12, 24, and 36, respectively, with an overall reduction of 0.6% (p<0.001; Fig. 2d). Fasting TG reductions were 36.2%, 31.7%, and 13.7% at months 12, 24, and 36, respectively, with an overall decrease of 18.6% (p=0.004; Fig. 2e). FPG decreased by 1.9, 2.4, and 3.0 mmol/L at months 12, 24, and 36, respectively, with an overall reduction of 1.2 mmol/L (p<0.001; Fig. 2f).
In the overall PL population full analysis set, 51.4% of patients achieved a ≥1% actual decrease in HbA1c or ≥30% decrease in TGs at month 12/LOCF, and 32.4% achieved a target decrease of ≥2% in HbA1c or ≥40% in TGs (Fig. 3a); corresponding values in the controlled concomitant medication full analysis set were 41.4% and 20.7%, respectively. Higher proportions of patients in the PL subgroup 1 full analysis set achieved target decreases in HbA1c or fasting TGs (Fig. 3b), with 67.9% of patients achieving a ≥1% actual decrease in HbA1c or ≥30% decrease in TGs at month 12/LOCF and 42.9% achieving the highest target decreases of ≥2% in HbA1c or ≥40% in TGs; corresponding values in the controlled concomitant medication full analysis set were 54.5% and 27.3%, respectively.
Fig. 3.
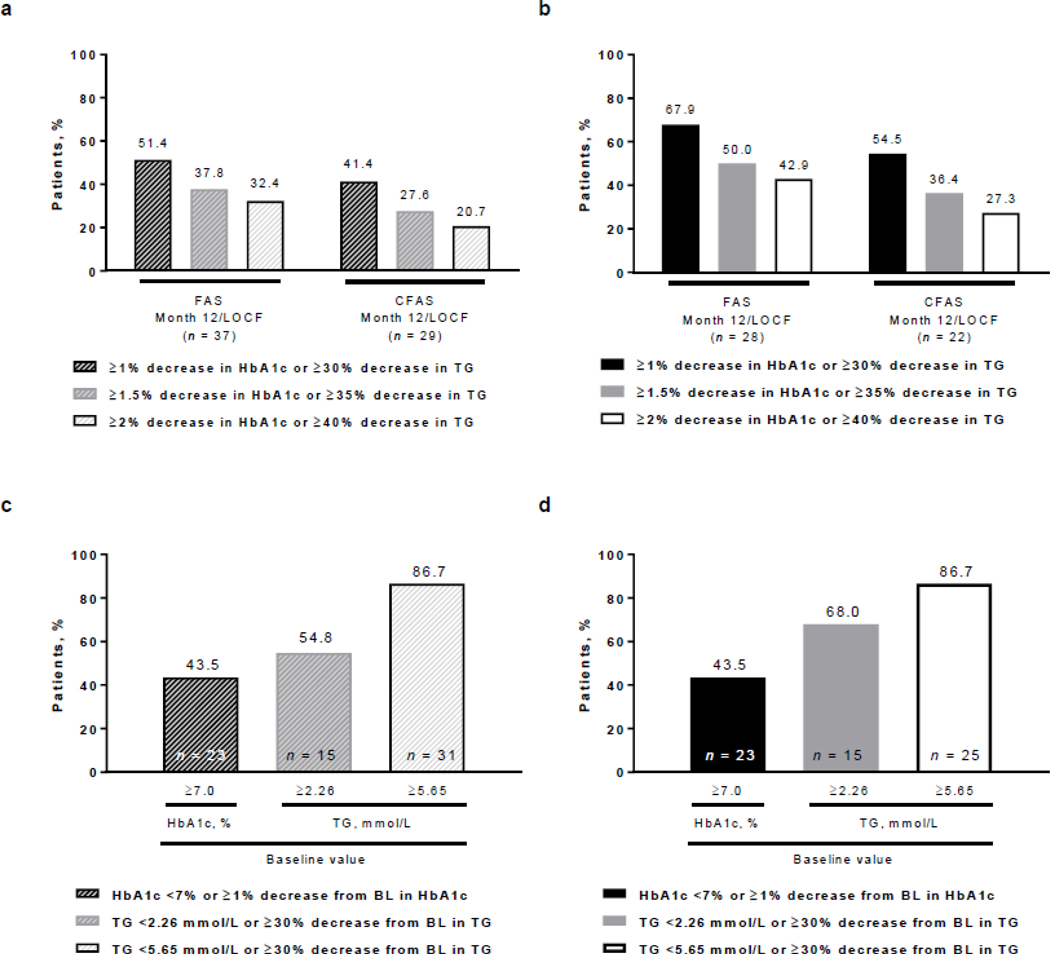
Proportions of patients achieving target decreases in HbA1c or fasting TGs in a the overall PL population and b PL subgroup 1 in the FAS and CFAS at month 12/LOCF, and by high baseline HbA1c or fasting TG levels achieving target decreases in HbA1c or fasting TGs in c the overall PL population and d PL subgroup 1. BL baseline, CFAS controlled concomitant medication full analysis set, FAS full analysis set, HbA1c glycated hemoglobin, LOCF last observation carried forward, PL partial lipodystrophy, TG triglycerides
Among patients with HbA1c ≥7% at baseline (n=23), 21.7% had a reduction in HbA1c to <7% (not shown) and 43.5% had a reduction in HbA1c to <7% or a decrease of ≥1% at month 12/LOCF (Fig. 3c, d). Among patients with TGs ≥5.65 mmol/L at baseline (n=31), 6.7% achieved TGs <5.65 mmol/L (not shown) but 86.7% achieved TGs <5.65 mmol/L or ≥30% decrease from baseline at month 12/LOCF (Fig. 3c, d). Among patients with baseline TGs ≥2.26 mmol/L in the overall PL population (n=15) and PL subgroup 1 (n=15), 54.8% and 68.0%, respectively, achieved TGs <2.26 mmol/L or ≥30% decrease from baseline at month 12/LOCF (Fig 3c, d).
Liver volume was significantly reduced at month 12 in the overall PL population and PL subgroup 1 (Fig. 1d, h). Among 9 patients in the overall PL population with liver volume assessments, mean percent change was −13.4% (p=0.004), from a mean baseline liver volume of 2624.6 mL to 2169.0 mL at month 12 (Fig. 1d). In PL subgroup 1 (n=8), mean reduction in liver volume was 12.4% (p=0.011), from 2411.7 mL at baseline to 2013.3 mL at month 12 (Fig. 1h).
Changes in liver function tests were not statistically significant. In the overall PL population and PL subgroup 1, mean changes in ALT from baseline to month 12 were −0.4 U/L (p=0.941) and −5.0 U/L (p=0.070), respectively, from mean baseline values of 54.8 U/L and 39.2 U/L, respectively, to 59.9 U/L and 34.5 U/L at month 12. Mean changes in AST in the overall PL population and PL subgroup 1 were −5.1 U/L (p=0.198) and −6.0 U/L (p=0.077), respectively, from mean baseline levels of 38.4 U/L and 31.9 U/L, respectively, to 35.8 U/L and 25.8 U/L at month 12.
None of the 19 patients in the overall PL population who received insulin at baseline were able to discontinue it after starting metreleptin. One patient who received oral glucose-lowering medications at baseline (n=1/28 [3.6%]) and another who received lipid-lowering medications at baseline (n=1/34 [2.9%]) were able to discontinue these medications with metreleptin treatment.
Safety
Metreleptin was generally well tolerated. A total of 35 patients (85.4%) in the overall PL population and 27 (87.1%) in PL subgroup 1 experienced ≥1 TEAE (Table 4). There was no difference in safety signals between PL subgroup 1 and the overall PL population. In the overall PL population, drug-related TEAEs were reported in 8 patients. Serious AEs (SAEs) were reported in 10 patients; no SAEs were drug related. There was 1 death due to hypoxic ischemic encephalopathy that was unrelated to study treatment.
Table 4.
Summary of adverse events in the safety analysis set
| Adverse event, n (%) | Overall PL population (N = 41) |
PL subgroup 1 (n = 31) |
|---|---|---|
| ≥1 TEAE | 35 (85.4) | 27 (87.1) |
| Drug-related TEAE | 8 (19.5) | 7 (22.6) |
| Severe TEAE | 16 (39.0) | 13 (41.9) |
| Drug-related severe TEAE | 0 | 0 |
| Treatment-emergent SAE | 10 (24.4) | 7 (22.6) |
| Drug-related treatment-emergent SAE | 0 | 0 |
| TEAE leading to discontinuation | 1 (2.4) | 1 (3.2) |
| On-study deaths | 1 (2.4) | 1 (3.2) |
| TEAE by preferred term (≥5% incidence)a | ||
| Abdominal pain | 6 (14.6) | 6 (19.4) |
| Hypoglycemia | 7 (17.1) | 6 (19.4) |
| Nausea | 6 (14.6) | 5 (16.1) |
| Fatigue | 3 (7.3) | 3 (9.7) |
| Alopecia | 3 (7.3) | 3 (9.7) |
| Constipation | 3 (7.3) | 3 (9.7) |
| Arthralgia | 3 (7.3) | 2 (6.5) |
| Back pain | 2 (4.9) | 2 (6.5) |
| Pain in extremity | 3 (7.3) | 2 (6.5) |
| Weight decrease | 2 (4.9) | 2 (6.5) |
PL partial lipodystrophy; SAE serious adverse event; TEAE treatment-emergent adverse event
Medical Dictionary for Regulatory Activities, version 19.0
Six patients (14.6%) experienced a possible hypersensitivity event. Potential hypersensitivity events were edema and erythema (n=2 each) and cough, anaphylactic reaction, rash, and urticaria (n=1 each). All possible hypersensitivity events were mild-to-moderate intensity and unrelated to study treatment; none were SAEs or led to treatment discontinuation. Seven patients experienced hypoglycemia events, which were treatment related in 3 patients; all patients who experienced events were taking glucose-lowering medications (insulin with or without oral treatment). All hypoglycemia events were mild to moderate in severity, and none led to treatment discontinuation.
Five patients developed a neoplasm while on study; none were related to study treatment. Adrenal adenoma, anogenital warts, benign neoplasm of the thyroid, and benign ovarian germ cell teratoma occurred in 1 patient each, and 1 patient with a history of schwannoma before leptin therapy developed both a schwannoma and a nervous system neoplasm (sciatic tumor). The schwannoma and benign ovarian germ cell teratoma were reported as SAEs.
Two patients (4.9%) experienced a newly diagnosed hepatic disorder. Both were steatohepatitis, assessed as mild and unrelated to study treatment, and did not lead to treatment withdrawal. One of these patients had hepatomegaly at baseline, and ALT and AST were in the normal range at baseline for both patients. Two patients (4.9%) experienced pancreatitis. In one of these patients who had a history of pancreatitis and hypertriglyceridemia, pancreatitis was related to suspected nonadherence to metreleptin treatment. In the other patient, pancreatitis was due to abrupt interruption of metreleptin treatment. Both pancreatitis events were of severe intensity and unrelated to the study drug, per investigator assessment.
No autoimmune disorders were reported. Serious infections, including cellulitis, streptococcal infection, pharyngitis, and osteomyelitis, were reported in 3 patients (7.3%) and were unrelated to study treatment. Three patients (7.3%) experienced injection-site reactions of moderate intensity that were nonserious and did not lead to treatment withdrawal.
Discussion
In this study, patients with PL, serum leptin <12.0 ng/mL (or lower depending on age and sex), and ≥1 metabolic abnormality showed statistically significant reductions in HbA1c and fasting TGs from baseline to month 12 with metreleptin treatment in the full analysis set. Because these improvements were not statistically significant when analyzed in the controlled concomitant medication full analysis set, it is unclear whether these improvements in the overall PL population could be attributed to metreleptin therapy. However, in a subgroup of patients with HbA1c ≥6.5% or TGs ≥5.65 mmol/L at baseline (PL subgroup 1), significant improvements in HbA1c, fasting TGs, and FPG were seen in the full analysis set, and improvements in HbA1c and fasting TGs were also statistically significant and clinically meaningful in the controlled concomitant medication full analysis set. Thus, it can be concluded that metreleptin treatment led to meaningful improvements in this subgroup. Furthermore, statistically significant reductions in HbA1c and fasting TGs—the coprimary endpoints of the study—were observed in the subgroup of patients with more severe metabolic abnormalities (HbA1c ≥8.0% or TGs ≥5.65 mmol/L at baseline; PL subgroup 2) in the full analysis set.
MMRM analysis showed significant improvements from baseline in HbA1c, fasting TGs, and FPG across visits over the 14-year study period in PL subgroup 1. However, in the overall PL population, only improvements in FPG and the overall and month-12 reductions in HbA1c were statistically significant. High proportions of patients in the overall PL population and PL subgroup 1 achieved target decreases in HbA1c or fasting TGs at month 12/LOCF, and significant decreases in liver volume were observed in the subsets of patients who were assessed in the overall PL population and PL subgroup 1.
These results are generally consistent with metreleptin studies in other small cohorts of patients with PL, but results cannot be directly compared because of differences in inclusion criteria. The earliest description of the efficacy of metreleptin in patients with lipodystrophy included 1 patient with FPLD and reported benefit in this patient [24]. Another study showed that HbA1c, TGs, and liver enzymes significantly decreased after 1 year of metreleptin therapy in 9 patients with FPLD, diabetes, and fasting leptin ≤6 ng/mL [25]. A study in patients with the Dunnigan variety of FPLD showed that median fasting TGs significantly decreased in patients with moderate or severe hypoleptinemia (all had serum leptin <7 ng/mL) after 6 months of metreleptin treatment, but HbA1c and FPG did not significantly improve [26]. However, baseline HbA1c, fasting TGs, and FPG were lower than those in the present study, and greater decreases in HbA1c, TGs, and FPG have been observed in previous studies of patients with PL who had more severe baseline metabolic abnormalities than those in the present study [27].
While improvements in metabolic parameters in response to metreleptin treatment in patients with PL were observed, reductions in HbA1c and FPG appeared to be of a lower magnitude than in patients with GL. When data from the NIH study of patients with GL are compared with those from PL subgroup 1 in the full analysis set of the present study, the actual change in HbA1c from baseline to month 12/LOCF was −2.2% in patients with GL and −0.9% in PL subgroup 1 [23]. Mean change in FPG was −3.0 mmol/L in patients with GL and −1.8 mmol/L in PL subgroup 1. In comparison, the improvement in TGs was greater in patients with PL versus those with GL, with a mean decrease of 37.4% versus 32.1%. In patients with PL and GL, higher baseline elevations in HbA1c and fasting TGs were associated with greater response to metreleptin treatment.
Metreleptin was generally well tolerated in patients with PL, with no unexpected safety signals over the 14-year study period. Most events were mild-to-moderate severity, and the most common TEAEs were abdominal pain, hypoglycemia, and nausea. TEAEs were generally consistent with those observed in the NIH study of patients with GL [23], although the incidence among patients with PL tended to be lower. There were no reports of lymphoma in patients with PL in the present study, which is noteworthy considering that the US label for metreleptin has a boxed warning that T-cell lymphoma has been reported in patients with AGL, even in those not treated with metreleptin [15]. The 1 death in the PL population in the present study due to hypoxic ischemic encephalopathy was not related to study treatment.
A limitation of this study is the relatively small sample size. This was expected because of the rarity of PL; most forms of FPLD have an estimated prevalence of 1 in 1,000,000 people [28,29]. Despite the small study population and the number of study withdrawals, the MMRM analysis allowed the use of all available information for each patient to estimate treatment effects in cases of missing data, which complemented the single imputation method of LOCF. Another potential limitation is that almost all patients with PL were female, which likely reflects underdiagnosis or mild metabolic abnormalities that did not meet the inclusion criteria in males.
In conclusion, this study shows that metreleptin appears to be beneficial in the treatment of PL, especially for patients with more severe metabolic disease, and is tolerable in long-term use.
Supplementary Material
Acknowledgements:
All named authors meet the International Committee of Medical Journal Editors (ICMJE) criteria for authorship for this manuscript and take responsibility for the integrity of the work as a whole. Aegerion provided funding for medical writing and editing support in the development of this article; Jennifer L. Giel, PhD, and Raewyn M. Poole, MSc, of inScience Communications, Springer Healthcare (Philadelphia, PA, USA), on the basis of input from authors, wrote the first draft and revised subsequent drafts of the manuscript, and David Boffa, on behalf of, and Adrienne Schreiber of inScience Communications, Springer Healthcare (Philadelphia, PA, USA) copyedited and styled the manuscript per journal requirements. Aegerion Pharmaceuticals reviewed the manuscript drafts and provided feedback to the authors. The authors had full editorial control of the manuscript and provided their final approval of all content. Jean-Karl Sirois provided statistical analyses on behalf of Veristat LLC (Montreal, Canada), which was funded by Aegerion Pharmaceuticals, Inc. The authors acknowledge the services of the Clinical Core Laboratory of the National Institute of Diabetes and Digestive and Kidney Diseases, National Institutes of Health for measurement of leptin levels; this work was not funded by Aegerion Pharmaceuticals.
Funding: This work was supported by the intramural research program of the National Institute of Diabetes and Digestive and Kidney Diseases. E.A.O. is partially supported by UM Lipodystrophy Fund gifted by the Sopha family and White Point Foundation of Turkey. D.B.S. is supported by the Wellcome Trust (WT 107064), the MRC Metabolic Disease Unit (MRC_MC_UU_12012.1), and The National Institute for Health Research (NIHR) Cambridge Biomedical Research Centre and NIHR Rare Disease Translational Research Collaboration.
Footnotes
Compliance with ethical standards
Conflict of interest: E.A.O. has served as consultant to Aegerion Pharmaceuticals, Akcea Therapeutics, AstraZeneca, Regeneron Therapeutics, and Thera Therapeutics; has received grant support from Aegerion Pharmaceuticals, Akcea Therapeutics, AstraZeneca, Gemphire Therapeutics, GIDynamics, and Ionis Pharmaceuticals; and has received nonmaterial support from Aegerion Pharmaceuticals and Boehringer Ingelheim. D.A.V. and D.B.S. have served as consultants to Aegerion Pharmaceuticals. A.L. and T.S. are former employees and G.F. is a current employee of Aegerion Pharmaceuticals. E.C., P.G., and R.B. report no conflicts of interest.
Ethical approval: The study was conducted in accordance with the Declaration of Helsinki and Good Clinical Practice and was approved by the National Institute of Diabetes and Digestive and Kidney Diseases and the National Institute of Arthritis and Musculoskeletal and Skin Diseases institutional review boards.
Informed consent: Informed consent was obtained from all patients or their legal guardians.
References
- 1.Brown RJ, Araujo-Vilar D, Cheung PT, Dunger D, Garg A, Jack M, Mungai L, Oral EA, Patni N, Rother KI, von Schnurbein J, Sorkina E, Stanley T, Vigouroux C, Wabitsch M, Williams R, Yorifuji T: The diagnosis and management of lipodystrophy syndromes: a multi-society practice guideline. J. Clin. Endocrinol. Metab 101(12), 4500–4511 (2016). doi: 10.1210/jc.2016-2466 [DOI] [PMC free article] [PubMed] [Google Scholar]
- 2.Handelsman Y, Oral EA, Bloomgarden ZT, Brown RJ, Chan JL, Einhorn D, Garber AJ, Garg A, Garvey WT, Grunberger G, Henry RR, Lavin N, Tapiador CD, Weyer C: The clinical approach to the detection of lipodystrophy – an AACE consensus statement. Endocr. Pract 19(1), 107–116 (2013). [DOI] [PMC free article] [PubMed] [Google Scholar]
- 3.Garg A: Acquired and inherited lipodystrophies. New. Engl. J. Med 350(12), 1220–1234 (2004). doi: 10.1056/NEJMra025261 [DOI] [PubMed] [Google Scholar]
- 4.Araújo-Vilar D, Santini F: Diagnosis and treatment of lipodystrophy: a step-by-step approach. J. Endocrinol. Invest, doi: 10.1007/s40618-40018-40887-z. [Epub ahead of print] (2018. April 27). doi:10.1007/s40618–018-0887-z [DOI] [PMC free article] [PubMed] [Google Scholar]
- 5.Guillín-Amarelle C, Sánchez-Iglesias S, Castro-Pais A, Rodriguez-Cañete L, Ordóñez-Mayán L, Pazos M, González-Méndez B, Rodríguez-García S, Casanueva FF, Fernández-Marmiesse A, Araújo-Vilar D: Type 1 familial partial lipodystrophy: understanding the Kobberling syndrome. Endocrine 54(2), 411–421 (2016). doi: 10.1007/s12020-016-1002-x [DOI] [PubMed] [Google Scholar]
- 6.Akinci B, Onay H, Demir T, Savas-Erdeve S, Gen R, Simsir IY, Keskin FE, Erturk MS, Uzum AK, Yaylali GF, Ozdemir NK, Atik T, Ozen S, Yurekli BS, Apaydin T, Altay C, Akinci G, Demir L, Comlekci A, Secil M, Oral EA: Clinical presentations, metabolic abnormalities and end-organ complications in patients with familial partial lipodystrophy. Metab. Clin. Exp 72, 109–119 (2017). doi: 10.1016/j.metabol.2017.04.010 [DOI] [PubMed] [Google Scholar]
- 7.Garg A: Clinical review#: Lipodystrophies: genetic and acquired body fat disorders. J. Clin. Endocrinol. Metab 96(11), 3313–3325 (2011). doi: 10.1210/jc.2011-1159 [DOI] [PMC free article] [PubMed] [Google Scholar]
- 8.Garg A: Gender differences in the prevalence of metabolic complications in familial partial lipodystrophy (Dunnigan variety). J. Clin. Endocrinol. Metab 85(5), 1776–1782 (2000). doi: 10.1210/jcem.85.5.6605 [DOI] [PubMed] [Google Scholar]
- 9.Saponaro C, Gaggini M, Carli F, Gastaldelli A: The subtle balance between lipolysis and lipogenesis: a critical point in metabolic homeostasis. Nutrients 7(11), 9453–9474 (2015). doi: 10.3390/nu7115475 [DOI] [PMC free article] [PubMed] [Google Scholar]
- 10.Patni N, Garg A: Congenital generalized lipodystrophies—new insights into metabolic dysfunction. Nat. Rev. Endocrinol 11(9), 522–534 (2015). doi: 10.1038/nrendo.2015.123 [DOI] [PMC free article] [PubMed] [Google Scholar]
- 11.Meehan CA, Cochran E, Kassai A, Brown RJ, Gorden P: Metreleptin for injection to treat the complications of leptin deficiency in patients with congenital or acquired generalized lipodystrophy. Exp. Rev. Clin. Pharmacol 9(1), 59–68 (2016). doi: 10.1586/17512433.2016.1096772 [DOI] [PMC free article] [PubMed] [Google Scholar]
- 12.Oral EA: Lipoatrophic diabetes and other related syndromes. Rev. Endocr. Metab. Dis 4(1), 61–77 (2003). [DOI] [PubMed] [Google Scholar]
- 13.Diker-Cohen T, Cochran E, Gorden P, Brown RJ: Partial and generalized lipodystrophy: comparison of baseline characteristics and response to metreleptin. J. Clin. Endocrinol. Metab 100(5), 1802–1810 (2015). doi: 10.1210/jc.2014-4491 [DOI] [PMC free article] [PubMed] [Google Scholar]
- 14.Akinci B, Koseoglu FD, Onay H, Yavuz S, Altay C, Simsir IY, Ozisik S, Demir L, Korkut M, Yilmaz N, Ozen S, Akinci G, Atik T, Calan M, Secil M, Comlekci A, Demir T: Acquired partial lipodystrophy is associated with increased risk for developing metabolic abnormalities. Metab. Clin. Exp 64(9), 1086–1095 (2015). doi: 10.1016/j.metabol.2015.06.004 [DOI] [PubMed] [Google Scholar]
- 15.Myalept [Package Insert] In. Aegerion Pharmaceuticals, Inc., Cambridge, MA, (2015) [Google Scholar]
- 16.Myalepta; Summary of Product Characteristics. http://www.ema.europa.eu/docs/en_GB/document_library/EPAR_-_Product_Information/human/004218/WC500253136.pdf (2018). Accessed January 14, 2019
- 17.Chan JL, Lutz K, Cochran E, Huang W, Peters Y, Weyer C, Gorden P: Clinical effects of long-term metreleptin treatment in patients with lipodystrophy. Endocr. Pract 17(6), 922–932 (2011). doi: 10.4158/ep11229.or [DOI] [PMC free article] [PubMed] [Google Scholar]
- 18.Chong AY, Lupsa BC, Cochran EK, Gorden P: Efficacy of leptin therapy in the different forms of human lipodystrophy. Diabetologia 53(1), 27–35 (2010). doi: 10.1007/s00125-009-1502-9 [DOI] [PubMed] [Google Scholar]
- 19.Christensen JD, Lungu AO, Cochran E, Collins MT, Gafni RI, Reynolds JC, Rother KI, Gorden P, Brown RJ: Bone mineral content in patients with congenital generalized lipodystrophy is unaffected by metreleptin replacement therapy. J. Clin. Endocrinol. Metab 99(8), E1493–E1500 (2014). doi: 10.1210/jc.2014-1353 [DOI] [PMC free article] [PubMed] [Google Scholar]
- 20.Joseph J, Shamburek RD, Cochran EK, Gorden P, Brown RJ: Lipid regulation in lipodystrophy versus the obesity-associated metabolic syndrome: the dissociation of HDL-C and triglycerides. J. Clin. Endocrinol. Metab 99(9), E1676–E1680 (2014). doi: 10.1210/jc.2014-1878 [DOI] [PMC free article] [PubMed] [Google Scholar]
- 21.Kamran F, Rother KI, Cochran E, Safar Zadeh E, Gorden P, Brown RJ: Consequences of stopping and restarting leptin in an adolescent with lipodystrophy. Horm. Res. Paediatr 78(5–6), 320–325 (2012). doi: 10.1159/000341398 [DOI] [PMC free article] [PubMed] [Google Scholar]
- 22.Muniyappa R, Abel BS, Asthana A, Walter MF, Cochran EK, Remaley AT, Skarulis MC, Gorden P, Brown RJ: Metreleptin therapy lowers plasma angiopoietin-like protein 3 in patients with generalized lipodystrophy. J. Clin. Lipidol 11(2), 543–550 (2017). doi: 10.1016/j.jacl.2017.02.002 [DOI] [PMC free article] [PubMed] [Google Scholar]
- 23.Brown RJ, Oral EA, Cochran E, Araujo-Vilar D, Savage DB, Long A, Fine G, Salinardi T, Gorden P: Long-term effectiveness and safety of metreleptin in the treatment of patients with generalized lipodystrophy. Endocrine 60(3), 479–489 (2018). doi: 10.1007/s12020-018-1589-1 [DOI] [PMC free article] [PubMed] [Google Scholar]
- 24.Oral EA, Simha V, Ruiz E, Andewelt A, Premkumar A, Snell P, Wagner AJ, DePaoli AM, Reitman ML, Taylor SI, Gorden P, Garg A: Leptin-replacement therapy for lipodystrophy. New. Engl. J. Med 346(8), 570–578 (2002). doi: 10.1056/NEJMoa012437 [DOI] [PubMed] [Google Scholar]
- 25.Vatier C, Fetita S, Boudou P, Tchankou C, Deville L, Riveline J, Young J, Mathivon L, Travert F, Morin D, Cahen J, Lascols O, Andreelli F, Reznik Y, Mongeois E, Madelaine I, Vantyghem M, Gautier J, Vigouroux C: One-year metreleptin improves insulin secretion in patients with diabetes linked to genetic lipodystrophic syndromes. Diabetes. Obes. Metab 18(7), 693–697 (2016). doi: 10.1111/dom.12606 [DOI] [PubMed] [Google Scholar]
- 26.Simha V, Subramanyam L, Szczepaniak L, Quittner C, Adams-Huet B, Snell P, Garg A: Comparison of efficacy and safety of leptin replacement therapy in moderately and severely hypoleptinemic patients with familial partial lipodystrophy of the Dunnigan variety. J. Clin. Endocrinol. Metab 97(3), 785–792 (2012). doi: 10.1210/jc.2011-2229 [DOI] [PMC free article] [PubMed] [Google Scholar]
- 27.Ajluni N, Dar M, Xu J, Neidert AH, Oral EA: Efficacy and safety of metreleptin in patients with partial lipodystrophy: lessons from an expanded access program. J. Diabetes. Metab 7(3), 659 (2016). doi: 10.4172/2155-6156.1000659 [DOI] [PMC free article] [PubMed] [Google Scholar]
- 28.Garg A, National Organization for Rare Disorders (NORD): Familial partial lipodystrophy. https://rarediseases.org/rare-diseases/familial-partial-lipodystrophy/ (2015). Accessed October 4, 2017
- 29.Chiquette E, Oral EA, Garg A, Araujo-Vilar D, Dhankhar P: Estimating the prevalence of generalized and partial lipodystrophy: findings and challenges. Diabetes. Metab. Syndr. Obes 10, 375–383 (2017). doi: 10.2147/DMSO.S130810 [DOI] [PMC free article] [PubMed] [Google Scholar]
Associated Data
This section collects any data citations, data availability statements, or supplementary materials included in this article.