Abstract
Background -
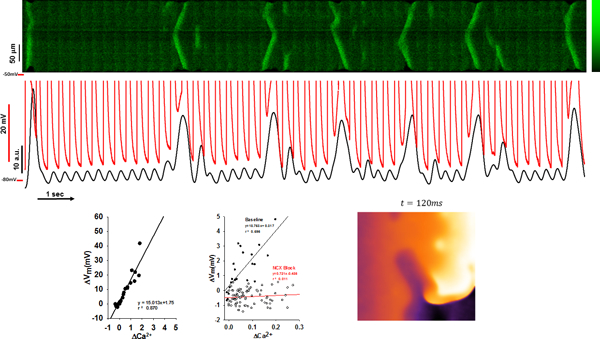
We have identified a novel form of abnormal Ca2+ wave activity in normal and failing dog atrial myocytes which occurs during the action potential (AP) and is absent during diastole. The goal of this study was to determine if triggered Ca2+ waves affect cellular electrophysiological properties.
Methods -
Simultaneous recordings of intracellular Ca2+ and APs allowed measurements of maximum diastolic potential (MDP) and AP duration (APD) during TCWs in isolated dog atrial myocytes. Computer simulations then explored electrophysiological behavior arising from TCWs at the tissue scale.
Results -
At 3.3–5hz, TCWs occurred during the AP and often outlasted several AP cycles. MDP was reduced and APD was significantly prolonged during TCWs. All electrophysiological responses to TCWs were abolished by SEA0400 and ORM10103, indicating that Na-Ca exchange current caused depolarization. The time constant of recovery from inactivation of Ca2+ current was 40–70ms in atrial myocytes (depending on holding potential) so this current could be responsible for AP activation during depolarization induced by TCWs. Modeling studies demonstrated that the characteristic properties of TCWs are potentially arrhythmogenic by promoting both conduction block and reentry arising from the depolarization induced by TCWs.
Conclusions -
Triggered Ca2+ waves activate inward NCX and dramatically reduce atrial MDP and prolong APD, establishing the substrate for reentry which could contribute to the initiation and/or maintenance of atrial arrhythmias.
Keywords: action potential remodeling, depolarization, Na+/Ca2+ exchange, calcium channel, modeling
Journal Subject Terms: Calcium Cycling/Excitation-Contraction Coupling, Atrial Fibrillation, Electrophysiology, Arrhythmias, Physiology
Graphical Abstract
Introduction
Atrial arrhythmias are the most common form of rhythm disturbances with atrial fibrillation (AF) being the predominant clinical arrhythmia. There has been a great deal of research devoted to the mechanisms for AF that have focused on the development of reentrant excitation around physical barriers such as atrial fibrosis.1 AF is most common in older patients where anatomical changes and fibrosis in atrial tissue occur with aging as well as in the setting of heart failure (HF), creating the substrate for reentry.2–4 However, there is also evidence that triggered activity could contribute to AF5 including that which occurs in the setting of HF.6
We have recently identified a novel form of abnormal Ca2+ cycling in the atria of large animals, including humans, that occurs during the action potential (AP), increases in incidence with rate, and is absent during diastole making it distinct from traditional spontaneous Ca2+ waves arising from Ca2+ overload of the sarcoplasmic reticulum (SR).7 This form of Ca2+ release is called a “triggered” Ca2+ wave (TCW) because these events are initiated by activation of L-type Ca+ channels (LTCCs) during the AP and the resulting trigger Ca2+ entry which occurs during excitation-contraction coupling.7–9 Low t-tubule density causes initiation of the Ca2+ transient to occur via Ca2+ entry through LTCC current (ICa) at junctional SR release sites with subsequent centripetal propagation to non-junctional corbular SR in the cell interior. Rapid Ca2+ reuptake maintains a high SR load at corbular SR making release more sensitive to cytosolic Ca2+10 especially in HF. Importantly, TCWs are more frequent and are initiated at lower rates in experimental HF in dog atria because of this high SR load7, 11 raising the possibility of a role in AF initiation or maintenance in HF. We also concluded that TCWs arise in atrium as a result of the low T-tubule density.12 A reduction in SR Ca2+ release in the atrial cell interior during rapid pacing increases SR Ca2+ load and makes release more sensitive to trigger Ca2+ along its outer membrane where LTCCs are located. It is also important to note that TCWs propagate along the cell length in a manner similar to spontaneous Ca2+ waves but distinct from the normal wave-like (centripetal) propagation from cell surface to cell interior during normal excitation-contraction coupling reported to occur in atrial myocytes. In the absence of and extensive T-tubule network, trigger Ca2+ entry via LTCCs activates subsarcolemmal RyRs which induce a Ca2+-induced Ca2+ release cascade that activates Ca2+ release from internal sites, often with a small delay because of the distance travelled during this centripetal propagation. Although this transverse wave-like activation of the atrial cell is essential for activation of interior Ca2+ release sites, and gives rise to the typical U-shaped Ca2+ transient recorded in the transverse direction7, 13, it is distinct from slowly propagating waves - including TCWs - that travel along the cell length.
The goal of this study was to determine how TCWs affect atrial AP properties and how these changes might contribute to arrhythmia formation in atrium. Simultaneous recordings of transmembrane potential and intracellular Ca2+ cycling were performed in dog left atrial myocytes. Experimental results were paralleled with modeling studies that applied our results in order to investigate how cellular events are capable of producing conduction block and wavebreak in simulated tissue and establishing the substrate for reentry.
Methods
All procedures were approved by the Institutional Animal Care and Use Committee according to the principles established in the NIH guidelines. Induction of anesthesia was accomplished with propofol (3–7 mg/kg, IV) then anesthesia was maintained with inhaled isoflurane (1.5–5%). Euthanasia was induced by opening the chest and removing the heart. Details of all additional procedures, including computer modeling, are included in the Supplementary Material. The authors are also willing to make data, methods of analysis, and materials available upon request.
Hounds of either sex were used in this study. Induction of anesthesia was accomplished with propofol (3–7 mg/kg, IV) then anesthesia was maintained with inhaled isoflurane (1.5–5%). The chest was opened, the heart was removed, and cells were isolated from the left atrium by enzymatic digestion of the entire atrium as described elsewhere7. Myocytes were loaded with Cal520-AM (AAT Bioquest, 14μm for 25 minutes) and placed in the cell chamber and allowed to settle to the bottom of the chamber. Perfusion was initiated at 36°C with modified Tyrode’s solution containing (in mM): NaCl 140, KCl 5.4, MgCl2 1; NaH2PO4 0.4; CaCl2 1.8; glucose 10, HEPES 10 (pH 7.4). APs were recorded with an Axoclamp-2A amplifier using ruptured patch techniques with internal solution containing (mM): NaCl 10; KCl 10; EGTA 0.01; K aspartate 120; HEPES 10mM (pH 7.2). After rupture, brief current pulses were applied (0.5ms, 1.25x threshold) in order to evoke APs and Ca2+ transients. Pulse protocols were applied at 1, 2, 2.5, 3.3 and 5hz for 10–30 seconds depending on rate. Simultaneous recordings of APs (pCLAMP 8.0) and intracellular Ca2+ (Zeiss LSM 510, 25x objective, NA = 1.2) were obtained during all protocols. Simultaneous recordings of APs and intracellular Ca2+ were synchronized during the pacing protocol so that dynamics of Ca2+ changes could be related directly to changes in Vm, especially when TCWs were initiated. Since changes in diastolic Ca2+ during the TCW often outlived the duration of a single AP, continuous recordings of the entire duration of the pacing protocol were recorded so that changes in Vm and Ca2+ could be measured both during the AP as well as when maximum diastolic potential was achieved between APs. In some experiments, the Na-Ca exchange (NCX) antagonist SEA0400 (1–3μM) was applied after control recordings were obtained in order to measure changes in membrane potential during triggered waves after NCX block. Additional experiments were obtained in control cells then separately in myocytes incubated in SEA0400 or ORM10103 (10μM) for at least 20 minutes before patching.
Whole cell LTCC currents were recorded from isolated myocytes amplifier in a recording chamber at 37°C using an Axopatch 200 amplifier in an external solution containing (mM) NaCl 140; KCl 5.4; CaCl2 1.8; MgCl2 0.5; BaCl2 0.25; NaH2PO4 0.4, 4-aminopyridine 4; Glucose 11; HEPES 10 (pH 7.4 with NaOH). The internal solution contained (mM) Cs aspartate 120; CsCl 25; NaCl 6; MgCl2 1.5; HEPES 20; K2-ATP 4; EGTA 0.056 (pH 7.2 with CsOH). The recovery from inactivation protocol consisted of eliciting an initial LTCC current response by a 150 ms voltage step from a holding potential (Vh) of −50 mV (to inactivate fast sodium current) to a test potential of +20 mV. Vh was then returned to an interpulse holding potential of −50, −30 or −10 mV This was then followed by a second test pulse. The interval between the end of the first pulse to the onset of the second were incrementally increased from 10 to 1000 ms. The amplitudes of the second pulses (indicating recovery from inactivation) were normalized to the amplitude recorded at the 1000 ms interval (where maximal recovery was assumed). The averaged normalized values of the recovery currents at each of the three interpulse holding potentials were plotted as a function of the recovery duration. Each plotted curve was then fitted to an exponential equation and the tau values calculated (SigmaPlot version 11.0).
Some experiments were performed in the presence of the NCX inhibitor ORM10103 (10μM). A small bias current (< −50pA) was applied to maintain resting potentials of −70 to −80mV in atrial myocytes that were unable to remain stable at normal resting potentials14–16. Bias current was held constant throughout the duration of each experiment and was also used for some recordings made in control myocytes as well. This was necessary because even small leak currents were often sufficient to depolarize the atrial myocytes in the virtual absence of native IK1.
Results
Experimental Results
Effects of triggered Ca2+ waves on membrane potential (Vm)
We first measured voltage changes that occurred simultaneously with TCWs. Figure 1 shows a longitudinal confocal Xt-line scan recording (top) with simultaneous voltage recording (Vm, middle trace) and the corresponding mean fluorescence F vs time profile (Ft, bottom trace) of a dog left atrial myocyte paced at a CL of 300ms. The first beat gives a very bright signal indicating a large Ca2+ transient which is typical of Ca2+ release in an atrial myocyte following a pause, with a series of smaller transients during pacing. However, at steady-state numerous pronounced Ca2+ release events occurred some of which were propagated while others failed to propagate along the cell length. Interestingly, each TCW produced a corresponding large positive voltage deflection. Furthermore, the larger the release event, both in time and in space, the greater the magnitude of the depolarization resulting in prolonged APD and a depolarized MDP.
Figure 1.
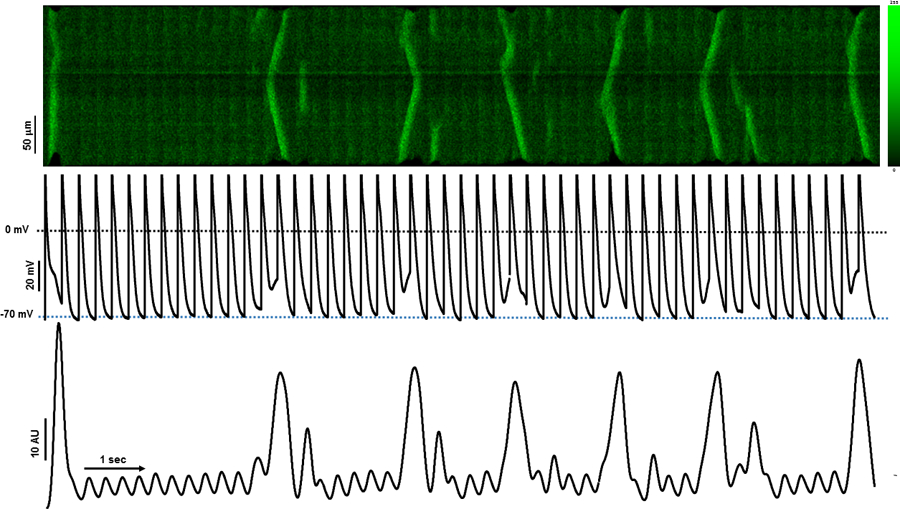
Effects of triggered calcium waves on membrane potential (Vm). The image shows a confocal Xt-linescan recording (top) with simultaneous voltage Vm (middle trace) and mean F vs time profile (Ft, bottom trace) of a dog left atrial myocyte paced at BCL=300ms. Fluorescence intensity scale is presented in arbitrary fluorescence units.
When we superimposed the Vm and Ca2+ recordings (Figure 2A), we found a nearly perfect correspondence between the magnitude and timing of the Ca2+ release events and depolarization. Furthermore, the TCWs that propagate over multiple transients showed APD prolongation and depolarization of MDP that lasted as long as the TCW, often encompassing several transients and APs causing a failure of repolarization. In contrast, when the triggered release failed to outlast the AP such as during a short TCW, there was a more discreet effect on APD prolongation of the cycle only during which that event occurred.
Figure 2.
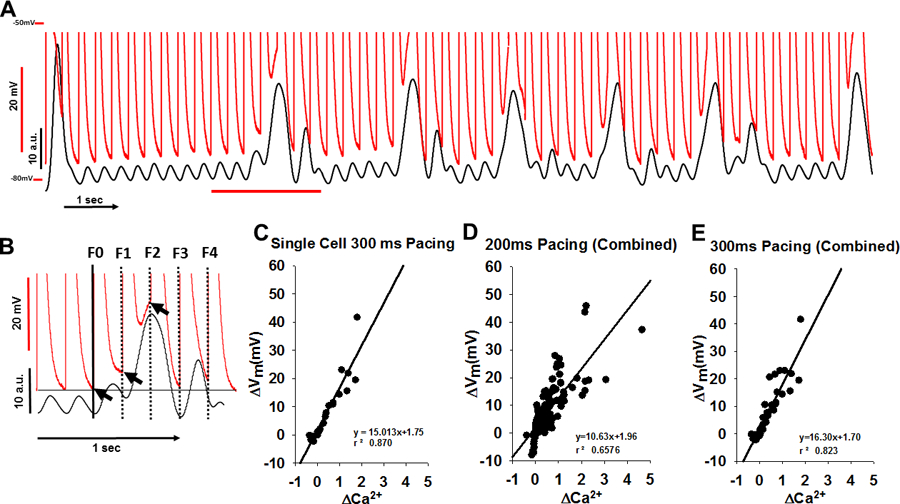
The ΔVm-ΔCa2+ relationship during triggered Ca2+ waves (TCWs). A. The superposition (top) of Vm and fluorescence from Figure 1 during rapid pacing. B. Method for measuring Vm and Ca2+: the mean fluorescence and corresponding voltage changes were measured immediately prior to the stimulus and compared to Vm immediately prior to beginning of a TCW (from expanded section in red from A). The horizontal black line indicates MDP in the absence of a wave. Arrows indicate Vm at which MDP was measured. C. Relationship between TCW magnitude and the magnitude of depolarization. D-E. Summary data from 7 myocytes (3 dogs) at 200ms pacing (D) and 5 myocytes (3 dogs) at 300 ms pacing (E).
Measurement of TCWs effects on Vm at MDP
In order to quantify the effects of TCWs on Vm in this myocyte, we measured the mean F and corresponding Vm changes immediately prior to the following stimulus and compared them to the same measurements prior to the first incidence of a TCW (Figure 2B and the description of analysis in Supplementary Methods section and diagrammed in Figure S1). When we plotted the magnitude of Vm depolarization (ΔVm) as a function of ΔCa2+ magnitude during the triggered event, we found that there is a highly linear relationship between TCW magnitude and the magnitude of depolarization. Summary data (Figure 2C–E) show that this relationship is preserved among all myocytes tested as well as across cycle lengths (CL = 200ms and 300 ms).
It is important to note that the association between the change in Vm with that in Ca2+ gives a nearly perfect time course of the changes in Vm as Ca2+ rises during the TCW. Consequently, it is almost certainly the peak Ca2+ that is responsible for the maximal degree of depolarization which is why we measured the instantaneous Ca2+ change at the time of maximal depolarization rather than integrating Ca2+ change over time. Since the depolarization does not occur as the result of a signaling event requiring a Ca-sensitive intermediary, this depolarization in fact occurs as the result of a Ca-activated membrane conductance that is extremely rapid in its response and is a nearly instantaneous measure of the changes in subsarcolemmal Ca2+. The basis for our use of actual magnitude of Ca2+ changes rather than a time integral can be seen in Figures 1 and 2 where slow depolarization tracks the slowly rising intracellular Ca2+ during the early phase of the TCW before peak Ca2+ is achieved. Subsequently, there is a nearly perfect agreement between peak Ca2+ and peak depolarization for each TCW which is the reason that we chose to measure these values rather than total Ca2+ released over time, which can occur relatively slowly and which is not likely to be responsible for real-time maximal depolarization.
In addition to their effects on MDP, we also wanted to investigate the effect of TCWs on APD since most propagated waves outlived a single cycle and thus affected Vm across multiple APs. Figure 3A shows an example of APs before (first cycle) and during a TCW (second cycle). APD-20 and APD-50 were measured as APD at −20 and −50mV during repolarization as the difference between paired cycles before and during a TCW. We found that APD-20 showed a small (by 4.0±1.42 msec, p<0.02) but significant change during the TCW while APD-50 was significantly prolonged during the TCW (by 27.9±5.84 msec, p<0.001) indicating an important effect of TCWs on APD in addition to the changes in MDP. We also measured the average number of cycles that were affected by TCW propagation (Figure 3B) and found that they tend to involve more than 2 transients (at CL = 200 and 300 ms). Thus, AP prolongation is closely associated with the magnitude and timing of TCWs during the AP and each wave is capable of affecting several APs depending on its timing and duration.
Figure 3.
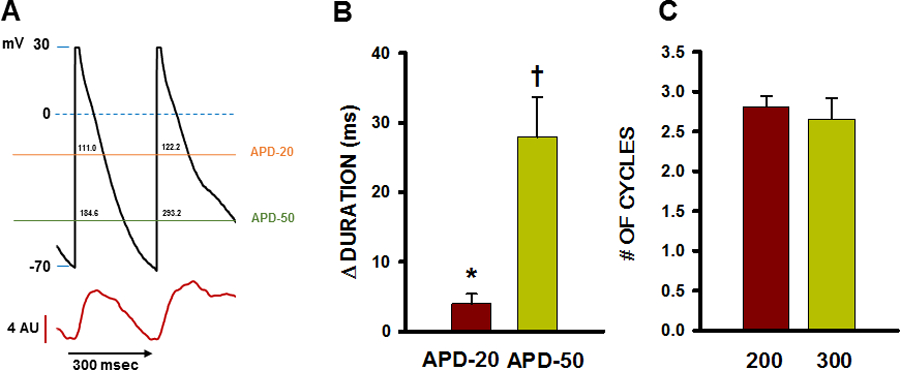
Relationship between TCWs and change in APD and number of cycles affected by TCWs. A. Representative recording of APD prolongation during a TCW showing how APD at −20mV (APD-20) and APD at −50mV (APD-50) were measured. Values in milliseconds are indicated above each horizontal line within the AP waveform at APD-20 and APD-50. B. Summarized changes in APD during TCWs (CL = 300 msec). n = 25 waves in 12 myocytes from 6 dogs. * p<0.02; † p<0.001 as determined by t-test. C. Summary of number of consecutive APs affected by each TCW at BCL= 200 and 300 msec. n = 29–43 myocytes in 4–6 dogs for each condition. NS as determined by t-test.
TCW Effect on VM after NCX inhibition
In order to investigate the role of NCX as the possible mechanism underlying the effects of TCWs on Vm, we used a NCX blocker (SEA0400, 1–3uM, SEA) to measure changes in Vm during TCWs. Figure 4A shows an example where TCWs caused pronounced depolarization of MDP and APD prolongation. When NCX was blocked with SEA, TCWs were still present during rapid pacing but produced almost no change in Vm (Figure 4B–C). The relationship between ΔVm of the MDP and ΔCa2+during each TCW for this experiment (Figure 4D) was steep and linear in control whereas ΔCa2+ produced little depolarization at any TCW magnitude after SEA exposure. Figure 4E–F summarizes the results of paired and unpaired experiments in which recordings were obtained before and during superfusion with SEA. We used the slope of the ΔVm/ΔCa2+ relationship as a measure of the sensitivity of the reliance of depolarization magnitude on TCW magnitude. The slope of this relationship was decreased by over 90% both in paired and in unpaired experiments where the slopes in control were compared to those in myocytes pre-incubated in SEA for at least 15 minutes (Figure 4F, CL = 200ms).
Figure 4.
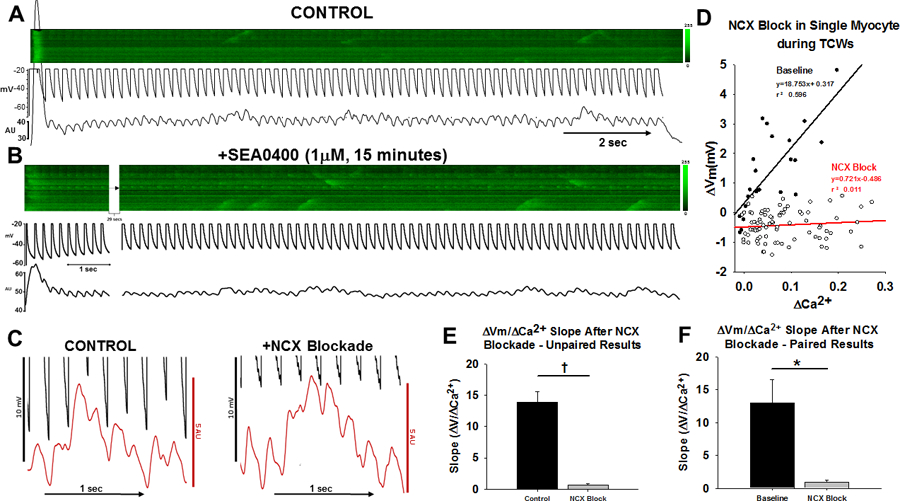
TCW effect on membrane potential in the absence and presence of NCX blockade A-B. Vm, linescan images and average fluorescence recordings from an experiment in which TCWs (CL = 200 ms) before (A) and during (B) superfusion with SEA0400. C. Expanded scale recordings from A and B. D. Summarized ΔVm-ΔCa2+ relationships before and during SEA0400 from this experiment. D. Summary of all results paired results of four myocytes (3 dogs) in which recordings were obtained before and during superfusion with SEA at CL = 200ms. E. Summary of results from all unpaired (11 myocytes/6 dogs in control; 7 myocytes/4 dogs during SEA) and F paired experiments (4 cells/3dogs). * p<0.05; † p<0.001 by t-test.
Because of the possibility that SEA might have secondary effects on Ca2+ release including well-known partial block of ICa, we measured depolarization of MDP in the presence of a second, presumably more selective NCX inhibitor (ORM10103, ORM). The results confirmed that nearly all depolarization was suppressed by ORM during TCWs just as we observed with SEA. Figure S2 summarizes the data for all individual experiments in which simultaneous APs and intracellular Ca2+ were recorded in the presence of ORM (10μM) at a BCL=200msec. Since the data were recorded in 6 myocytes from only 2 dogs, no attempt was made to perform a statistical comparison with the results obtained from the normal or SEA00400-treated myocytes shown in Figure 4. However, the key observation is that there was very little depolarization of MDP during triggered waves in the presence of ORM (average slope of 4.6±1.20mV) just as we had observed with SEA0400. These results using a second NCX inhibitor support the conclusion from the SEA0400 data that inward INCX is responsible for membrane depolarization during triggered waves.
Note that the steady-state MDP during pacing was unchanged (−53.5 ± 2.35mV in control compared to −57.0 ± 3.14 in SEA, n=4 paired recordings, NS).
Kinetics of ICa recovery from inactivation
Our results suggest that depolarization resulting from TCWs might result in APs that arise from low Vms in voltage ranges where rapid INa might be unavailable. This result raises the question about whether or not ICa can be sufficiently large to support propagated APs during rapid pacing. ICa recovery is rapid in dog ventricle17 but it is not known if atrial ICa might be recovered enough to produce slowly-conducting APs at rapid rates. Figure S3 shows that the recovery from inactivation for ICa is similarly fast in atrial myocytes at 36°C. Time constant (τ) values for recovery increased when comparing the interpulse holding potentials −50 vs −30 mV (44 vs 73 ms) and increased further at −10 mV (to 106 ms). These results demonstrate that the rapid recovery of ICa is sufficiently fast to support ICa-based slowly propagating APs that are likely to be activated with the timing and magnitude of the depolarizations caused by TCWs.
Modeling Results
TCWs and Vm: simulation results
In this study we apply a recently developed model of Ca2+ cycling in atrial myocytes coupled with an established action potential model8. We keep track only of the number of Ca2+ sparks recruited and model TCWs as a regenerative recruitment of sparks that is due to Ca2+ wave propagation. In this model we set Ca2+ diffusion between cells to be zero, so that TCWs between cells are independent and are only correlated due to electrotonic coupling. This was based on our previous observations that Ca2+ wave propagation typically does not occur between cells.18 Details of the model are given in the Online Supplement. Figure 5A shows the average cytoplasmic [Ca2+] during steady-state pacing (). The model exhibits large Ca2+ transients intermittently in a manner similar to that observed experimentally (Figure 1). These large transients occur as the result of Ca2+ spark recruitment due to stochastic Ca2+ wave propagation. In Figure 5B we show the corresponding membrane voltage V(t). The main observation is that AP repolarization is slowed when TCWs occur, so that the following AP takes off from a voltage depolarized by as much as .
Figure 5.
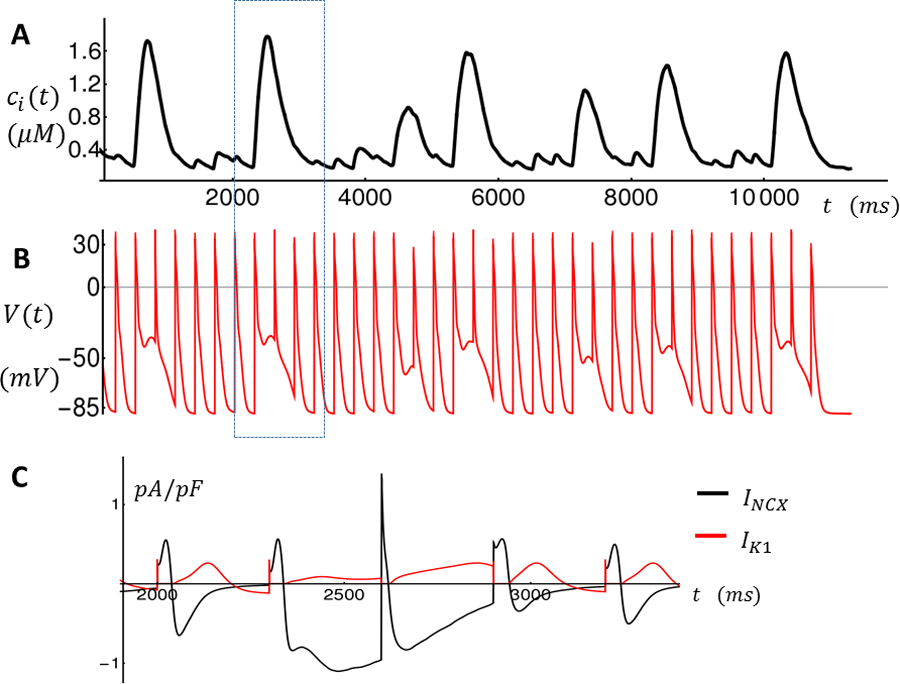
Intracellular Ca2+ concentration and membrane voltage as a function of time during rapid pacing. A. Average cytosolic Ca2+ concentration Ci is shown for the last 36 beats. Large Ca2+ releases indicate TCWs. B. Membrane voltage V (t) as a function of time. C. Time course of Ik1 and INCX for the time interval enclosed by the dashed rectangle indicated in A-B.
To investigate further the ionic mechanism for this voltage decrease, in Figure 5C we plot Ik1 and INCX during a time window (dashed rectangle) when a TCW occurs so that INCX is increased towards the end of the cycle due to the elevated Ca2+ release. INCX exceeds Ik1 current during repolarization which has depolarizing effect of V(t). Thus, in our computational model INCX is the main ionic current responsible for the large depolarization of the MDP.
Modeling the effect of an NCX blocker
In order to analyze the effect of an NCX blocker on membrane depolarization due to TCWs, we have computed how the membrane depolarization (ΔV) depends on NCX conductance. This dependence is computed by driving the ionic currents in our AP model using a Ca2+ clamp. In this way we can assess the dependence of NCX conductance on membrane potential changes for a fixed Ca2+ transient due to TCWs. In Figure 6A we show the Ca2+ transient for the last 13 beats for the simulation shown in Figure 5. This transient is then recorded and used to drive our AP model where the NCX conductance has been reduced by a proportionality factor denoted as . In Figure 6B we show the voltage time course for the simulation shown in Figure 5 with (black line), and with (red line). Indeed, as measured experimentally, a reduction in the NCX conductance virtually eliminates the membrane depolarization due to TCWs. In particular, at the penultimate beat (red arrow), we have measured ΔV for a range of NCX conductances. As expected we find that ΔV increases monotonically with increasing . Also, we have explored the effect of modulating the Ik1 conductance. Thus, using the same Ca2+ clamp, we vary the current conductance of Ik1 using a proportionality factor denoted as . Indeed, we find that as is increased decreases, since Ik1 is the dominant current responsible for maintaining resting membrane potential.
Figure 6.
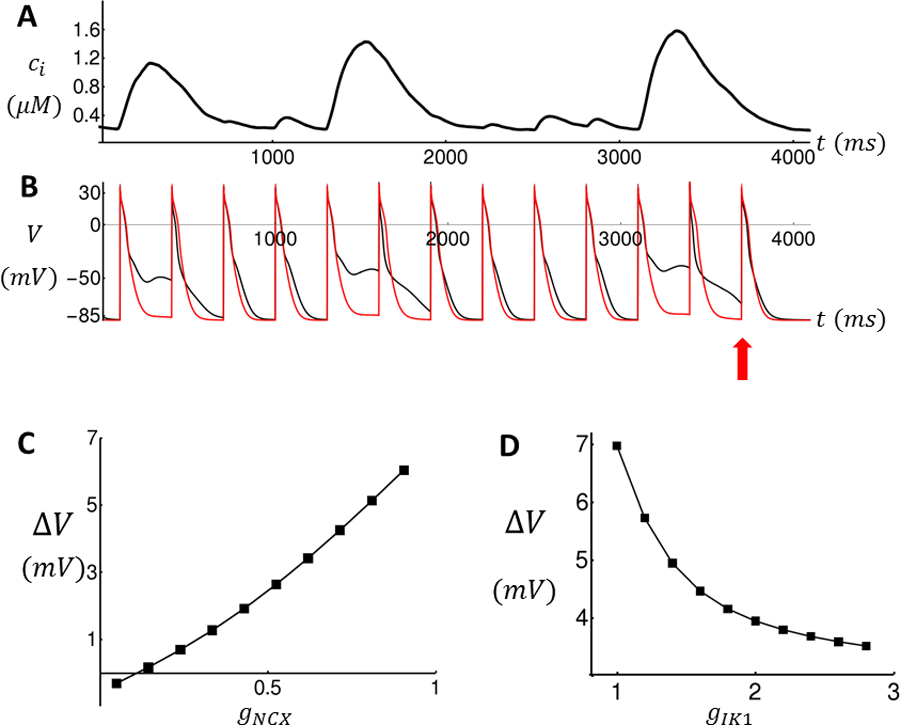
The effect of ionic conductances on membrane depolarization due to TCWs. (A) Ca2+ transient recorded from simulation shown in Figure 5 and used as a Ca2+ clamp to drive the AP model. (B) Voltage time course of atrial AP model with gNCX = 1 (black line) and gNCX = 0.1 (red line). (C) Plot of ΔV vs NCX proportionality factor gNCX for the penultimate beat. ΔV = V(t) − Vmin, where t is the time of the last AP upstroke (red arrow) and where Vmin = −89mV is the resting potential of the ionic model. (D) Plot of ΔV vs Ik1 proportionality factor gIK1.
The effects of TCWs on paced cardiac tissue
In order to determine how TCWs affect electrical propagation, we simulate a 2D system of 160 × 160 cells where the tissue is paced at a 10 × 160 strip on the left edge. To control the onset of TCWs, we use the model parameter , which is the fraction of junctional RyR clusters that have to fire in order to induce a TCW. In effect, this parameter controls the threshold necessary to form TCWs. Our model parameters are adjusted so that at , fixing ensures that TCWs do not occur, while for TCWs occur every few beats (Figure 5A). By varying this parameter we can then systematically evaluate how electrical propagation in our 2D sheet is modulated by TCWs.
Figure 7A shows snapshots of planar wave propagation in a homogeneous tissue of cells which do not exhibit TCWs. We set and pace our 2D tissue at for 20 beats resulting in spatially uniform wavefront and waveback for all beats. In these simulations the number of Ca2+ sparks recruited is stochastic and varies from cell to cell. However, electrotonic coupling dampens cell-to-cell differences in V(t) and the resulting electrical activity is spatially homogeneous. In the case where , however, TCWs occur intermittently in each cell during pacing at 300ms. Figure 7B shows snapshots of the voltage at four time intervals following the 16th paced excitation where the planar wave front becomes irregular and fractionates to form a spiral wave. This breakdown of planar wave propagation occurred in a stochastic manner with a frequency that was dependent on the extent of TCWs in the population of cells in the tissue.
Figure 7.
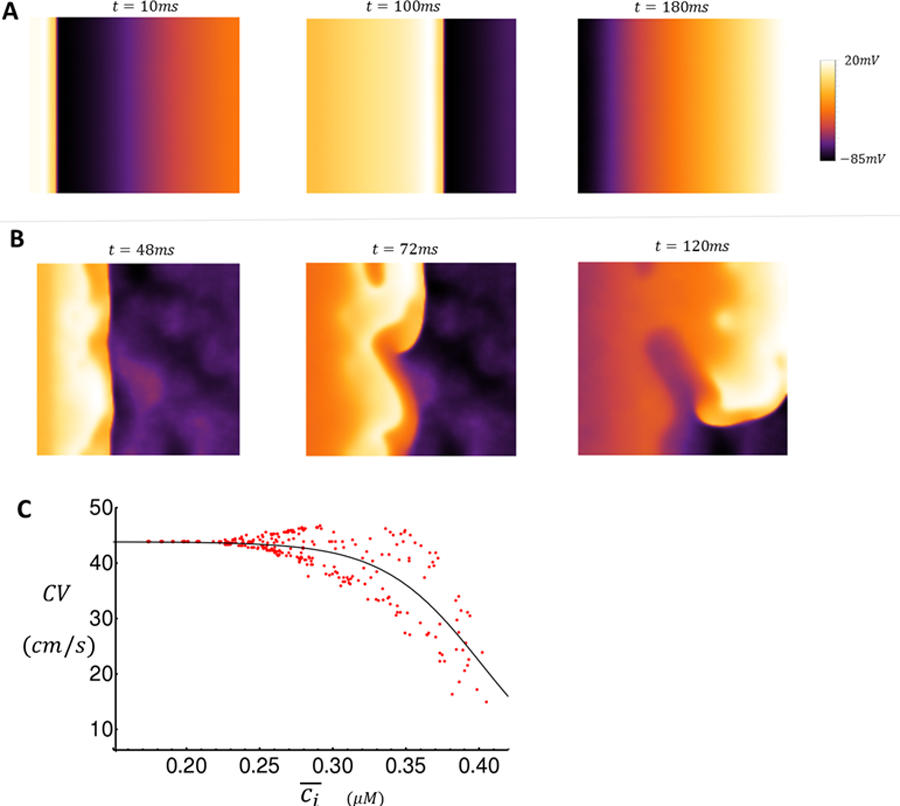
Snapshots of wave propagation on 2D tissue (A–B) and dependence of CV on Ca2+ concentration (C). A. Snapshots of AP propagation (CL = 300ms) in the absence of TCWs at indicated times after the 10th paced beat. B. Snapshots of voltage distribution when TCWs occur at the indicated times after the 16th paced beat. C. Plot of CV vs . A cable of length lx = 100 cells and width ly = 5 is paced at 300ms for 50 beats at the first 10 cells. CV is measured as the speed of propagation between cells 10 and 100. Here, is the average Ca2+ concentration in the strip of tissue at the time of each stimulus.
Mechanism driving wave break in atrial tissue exhibiting TCWs
A final important question to address is how the presence of TCWs leads to wave front fractionation. To explore this relationship we pace a quasi-one dimensional strip of tissue of length cells and width cells in order to investigate tissue conduction properties. We first study the relationship between Ca2+ release due to TCWs and the conduction velocity (CV) of an excitation on the cable. We pace our cable at one end and compute the CV by measuring the time for the excitation to traverse 100 cells. At the time of stimulation, we compute the average Ca2+ concentration, denoted as , within all cells on our tissue. Thus, this quantity measures the average Ca2+ concentration in our strip of tissue at the instant that the stimulation is applied. In Figure 7C, we plot CV vs for 50 beats. Here, we set the initial SR load to which is lower than the steady state value allowing us to probe the relationship between CV and for a wide range of cellular conditions as the SR load increases during pacing. We find that the CV decreases as the average Ca2+ concentration on the cable increases. Furthermore, as more TCWs occur and rises on the cable, the CV exhibits large variability and eventually blocks when . This result indicates that TCWs induce large conduction heterogeneities leading to conduction block.
Simulations of Ca2+ and Na+ currents during TCWs
Our experimental measurements show that ICa recovery is fast so that this current can potentially drive membrane depolarization for a stimulus applied during an AP prolonged by a TCW. To test this finding we have applied our AP model to assess the relative strength of ICa and INa when the cell is stimulated during a TCW. In Figure S4A, we plot the AP for 3 beats where the first two beats are delivered at a fixed and where the third beat is applied at a variable CL. This simulation is repeated 12 times where the last CL is reduced gradually from 800ms to 200ms. The underlying Ca2+ transient (red line) is clamped and exhibits a TCW on the second beat so that AP repolarization on that beat is slowed. Here, we find that there is an AP upstroke on the last beat even in the case when the cell is stimulated at a depolarized voltage where INa is expected to be inactivated. To trace the underlying ionic currents that generate the AP upstroke, we have plotted in Figure S4B and S4C both ICa and INa for each simulation run. We find that ICa is substantial for all CLs applied while INa drops to zero when the stimulus is applied above . Indeed, this voltage corresponds to the Na+ current inactivation threshold in the Grandi AP model. These results demonstrate that a rapid upstroke occurs for a range of stimulus times and is largely driven by ICa when the voltage is above the Na+ current inactivation threshold.
Discussion
TCWs and membrane depolarization
It is well known that activation of NCX by abnormal intracellular Ca2+ release can affect the cardiac AP, leading to AP prolongation and decreased MDP depending on the timing of release.19 However, virtually all of these observations have been made in ventricular myocytes which show fairly modest changes in APD and MDP in response to Ca2+ release. In contrast, abnormal Ca2+ release during the atrial AP – TCWs – produce enormous changes in Vm that are maintained for several APs depending on the overall duration of the TCW itself; if the wave lasts for several cycles, then the reduction of MDP does also. Furthermore, APD is prolonged in the presence of TCWs and can be affected throughout the duration of the TCW. Interestingly, early repolarization (APD-20) was affected by only about 4msec by the presence of the wave which probably reflects the fact that repolarizing currents are strong early during repolarization (ITO and possibly IKr/IKs) the sum of which is probably sufficient to overwhelm inward INCX, not to mention the fact that the driving force for this current is reduced at the more depolarized potentials early in the AP. However, as these currents inactivate/deactivate, the remaining inward INCX is unopposed and now has dramatic effects to prolong late repolarization as observed at APD-50. These changes in APD on a beat-to-beat basis in individual myocytes increase the likelihood that there will be repolarization gradients that develop between cells with different magnitude or timing of triggered events, thus establishing the substrate for reentry in different atrial regions, an idea that was borne out in our modeling studies. Furthermore, the remarkable depolarizing effect of the inward INCX on MDP during these events can be as much as 30–50mV so that the subsequent AP arrives well before the membrane has repolarized into the range of activation of the rapid Na+ current.20, 21 Our recovery from inactivation studies demonstrate that ICa recovers with time constants of 40–100 ms (depending on holding potential) suggesting that it is possible that ensuing APs could arise via activation of ICa which propagate much slower than APs arising from normal, negative MDPs where rapid INa is the primary source of inward current. These slowly-propagating APs are likely to contribute to slowed conduction, reentry, and arrhythmias. Moreover, the greater extent of scarring and anatomical barriers to normal atrial conduction in the setting of HF is likely to contribute to a higher incidence of reentrant arrhythmias, especially since the incidence of TCWs is higher in HF.
Mechanism for membrane depolarization induced by TCWs
Our results demonstrate that TCWs produced large depolarizations in atrial myocytes. This result was rather surprising given the relatively modest changes in APD and MDP that have been reported in dog and rabbit ventricular myocytes during spontaneous Ca2+ release in the form of delayed afterdepolarizations (DADs) or during terminal repolarization in the form of early afterdepolarization (EADs).22 It has been reported that late or phase-3 EADs can induce reentry if reactivation occurs late in repolarization23, 24 although this is not likely to occur as the result of Ca2+ release but rather, as the result of AP reactivation during late repolarization. In general, it has been reported that ventricular myocytes respond to DADs with a doubling of depolarization magnitude for each 88nM increase in Ca2+ concentration19, 22, 25 so it was not surprising that the typically large TCWs produced such large reductions in MDP in the atrium.
The mechanism for the greater depolarization in response to TCWs in atrium resides in the fact that there is so little inward rectifier current (IK1) present in atrium of large animals compared to ventricle. Previous studies have reported that dog atrial IK1 is only about 10% of that found in ventricle with nearly a 77-fold higher expression level of Kir2.1 in ventricle.19, 26 Consequently, an amplification of INCX-induced depolarization would be expected to be exaggerated in atria where IK1 is reduced by nearly 90% compared to ventricle.11, 26, 27 Thus there is very little outward current present in atrium available to oppose the depolarizing influence of inward INCX in response to TCWs, resulting in the large depolarizations of MDP that we found in this study. Furthermore, since nearly all net current during TCWs in atrium is inward INCX, the depolarizing effects on MDP should track the changes in Ca2+ almost perfectly just as we observed in Figure 2. In contrast, the depolarizing effects of Ca2+ waves in ventricle should be muted by an enormous (10-fold greater) repolarizing effect of IK1 compared to atrium which is exactly what was reported by others.19, 22, 25 This critical role for INCX in the depolarization of atrial MDP by TCWs was clearly demonstrated by the nearly complete loss of depolarization despite maintained TCWs when the NCX was blocked.
TCWs and early afterdepolarizations
Rather than occurring after the end of repolarization (as with DADs), the timing of TCWs is such that the resulting depolarization occurs during the AP and thus can produce an AP “shoulder” during repolarization, which is a typical feature of EADs.28 However, we hesitate to call the current behavior EADs because it is always interrupted by a succeeding stimulus and is therefore unable to produce the characteristic slow repolarization signature of an EAD. If a stimulus fails to capture during this slowing of repolarization, we expect that the normal EAD would occur. However, in reality, the influence on APs would be similar for TCWs and EADs in that the resulting AP prolongation would be expected to produce repolarization gradients, conduction slowing and possible wavebreak as illustrated by our computational modeling studies. This late depolarization is also important because it may produce phase-3 EADs depending on timing.24 Perhaps the difference between EAD-induced and TCW-induced late depolarization is merely a semantic one but the classical definition of an EAD is that it should not be interrupted by an external stimulus but is capable of producing triggered beats on its own, something that is nearly impossible during maintained rapid pacing. Nevertheless, it is important to keep in mind that the outcome on APD, MDP and arrhythmogenesis is very much the same for both forms of late depolarization.
Modeling results and arrhythmogenesis
Our computational model reveals that TCWs interact with Vm to destabilize the propagation of a planar wave in simulated 2D tissue. We find that the large increase in Ca2+ release during TCWs slows repolarization which promotes conduction block. This effect is heterogeneous in tissue and can therefore induce localized conduction block during rapid pacing because TCWs are stochastic and regions of tissue that are far apart can undergo conduction block at different paced beats. Thus, a uniform planar wave in 2D tissue can fractionate due to the random distribution of TCWs in the cell. It is this localized conduction block, due to the underlying cellular stochasticity, that induces the formation of reentrant patterns in tissues made up of many cells exhibiting TCWs. These results suggest that TCWs are highly arrhythmogenic, especially in the setting of HF where TCWs occur over a wider range of heart rates. However, we point out that the dynamics of spiral and scroll waves in atrial tissue with TCWs is still not well understood. Given that TCWs are stochastic and induce localized conduction block, it is possible that TCWs may serve as an important mechanism to destabilize reentrant patterns and promote wave break. Thus, TCWs may play a crucial role in both the initiation and maintenance of atrial fibrillation. Finally, our simulation results demonstrate that low atrial IK1 density exaggerates the effect of INCX on voltage repolarization in these cells. Thus, atrial tissue exhibits key electrophysiological properties that make it prone to fibrillation in the presence of TCWs.
Limitations of the Study
One of the major limitations of this study is the lack of specificity of NCX blockers. We initially used SEA0400 because it was considered to be effective and potent but we then became aware of the literature that this agent blocks up to about 1/3 of ICa, which would reduce Ca2+ influx both in terms of trigger Ca2+ and Ca2+ available to load the SR. We then performed some additional experiments using another NCX blocker (ORM10103) which is thought to have fewer secondary actions and obtained virtually identical effects on depolarization of the MDP as SEA. Interestingly, we found it necessary to use a higher concentration of ORM than SEA but the fact that a nearly identical outcome was obtained suggests similar pharmacological actions despite a lower potency. As a result of the experiments performed with the two structurally-unrelated NCX blockers, we are confident that our conclusions concerning the critical role of NCX current in TCW-induced depolarization are correct.
Another limitation of the study was that our recordings of AP upstroke did not allow us to measure depolarization rate because of the large stimulus artifact during depolarization. This was unfortunate because direct measurements of take-off potential and depolarization rate during the AP upstroke would have allowed us to relate directly the role of ICa and slow action potentials in atrial activation during depolarization of the MDP induced by TCWs.
Conclusions
Our results suggest that atrial TCWs produce dramatic changes in cellular electrophysiology and that these changes in cellular function may establish repolarization gradients that could initiate reentrant atrial arrhythmias. This behavior represents an instance in which an essentially subcellular Ca2+ event might affect atrial cell and tissue electrophysiology in a way that could establish the substrate for AF, a notion that is supported by our simulations. In HF, where ICa is unaltered and IK1 is small, it is possible that TCWs might be involved in the initiation of paroxysmal AF which is a common co-morbidity with HF. In contrast, persistent AF is associated with a decrease in ICa and an increase in IK1, both of which are likely to reduce the vulnerability to TCW formation and their influence on membrane depolarization and therefore a possible role for this form of abnormal Ca2+ cycling in sustained AF. Furthermore, our results suggest that not only should we consider the potential role for TCWs in AF, especially in failing hearts, but also that TCWs could be a potential target for intervention to interfere with the potential arrhythmogenic contributions of TCWs.
Supplementary Material
What is Known:
A unique form of abnormal intracellular calcium cycling called triggered calcium waves can occur during pacing in normal and failing dog atrial myocytes
Triggered calcium waves are also found in human atrial myocytes
Many types of both normal and abnormal calcium cycling affect action potentials in cardiac myocytes and may contribute to arrhythmias
What the Study Adds:
Triggered calcium waves prolong dog atrial action potentials and depolarize maximum diastolic potential (as much as 30–40mV) and may affect several consecutive action potentials.
The depolarization was the result of inward current from activation of the sodium, calcium exchanger in response to the calcium waves and the resulting low take-off potentials could cause slowly-propagated action potentials that promote reentry.
Computer modeling shows that the depolarization induced by triggered waves may produce repolarization gradients, wavebreak and reentry and atrial arrhythmias that could contribute to atrial fibrillation
Acknowledgments
Sources of Funding: This work was supported by National Heart Lung and Blood Institute of the National Institutes of Health [HL R01-119095 to YS and JAW; HL057832, HL132871 and HL134781 to LAB; and RO1HL125881 and RO1HL140061 to RA]. Additional support was provided by The National Science Foundation Grant No. [PHY-1748958] and National Institutes of Health [R25GM067110] and the Gordon and Betty Moore Foundation [ 2919.01].
Nonstandard Abbreviations and Acronyms
- AF
Atrial Fibrillation
- AP
Action Potential
- APD
Action Potential Duration
- APD-20, APD-50
Action Potential Duration At −20 and −50mV During Repolarization
- CL
Cycle Length
- CV
Conduction Velocity
- DAD
Delayed Afterpotential
- EAD
Early Afterpotential
- INCX
Na-Ca Exchange Current
- IK1
Inward Rectifier Potassium Current
- IKr/IKs
Rapid and Slow Components of the Delayed Rectifier Potassium Current
- Ito
Transient Outward Potassium Current
- LTCC
L-type Calcium Channel
- MDP
Maximum Diastolic Potential
- NCX
Na-Ca Exchange
- ORM
The NCX Blocker ORM10103
- SCW
Spontaneous Calcium Wave
- SEA
The NCX Blocker SEA0400
- SR
Sarcoplasmic Reticulum
- TCW
Triggered Calcium Wave
- TT
Transverse (T)-tubules
- Vm
Membrane Potential
Footnotes
Disclosures: None
References:
- 1.Lau DH, Nattel S, Kalman JM, Sanders P. Modifiable Risk Factors and Atrial Fibrillation. Circulation. 2017;136:583–596. [DOI] [PubMed] [Google Scholar]
- 2.Laredo M, Waldmann V, Khairy P, Nattel S. Age as a Critical Determinant of Atrial Fibrillation: A Two-sided Relationship. Can J Cardiol. 2018;34:1396–1406. [DOI] [PubMed] [Google Scholar]
- 3.Hohendanner F, Heinzel FR, Blaschke F, Pieske BM, Haverkamp W, Boldt HL, Parwani AS. Pathophysiological and therapeutic implications in patients with atrial fibrillation and heart failure. Heart Fail Rev. 2018;23:27–36. [DOI] [PubMed] [Google Scholar]
- 4.Hohendanner F, Messroghli D, Bode D, Blaschke F, Parwani A, Boldt LH, Heinzel FR. Atrial remodelling in heart failure: recent developments and relevance for heart failure with preserved ejection fraction. ESC Heart Fail. 2018;5:211–221. [DOI] [PMC free article] [PubMed] [Google Scholar]
- 5.Molina CE, Abu-Taha IH, Wang Q, Rosello-Diez E, Kamler M, Nattel S, Ravens U, Wehrens XHT, Hove-Madsen L, Heijman J, et al. Profibrotic, Electrical, and Calcium-Handling Remodeling of the Atria in Heart Failure Patients With and Without Atrial Fibrillation. Front Physiol. 2018;9:1383. [DOI] [PMC free article] [PubMed] [Google Scholar]
- 6.Denham NC, Pearman CM, Caldwell JL, Madders GWP, Eisner DA, Trafford AW, Dibb KM. Calcium in the Pathophysiology of Atrial Fibrillation and Heart Failure. Front Physiol. 2018;9:1380. [DOI] [PMC free article] [PubMed] [Google Scholar]
- 7.Aistrup GL, Arora R, Grubb S, Yoo S, Toren B, Kumar M, Kunamalla A, Marszalec W, Motiwala T, Tai S, et al. Triggered intracellular calcium waves in dog and human left atrial myocytes from normal and failing hearts. Cardiovascular research. 2017;113:1688–1699. [DOI] [PMC free article] [PubMed] [Google Scholar]
- 8.Shiferaw Y, Aistrup GL, Wasserstrom JA. Synchronization of Triggered Waves in Atrial Tissue. Biophysical journal. 2018;115:1130–1141. [DOI] [PMC free article] [PubMed] [Google Scholar]
- 9.Shiferaw Y, Aistrup GL, Wasserstrom JA. Mechanism for Triggered Waves in Atrial Myocytes. Biophysical journal. 2017;113:656–670. [DOI] [PMC free article] [PubMed] [Google Scholar]
- 10.Maxwell JT, Blatter LA. A novel mechanism of tandem activation of ryanodine receptors by cytosolic and SR luminal Ca(2+) during excitation-contraction coupling in atrial myocytes. J Physiol. 2017;595:3835–3845. [DOI] [PMC free article] [PubMed] [Google Scholar]
- 11.Yeh YH, Wakili R, Qi XY, Chartier D, Boknik P, Kaab S, Ravens U, Coutu P, Dobrev D, Nattel S. Calcium-handling abnormalities underlying atrial arrhythmogenesis and contractile dysfunction in dogs with congestive heart failure. Circ Arrhythm Electrophysiol. 2008;1:93–102. [DOI] [PubMed] [Google Scholar]
- 12.Arora R, Aistrup GL, Supple S, Frank C, Singh J, Tai S, Zhao A, Chicos L, Marszalec W, Guo A, Song LS, Wasserstrom JA. Regional distribution of T-tubule density in left and right atria in dogs. Heart Rhythm. 2016; 14:273–281. [DOI] [PMC free article] [PubMed] [Google Scholar]
- 13.Kockskamper J, Sheehan KA, Bare DJ, Lipsius SL, Mignery GA, Blatter LA. Activation and propagation of Ca(2+) release during excitation-contraction coupling in atrial myocytes. Biophys J. 2001;81:2590–605. [DOI] [PMC free article] [PubMed] [Google Scholar]
- 14.Schmidt C, Wiedmann F, Zhou XB, Heijman J, Voigt N, Ratte A, Lang S, Kallenberger SM, Campana C, Weymann A, et al. Inverse remodelling of K2P3.1 K+ channel expression and action potential duration in left ventricular dysfunction and atrial fibrillation: implications for patient-specific antiarrhythmic drug therapy. Eur Heart J. 2017;38:1764–1774. [DOI] [PubMed] [Google Scholar]
- 15.Workman AJ, Pau D, Redpath CJ, Marshall GE, Russell JA, Norrie J, Kane KA, Rankin AC. Atrial cellular electrophysiological changes in patients with ventricular dysfunction may predispose to AF. Heart Rhythm. 2009;6:445–51. [DOI] [PMC free article] [PubMed] [Google Scholar]
- 16.Schmidt C, Wiedmann F, Voigt N, Zhou XB, Heijman J, Lang S, Albert V, Kallenberger S, Ruhparwar A, Szabo G, et al. Upregulation of K(2P)3.1 K+ Current Causes Action Potential Shortening in Patients With Chronic Atrial Fibrillation. Circulation. 2015;132:82–92. [DOI] [PubMed] [Google Scholar]
- 17.Tseng GN. Calcium current restitution in mammalian ventricular myocytes is modulated by intracellular calcium. Circ Res. 1988;63:468–82. [DOI] [PubMed] [Google Scholar]
- 18.Nahhas AF, Kumar MS, O’Toole MJ, Aistrup GL, Wasserstrom JA. Can triggered arrhythmias arise from propagation of calcium waves between cardiac myocytes? Front Biosci (Elite Ed). 2013;5:893–9. [DOI] [PubMed] [Google Scholar]
- 19.Pogwizd SM, Schlotthauer K, Li L, Yuan W, Bers DM. Arrhythmogenesis and contractile dysfunction in heart failure: Roles of sodium-calcium exchange, inward rectifier potassium current, and residual beta-adrenergic responsiveness. Circ Res. 2001;88:1159–67. [DOI] [PubMed] [Google Scholar]
- 20.Sakakibara Y, Furukawa T, Singer DH, Jia H, Backer CL, Arentzen CE, Wasserstrom JA. Sodium current in isolated human ventricular myocytes. Am J Physiol. 1993;265:H1301–9. [DOI] [PubMed] [Google Scholar]
- 21.Sakakibara Y, Wasserstrom JA, Furukawa T, Jia H, Arentzen CE, Hartz RS, Singer DH. Characterization of the sodium current in single human atrial myocytes. Circ Res. 1992;71:535–46. [DOI] [PubMed] [Google Scholar]
- 22.Schlotthauer K, Bers DM. Sarcoplasmic reticulum Ca(2+) release causes myocyte depolarization. Underlying mechanism and threshold for triggered action potentials. Circ Res. 2000;87:774–80. [DOI] [PubMed] [Google Scholar]
- 23.Burashnikov A, Antzelevitch C. Reinduction of atrial fibrillation immediately after termination of the arrhythmia is mediated by late phase 3 early afterdepolarization-induced triggered activity. Circulation. 2003;107:2355–60. [DOI] [PubMed] [Google Scholar]
- 24.Burashnikov A, Antzelevitch C. Late-phase 3 EAD. A unique mechanism contributing to initiation of atrial fibrillation. Pacing Clin Electrophysiol. 2006;29:290–5. [DOI] [PMC free article] [PubMed] [Google Scholar]
- 25.Bers DM, Pogwizd SM, Schlotthauer K. Upregulated Na/Ca exchange is involved in both contractile dysfunction and arrhythmogenesis in heart failure. Basic Res Cardiol. 2002;97 Suppl 1:I36–42. [DOI] [PubMed] [Google Scholar]
- 26.Cordeiro JM, Zeina T, Goodrow R, Kaplan AD, Thomas LM, Nesterenko VV, Treat JA, Hawel L 3rd, Byus C, Bett GC, et al. Regional variation of the inwardly rectifying potassium current in the canine heart and the contributions to differences in action potential repolarization. J Mol Cell Cardiol. 2015;84:52–60. [DOI] [PMC free article] [PubMed] [Google Scholar]
- 27.Li GR, Lau CP, Ducharme A, Tardif JC, Nattel S. Transmural action potential and ionic current remodeling in ventricles of failing canine hearts. Am J Physiol Heart Circ Physiol. 2002;283:H1031–41. [DOI] [PubMed] [Google Scholar]
- 28.Qu Z, Xie LH, Olcese R, Karagueuzian HS, Chen PS, Garfinkel A, Weiss JN. Early afterdepolarizations in cardiac myocytes: beyond reduced repolarization reserve. Cardiovasc Res. 2013;99:6–15. [DOI] [PMC free article] [PubMed] [Google Scholar]
Associated Data
This section collects any data citations, data availability statements, or supplementary materials included in this article.


