Abstract
We present a tomographic imaging technique, termed Deep Prior Diffraction Tomography (DP-DT), to reconstruct the 3D refractive index (RI) of thick biological samples at high resolution from a sequence of low-resolution images collected under angularly varying illumination. DP-DT processes the multi-angle data using a phase retrieval algorithm that is extended by a deep image prior (DIP), which reparameterizes the 3D sample reconstruction with an untrained, deep generative 3D convolutional neural network (CNN). We show that DP-DT effectively addresses the missing cone problem, which otherwise degrades the resolution and quality of standard 3D reconstruction algorithms. As DP-DT does not require pre-captured data or pre-training, it is not biased towards any particular dataset. Hence, it is a general technique that can be applied to a wide variety of 3D samples, including scenarios in which large datasets for supervised training would be infeasible or expensive. We applied DP-DT to obtain 3D RI maps of bead phantoms and complex biological specimens, both in simulation and experiment, and show that DP-DT produces higher-quality results than standard regularization techniques. We further demonstrate the generality of DP-DT, using two different scattering models, the first Born and multi-slice models. Our results point to the potential benefits of DP-DT for other 3D imaging modalities, including X-ray computed tomography, magnetic resonance imaging, and electron microscopy.
1. Introduction
There are a variety of microscopes that can obtain high-resolution images in three dimensions, including scanning confocal microscopes, two-photon microscopes, and light sheet microscopes, to name a few [1]. Most of these methods are geared towards incoherent fluorescent imaging, and cannot produce a quantitative estimation of the 3D refractive index (RI) distributions of thick biological samples. Quantitative RI is useful for a number of reasons - it does not require labeling with fluorescent proteins or dyes, it can directly yield useful measures of cell mass and protein concentration, and it can provide useful information about how light is scattered in thick samples for subsequent imaging system correction, for example [2].
Currently, the primary technique for quantitative 3D RI measurement is diffraction tomography (DT) [3–7]. The first implementations of DT relied on holography to measure the complex field scattered from an object under illumination from a variety of angles. Since DT is a phase-sensitive technique, it requires a highly coherent beam with interferometric stability and some sort of angular scanning mechanism to steer the incident beam through a range of angles. These requirements make its practical implementation relatively complicated and challenging. Several recent techniques have demonstrated DT without a reference beam, instead using intensity-only images and a suitable phase retrieval algorithm for 3D sample reconstruction [8–14]. These methods, which effectively extend Fourier ptychography (FP) techniques into the third dimension [15], remove the need for a highly coherent beam and interferometric stability. Instead, they rely on a programmable LED array to provide angularly-varying illumination, which leads to a simple and compact device that requires no moving parts [16]. While a direct extension of FP into 3D relies on the first Born approximation, other related methods have also used the multi-slice (MS) model (also known as the beam propagation method, BPM) which can incorporate the effects of multiple-scattering [9,10,13,14,17,18].
Since all of the above techniques illuminate a stationary sample from a finite angular extent, and use a single objective lens to collect the scattered light, they all suffer from the missing cone problem (also referred to as the missing wedge) [19]. In both phase-sensitive and intensity-only diffraction tomography, the missing cone manifests itself as a bandlimited transfer function that is zero within a cone surrounding the axis. This limited transfer function produces axial artifacts and underestimates the RI, thus presenting challenges to the accurate 3D reconstruction of thick samples at high resolution.
As we will show, the missing cone problem becomes significantly worse when using low numerical aperture (NA) objective lenses, and thus high-NA objectives are desirable for DT. On the other hand, low-NA objective lenses typically exhibit larger space-bandwidth products (SBPs) than high-NA lenses, since they can image over larger fields of view (FOVs). They also exhibit greater depths of field (and therefore high signal-to-noise ratio (SNR) over a larger axial range), longer working distances, and often fewer aberrations. Low-NA lenses are thus highly desirable for DT, if we hope to achieve multi-gigavoxel 3D reconstructions in the future. There is thus a tradeoff between the NA of the objective and two desirable properties: multi-gigavoxel SBPs and reduced missing cone artifacts. While rotating the sample [20], imaging from multiple angles [21], or at multiple focal planes [22] can potentially help fill in missing spatial frequencies, these experimental modifications significantly complicate a standard microscope setup. Thus, unsurprisingly, there is extensive prior work on computational means to fill in the missing cone, such as using positivity constraints [23–26] and imposing penalties on the spatial image gradient, such as total variation (TV) regularization [24–29]. More recently, data-driven deep-learning-based approaches have also been proposed to fill in the analogous missing wedge in X-ray computed tomography (CT) [30–32]. It has also been shown that accounting for multiple scattering can mitigate the effects of the missing cone (however, this depends on the sample itself exhibiting multiple scattering) [17,33]. Regardless of the forward model employed (e.g., ray-based [23], Born [8], Rytov [4], MS [10,17,18]), or whether or not phase is detected, or the imaging modality itself (e.g., CT, magnetic resonance imaging (MRI), electron microscopy (EM), or standard fluorescence imaging), the missing cone problem is a ubiquitous one and thus addressing it would have far-reaching implications.
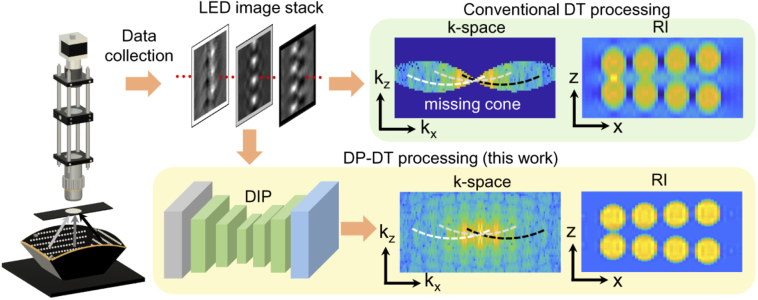
In this work, we propose a new approach to address the missing cone problem, termed Deep Prior Diffraction Tomography (DP-DT), which uses a deep image prior (DIP [34]) as an untrained deep 3D convolutional neural network (CNN) to generate 3D object reconstructions (Fig. 1). Unlike other recent works that propose to use supervised deep learning to aid in computational image reconstruction problems [35–39], including a number of works that rely on multi-angle illumination [30–32,40–43], the technique proposed here does not require any pre-training or dataset-specific assumptions. Instead, during iterative object reconstruction, DP-DT simply performs its optimization updates with respect to the parameters of a CNN, as opposed to directly updating the object voxels. The authors of the original DIP paper [34] found that the structure of CNNs alone has an inherent bias towards natural images. We thus hypothesized that the artifacts induced by the missing cone problem in the spatial domain would be outside of the domain of natural images that are representable by a DIP.
Fig. 1.
Summary of Deep Prior Diffraction Tomography (DP-DT). Microscope captures variably-illuminated image -stack. Standard tomographic reconstruction methods suffer from artifacts caused by a missing cone in -space. In this work, we propose the use of a deep image prior to help account for missing cone artifacts to improve 3D image reconstruction.
Here, since image “naturalness” is difficult to quantify theoretically, in order to determine whether “naturalness” extends to 3D microscopic samples, we empirically confirm our above hypothesis by applying DP-DT to reconstruct a wide variety of 3D samples. In particular, we reconstruct 3D images of beads and biological samples (with both simulated and experimental data) from their associated variably-illuminated intensity-only images, with higher fidelity than alternative regularization techniques like TV regularization and positivity constraints. We furthermore test DP-DT under several different conditions and light propagation models, including the first Born and MS models, and find that the DIP consistently improves 3D reconstruction quality. We also suggest that DP-DT is more general than alternative regularization strategies, as the assumptions of TV regularization and positivity are not always valid, and when they are, they can easily be added into the DP-DT framework. Furthermore, DP-DT does not rely on preexisting datasets, which may be difficult to acquire to learn representations or extract features for object reconstruction. DP-DT thus does not inherit any generalization errors or biases when it is applied to a new types of sample, instead offering a general strategy to improve 3D reconstruction quality.
2. Missing cone problem
To model 3D image formation, we will begin with the first Born approximation, which offers a clear description of the missing cone problem. In general, we can represent the 3D scattering potential of a sample of interest with
| (1) |
where represents the 3D spatial coordinates of the sample, is the vacuum wavenumber, is the surrounding medium’s RI, is the wavelength of light, and is the sample’s RI distribution, which is the unknown quantity of interest that we aim to reconstruct. We note that is complex-valued, where is associated with the index of refraction and is associated with absorption.
If we take the 3D Fourier transform of , we arrive at the sample’s scattering potential spectrum:
| (2) |
where is the 3D wavevector. Under the first Born approximation, a DT system can only measure a finite range of sample wavevectors, bounded by the angular span of incident and observable light [45]. We can represent this limited range of spatial frequencies with a transfer function , which defines the observable information at the imaging plane as . In practice, can be synthesized by taking a superposition of partial spherical shells (i.e., Ewald spheres), with radii set by the wavelength of light, radial extent set by the imaging NA, and whose positions shift along an arc defined by the illumination k-vector (for mathematical details, see Appendix B). This transfer function’s extent in -space shrinks with smaller imaging NAs, even if a large illumination NA is used, resulting in significant blurring in the spatial domain.
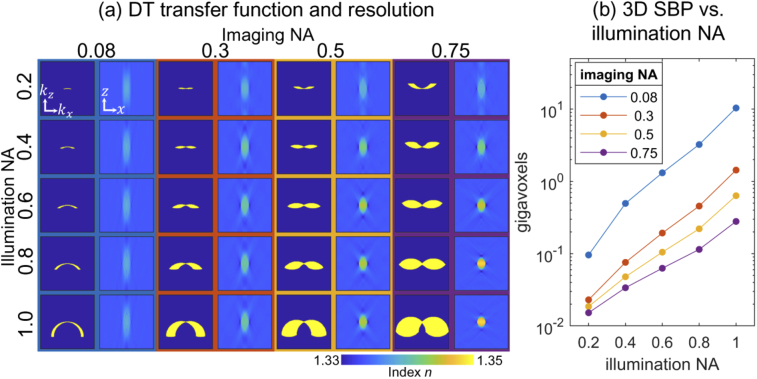
To illustrate this point, we modeled the DT transfer function with variable illumination and imaging NAs in Fig. 2(a). Next to each DT transfer function, we also simulated its effect on a 0.8-µm-diameter bead. In these plots, we show 2D and slices of the 3D transfer functions. Here, we can see that for a fixed imaging NA, increasing the illumination NA only modestly reduces the axial blurring and RI underestimation induced by the missing cone. Unlike 2D synthetic aperture techniques, such as FP, 3D diffraction tomography methods are thus highly dependent on large imaging NAs for high-fidelity tomographic reconstructions.
Fig. 2.
The missing cone problem and its effect on the 3D SBP. (a) Simulations of the effects of transfer functions containing missing cones for a variety of illumination (vertical) and collection (horizontal) NAs. The odd columns are the -space supports of the transfer functions and the even columns are the spatial domain representations of 0.8-µm-diameter bead (=1.35) immersed in water (=1.33), which have been filtered by these transfer functions. (b) 3D SBPs in gigavoxels; 2D fields of view, collection NAs, and magnifications taken from [44]; arbitrarily assumes a 20-µm axial range; please note the semilog scale.
As mentioned above, the use of a high imaging NA unfortunately leads to a much smaller lateral imaging FOV. To explore this point in detail, we numerically computed the 3D SBP for each modeled transfer function, which is equivalent to the total number of resolvable voxels in a DT system for a given imaging lens and illumination configuration (Fig. 2(b)). In particular, we defined the 3D SBP as the product of the 3D -space volume and the 3D spatial reconstruction volume, basing the SBP computation on the FOV of standard microscope objective lenses [44]. Here, we assumed a fixed axial imaging range of 20 µm. We note that although in theory, even under the first Born approximation, the axial range of the reconstruction volume can be unbounded, in practice the axial range is often limited by factors such as the SNR. In any case, selecting a different axial range only re-scales Fig. 2(b)’s y-axis and does not affect the relative comparison between different objective lenses. From this simple analysis, it is clear that lower-NA objectives are desirable for high-throughput tomographic imaging, as they yield significantly larger 3D SBPs. However, such low-NA lenses generate a large missing cone, thus pointing to a critical limitation that must be addressed before it is possible to rapidly acquire high-resolution 3D images.
3. Deep Prior Diffraction Tomography (DP-DT)
To address the above challenge of creating a high-fidelity 3D image reconstruction in the presence of a large missing cone, we propose DP-DT, a forward-model-agnostic framework that merges a deep image prior (DIP) into an iterative tomographic reconstruction process. To demonstrate its versatility, we use DP-DT to improve the quality of 3D sample reconstruction under the assumptions of both the first Born [8] and MS approximations [10,17,18]. While the rest of this section assumes that we are reconstructing with phaseless measurements, we note that the DIP pipeline can easily be applied with different assumed forward models (e.g., [46–48]), and can be also applied to phase-sensitive measurements from traditional DT setups.
3.1. Inverse problem formulation
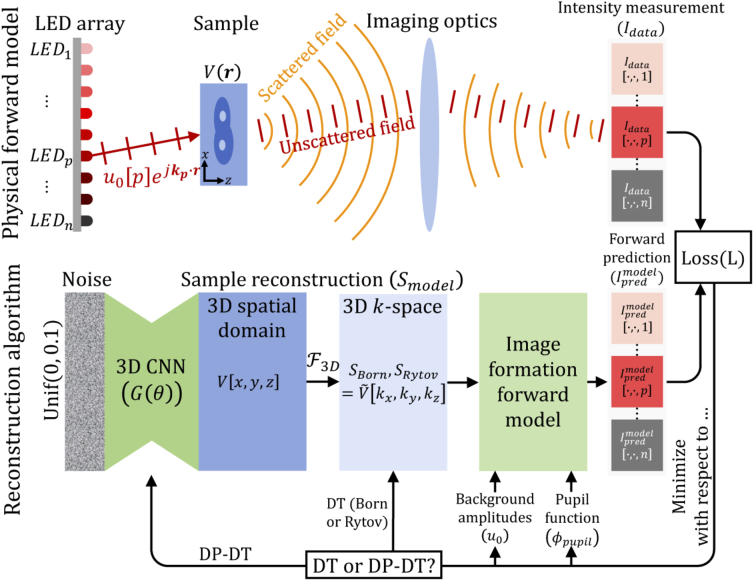
Figure 3 shows a high-level summary of the forward image formation process and the inverse problem formulation, with mathematical details presented in Appendix B. In particular, let be the 3D reconstruction target for a particular . For the first Born and Rytov approximations, and are a discretized, complex-valued 3D scattering potential spectrum tensor, (Eq. (2)), while for the MS approximation, is a complex-valued 3D tensor, that describes the 3D RI distribution of the sample relative to the medium RI. Next, let the forward predictions for the multi-angle 2D images based on these reconstruction targets be given by , where indexes the image under illumination from the LED and specifies the employed forward model. Finally, let be a 3D tensor of experimental intensity measurements (i.e., an LED image stack).
Fig. 3.
The physical forward model and reconstruction algorithm for DP-DT, under the first Born or Rytov approximation.
The error metric we seek to minimize is the mean square error loss,
| (3) |
where and are the optionally optimizable pupil phase and per-LED input field amplitudes (see Appendix B), and is the total number of summed elements. We use the amplitudes rather than the intensities in the loss because it was previously found that the former is more robust to noise and experimental deviations [49]. We may also regularize the reconstruction target to form our final loss function,
| (4) |
We discuss the specific regularization techniques in the next two sections. Thus, the optimization problem for 3D image reconstruction is
| (5) |
For the first Born and Rytov approximations, once is optimized, we can use Eq. (1) to infer the complex 3D RI distribution.
While we have described intensity-based DT, which is afforded by our LED array setup on a standard microscope, it is straightforward to extend our framework to describe holographic DT setups that also measure phase.
3.2. Deep image prior (DIP)
Directly minimizing can be problematic, given the effects of the missing cone. The DIP is a recently-presented, data-independent method to assist with a large variety of inverse image reconstruction problems without supervised training [34,50–54]. It is an untrained regularization technique that reparameterizes the reconstruction target in the spatial domain as the output of a deep generative CNN that uses pseudorandom noise as input (see Fig. 11 in Appendix A for the architecture we used). After initializing the CNN with pseudorandom noise, DIP optimization then proceeds to update CNN weights to minimize loss, as opposed to directly optimizing the reconstruction target (). Here, we hypothesize that the DIP’s resistance to unnatural images extends to the third dimension and can help eliminate missing cone artifacts in diffraction tomography.
Compared to the DIP, other recently proposed techniques based on deep neural networks for FP reconstruction [55–59] all rely on pretraining, and hence are inherently biased towards a particular set of examples found in the training data set. Furthermore, these techniques were primarily applied to 2D reconstruction. However, while the 2D FP inverse problem is well-posed if the LEDs are sufficiently densely packed (i.e., to obtain overlap [60]), the 3D FP inverse problem is always ill-posed due to the missing cone, no matter how densely packed the LEDs are. Hence, the 3D inverse problem presents a more significant challenge that could benefit more significantly from the DIP.
To incorporate the DIP reparameterization into our framework, we modify Eq. (5), for the first Born (or Rytov) and MS forward models, respectively:
| (6) |
| (7) |
where is deep generative CNN parameterized by . Equations (6) and (7) are the final optimization problems for DP-DT. Note that outputs a prediction for the 3D object in the spatial domain, and thus we take its Fourier transform to get in Eq. (6). However, regardless of the form of , it is critical to note that the optimization now is performed with respect to , which are the weights within the CNN.
3.3. Other regularization
It is straightforward to also include other well-known regularization methods in Eq. (4), in particular TV and positivity regularization, to which we compare our proposed approach. We used the isotropic TV regularization, given by
| (8) |
where spatial gradients are approximated by finite differences. TV regularization promotes piecewise smoothness by encouraging sparsity in reconstruction gradients.
The positivity constraint that we test is applied to the real part of the RI under the assumption that the sample index does not fall below that of the immersion medium, noting in Fig. 2 that one manifestation of the missing cone problem is negative index value artifacts:
| (9) |
This expression returns 0 when the real part of the RI is above the immersion RI, and a quadratic penalty otherwise.
Note that both of these regularization terms are differentiable almost everywhere and thus are suitable for gradient-based optimizers. The modified loss function to be minimized is thus
| (10) |
where and are regularization coefficients tuning the respective relative contributions. Unless otherwise specified, the DIP-based reconstructions do not include these extra positivity or TV regularization terms.
4. Results
4.1. Setup for experiments and simulations
In this section, we demonstrate the effectiveness of DP-DT in both simulation and experiment. Our experimental setup (previously described in Ref. [8]) consists of a standard microscope equipped with an infinity-corrected 20 objective lens (NA=0.4, Olympus MPLN), an 8-bit camera with 19201456 4.54-µm pixels (Prosilica GX 1920), and a 3131 LED array as the illumination source (SMD3528, center wavelength = 632 nm, 4-mm LED pitch), positioned below the sample to give an illumination NA of approximately 0.4. In our simulations, we used the same setup, but varied the distance between the LED board and the sample to tune the illumination NA, and varied the diameter of the aperture function (, see Appendix B) to tune the imaging NA. For experimental results, we ignored the dark-field images from the corners of the LED array due to a low SNR, resulting in a total of 641 multi-LED images. However, for simulations, we used all 3131 LEDs in a centered square grid, computationally increasing the exposure (or equivalently, the illumination intensity) for the dark-field LEDs to boost the detected image SNR. To make simulations more realistic, we added Poisson-distributed noise to the forward intensity predictions, assuming a pixel well depth of 50,000 photoelectrons, and discretized the result into 8 bits. To ensure that the regularizers are only accounting for the missing cone, we simulated samples that approximately followed the first Born approximation and used this scattering model for both simulation and reconstruction. We also note that jointly optimizing the pupil function did not make much of a difference in terms of the reconstruction quality, and we thus did not end up doing so for either the simulated or experimental results.
We specified the forward model and performed gradient descent using the Adam optimizer [61] in TensorFlow [62]. The code will be available at https://deepimaging.io/projects/deep-prior-diffraction-tomography. To accelerate optimization, we used a NVIDIA Tesla T4 GPU on the Google Cloud Platform. By default, we use the entire dataset per optimization step if it fit within the GPU’s 16 GB of memory. Otherwise, we split the dataset into roughly evenly-sized batches along the LED dimension such that the batches each fit in memory. After every full pass through the dataset (i.e., an epoch), we reshuffled the data along the LED dimension before splitting into a new set of batches. Optimization times depend on the FOV, the batch size, whether DIP is used (DIP requires several times more iterations), and which scattering model is used (the MS model is more computationally expensive than the first Born model). For our experimental implementation, each iteration was on the order of seconds, resulting in optimization times on the order of minutes to an hour (100s to 1000s of iterations) without DIP, and several hours (10s of 1000s of iterations) with DIP.
4.2. Bead simulation results
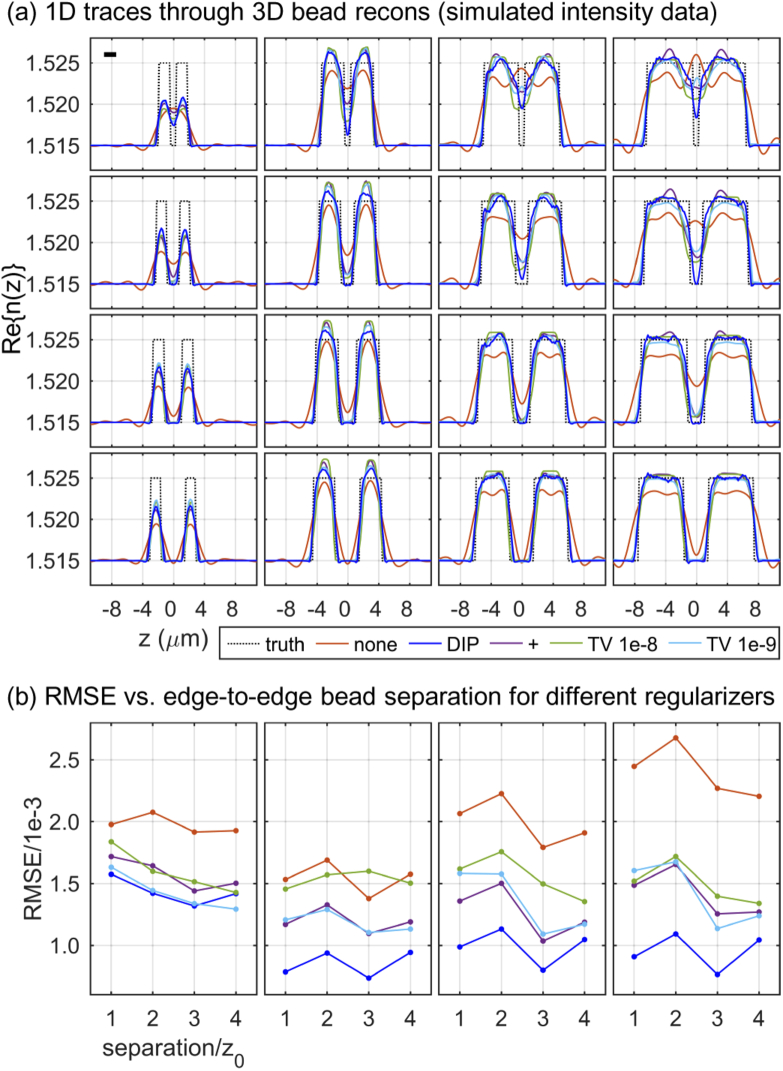
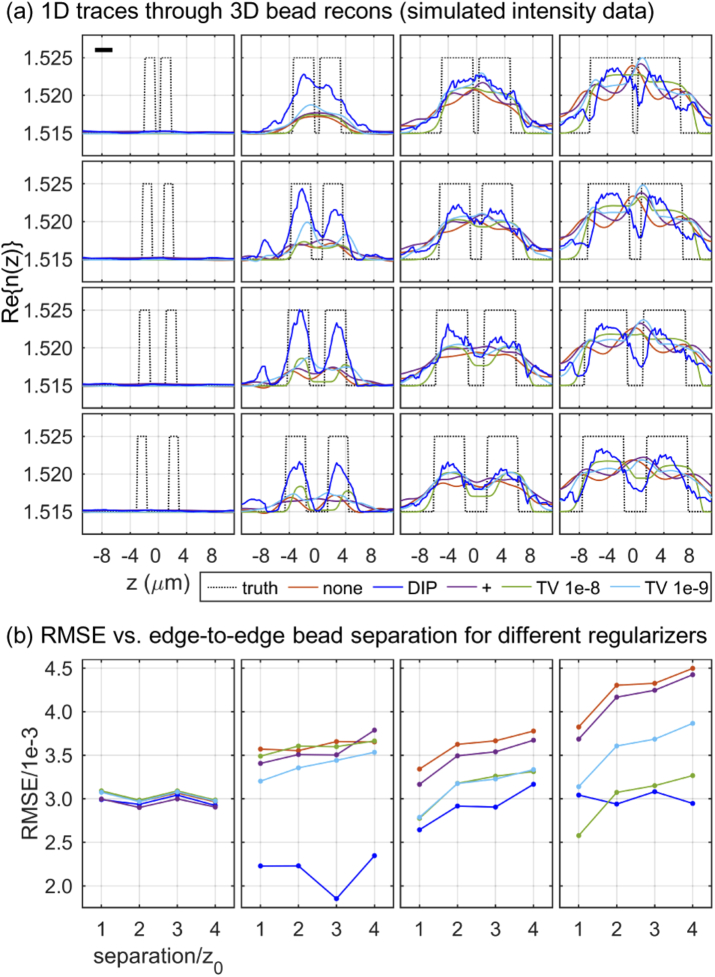
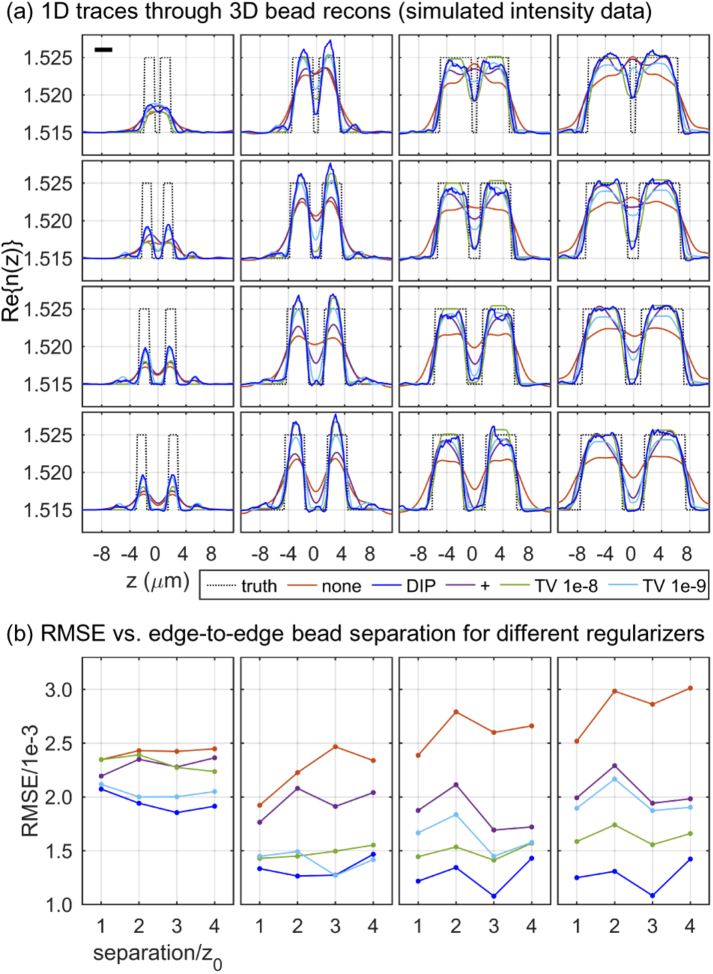
First, to test the axial resolution of DP-DT, we simulated 3131 intensity-only images under the first Born approximation from pairs of 3D beads (=1.525, on a background of =1.515) of various sizes and various axial spacings under illumination from a spatially coherent LED array. We tested multiple imaging NAs (0.1, 0.3, 0.5) and a fixed illumination NA of 0.4. We reconstructed the 3D RI map of the bead phantom using the following priors: none, DIP, positivity, TV (=1e-8), and TV (=1e-9). Figure 4 summarizes these results for a 0.5 imaging NA, showing 1D axial RI cross-sections through the center of the 3D bead reconstructions (Fig. 4(a)), as well as the root mean square error (RMSE) of these 1D axial profiles with respect to the ground truth (Fig. 4(b)). We can see that DP-DT performs as well as or better than the other regularizers. In particular, in all four columns of Fig. 4(a), there are separations for which the dip in between the two beads is deeper for DP-DT than the other regularization strategies, and in almost all cases DP-DT has a smaller RMSE than the other regularized results (Fig. 4(b)). Similar observations apply to the imaging NAs of 0.1 and 0.3 (Figs. 12 and 13 in Appendix C).
Fig. 4.
Comparison of 3D reconstruction quality for phaseless DT using several regularizers. (a) 1D traces through simulations of two beads spaced axially. Rows show different bead axial separations, while columns show different bead sizes (imaging NA = 0.4, illumination NA = 0.5). Each curve corresponds to a different regularization technique (i.e., none, DIP, positivity (+), and TV) and ground truth. Scale bar corresponds to the Nyquist period. (b) The RI RMSEs from the ground truths for each regularizer. Each of the four plots corresponds to a different bead size, and each curve corresponds to a different edge-to-edge bead separation, where 0.75 µm.
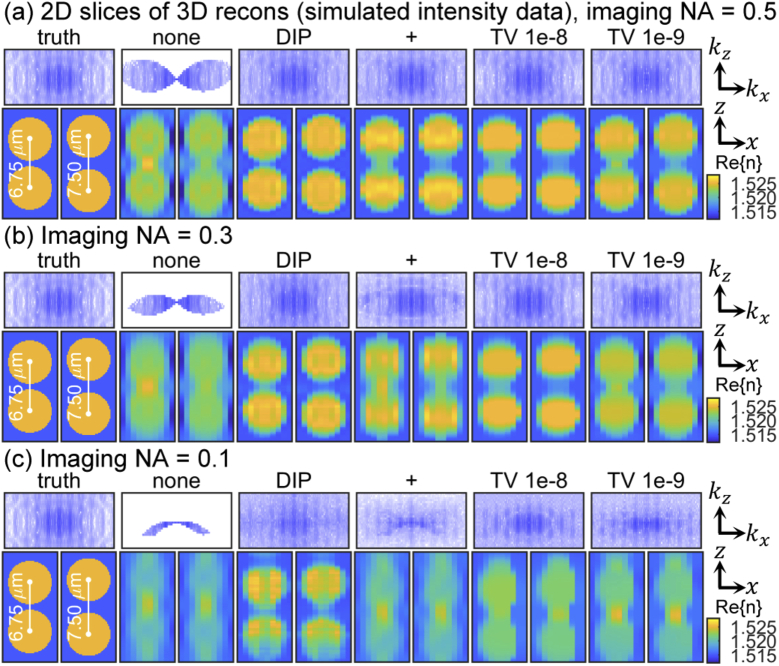
Figure 5 shows select 2D RI cross-sections for the largest particular bead size and the two closest separations, from which we can see that the gaps between the two beads for DP-DT is more pronounced and faithful to the ground truth, compared to the other regularization techniques. Note that even though this sample is ideally suited for a TV prior, as it is piecewise smooth, DP-DT still produces superior results. We emphasize that for DP-DT the network was not pretrained to prefer such reconstructions; rather, these results were innately preferred by the DIP’s CNN structure.
Fig. 5.
2D cross-sections of select simulated bead pairs. (a) The first row is the through-origin cross-sections of the scattering potential spectra of the reconstructions containing all the bead pairs, under illumination NA = 0.4, imaging NA = 0.5. The second row shows through-center cross sections at two different separations. (b) The same information as (a), but under imaging NA = 0.3. (c) The same information as (a), but under imaging NA = 0.1.
4.3. Biological simulation results
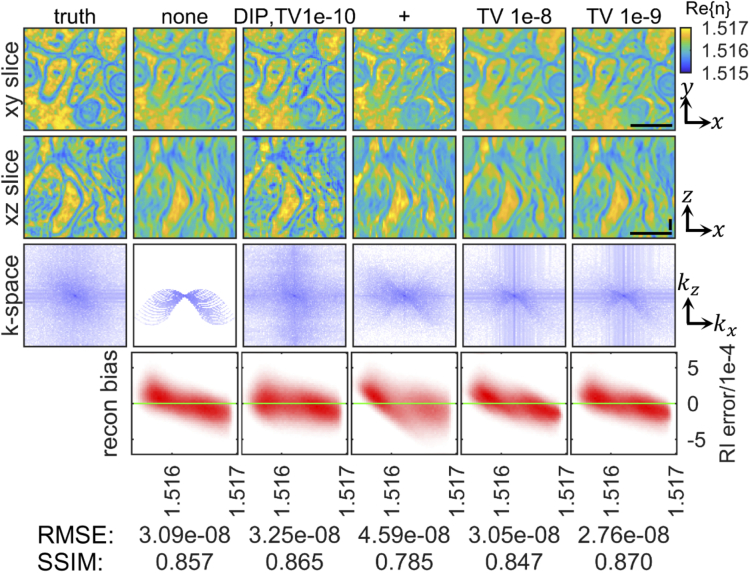
It is expected that TV-regularized reconstructions would perform well for bead samples, because such samples contain regions of uniform RIs. Thus, we also simulated a more complicated and realistic biological sample, based upon 3D isotropic EM images of hippocampal cells [63], for which the smoothness imposed by TV regularization may not be as appropriate an assumption. To convert the 3D EM data into a ground-truth 3D RI map, we renormalized its voxelized measurements to extend from 1.515 (i.e., ) to 1.517. With this rescaled dataset as the 3D RI, we used the first Born approximation to simulate 2D multi-LED intensity images, using an imaging NA of 0.2 and illumination NA of 0.4. The reconstruction results, assuming the same priors as used for the bead simulation (none, DIP+TV 1e-10, positivity, TV 1e-8, and TV 1e-9) are shown in Fig. 6. Note that the DIP reconstruction contains a small amount of TV regularization, which we found produced better results than DIP alone [50]. While in the dimensions (Fig. 6, first row), the reconstructions look similar across the different priors, in the dimensions (Fig. 6, second row), TV regularization only axially blurs the reconstruction. Furthermore, positivity regularization does not offer much improvement over the non-regularized reconstruction. However, DP-DT is able to estimate a significant amount of information in the missing cone, which is also apparent when considering the cross-sections of the scattering potential spectra (Fig. 6, third row).
Fig. 6.
Simulated biological sample, reconstructed under various regularizers. The first row shows an cross-section of the reconstruction volume, the second row shows and cross-section, and the third row shows the through-origin cross-section of the scattering potential spectrum. The fourth row shows 2D histograms, where the vertical axis is the RI error from the ground truth and the horizontal axis is the ground truth RI. Scale bars, 15 µm.
To quantify the comparisons of the different techniques, we computed the RMSE and the structural similarity (SSIM) index [64], which are displayed at the bottom of Fig. 6. While DP-DT did not produce the best statistics, its reconstruction visually exhibits less blurring and fewer artifacts. We also found that DP-DT produces less biased estimates of RI compared to all the other techniques (Fig. 6, last row). In particular, while the non-DIP approaches exhibit reconstructions that overestimate RI for low RI values, and underestimate RI for high RI values (as one would expect for spatial blurring), DP-DT produces unbiased estimates for low RI values and less biased results for high RI values (i.e., its flatter red histogram indicates a more consistent bias-variance tradeoff with respect to RI). This is a unique property of DIP, as most conventional regularization techniques trade off unbiasedness for lower variance in their estimations.
4.4. Experimental results, first Born approximation
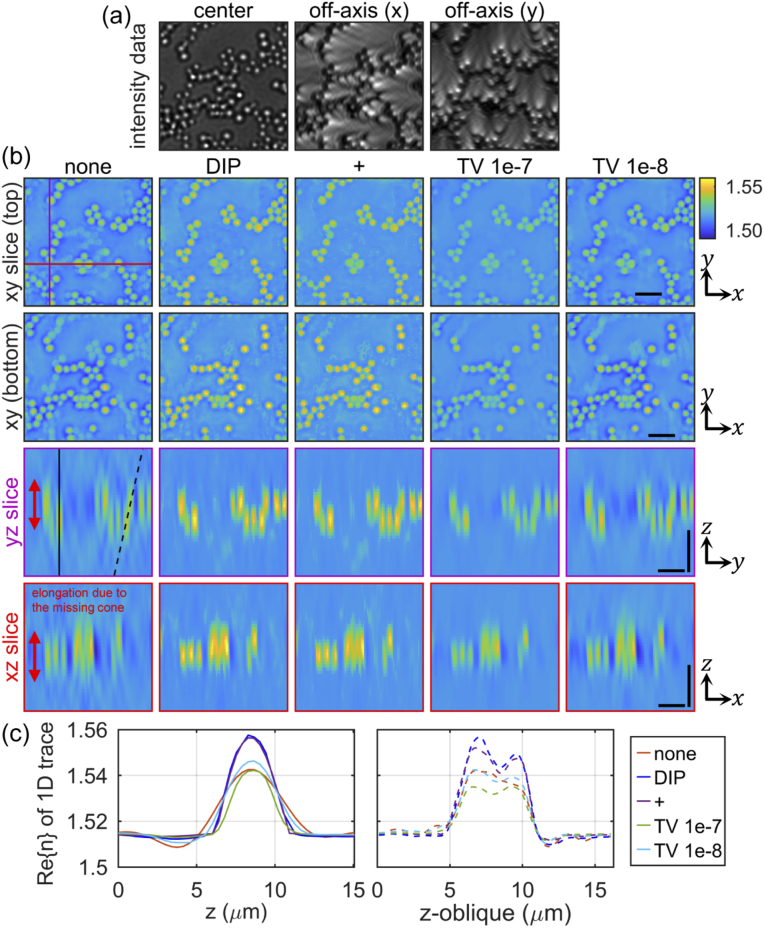
To experimentally test DP-DT with phaseless 3D imaging data, we first examined its imaging performance using two bead phantom samples. We first created a bead phantom consisting of two layers of 2-µm-diameter beads (=1.59), separated by 3.9 µm and embedded in oil (=1.515). We reconstructed the 3D RI map of this two-layer sample under the first Born approximation, using no prior, DIP, positivity, TV (=1e-7), and TV (=1e-8). The top two rows of Fig. 7(b) shows two cross-sections at the two layers of interest. Without regularization, there is leakage of information between layers, preventing clean separation, due to the missing cone artifact. This is also apparent in the and slices (Fig. 7(b), bottom two rows). While all of the regularized reconstructions were effective to some extent in reducing this artifact, reconstructions with no regularization and with TV show severely underestimated bead RIs. DIP- and positivity-regularized reconstructions were less underestimated. RI underestimation is seen more clearly in Fig. 7(c), which show 1D traces in the plane, among with DP-DT shows the least underestimation. The remaining RI underestimation may be explained by the small bead sizes, noting that there is also RI underestimation in the reconstructions of our simulated beads in the first column of Fig. 4, even for DP-DT (also note that for the closest separations, DP-DT has the lowest degree of RI underestimation). Also, the beads in Fig. 7 are not axially resolved fully, consistent with the incomplete separation in the upper left panel of Fig. 4. Differences between our simulated and experimental results (i.e., better axial separation in simulation) may be attributed to imperfections in our experimental setup, most notably the challenge of establishing an exact correspondence between the estimated and true LED positions, and perhaps the assumed scattering model. As shown in section 4.5 below, DP-DT using the MS model both reduces the degree of RI underestimation and improves the separation between the two bead layers.
Fig. 7.
Experimental 2-layer, 2-µm bead results, using the first-Born model. (a) Example raw LED images. (b) Comparison of performance of different regularizers (columns). The first two rows are slices through the two bead layers, and the last two rows are two axial slices whose positions are indicated by the red and magenta lines in the upper left plot. Please note the double-headed arrows, indicating axial elongation due to the missing cone when no regularization is used. Scale bars, 5 µm. (c) 1D traces through regions indicated in the first panel of the slice row. The expected RI of the beads is 1.59.
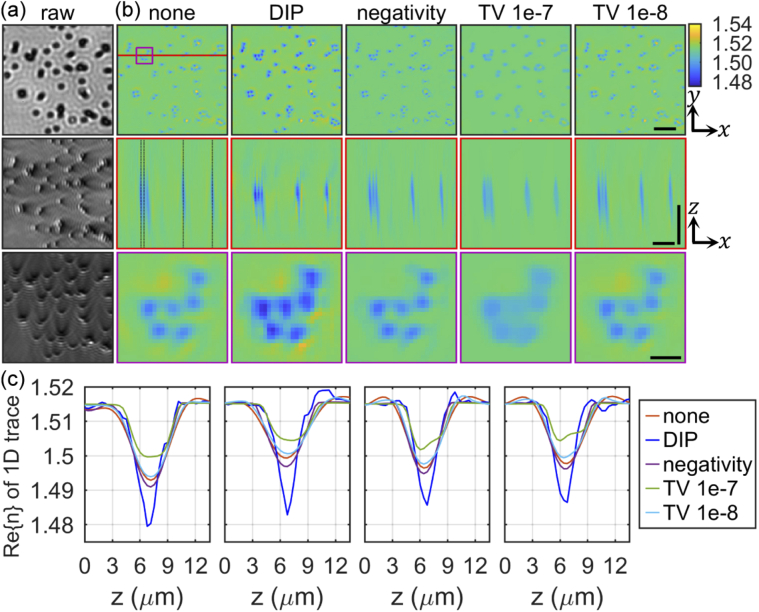
Our second experimental target consisted of a single layer of 800-nm-diameter beads with an unspecified RI below that of the embedding oil (=1.515). We reconstructed the 3D RI map using the same priors as for the 2-layer bead sample (Fig. 8), with positivity regularization replaced with negativity regularization, because the 800-nm bead samples exhibited RI values lower than that of the medium. Note the enhanced lateral resolution in all reconstructions with respect to the raw data, as expected via DT aperture synthesis. The more heavily TV-regularized result (=1e-7), while exhibiting reduced axial missing cone artifacts, has a reduced lateral resolution compared to the other reconstructions (Fig. 8(b), bottom row). Furthermore, as with the 2-layer sample, we found that the RI difference estimate for the unregularized and the TV-regularized reconstructions were underestimated, unlike for the DP-DT result (Fig. 8). Finally, we note that the DP-DT reconstruction contains more energy concentrated at the center of the beads along the axial dimension, demonstrating that the DP-DT is successful in reducing the effects of the missing cone.
Fig. 8.
Experimental 800-nm bead sample. (a) Example raw LED images. (b) Comparison of different regularizers, with the positivity replaced with negativity regularization because the RI is below that of the medium. The first row is cross-sections and the second row is cross-sections indicated by the red line. The third row shows a close-up view of the first row, indicated by the purple box. Scale bars, 5 µm (top two rows of (b)), 1 µm (bottom row of (b)). (c) 1D axial traces through the vertical dotted lines in the second row of (b).
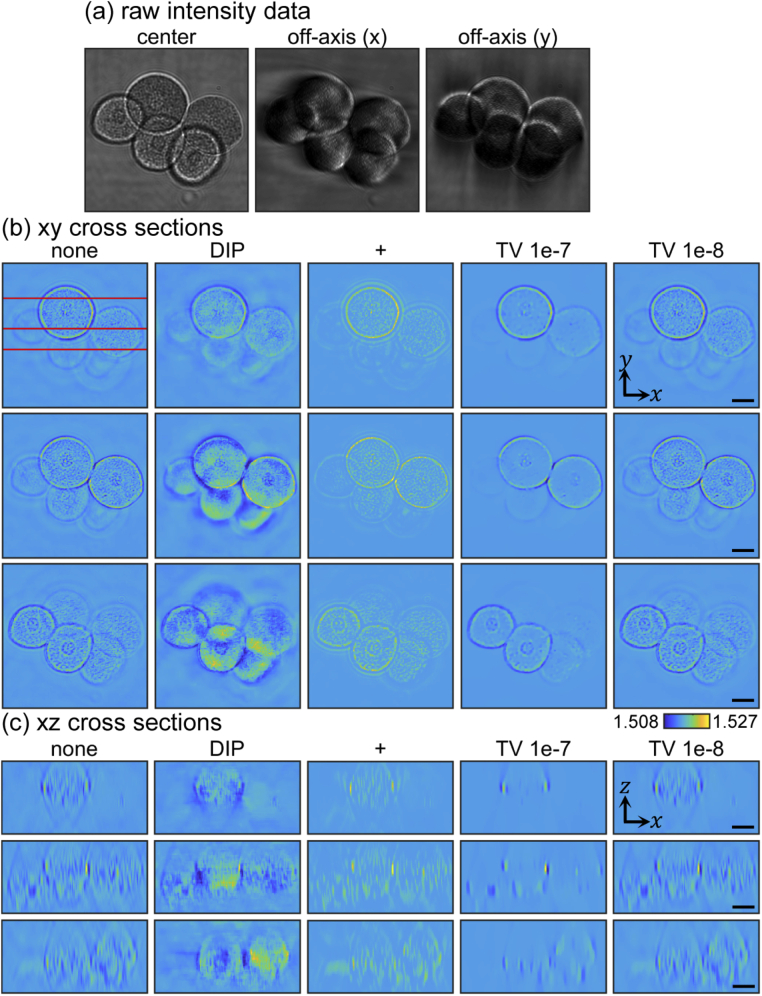
As the final sample, we imaged fixed early-stage starfish embryo cells with our LED-outfitted microscope (same configuration as for the bead experiments, Fig. 9). and slices of the reconstructions are shown in Fig. 9, respectively. Here, we can see that TV removes axial artifacts due to the missing cone problem, but at the cost of blurring features in the lateral and axial dimensions and even erasing many of the cellular features within each embryo. This is because the piecewise smoothness assumption of TV may not be appropriate for this biological sample with a relatively highly varying spatial RI profile. Positivity regularization, despite performing well on the bead samples, not only did not offer much improvement for this biological sample, but also accentuated ringing artifacts along the edge of the cells. On the other hand, the DP-DT reconstruction not only has a higher axial resolution, but also produces cells with a rounder appearance in the axial direction, while the other reconstructions exhibit characteristic missing cone artifacts that cause the cells to taper in the axial direction. It is worth noting that DP-DT produces higher RI estimates, which is further evidence that DP-DT is filling in the missing cone, which would otherwise cause RI underestimation. Finally, we also generated RI uncertainty maps for the DP-DT reconstructions, by running the reconstruction algorithm using 20 independent DIP initializations (Appendix D).
Fig. 9.
Experimental stacked starfish embryo results. (a) Example raw LED images. (b) cross-sections at various depths. (c) cross-sections at positions indicated by the horizontal red lines in the upper left panel of (b). Scale bars, 10 µm.
4.5. Experimental results, multi-slice (MS) approximation
We also tested DP-DT under the MS forward model with the experimental 2-layer, 2-µm bead phantom. Because the MS forward model is more computationally intensive, we used what we call “spatial patching”, whereby at each iteration we select a random, apodized spatial crop within the reconstruction over which to optimize (for more details, see Appendix B). We also note that for the cases of positivity, weaker TV (1e-8), and no regularization, we had to terminate the optimization early to prevent the reconstruction algorithm from diverging.
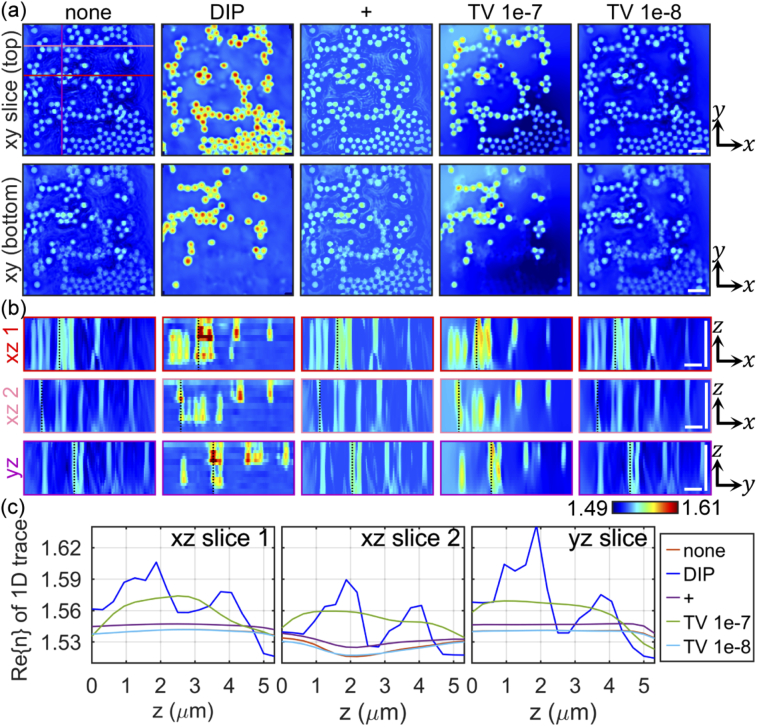
The results are shown in Fig. 10. Without regularization, or with positivity or weak TV regularization, the axial resolution is very poor, with poor discrimination of the two layers. However, DP-DT here has superior axial resolution, even resolving the beads from the two layers, which was not possible with DP-DT with the first Born model. Furthermore, the RI values reconstructed using DP-DT exhibit the least underestimation, approaching the expected value of 1.59. These results may be attributed to the fact that the MS model is able to model multiple forward scattering events, which carries information about the missing cone; however, note that among the regularizers, only DP-DT attains this RI value and axial separation.
Fig. 10.
Experimental 2-layer, 2-µm bead results, using the multi-slice model. (a) slices at the two bead layers. (b) Axial slices indicated by the lines in the upper left panel of (a). (c) 1D axial traces through the dotted lines in (b) (expected RI=1.59). Scale bars, 5 µm.
5. Discussion and conclusion
In summary, we have presented DP-DT, a flexible and general framework that augments existing 3D diffraction tomography techniques with a DIP, which we have shown to alleviate the effects of the missing cone problem. Specifically, we have applied DP-DT to two scattering models, the first Born and MS approximations, and demonstrated its effectiveness in simulated and experimental data with intensity measurements. DP-DT differs from other deep-learning-based approaches in that it does not require pre-training on and hence is not biased towards a pre-existing dataset. DP-DT can thus be applied in situations where it is expensive or otherwise infeasible to collect large datasets for supervised training. Instead, DP-DT relies on the inherent preference of CNN structures for “natural” images, a class of images which we have empirically shown to exclude images with missing cone artifacts. These results open the door to 3D DT with multi-gigavoxel-scale SBPs.
We used a single common architecture for all the reconstructions in this paper (see Appendix A), based on the recently reported encoder-decoder DIP architecture [34], which we did not have to tune for specific samples. Note that the number of parameters in this architecture is fixed (3 million), regardless of the reconstruction size, because it is a fully convolutional network that adapts to the output size. Future work may include exploring the impact of alternative architectures [51]. Recent work by Cheng et al., which presents a Bayesian perspective on the DIP [65], suggests a principled way of exploring network architectures. In particular, the authors found that the DIP is asymptotically equivalent to a stationary Gaussian process prior, which is characterized by a covariance matrix. We could thus design a network with a spatial covariance structure that matches that of natural images, while simultaneously dissimilar to the covariance of images with missing cones. Such an investigation may shed some light on the meaning of “naturalness”.
Furthermore, we did not have to employ early stopping to avoid overfitting for DP-DT, unlike in the original paper [34], which found that running the optimization for too many iterations resulted in recapitulation of image artifacts. We hypothesize that this may be because DP-DT indirectly inpaints in the Fourier domain, such that the missing information is not spatially localized. However, it is possible that the MS model may experience overfitting, as it is not explicitly a Fourier inpainting approach (outside of the weak-scattering limit, in which it coincides with the first Born model). We did not, however, run the DIP-regularized MS optimization loops long enough to observe such effects.
We found that during optimization of DIP-regularized reconstructions under the first-Born approximation, the optimization would sometimes diverge rapidly, effectively resetting the reconstruction. The authors of the original DIP paper also observed a similar phenomenon. To counteract this divergence in an automated fashion, we periodically checkpointed the parameters and monitored the ratio of the current loss versus the mean loss over the last few iterations. If the ratio exceeded a certain threshold, we would restore the parameters to the previous checkpoint and anneal the learning rate by a factor of 0.9. We note that we did not observe this phenomenon for DIP-regularized MS reconstructions, though it is unclear whether that was due to the scattering model or the fact that we used spatial patching.
Future work also includes further investigation of DP-DT under the MS forward model, especially when scaling to larger FOVs. Due to memory constraints, we would have to use smaller LED batch sizes and smaller spatial patch sizes relative to the full FOV. The DP-DT reconstruction under the MS model also showed artifactually high RI values near the axial edges of the reconstruction volume. However, these are not of concern because they occurred outside of the object support. These high values are not seen in non-DIP reconstructions, perhaps because they were initialized at 0, while DIP does not default to 0 (otherwise, it wouldn’t fill in the missing cone). Other future work includes investigating whether the DIP can account for artifacts that arise from using a scattering model in situations where its assumptions are not met, or artifacts from experimental uncertainties. Finally, although our primary goal is to achieve high fidelity multi-gigavoxel-scale 3D image reconstructions, currently, the 3D FOVs that we reconstructed here are on the order of 10s-100s of µms in the lateral dimensions. The images used for reconstruction here were cropped segments of images captured by a 20 objective lens with a 2.6-mm-diameter FOV. To work towards gigavoxel-scale SBPs, we would thus start by reconstructing the full FOV afforded by this objective lens, as we are currently about two orders of magnitude away in terms of a full demonstration. The major challenge of scaling up to multi-gigavoxel imaging using DP-DT is computation time, whether we use spatial patching or just divide up the reconstruction into patches and reconstruct them sequentially. Thus, we will explore more memory-compact DIP architectures and will investigate the effect of batch size and density of illumination angles in order to make the reconstruction process more computationally tractable in the future.
While we have so far demonstrated DP-DT for coherent diffraction tomography, utilizing two popular scattering models and various samples, we expect our results to be more generally applicable to other imaging modalities that exhibit artifacts due to the missing cone problem. This includes ill-posed problems [53] and other domain-specific problems (e.g., anisotropy, speckle, coherent ringing artifacts, noise, etc.) from the fields of 3D X-ray CT, MRI, EM and fluorescence microscopy. Furthermore, DP-DT may certainly be applied to other scattering models, such as higher-order Born approximations and other multiple scattering models that may exhibit unstable convergence during optimization that would invariably produce unnatural-looking reconstructions, against which DP-DT may safeguard. We already observed this optimization stabilizing phenomenon for the MS-model-based reconstructions, where without DIP or heavy TV regularization the reconstruction acquired extreme artifacts, similar to the unregularized reconstructions in Fig. S3(e),(f) in Chowdhury et al. 2019 [9]. Finally, we also hope to apply DP-DT to setups that include reflection geometries [66,67], which invariably contain gaps in -space between disjoint high and low frequency bands. In conclusion, we are hopeful that DP-DT will open up options for using wider-FOV, lower-NA imaging lenses for 3D imaging without axial reconstruction artifacts, thus paving the way for multi-gigavoxel tomographic imaging in the future.
Acknowledgments
The authors would like to thank the lab of Prof. Changhuei Yang for assistance with experimental data capture, as well as Ruobing Qian, Shiqi Xu, and Mykola Kadobianskyi for helpful comments during preparation of this manuscript.
Appendix A: CNN architecture
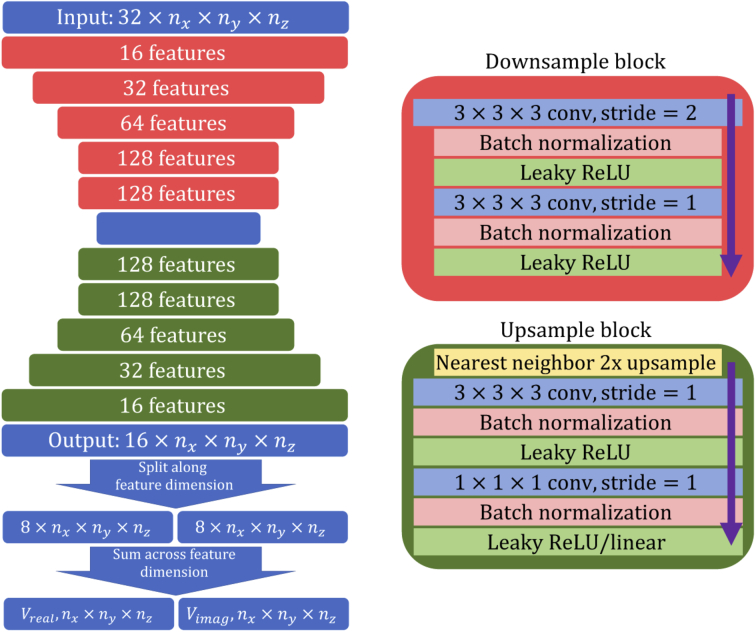
For our DIP’s CNN structure, we adopted a slightly modified version of the symmetric encoder-decoder architecture used in the original paper [34], detailed in Fig. 11. The input is sampled from a uniform random distribution between 0 and 0.1, and is fixed throughout optimization. The downsampling blocks used strided convolutions as the downsampling operation, while the upsampling blocks used nearest neighbor upsampling. Unlike the original paper, we did not use skip connections. The original network made heavy used of batch normalization [68] and leaky ReLU activations [69]. To generate the real and imaginary components of , we split the real-valued output of into two equally sized tensors and summed across the feature dimension. Since leaky ReLU has a preference for positive numbers, we used a linear activation in the final upsampling block if we do not necessarily expect the sample scattering potential to be strictly positive. The resulting architecture had 2,993,984 free parameters.
Fig. 11.
The DIP architecture used for the DP-DT reconstructions in this paper.
Appendix B: Forward models
First Born and Rytov approximations
To provide a mathematical description of our forward model that is amenable to computational reconstruction, we assume discretized coordinates where appropriate to emphasize practical implementation. First, we define the following collection of wavevectors,
| (11) |
where the wavevector is of a partial spherical “cap,” which is a segment of a discretized sphere in -space (i.e., an Ewald sphere) with radius . We initially place the center of this spherical cap at the origin of -space at . The indexing emphasizes that the spherical cap, although defined in 3D -space, is indexed on a 2D Cartesian grid when orthographically projected onto the plane. The maximum lateral extent of the spherical cap is defined by the NA of the imaging lens such that , where is the imaging numerical aperture. Next, let
| (12) |
be the illumination wavevector corresponding to the position of the LED relative to the sample. Subtracting the illumination vector from the spherical cap coordinate vector places the spherical cap coordinate in the correct location in 3D -space for the LED. Following the Fourier diffraction theorem [3], the coordinate of the 2D discrete Fourier transform (DFT) of the field scattered off of the object from the illumination, measured at the detector plane, is provisionally,
| (13) |
where is the imaginary unit, and the DFT scaling constants and other proportionality constants are assumed to be properly handled. In short, the scattered field in -space is defined by the scattering potential spectrum, , sampled along the offset spherical cap and properly scaled. The scattered field in the spatial domain for the illumination is thus given by,
| (14) |
where is the 2D inverse DFT, is an unknown pupil phase function that accounts for aberrations in the imaging lens (to be optimized later), and is a circ function with radius that specifies the imaging lens bandpass.
Equation (14) represents the scattered field from the sample at the microscope’s image plane. As we are primarily concerned with standard microscopes that only record total intensity, we must also consider the unscattered field, which we model as a plane wave:
| (15) |
where is the optimizable amplitude of the illumination wavevector and and are 2D meshgrids sampling the lateral plane, consistent with the lateral spatial sampling of the scattered field (Eq. (14)). The third factor of Eq. (15) accounts for the direction of the illumination. Note that we do not include an optimizable phase of the unscattered field because we desire the relative phase between the scattered and unscattered fields; furthermore, any constant phase shift common to both fields will drop when we take the absolute value below.
Finally, we arrive at the forward prediction of the image formed from the illumination LED at the image sensor under the first Born approximation:
| (16) |
Alternatively, under the first Rytov approximation,
| (17) |
Multi-slice model
In principle, any valid forward scattering model can be used with our DP-DT procedure (replacing the “forward model” box in Fig. 3). Here we describe another popular scattering model, known variously as the multi-slice (MS) approximation and the beam propagation method (BPM), whereby the sample RI is parameterized as multiple thin discrete layers, within which the thin-sample approximation is assumed to apply. An incident field then propagates layer by layer, with the field emerging from the other side serving as the forward prediction. Note that this model can account for multiple scattering, but only in the forward direction.
In particular, let be a complex-valued tensor representing the sample RI deviation from the background medium RI, . Again, the square brackets denote discrete indexing, where the dimensions correspond to the , , and dimensions. Let be the axial sampling over a total axial sample thickness of . Then, the sample can be modeled as a stack of thin slices, separated by and with phase
| (18) |
for slices . Then, given a field incident on the slice from the LED, , the field exiting that slice follows the recursive relationship:
| (19) |
| (20) |
where is given by Eq. (15), and
| (21) |
is the Fresnel diffraction kernel over a distance . In other words, the output field is given by the input field convolved with the diffraction kernel, followed by a phase shift due to the sample. We then propagate the output field to the axial position of in-focus image plane in sample space, which is then imaged by the imaging optics after the sample to the detector plane:
| (22) |
where is the position of the focus relative to the center of the sample, and and are the imaging optics’ pupil amplitude and phase, as defined in the first Born and Rytov cases.
To avoid the edge effects that may arise from the implied circular convolutions when using DFTs, we apodize the input fields in Eq. (19) with a Gaussian envelope
| (23) |
| (24) |
| (25) |
where the position of the Gaussian window is chosen such that after propagation to the camera conjugate plane, the resulting Gaussian-windowed field is centered within the field of view. We used a value of 0.4 of the width of the FOV.
Thus, using these apodized input fields, the MS forward prediction is
| (26) |
Furthermore, the intensity data is also apodized with a centered Gaussian window of the same width to match the forward prediction:
| (27) |
Spatial patching with the MS model
As the MS model is more computationally intensive and requires more memory than the first Born model, we found that batching along the LED dimension was insufficient to alleviate the memory constraints of the GPU. To circumvent this issue, we used what we refer to as “spatial patching”, whereby at each iteration a uniformly random spatial patch is selected from the reconstruction (or the random noise input of DIP) along the plane, as well as the spatially corresponding patch in the data, and the loss is computed only over that patch. In the case of DIP, as the same network is used for all patches, the spatial locations are encoded by the fixed random input to the CNN. After optimization, to create the final reconstruction, we use a stochastic stitching algorithm whereby m = 1,000 patches are randomly chosen and reconstructed, depadded to avoid edge artifacts, and superimposed.
Spatial patching, along with regular batching along the LED dimension, allows us to reconstruct arbitrarily large fields of view with limited GPU memory. Spatial patching was especially necessary when using DIP, which adds further computational overhead due to the use of multiple layers of 3D convolutions.
Appendix C: Additional bead simulation results
Here, we provide the figures analogous to Fig. 4, which shows results for an imaging NA of 0.5, for imaging NAs of 0.1 and 0.3 (Figs. 12 and 13, respectively). For these imaging NAs, DIP also outperforms other regularizers, with particularly striking results for the second column of Fig. 12. We obtained similar results when simulating complex-valued data rather than intensity-only data (see the appendix of a previous version of our paper [70]).
Fig. 12.
Comparison of the quality of 3D reconstruction from intensity measurements, using several regularizers for various bead sizes and separations (illumination NA = 0.4, imaging NA = 0.1). Figure layout is analogous to that of Fig. 4. (a) 1D traces through simulations of two beads spaced axially. Rows show different bead separations, while columns show different bead sizes. Each curve corresponds to a different regularization technique (i.e., none, DIP, positivity (+), and TV) as well as the ground truth. Scale bar corresponds to the Nyquist period. (b) The RI RMSEs from the ground truths for each regularizer. Each of the four plots corresponds to a different bead size, and each curve corresponds to a different edge-to-edge bead separation, where 0.75 µm.
Fig. 13.
Comparison of the quality of 3D reconstruction from intensity measurements, using several regularizers for various bead sizes and separations (illumination NA = 0.4, imaging NA = 0.3). See caption for Fig. 12.
Appendix D: Uncertainty maps
Because DP-DT may be sensitive to initialization of the generative CNN, we generated uncertainty maps by performing the DP-DT reconstruction using 20 independent random initializations and plotting the voxel-wise means and standard deviations. Results for the starfish sample are shown in Fig. 14. The uncertainty map may be regarded as the width of the posterior distribution, reflecting uncertainty due to noisy experimental measurements and filling in information into the missing cone. A more efficient way of generating uncertainty maps is to sample from the posterior distribution of reconstructions using stochastic gradient Langevin dynamics, as proposed by Cheng et al. for the DIP [65].
Fig. 14.
The - (left) and - (right) cross-sections of the 3D DP-DT reconstruction of the starfish sample (Fig. 9). The top row shows the mean reconstruction of 20 independent initializations and the second row shows the standard deviation. The cross-sections correspond to the second column of Fig. 9.
Funding
National Science Foundation10.13039/100000001 (DGF-1106401); Erlangen Graduate School of Advanced Optical Technologies10.13039/501100007216; Deutsche Forschungsgemeinschaft10.13039/501100001659; National Institute Of Neurological Disorders and Stroke10.13039/100000065 of the National Institutes of Health (RF1NS113287).
Disclosures
The authors declare no conflicts of interest.
References
- 1.Mertz J., “Strategies for volumetric imaging with a fluorescence microscope,” Optica 6(10), 1261–1268 (2019). 10.1364/OPTICA.6.001261 [DOI] [Google Scholar]
- 2.Park Y., Depeursinge C., Popescu G., “Quantitative phase imaging in biomedicine,” Nat. Photonics 12(10), 578–589 (2018). 10.1038/s41566-018-0253-x [DOI] [Google Scholar]
- 3.Wolf E., “Three-dimensional structure determination of semi-transparent objects from holographic data,” Opt. Commun. 1(4), 153–156 (1969). 10.1016/0030-4018(69)90052-2 [DOI] [Google Scholar]
- 4.Sung Y., Choi W., Fang-Yen C., Badizadegan K., Dasari R. R., Feld M. S., “Optical diffraction tomography for high resolution live cell imaging,” Opt. Express 17(1), 266–277 (2009). 10.1364/OE.17.000266 [DOI] [PMC free article] [PubMed] [Google Scholar]
- 5.Fiolka R., Wicker K., Heintzmann R., Stemmer A., “Simplified approach to diffraction tomography in optical microscopy,” Opt. Express 17(15), 12407–12417 (2009). 10.1364/OE.17.012407 [DOI] [PubMed] [Google Scholar]
- 6.Lauer V., “New approach to optical diffraction tomography yielding a vector equation of diffraction tomography and a novel tomographic microscope,” J. Microsc. 205(2), 165–176 (2002). 10.1046/j.0022-2720.2001.00980.x [DOI] [PubMed] [Google Scholar]
- 7.Chowdhury S., Eldridge W. J., Wax A., Izatt J., “Refractive index tomography with structured illumination,” Optica 4(5), 537–545 (2017). 10.1364/OPTICA.4.000537 [DOI] [Google Scholar]
- 8.Horstmeyer R., Chung J., Ou X., Zheng G., Yang C., “Diffraction tomography with Fourier ptychography,” Optica 3(8), 827–835 (2016). 10.1364/OPTICA.3.000827 [DOI] [PMC free article] [PubMed] [Google Scholar]
- 9.Chowdhury S., Chen M., Eckert R., Ren D., Wu F., Repina N., Waller L., “High-resolution 3d refractive index microscopy of multiple-scattering samples from intensity images,” Optica 6(9), 1211–1219 (2019). 10.1364/OPTICA.6.001211 [DOI] [PMC free article] [PubMed] [Google Scholar]
- 10.Tian L., Waller L., “3d intensity and phase imaging from light field measurements in an led array microscope,” Optica 2(2), 104–111 (2015). 10.1364/OPTICA.2.000104 [DOI] [Google Scholar]
- 11.Li J., Matlock A., Li Y., Chen Q., Zuo C., Tian L., “High-speed in vitro intensity diffraction tomography,” arXiv preprint arXiv:1904.06004 (2019).
- 12.Ling R., Tahir W., Lin H.-Y., Lee H., Tian L., “High-throughput intensity diffraction tomography with a computational microscope,” Biomed. Opt. Express 9(5), 2130–2141 (2018). 10.1364/BOE.9.002130 [DOI] [PMC free article] [PubMed] [Google Scholar]
- 13.Pham T.-A., Soubies E., Goy A., Lim J., Soulez F., Psaltis D., Unser M., “Versatile reconstruction framework for diffraction tomography with intensity measurements and multiple scattering,” Opt. Express 26(3), 2749–2763 (2018). 10.1364/OE.26.002749 [DOI] [PubMed] [Google Scholar]
- 14.Jiang X., Van den Broek W., Koch C. T., “Inverse dynamical photon scattering (idps): an artificial neural network based algorithm for three-dimensional quantitative imaging in optical microscopy,” Opt. Express 24(7), 7006–7018 (2016). 10.1364/OE.24.007006 [DOI] [PubMed] [Google Scholar]
- 15.Zheng G., Horstmeyer R., Yang C., “Wide-field high-resolution Fourier ptychographic microscopy,” Nat. Photonics 7(9), 739–745 (2013). 10.1038/nphoton.2013.187 [DOI] [PMC free article] [PubMed] [Google Scholar]
- 16.Aidukas T., Eckert R., Harvey A., Waller L., Konda P. C., “Low-cost, sub-micron resolution, wide-field computational microscopy using opensource hardware,” Sci. Rep. 9(1), 7457 (2019). 10.1038/s41598-019-43845-9 [DOI] [PMC free article] [PubMed] [Google Scholar]
- 17.Kamilov U. S., Papadopoulos I. N., Shoreh M. H., Goy A., Vonesch C., Unser M., Psaltis D., “Learning approach to optical tomography,” Optica 2(6), 517–522 (2015). 10.1364/OPTICA.2.000517 [DOI] [Google Scholar]
- 18.Kamilov U. S., Papadopoulos I. N., Shoreh M. H., Goy A., Vonesch C., Unser M., Psaltis D., “Optical tomographic image reconstruction based on beam propagation and sparse regularization,” IEEE Trans. Comput. Imaging 2(1), 59–70 (2016). 10.1109/TCI.2016.2519261 [DOI] [Google Scholar]
- 19.Tam K. C., Perez-Mendez V., “Tomographical imaging with limited-angle input,” J. Opt. Soc. Am. 71(5), 582–592 (1981). 10.1364/JOSA.71.000582 [DOI] [Google Scholar]
- 20.Muller P., Scharmann M., Chan C. J., Guck J., “Single-cell diffraction tomography with optofluidic rotation about a tilted axis,” in Optical Trapping and Optical Micromanipulation XII, Dholakia K., Spalding G. C., eds. (SPIE, 2015). [Google Scholar]
- 21.Konda P. C., Taylor J. M., Harvey A. R., “Parallelized aperture synthesis using multi-aperture fourier ptychographic microscopy,” arXiv preprint arXiv:1806.02317 (2018).
- 22.He K., Huang X., Wang X., Yoo S., Ruiz P., Gdor I., Ferrier N. J., Scherer N., Hereld M., Katsaggelos A. K., Cossairt O., “Design and simulation of a snapshot multi-focal interferometric microscope,” Opt. Express 26(21), 27381–27402 (2018). 10.1364/OE.26.027381 [DOI] [PubMed] [Google Scholar]
- 23.Choi W., Fang-Yen C., Badizadegan K., Oh S., Lue N., Dasari R. R., Feld M. S., “Tomographic phase microscopy,” Nat. Methods 4(9), 717–719 (2007). 10.1038/nmeth1078 [DOI] [PubMed] [Google Scholar]
- 24.Lim J., Lee K., Jin K. H., Shin S., Lee S., Park Y., Ye J. C., “Comparative study of iterative reconstruction algorithms for missing cone problems in optical diffraction tomography,” Opt. Express 23(13), 16933–16948 (2015). 10.1364/OE.23.016933 [DOI] [PubMed] [Google Scholar]
- 25.Sung Y., Choi W., Lue N., Dasari R. R., Yaqoob Z., “Stain-free quantification of chromosomes in live cells using regularized tomographic phase microscopy,” PLoS One 7(11), e49502 (2012). 10.1371/journal.pone.0049502 [DOI] [PMC free article] [PubMed] [Google Scholar]
- 26.Sung Y., Dasari R. R., “Deterministic regularization of three-dimensional optical diffraction tomography,” J. Opt. Soc. Am. A 28(8), 1554–1561 (2011). 10.1364/JOSAA.28.001554 [DOI] [PMC free article] [PubMed] [Google Scholar]
- 27.Krauze W., Makowski P., Kujawińska M., Kuś A., “Generalized total variation iterative constraint strategy in limited angle optical diffraction tomography,” Opt. Express 24(5), 4924–4936 (2016). 10.1364/OE.24.004924 [DOI] [PubMed] [Google Scholar]
- 28.Delaney A. H., Bresler Y., “Globally convergent edge-preserving regularized reconstruction: an application to limited-angle tomography,” IEEE Trans. on Image Process. 7(2), 204–221 (1998). 10.1109/83.660997 [DOI] [PubMed] [Google Scholar]
- 29.Goris B., Van den Broek W., Batenburg K. J., Mezerji H. H., Bals S., “Electron tomography based on a total variation minimization reconstruction technique,” Ultramicroscopy 113, 120–130 (2012). 10.1016/j.ultramic.2011.11.004 [DOI] [Google Scholar]
- 30.Anirudh R., Kim H., Thiagarajan J. J., Aditya Mohan K., Champley K., Bremer T., “Lose the views: Limited angle ct reconstruction via implicit sinogram completion,” in Proceedings of the IEEE Conference on Computer Vision and Pattern Recognition, (2018), pp. 6343–6352. [Google Scholar]
- 31.Zhang H., Li L., Qiao K., Wang L., Yan B., Li L., Hu G., “Image prediction for limited-angle tomography via deep learning with convolutional neural network,” arXiv preprint arXiv:1607.08707 (2016).
- 32.Ding G., Liu Y., Zhang R., Xin H. L., “A joint deep learning model to recover information and reduce artifacts in missing-wedge sinograms for electron tomography and beyond,” Sci. Rep. 9(1), 12803 (2019). 10.1038/s41598-019-49267-x [DOI] [PMC free article] [PubMed] [Google Scholar]
- 33.Lim J., Goy A., Shoreh M. H., Unser M., Psaltis D., “Learning tomography assessed using mie theory,” Phys. Rev. Appl. 9(3), 034027 (2018). 10.1103/PhysRevApplied.9.034027 [DOI] [Google Scholar]
- 34.Ulyanov D., Vedaldi A., Lempitsky V., “Deep image prior,” in Proceedings of the IEEE Conference on Computer Vision and Pattern Recognition, (2018), pp. 9446–9454. [Google Scholar]
- 35.Dave A., Vadathya A. K., Subramanyam R., Baburajan R., Mitra K., “Solving inverse computational imaging problems using deep pixel-level prior,” IEEE Trans. Comput. Imaging 5(1), 37–51 (2019). 10.1109/TCI.2018.2882698 [DOI] [Google Scholar]
- 36.Lucas A., Iliadis M., Molina R., Katsaggelos A. K., “Using deep neural networks for inverse problems in imaging: beyond analytical methods,” IEEE Signal Process. Mag. 35(1), 20–36 (2018). 10.1109/MSP.2017.2760358 [DOI] [Google Scholar]
- 37.Jo Y., Cho H., Lee S. Y., Choi G., Kim G., Min H.-S., Park Y., “Quantitative phase imaging and artificial intelligence: a review,” IEEE J. Sel. Top. Quantum Electron. 25(1), 1–14 (2019). 10.1109/JSTQE.2018.2859234 [DOI] [Google Scholar]
- 38.McCann M. T., Jin K. H., Unser M., “Convolutional neural networks for inverse problems in imaging: A review,” IEEE Signal Process. Mag. 34(6), 85–95 (2017). 10.1109/MSP.2017.2739299 [DOI] [Google Scholar]
- 39.Barbastathis G., Ozcan A., Situ G., “On the use of deep learning for computational imaging,” Optica 6(8), 921–943 (2019). 10.1364/OPTICA.6.000921 [DOI] [Google Scholar]
- 40.Goy A., Roghoobur G., Li S., Arthur K., Akinwande A. I., Barbastathis G., “High-resolution limited-angle phase tomography of dense layered objects using deep neural networks,” arXiv preprint arXiv:1812.07380 (2018). [DOI] [PMC free article] [PubMed]
- 41.Nguyen T. C., Bui V., Nehmetallah G., “Computational optical tomography using 3-d deep convolutional neural networks,” Opt. Eng. 57(4), 043111 (2018). 10.1117/1.OE.57.4.043111 [DOI] [Google Scholar]
- 42.Jin K. H., McCann M. T., Froustey E., Unser M., “Deep convolutional neural network for inverse problems in imaging,” IEEE Trans. on Image Process. 26(9), 4509–4522 (2017). 10.1109/TIP.2017.2713099 [DOI] [PubMed] [Google Scholar]
- 43.Kellman M., Bostan E., Chen M., Waller L., “Data-driven design for fourier ptychographic microscopy,” in 2019 IEEE International Conference on Computational Photography (ICCP), (IEEE, 2019), pp. 1–8. [Google Scholar]
- 44.Zheng G., Ou X., Horstmeyer R., Chung J., Yang C., “Fourier ptychographic microscopy: A gigapixel superscope for biomedicine,” Opt. Photonics News 25(4), 26–33 (2014). 10.1364/OPN.25.4.000026 [DOI] [Google Scholar]
- 45.Haeberle O., Belkebir K., Giovaninni H., Sentenac A., “Tomographic diffractive microscopy: basics, techniques and perspectives,” J. Mod. Opt. 57(9), 686–699 (2010). 10.1080/09500340.2010.493622 [DOI] [Google Scholar]
- 46.Liu H.-Y., Liu D., Mansour H., Boufounos P. T., Waller L., Kamilov U. S., “Seagle: Sparsity-driven image reconstruction under multiple scattering,” IEEE Trans. Comput. Imaging 4(1), 73–86 (2018). 10.1109/TCI.2017.2764461 [DOI] [Google Scholar]
- 47.Lim J., Ayoub A. B., Antoine E. E., Psaltis D., “High-fidelity optical diffraction tomography of multiple scattering samples,” Light: Sci. Appl. 8(1), 1–12 (2019). 10.1038/s41377-018-0109-7 [DOI] [PMC free article] [PubMed] [Google Scholar]
- 48.Kamilov U. S., Liu D., Mansour H., Boufounos P. T., “A recursive born approach to nonlinear inverse scattering,” IEEE Signal Process. Lett. 23(8), 1052–1056 (2016). 10.1109/LSP.2016.2579647 [DOI] [Google Scholar]
- 49.Yeh L.-H., Dong J., Zhong J., Tian L., Chen M., Tang G., Soltanolkotabi M., Waller L., “Experimental robustness of Fourier ptychography phase retrieval algorithms,” Opt. Express 23(26), 33214–33240 (2015). 10.1364/OE.23.033214 [DOI] [PubMed] [Google Scholar]
- 50.Liu J., Sun Y., Xu X., Kamilov U. S., “Image Restoration Using Total Variation Regularized Deep Image Prior,” in ICASSP 2019 - 2019 IEEE International Conference on Acoustics Speech and Signal Processing (ICASSP), (IEEE, 2019). [Google Scholar]
- 51.Heckel R., Hand P., “Deep decoder: Concise image representations from untrained non-convolutional networks,” arXiv preprint arXiv:1810.03982 (2018).
- 52.Gong K., Catana C., Qi J., Li Q., “Pet image reconstruction using deep image prior,” IEEE Trans. Med. Imaging 38(7), 1655–1665 (2019). 10.1109/TMI.2018.2888491 [DOI] [PMC free article] [PubMed] [Google Scholar]
- 53.Van Veen D., Jalal A., Soltanolkotabi M., Price E., Vishwanath S., Dimakis A. G., “Compressed sensing with deep image prior and learned regularization,” arXiv preprint arXiv:1806.06438 (2018).
- 54.Mataev G., Elad M., Milanfar P., “Deepred: Deep image prior powered by red,” arXiv preprint arXiv:1903.10176 (2019).
- 55.Shamshad F., Abbas F., Ahmed A., “Deep ptych: Subsampled fourier ptychography using generative priors,” in ICASSP 2019-2019 IEEE International Conference on Acoustics, Speech and Signal Processing (ICASSP), (IEEE, 2019), pp. 7720–7724. [Google Scholar]
- 56.Nguyen T., Xue Y., Li Y., Tian L., Nehmetallah G., “Deep learning approach for Fourier ptychography microscopy,” Opt. Express 26(20), 26470–26484 (2018). 10.1364/OE.26.026470 [DOI] [PubMed] [Google Scholar]
- 57.Kappeler A., Ghosh S., Holloway J., Cossairt O., Katsaggelos A., “Ptychnet: CNN based fourier ptychography,” in 2017 IEEE International Conference on Image Processing (ICIP), (IEEE, 2017). [Google Scholar]
- 58.Isil Ç., Oktem F. S., Koç A., “Deep iterative reconstruction for phase retrieval,” Appl. Opt. 58(20), 5422–5431 (2019). 10.1364/AO.58.005422 [DOI] [PubMed] [Google Scholar]
- 59.Metzler C. A., Schniter P., Veeraraghavan A., Baraniuk R. G., “prdeep: Robust phase retrieval with a flexible deep network,” arXiv preprint arXiv:1803.00212 (2018).
- 60.Bunk O., Dierolf M., Kynde S., Johnson I., Marti O., Pfeiffer F., “Influence of the overlap parameter on the convergence of the ptychographical iterative engine,” Ultramicroscopy 108(5), 481–487 (2008). 10.1016/j.ultramic.2007.08.003 [DOI] [PubMed] [Google Scholar]
- 61.Kingma D. P., Ba J., “Adam: A method for stochastic optimization,” arXiv preprint arXiv:1412.6980 (2014).
- 62.Abadi M., Agarwal A., Barham P., Brevdo E., Chen Z., Citro C., Corrado G. S., Davis A., Dean J., Devin M., Ghemawat S., Goodfellow I., Harp A., Irving G., Isard M., Jia Y., Jozefowicz R., Kaiser L., Kudlur M., Levenberg J., Mané D., Monga R., Moore S., Murray D., Olah C., Schuster M., Shlens J., Steiner B., Sutskever I., Talwar K., Tucker P., Vanhoucke V., Vasudevan V., Viégas F., Vinyals O., Warden P., Wattenberg M., Wicke M., Yu Y., Zheng X., “Tensorflow: Large-scale machine learning on heterogeneous distributed systems,” arXiv preprint arXiv:1603.04467 (2016).
- 63.Lucchi A., Smith K., Achanta R., Knott G., Fua P., “Supervoxel-Based Segmentation of Mitochondria in EM Image Stacks With Learned Shape Features,” IEEE Trans. Med. Imaging 31(2), 474–486 (2012). 10.1109/TMI.2011.2171705 [DOI] [PubMed] [Google Scholar]
- 64.Wang Z., Bovik A. C., Sheikh H. R., Simoncelli E. P., “Image quality assessment: from error visibility to structural similarity,” IEEE Trans. on Image Process. 13(4), 600–612 (2004). 10.1109/TIP.2003.819861 [DOI] [PubMed] [Google Scholar]
- 65.Cheng Z., Gadelha M., Maji S., Sheldon D., “A bayesian perspective on the deep image prior,” in Proceedings of the IEEE Conference on Computer Vision and Pattern Recognition, (2019), pp. 5443–5451. [Google Scholar]
- 66.Roberts B. A., Kak A. C., “Reflection mode diffraction tomography,” Ultrason. Imaging 7(4), 300–320 (1985). 10.1177/016173468500700403 [DOI] [PubMed] [Google Scholar]
- 67.Zhou K. C., Qian R., Degan S., Farsiu S., Izatt J. A., “Optical coherence refraction tomography,” Nat. Photonics 13(11), 794–802 (2019). 10.1038/s41566-019-0508-1 [DOI] [PMC free article] [PubMed] [Google Scholar]
- 68.Ioffe S., Szegedy C., “Batch normalization: Accelerating deep network training by reducing internal covariate shift,” arXiv preprint arXiv:1502.03167 (2015).
- 69.Xu B., Wang N., Chen T., Li M., “Empirical evaluation of rectified activations in convolutional network,” arXiv preprint arXiv:1505.00853 (2015).
- 70.Zhou K. C., Horstmeyer R., “Diffraction tomography with a deep image prior,” arXiv preprint arXiv:1912.05330 (2019). [DOI] [PMC free article] [PubMed]


