Abstract
Burst wave lithotripsy (BWL) is a technology for comminuting urinary stones. A BWL transducer's requirements of high-pressure output, limited acoustic window, specific focal depth, and frequency to produce fragments of passable size constrain focal beamwidth. However, BWL is most effective with a beam wider than the stone. To produce a broad-beam, an iterative angular spectrum approach was used to calculate a phase screen that was realized with a rapid prototyped lens. The technique did not accurately replicate a target beam profile when an axisymmetric profile was chosen. Adding asymmetric weighting functions to the target profile achieved appropriate beamwidth. Lenses were designed to create a spherically focused narrow-beam (6 mm) and a broad-beam (11 mm) with a 350-kHz transducer and 84-mm focal depth. Both lenses were used to fragment artificial stones (11 mm long) in a water bath, and fragmentation rates were compared. The linearly simulated and measured broad beamwidths that were 12 mm and 11 mm, respectively, with a 2-mm-wide null at center. The broad-beam and the narrow-beam lenses fragmented 44 ± 9% and 16 ± 4% (p = 0.007, N = 3) of a stone by weight, respectively, in the same duration at the same peak negative pressure. The method broadened the focus and improved the BWL rate of fragmentation of large stones.
I. INTRODUCTION
Kidney stones currently affect 1 in 11 Americans over their lifetime,1 and the prevalence is rising. Introduced in the 1980s, shock wave lithotripsy (SWL) is currently the only clinically available noninvasive intervention for kidney stones.2 In SWL, an electrohydraulic, electromagnetic, or piezoelectric source outside the patient generates shock waves that are focused on the kidney stone to shatter it into small fragments.3 However, SWL is being increasingly replaced by ureteroscopy due to concerns over kidney injury and limitations of effectiveness in rendering patients stone-free.4 A new technology called “burst wave lithotripsy” (BWL) may avoid the shortcomings of SWL by using short sinusoidal ultrasound pulses rather than shocks to fragment stones.5 BWL has been demonstrated to fragment common types of human stones in vitro; BWL has been shown safe and effective in fragmenting stones in preclinical studies,6,7 and clinical trials are underway.8,9
However, both BWL and SWL are most effective when the beamwidth is larger than the stone, both because the stone is less likely to move out of the larger beam with respiratory motion10 and because acoustic waves surrounding the stone contribute to stress within the stone.11–13 The American Urological Association guidelines state SWL is appropriate for stones up to 10 mm in the lower pole of the kidney and up to 20 mm in the pelvis, with larger stones likely to leave residual fragments.14 A decline in SWL effectiveness has been attributed to narrow beamwidths of later generation lithotripters.4 The beamwidth [BW(−6 dB)] of the focal region (volume defined by a −6 dB contour) produced by a spherically focused transducer is dictated by only a few factors: (1) the focal distance, (2) the aperture of the transducer, and (3) the frequency or wavelength of the wave, and can be approximated by the relationship
| (1) |
where a is the radius of the aperture, F is the focal length, and λ is the acoustic wavelength. In BWL, all three of these factors are constrained, respectively, by the tissue depth, the acoustic window and focal gain, and the size of the fragments. In particular, the fragment size has been shown to have a strong inverse relation to the ultrasound frequency; thus the frequency is fixed to produce fragments that are approximately 1–2 mm, which can spontaneously pass through the urinary tract.5
Hence, a technique was employed here to produce a larger focal region within the above-mentioned constraints. Specifically, a version of the iterative angular spectrum approach (IASA), as described by Melde et al.,15 was used to generate target pressure profiles in the focal plane of a transducer with a width broader than a spherically focused beam. Such an approach has been developed and used for low-power applications.15 The technique did not accurately replicate the target beam profile when it was axisymmetric or had dimensions near the acoustic wavelength. To address this issue, we modified the target beam profile incorporating an asymmetric pattern to appropriately “weight” the function to produce a broad beam. A BWL transducer was fabricated and coupled to a lens designed from the IASA. The transducer was characterized to confirm the simulation. The transducer was tested by fragmenting large artificial plaster stones in vitro, and the rate of fragmentation was compared to that with an equivalent BWL transducer coupled to a conventional spherically focused lens.
II. METHODS AND MATERIALS
A. Focus enlargement with IASA
The IASA algorithm was implemented in a scientific computing program (matlab®, The Mathworks, Natick, MA). The algorithm was given two inputs—a uniform pressure amplitude distribution in the source plane of a uniform piston transducer and a target pressure amplitude distribution at the target/focal plane of the transducer. Both planes were perpendicular to the acoustic axis with the source plane being a filled circle of uniform pressure surrounded by a region of no pressure. The target pressure amplitude distribution is referred to below as the target image. The pressure wave is expressed as
| (2) |
assuming explicit time independence. are amplitude and phase functions in the Cartesian coordinate system (x,y,z). The Fourier transform is used to obtain angular spectrum in the wave,
| (3) |
The source plane is assumed to be at z = 0, and the following propagator function is used to find pressure in axial direction z,
| (4) |
where the wave vector and = k is wavenumber in the medium of propagation. Inverse Fourier transform is used to calculate the pressure in the target plane,
| (5) |
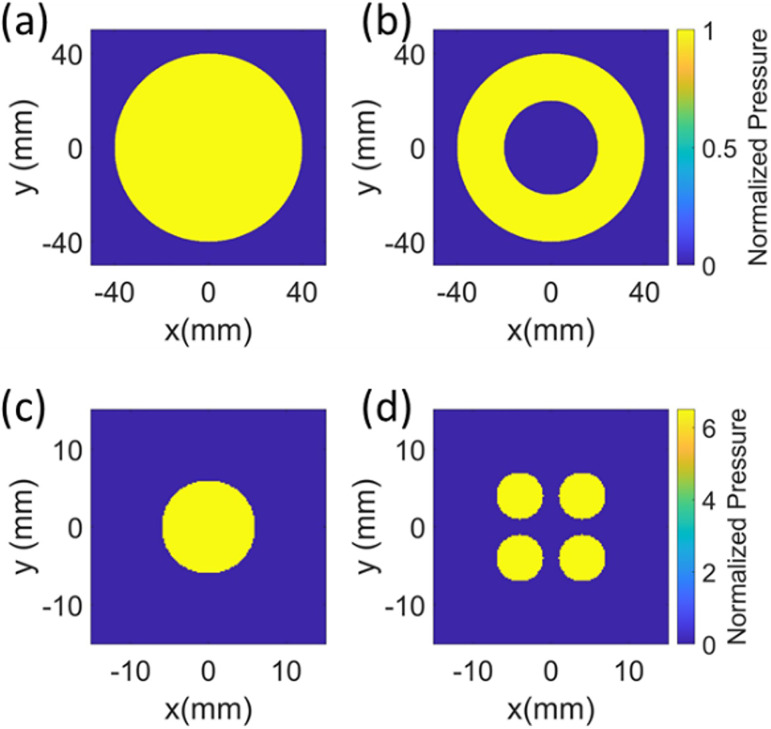
The algorithm calculates the required phase distribution at the surface of the source (i.e., an appropriate lens to place over the uniform piston source) to produce the target image. The algorithm begins with given pressure distribution in the source plane. The amplitude is shown in Fig. 1(a), and the initial phase is set to zero at all points. The angular spectrum of the source vibration is found from Eq. (2) and is forward propagated using Eq. (4) to the target plane where the pressure distribution is found from Eq. (5). Then, the desired pressure amplitude distribution at the target plane is imposed and back propagated to the source where the phase information from the back propagation is maintained and pressure amplitude is replaced by the source initial amplitude. This process is repeated until the pressure distribution at the target plane satisfies a predefined error criterion.
FIG. 1.
(Color online) To enlarge focus using IASA, the algorithm was given two inputs: source pressure amplitude distribution and desired pressure amplitude distribution in the focal plane, referred to as target image. (a) Source pressure profile with an 80-mm diameter for validation of simulation. (b) The BWL simulations had the same source but with a 40-mm diameter circular cutout at the center for imaging the transducer. (c) Target image with a 12-mm diameter circle. (d) Target image with four circles with center located at (±4 mm, ±4 mm) and a 6-mm diameter. The pressures are normalized with respect to surface pressure of the source.
For validating the simulation at 1.1 MHz, an 80-mm circular source with a uniform pressure amplitude distribution was used, as shown in Fig. 1(a), and for BWL simulation at 350 kHz, the same source had a 40-mm diameter cutout at the center, as shown in Fig. 1(b). This cutout of the lens was blocked with a 40-mm diameter with polyurethane foam. The beamwidth for a spherical lens is 6 mm. To obtain a focus larger than that for a spherical lens, a circular target image with a diameter ranging from 6 to 20 mm in a specified plane located between 80 and 90 mm were used as search parameters. Figure 1(c) shows a circle with a 12 mm diameter as a target image. Under conditions that the target image contains features with dimensions near the acoustic wavelength, particularly those with axisymmetric shapes, IASA did not necessarily reproduce the target image profile. To compensate for this effect, we employed a non-axisymmetric shape to “weight” the target image and shifted the center of the beam slightly to obtain a broader target beam width. We investigated, in particular, a design of four small circles, offsetting the center of the circles in the target image from (0,0) to (p,p) where p was varied from 0 to 9 mm and using alternative circular patterns [Fig. 1(d)] to spatially weight the results.
The calculated phase distribution in the source plane was translated to an acoustic lens. The calculated phase delay at each point on the source was made into a lens by the appropriate thickness of the plastic at each point. The profile was defined by: T(x,y) = T0 – [Δϕ(x,y)/(km – kh)] where T0 is the initial thickness of the lens material, Δϕ(x,y) is the required phase at a point, and km and kh are wave numbers in the surrounding medium and lens material, respectively.
The lens was manufactured from a photopolymer resin (Veroclear, 3 D Systems, Rock Hill, SC) in a rapid prototyping machine (Objet30 Pro, Stratasys, Eden Prairie, MN). The measured sound speed in the lens material was 2560 m/s, and the material density was 1200 kg/m3. The lenses had a diameter of 80 mm and had a wrapped phase profile similar to a Fresnel lens.
An unfocused ultrasound transducer (center frequency f = 335 kHz, aperture diameter 2a = 80 mm) was designed, fabricated, and coupled with the different lenses to test the produced pressure profiles. The transducer was made from a circular piezoceramic plate (PZT4, Steiner and Martins, Inc., Davenport, FL) with a thickness of 6 mm, which was electrically connected to a coaxial cable and sealed in a waterproof housing. The lenses were coupled to the front of the transducer with water as an intermediate layer of approximately 3 mm in thickness. Although different gaps may introduce some change to the transmission coefficient, this distance was kept the same for all experiments. The transducer was powered with an amplifier (Model A150 RF Power Amplifier, ENI, Inc., Rochester, NY) connected through a matching network for each test frequency. As there is some bandwidth to the transducer, the transducer was tested between 300 and 400 kHz before settling on 350 kHz, and the third harmonic (1.1 MHz) was used in one specific test of lens design for generating a focal plane with greater resolution.
The pressure profiles were scanned in an 80-liter water tank with a hydrophone (HNR-0500, Onda, Sunnyvale, CA) and a fiber optic hydrophone (Model FOPH 2000, RP Acoustics, Leutenbach, Germany). The transducer was fixed in the tank, and the hydrophone scanned the focal plane transverse to the acoustic axis, the z-axis. Position of the hydrophone was controlled with a 3 D positioning system (Xslide, Velmex, Bloomfield, NY). Lateral focal widths of the pressure profiles were measured by plotting amplitudes corresponding to the operating frequency in a fast Fourier transform of the recorded signal. Simulated and measured profiles were compared with the feature similarity index (FSIM), which is used as a metric for image comparison.16 The index ranges between 0 and 1, with 0 being dissimilar images and 1 being identical images.
B. Fabrication of a BWL transducer with an enlarged focus
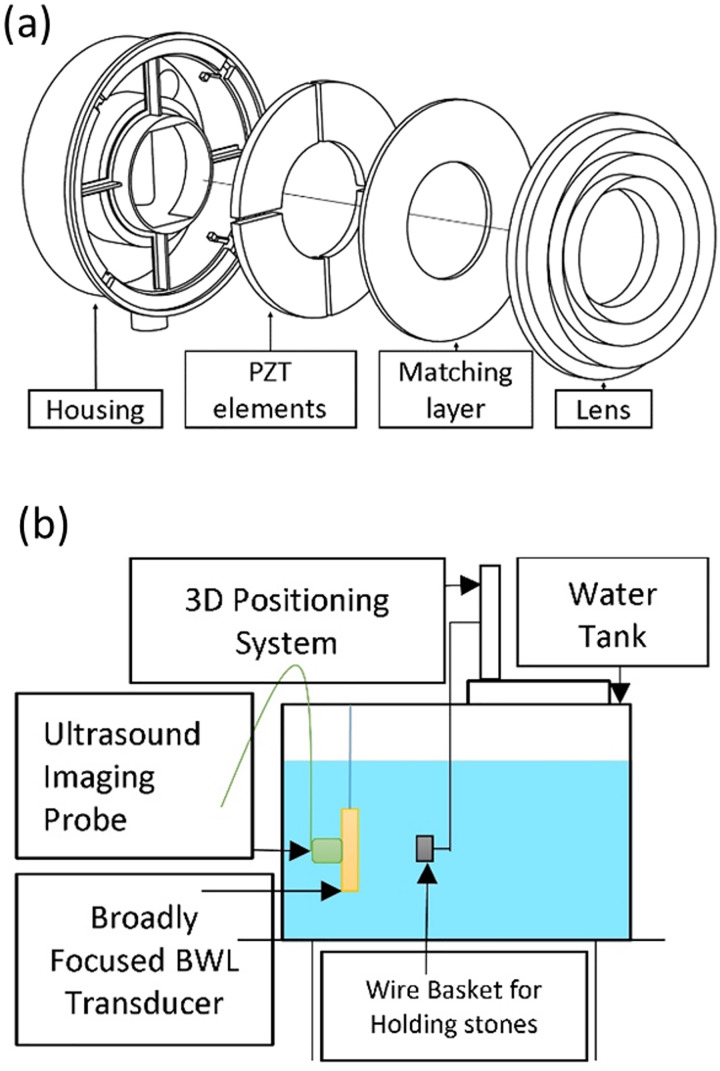
Once a pressure profile of the desired focal beam width was obtained and measured with the test transducer/lens, a BWL transducer was fabricated following the methods of Kim et al.17 The transducer schematic is shown in Fig. 2(a). The aperture diameter of the transducer was 80 mm, and it had a circular opening of a 40 mm diameter at the center in which to place an imaging transducer to guide treatment. Porous piezoceramic PZ36 (Meggitt, Kvistgaard, Denmark) with a center frequency of 350 kHz was used to produce a surface pressure up to 1.4 MPa (i.e., the pressure at the water interface with the transducer's lens), estimated from the transducer output power measured by the radiation force balance. The lens was coupled to the PZ36 elements with a quarter-wavelength matching layer made from a 70:30 mass ratio mixture of Al2O3 powder (grit #600, Abrasive Armory, Vancouver, WA) to epoxy resin (Pro Set INF-114 with its hardener Pro Set INF- 112, Gougeon Brothers Inc., Bay City, MI).
FIG. 2.
(Color online) Experimental setup schematics: (a) Exploded view of new BWL transducer. (b) Setup for fragmenting stones.
C. Stone phantoms
Artificial plaster stones were made from Begostone Plus (Bego USA, Lincoln, RI), a gypsum-based plaster, following Liu et al., who demonstrated these stones as phantoms for lithotripsy experiments since they had mechanical and acoustic properties similar to natural stones.18,19 The powder was mixed with water in a ratio of 4:1 by weight, and the mixture was formed into cylinders with the following dimensions: 11 mm length × 6 mm diameter (avg. weight = 0.690 ± 0.011 g). The stones were cured for 24 h and left submerged in water for >48 h until the experiment.
D. Fragmentation of large stones
The new BWL transducer was positioned in a water tank, as shown in Fig. 2(b). Water in the tank was degassed to maintain a gas concentration below 30% of the saturation level of dissolved oxygen measured with an oxygen-level meter (Oxi 330i meter with a CellOx 325 probe, WTW, Weilheim, Germany). The stones were fragmented with the new BWL transducer as well as with an existing spherically focused 350-kHz BWL transducer, which had an aperture diameter of 85 mm, a focal length of 100 mm, and focal beam dimensions of a 6-mm lateral width by a 50-mm axial length. The stones were held in a hemispherical nylon mesh basket with 2-mm pores and a 35-mm diameter. While there are tissue phantoms that more accurately simulate the kidney environment,20 they were not used here as the goal was only to compare the effectiveness of the broad and narrow beams on large stones. Each transducer was aligned with a stone and activated to deliver 20-cycle BWL pulses at a pulse repetition frequency of 20 Hz and at the same peak negative pressure amplitude (−5.7 MPa) for 30 min. To evaluate the stone fragmentation rate of each transducer, the mass of wet fragments larger than 2 mm was measured at time intervals t of 10 min. The ratio of the mass Wf (t) of fragments greater than 2 mm after exposure to the mass Wi of the stone prior to exposure was calculated as a fragmentation metric. The fraction [Wi – Wf (t)] / Wi reflects the efficiency of the fragmentation as a fraction of the stone considered sufficiently fragmented for natural passage through the urinary tract. The means and standard deviations of fragmentation efficiency were analyzed statistically with a Student's t-test, and p-values are reported.
III. RESULTS
A. Validation
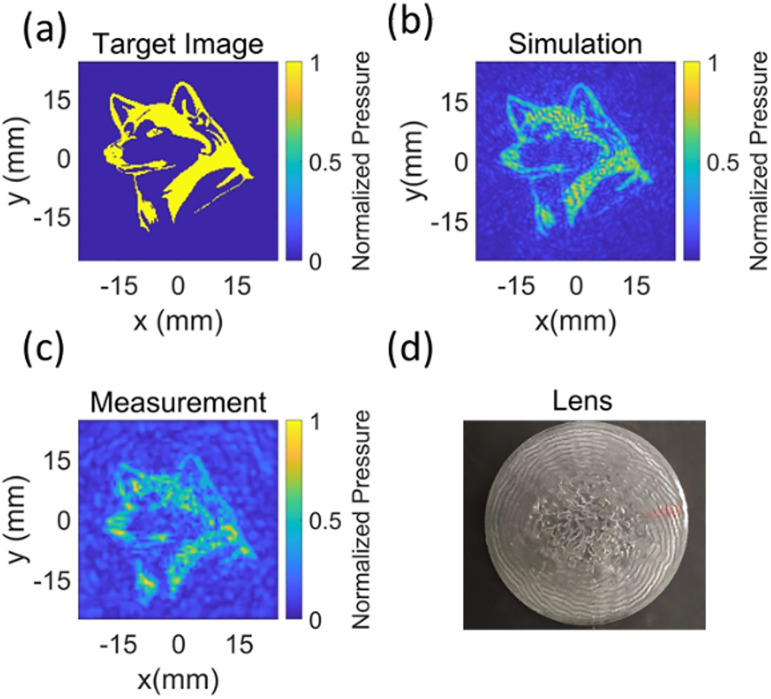
To validate the implementation of the IASA algorithm, lens, and transducer fabrication process, the target image was set to an image of a husky dog profile [Fig. 3(a)] at 1.1 MHz to achieve high resolution. The simulated and measured results are shown in Figs. 3(b) and 3(c). Both the measured and simulated images show an approximation of the husky profile in the target plane, limited in resolution by diffraction. The FSIM for the measured pressure profile is 0.72 with a simulated result as a reference image. The lens producing this beam pattern is shown in Fig. 3(d).
FIG. 3.
(Color online) The iterative angular spectrum approach was implemented and validated for generating pressure profile of a husky dog. (a) Target pressure profile in the focal plane of a transducer. (b) Simulated pressure profile. (c) Measured pressure profile. The simulated and measured pressure profiles are similar to the target image. The feature similarity index for the measured pressure profile is 0.72 with the simulated result as a reference image. (d) Rapid prototyped lens. The pressures are normalized with respect to the highest pressure in the plane.
B. Enlargement of focus
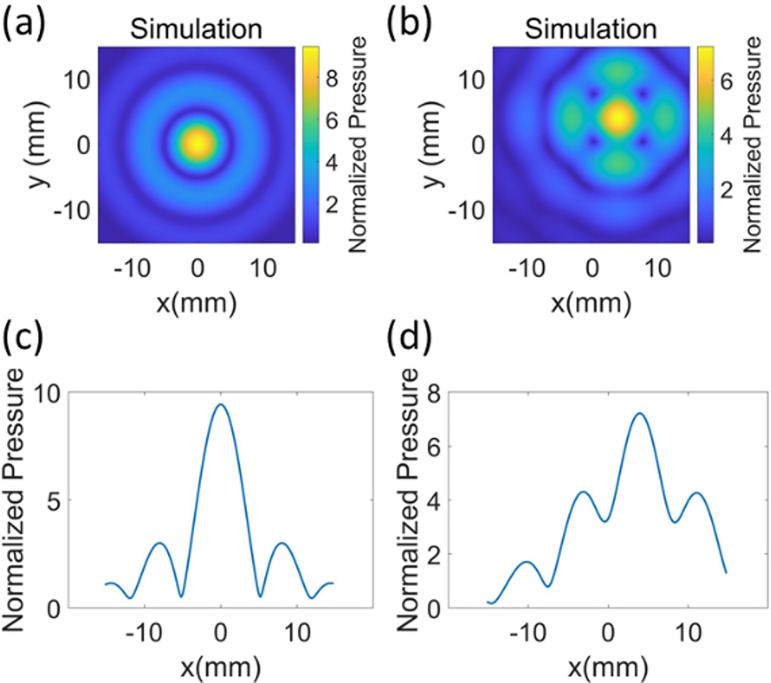
The IASA algorithm was implemented for an 80-mm source operating at 350 kHz. When the target images were a single circle with a diameter larger than 6 mm, the output of the algorithm converged to a solution similar to a spherically focused transducer (a circular beam profile with a 6-mm diameter), and no enlargement of the focus in the focal plane [Fig. 4(a)] was observed.
FIG. 4.
(Color online) To obtain a larger focus with IASA, the target images were set similar to circles in Fig. 1(c) with diameters ranging between 6 and 20 mm. When the diameter of the circle in the target image was 6 mm, the simulated pressure field was matched to the pressure profile of a conventional focused transducer. (a) and (c) The images show results of the simulation of a target image with a 1-mm diameter. When the diameter of the circle in the target image was varied from 6 to 20 mm, the beam width in the simulated results did not increase. (b) The image in the center of the circle with an 18-mm diameter in the desired image was shifted to (4 mm, 4 mm). Introducing asymmetry in the target pressure profile changed the shape of outputs. The image in (d) shows a line plot along the x axis at y = 4 mm. The results are normalized with respect to the surface pressure of the source.
For circles with a diameter greater than 16 mm, the maximum pressure along the z-axis shifted beyond the specified focal plane, effectively putting the specified plane in the nearfield and producing a spherically focused beam at a farther focal distance than specified. The plane located at about 15 mm from the target focal plane had higher maximum pressure than that of the target focal plane.
Further, different radially varying weighting functions were laid over the circular shape in the target image plane. However, these attempts led to solutions similar to results of unweighted circular target images, and the lateral width of focus in the target plane did not increase.
When asymmetry was introduced by shifting the center of the target image, convergence to different solutions was observed. Using a circular target image with an 18-mm diameter and a 4-mm offset on both axes, the size of focus was increased and the farthest −6 dB contour pressure points in the focal plane were 18 mm apart [Fig. 4(b)]. Also, the highest pressure amplitude was located in the target image plane rather than elsewhere. Focal plane pressure along the x-axis and y = 4 mm of beam patterns in Figs. 4(a) and 4(b) are plotted in Figs. 4(c) and 4(d), respectively.
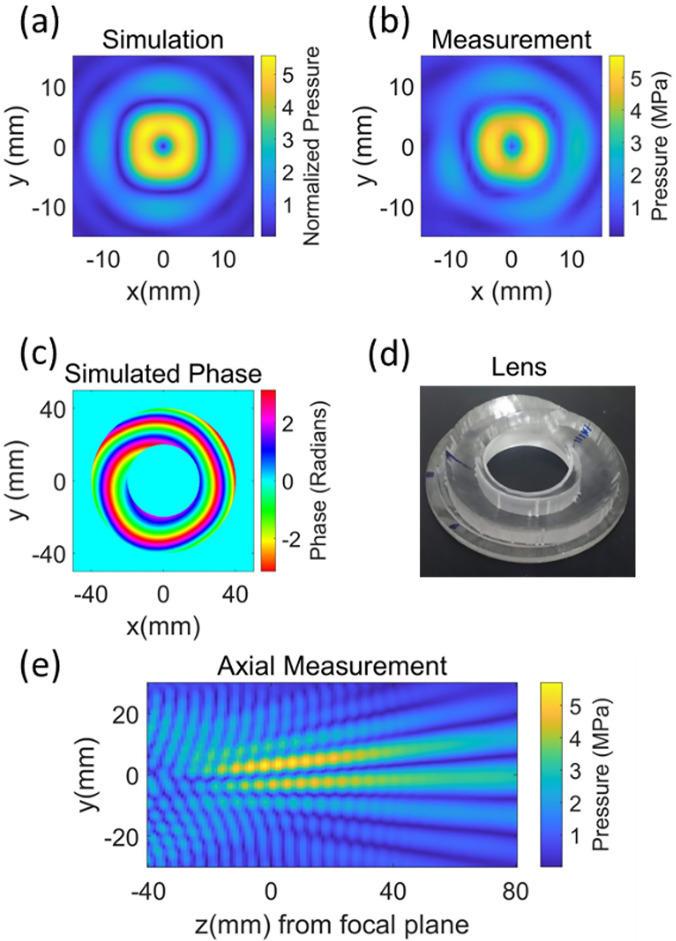
By using the four small circles off axis, as shown in Fig. 1(c), as the target image, the iteratively determined focal image shown in Fig. 5(a) with a focal width of 12 mm was achieved with a focal gain of 5.5 at a focal/target plane distance of 84 mm. The centers of the four small circles in Fig. 1(c) were located at (±3–3.5 mm, ±3–3.5 mm), and their diameter was 6 mm. Figures 5(a) and 5(b) show resultant simulated and measured pressure profiles in the focal plane trying to generate an image similar to Fig. 1(d). Phase distribution in the source plane is shown in Fig. 5(c), and the lens encoding the phases is shown in Fig. 5(d). The measured beamwidth was 11 mm, and the difference in simulated and measured focal width in the target plane was ≤1 mm. The FSIM for the measured pressure profile is 0.87 with a simulated result as a reference image. The differences in features are due not to the shape and size of the focus but to the amplitude distribution within the focal region, which was not as uniform as the target image. Figure 5(e) shows how beam pattern varies in axial direction with distances measured from the focal plane.
FIG. 5.
(Color online) The optimized beam pattern was obtained when the target image was set similar to Fig. 1(d) and parameters such as the location of the centers of circles, asymmetric shift in the center of the circles, and diameters of the circles were varied. The image in (a) shows simulated results for small circles with a 6-mm diameter and centers located at (±3–3.5 mm, ±3–3.5 mm), and the center of the target image was shifted to (3.5 mm, 3.5 mm). The results in (a) are normalized with respect to surface pressure of the source. The focal plane of the transducer was scanned to confirm the simulation and the measured (peak negative pressure) result is shown in (b). The image in (c) shows the phase profile of the source, which produces the beam pattern. The image in (d) shows the lens encoding phase in (c). The image in (e) shows the peak negative pressure measurement in axial direction with z = 0 in the focal plane. The simulated results are normalized with respect to the surface pressure of the source.
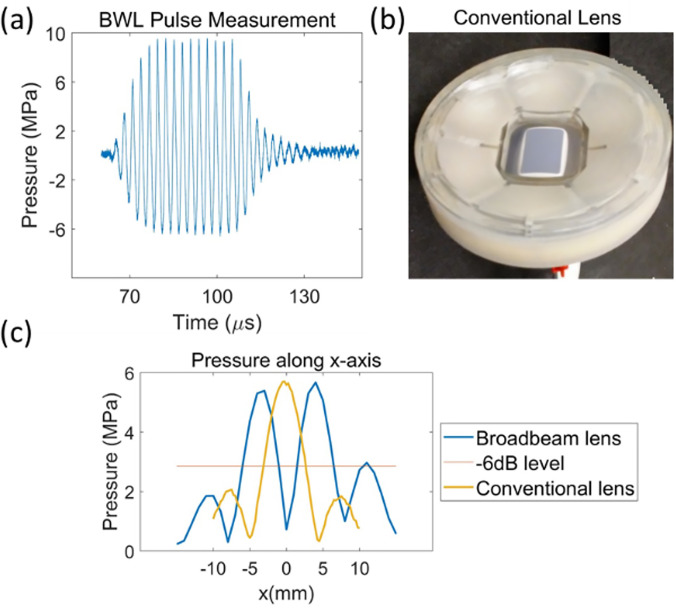
The BWL pulse measured at the highest amplitude point (3,0) in Fig. 5(b) is shown in Fig. 6(a). The conventional lens shown in Fig. 6(b) was coupled with BWL to produce the focused beam pattern. Figure 6(c) compares pressure along the x-axis in the focal plane of the new broad-beam-producing lens and the conventional lens.
FIG. 6.
(Color online) (a) BWL pulse was measured with fiber optic hydrophone at the highest pressure point (3,0) in Fig. 5(b). (b) Conventional lens producing focused beam pattern. The plot in (c) compares peak negative pressure along the x axis in the focal plane of the new broad-beam lens and the convention lens.
C. Fragmentation of stones
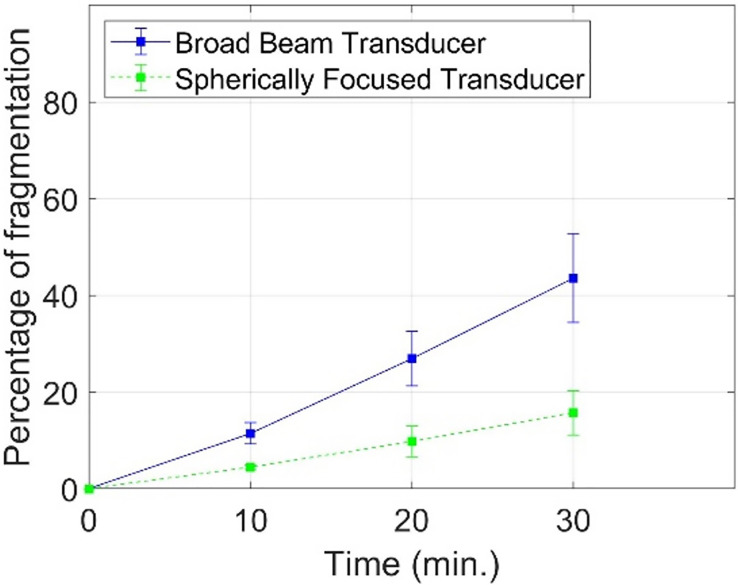
Three stones were fragmented with the new broad-beam BWL transducer with the pattern shown in Fig. 5(b) and with the spherically focused narrow-beam BWL transducer producing the beam pattern similar to that shown in Fig. 4(a). The rates of fragmentation are compared in Fig. 7. The transducer with the broad-beam lens fragmented 44 ± 9% of the stone by weight with a 30-min exposure, whereas the narrow-beam transducer fragmented only 16 ± 4% of the stone in the same duration (p = 0.009). The rates of fragmentation with the broad and narrow beam transducers were 9.9 ± 2.0 mg/min and 3.6 ± 0.9 mg/min, respectively (p = 0.008).
FIG. 7.
(Color online) Artificial plaster stones that mimic human stones were fragmented with the broadly focused transducer (focal width ∼11 mm) and conventional spherically focused transducer (focal width in lateral plane = 6 mm). The cylindrical stones had a diameter of 6 mm and length of 11 mm with avg. weight = 0.690 ± 0.011 g. They were fragmented for half an hour, and the mass of fragments smaller than 2 mm was measured every 10 min. The transducers were operated at 350 kHz with a pulse repetition frequency of 20 and at the same negative pressure amplitude (–5.7 MPa). The broadly focused transducer fragmented 44 ± 9% of stone by weight in 30 min, whereas the focused transducer fragmented only 16 ± 4% of the stone in the same duration.
IV. DISCUSSION
We used the IASA algorithm to design a lens and then fabricated the lens with a rapid prototyping technique. The lens was attached to a flat transducer with a matching layer. The technique produced a beam pattern that was structurally similar to the numerically simulated field and had a beam width of 12 mm, twice the width of the spherically focused lens. The technique we used to generate a broader beam required weighting the amplitude of the target plane to achieve a solution similar to a broad, uniform focus. The enlarged beam was then shown to fragment large stones 2.8 times faster than a spherically focused lens that had the same peak negative pressure but a beam width smaller than the stone diameter. The result of better fragmentation with a beam broader than the stone is consistent with SWL results.21 Here we have shown the technique can make a broader beam or even a beam of a specific shape. Other focused ultrasound techniques for soft tissue ablation have employed strategies to increase ablation volume by increasing beam area, often through analytical methods such as focal splitting.22
Limitations of the study include the following. The broad-beam pattern in Fig. 5(a) had a focal width of 12 mm in the focal plane, but also a null at the center and with a −6 dB diameter of 2 mm. It is not clear whether this non-ideal pattern had an effect on fragmentation, but even so, the broad beam demonstrated improved comminution. The pattern is reminiscent of a focused vortex beam pattern,23 although the central pressure null is smaller than that which would result for a symmetric vortex and has a similar width. Further, we used a plastic mesh to hold the stones, which allowed dispersion of cavitation nuclei in the water tank and limited their hindrance to the acoustic waves reaching the stones. This avoided the shielding of ultrasound waves by dust particles and associated cavitation. Previous research suggests that differences in effectiveness exist between different in vitro models and in vivo models.6,20 Therefore, the results of the improvement in comminution achieved here should be further verified in vivo. The equivalence of the broad and narrow beams was established by the peak negative pressure. Peak negative pressure relates to cavitation and therefore is a primary metric for potential for both tissue injury and comminution. In setting the peak negative pressure, pulse cycles, and pulse repetition frequency to be the same for both transducers, the energy and peak positive pressure are different between transducers and may also account for differences in comminution.
We found that the numerical method has some restrictions in designing beams on the order of the wavelength. It was found that the algorithm naturally converged to a discrete number of solutions, and small changes in the target image often did not reveal any distinct changes in the resulting field. When the target image was symmetric about the origin, the target image plane did not contain the true peak pressure, rather it was located in a plane distal to the target plane. Such a method is employed with the Lithogold lithotripter, where the stone is positioned prefocally to expose the stone to a broader acoustic beam compared to its focus.24 However, having an out-of-plane peak creates the potential risk of injuring tissues outside the focus. Introducing asymmetry in the image plane or source pressure amplitude distribution avoided convergence to this type of solution.
Overall, we showed that a BWL transducer with a broader focus can more effectively fragment large stones compared to a narrow-focus transducer with similar parameters and the same peak negative pressure. Given these results, transducers may be manufactured that can treat a larger range of stones efficiently without significantly increasing the risk of injury, as would occur with increased peak negative pressure amplitude. The technique only changes the focusing methods (in this case the lens) of the transducer and only altered the phase over the lens. The system could alternatively use a phased array to create the unique phase or amplitude distribution across the aperture. Such a device could modulate the phase or amplitude for each case to optimize the beam size to an individual patient's stone dimensions. However, a phased array has limited spatial control of the phase, compared to that obtained from an acoustic lens. In addition, combining a phased array's ability to steer the beam with a particular acoustic lens enhances the flexibility to treat and target a specific stone.
V. CONCLUSION
We employed the IASA algorithm and rapid prototyping to design and fabricate a lens for a flat transducer to improve the effectiveness of stone comminution with BWL for larger stones. The technique produced a broad 11-mm beam and fragmented 11-mm stones 2.8 times faster than a conventionally focused transducer with a 6-mm beam width. The technique enables the production of beam profiles to treat individual target cross sections with therapeutic ultrasound.
ACKNOWLEDGMENTS
We acknowledge funding support from NIH through NIDDK P01 DK043881 and K01 DK104854. We thank the members of the Center for Industrial and Medical Ultrasound for help in testing the methods described in the paper. A.R. now works for and M.R.B. and A.D.M. have equity in and consult for SonoMotion, Inc., which has licensed this technology from the University of Washington for commercalization.
References
- 1. Scales C. D., Smith A. C., Hanley J. M., and Saigal C. S., Urologic Diseases in America Project (U. D. in A. Project), “Prevalence of kidney stones in the United States,” Eur. Urol. 62, 160–165 (2012). 10.1016/j.eururo.2012.03.052 [DOI] [PMC free article] [PubMed] [Google Scholar]
- 2. Chaussy C., Brendel W., and Schmiedt E., “ Extracorporeally induced destruction of kidney stones by shock waves,” Lancet 316, 1265–1268 (1980). 10.1016/S0140-6736(80)92335-1 [DOI] [PubMed] [Google Scholar]
- 3. Bailey M. R., Mcateer J. A., Pishchalnikov Y. A., Hamilton M. F., and Colonius T., “ Progress in lithotripsy research,” Acoust. Today 2, 18–29 (2006). 10.1121/1.2961131 [DOI] [Google Scholar]
- 4. McAteer J. A., Bailey M. R., Williams J. C., Cleveland R. O., and Evan A. P., “ Strategies for improved shock wave lithotripsy,” Minerva Urol. Nefrol. 57, 271–287 (2005). [PubMed] [Google Scholar]
- 5. Maxwell A. D., Cunitz B. W., Kreider W., Sapozhnikov O. A., Hsi R. S., Harper J. D., Bailey M. R., and Sorensen M. D., “ Fragmentation of urinary calculi in vitro by burst wave lithotripsy,” J. Urol. 193, 338–344 (2015). 10.1016/j.juro.2014.08.009 [DOI] [PMC free article] [PubMed] [Google Scholar]
- 6. May P. C., Kreider W., Maxwell A. D., Wang Y. N., Cunitz B. W., Blomgren P. M., Johnson C. D., Park J. S. H., Bailey M. R., Lee D., Harper J. D., and Sorensen M. D., “ Detection and evaluation of renal injury in burst wave lithotripsy using ultrasound and magnetic resonance imaging,” J. Endourol. 31, 786–792 (2017). 10.1089/end.2017.0202 [DOI] [PMC free article] [PubMed] [Google Scholar]
- 7. Wang Y.-N., Kreider W., Hunter C., Cunitz B., Thiel J., Starr F., Dai J., Nazari Y., Lee D., Williams J. C., Bailey M. R., and Maxwell A. D., “ Burst wave lithotripsy: An in vivo demonstration of efficacy and acute safety using a porcine model,” J. Acoust. Soc. Am. 144, 1780 (2018). 10.1121/1.5067867 [DOI] [PMC free article] [PubMed] [Google Scholar]
- 8.“ Break WaveTM Extracorporeal Lithotripter First-in-Human Study - Full Text View - ClinicalTrials.gov,” available at https://clinicaltrials.gov/ct2/show/NCT03811171 (Last viewed January 5, 2020).
- 9.“ Intraoperative Assessment of Burst Wave Lithotripsy (BWL) - Full Text View - ClinicalTrials.gov,” available at https://clinicaltrials.gov/ct2/show/NCT03873259 (Last viewed January 5, 2020).
- 10. Sorensen M. D., Bailey M. R., Shah A. R., Hsi R. S., Paun M., and Harper J. D., “ Quantitative assessment of shockwave lithotripsy accuracy and the effect of respiratory motion,” J. Endourol. 26, 1070–1074 (2012). 10.1089/end.2012.0042 [DOI] [PMC free article] [PubMed] [Google Scholar]
- 11. Eisenmenger W., “ The mechanisms of stone fragmentation in ESWL,” Ultrasound Med. Biol. 27, 683–693 (2001). 10.1016/S0301-5629(01)00345-3 [DOI] [PubMed] [Google Scholar]
- 12. Sapozhnikov O. A., Maxwell A. D., MacConaghy B., and Bailey M. R., “ A mechanistic analysis of stone fracture in lithotripsy,” J. Acoust. Soc. Am. 121, 1190–1202 (2007). 10.1121/1.2404894 [DOI] [PubMed] [Google Scholar]
- 13. Maxwell A. D., MacConaghy B., Bailey M. R., and Sapozhnikov O., “ Generation of guided waves during burst wave lithotripsy as a mechanism of stone fracture,” J. Acoust. Soc. Am. 144, 1779 (2018). 10.1121/1.5067864 [DOI] [Google Scholar]
- 14. Assimos D., Krambeck A., Miller N. L., Monga M., Murad M. H., Nelson C. P., Pace K. T., Pais V. M., Pearle M. S., Preminger G. M., Razvi H., Shah O., and Matlaga B. R.,“ Surgical management of stones: American Urological Association/Endourological Society guideline, part I,” J. Urol. 196, 1153–1160 (2016). 10.1016/j.juro.2016.05.090 [DOI] [PubMed] [Google Scholar]
- 15. Melde K., Mark A. G., Qiu T., and Fischer P., “ Holograms for acoustics,” Nature 537, 518–522 (2016). 10.1038/nature19755 [DOI] [PubMed] [Google Scholar]
- 16. Zhang L., Zhang L., Mou X., and Zhang D.,“ FSIM: A feature similarity index for image quality assessment,” IEEE Trans. Image Process. 20, 2378–2386 (2011). 10.1109/TIP.2011.2109730 [DOI] [PubMed] [Google Scholar]
- 17. Kim Y., Maxwell A. D., Hall T. L., Xu Z., Lin K.-W., and Cain C. A., “ Rapid prototyping fabrication of focused ultrasound transducers,” IEEE Trans. Ultrason. Ferroelectr. Freq. Control. 61, 1559–1574 (2014). 10.1109/TUFFC.2014.3070 [DOI] [PubMed] [Google Scholar]
- 18. Liu Y. and Zhong P., “ BegoStone: A new stone phantom for shock wave lithotripsy research (L),” J. Acoust. Soc. Am. 112, 1265–1268 (2002). 10.1121/1.1501905 [DOI] [PubMed] [Google Scholar]
- 19. Esch E., Simmons W. N., Sankin G., Cocks H. F., Preminger G. M., and Zhong P., “ A simple method for fabricating artificial kidney stones of different physical properties,” Urol. Res. 38, 315–319 (2010). 10.1007/s00240-010-0298-x [DOI] [PMC free article] [PubMed] [Google Scholar]
- 20. Randad A. P., Ahn J. S., Bailey M. R., Kreider W., Harper J. D., Sorensen M. D., and Maxwell A. D., “ The impact of dust and confinement on fragmentation of kidney stones by shockwave lithotripsy in tissue phantoms,” J. Endourol. 33, 400–406 (2019). 10.1089/end.2018.0516 [DOI] [PMC free article] [PubMed] [Google Scholar]
- 21. Eisenmenger W., Du X., Tang C., Zhao S., Wang Y., Rong F., Dai D., Guan M., and Qi A., “ The first clinical results of ‘wide-focus and low-pressure’ ESWL,” Ultrasound Med. Biol. 28, 769–774 (2002). 10.1016/S0301-5629(02)00507-0 [DOI] [PubMed] [Google Scholar]
- 22. Sasaki K., Azuma T., Kawabata K. I., Shimoda M., Kokue E. I., and Umemura S. I., “ Effect of split-focus approach on producing larger coagulation in swine liver,” Ultrasound Med. Biol. 29, 591–599 (2003). 10.1016/S0301-5629(02)00792-5 [DOI] [PubMed] [Google Scholar]
- 23. Cain C. A. and Umemura S., “ Concentric-ring and sector-vortex phased-array applicators for ultrasound hyperthermia,” IEEE Trans. Microw. Theory Tech. 34, 542–551 (1986). 10.1109/TMTT.1986.1133390 [DOI] [Google Scholar]
- 24. Pishchalnikov Y. A., McAteer J. A., Williams J. C., Connors B. A., Handa R. K., Lingeman J. E., and Evan A. P., “ Evaluation of the LithoGold LG-380 lithotripter: In vitro acoustic characterization and assessment of renal injury in the pig model,” J. Endourol. 27, 631–639 (2013). 10.1089/end.2012.0611 [DOI] [PMC free article] [PubMed] [Google Scholar]


