

Abstract
Purpose:
Cancer has long-term financial consequences. Adolescent and young adult (AYA) and middle-aged cancer survivors may experience more financial toxicity than older adults. This study examined age differences in financial distress in hematopoietic cell transplant survivors and whether these differences result from measurement bias, more financial barriers to care or an overall higher level of distress.
Methods:
Hematologic malignancy survivors (n=1,135, 2–10 years post-transplant) completed the Cancer and Treatment Distress scale (CTXD) and demographics as part of the baseline assessment for a randomized clinical trial. The CTXD has seven subscales but for this study we examined the financial distress subscale and the overall score. Item response theory analyses tested for bias by age and gender. Multivariate linear regression tested the association of age and gender with the CTXD scores while controlling for financial barriers to care.
Results:
No bias was found on the CTXD. AYA (p<0.01) and middle-aged adults (p<0.001) reported more financial and overall distress than older (age 65+) adults. The same association of age and financial distress was observed in women (p<0.01). However, only middle-aged men (p<0.01) reported more financial and overall distress than older men; AYA men did not (p>0.18). Financial barriers to care were not associated with financial or overall distress.
Conclusions:
Part of the increase in financial distress with younger age may be due to a higher risk of general distress. Policy initiatives to control cancer costs should consider life stage and the unique financial challenges at different ages for men and women.
Keywords: financial burden, economic well-being, financial health, financial toxicity, economic problems
Introduction
The cost of healthcare continues to increase as it has over the past several decades [1, 2]. Even in countries with universal healthcare, cost sharing means the financial consequences of care is still a concern [3–5]. Countries with and without government-run healthcare are increasingly shifting costs to patients [6]. Hematopoietic cell transplantation is particularly expensive, costing well over $100,000 within the first year [7], with known financial impacts on long-term health care adherence [8]. Financial toxicity may be defined as any negative effect of cancer or its treatment on a patient’s finances [9]. Previous studies have reported a wide range of prevalence of financial toxicity in cancer, from 16% to 80%, depending in part on how toxicity is measured [8, 10–14]. Indisputably, financial toxicity in patients with cancer is associated with worse quality of life [15–18], with one study demonstrating that bankruptcy predicted lower survival rates [19]. Financial distress is somewhat different from financial toxicity. Financial toxicity often includes increased debt or draining savings while financial distress refers to the emotional effects of high cancer costs including worry about one’s financial future and distress over increased financial toxicity.
In the United States, most research on financial toxicity and costs associated with cancer care, along with the proposed solutions, are in older adults and the Medicare population more specifically [20, 21]. But subsequent work shows that adolescent and young adults age 18–39 (AYAs) and women are more at risk for financial toxicity such as bankruptcy [10, 22, 23]. A study using the Medical Expenditure Panel Survey found that younger age was associated with higher risk of both financial toxicity and financial distress in cancer survivors [10]. However, reasons for this age difference, as well as whether it differs by gender, has been studied less.
Age differences in financial distress can result from several reasons. First, the items on questionnaires may be biased meaning that older adults, AYAs and middle-aged adults are responding to the questions differently [24]. Another possibility is that AYAs and middle-aged cancer survivors are at higher risk of overall distress, including financial distress. An additional explanation could be that financial toxicity and barriers to healthcare, known to be more common with younger age, increases the risk of financial distress. This paper aimed to determine whether financial distress, as measured by the reliable and well validated Cancer and Treatment Distress Scale (CTXD), shows similar age associations as other financial toxicity measures and whether these associations differ by gender. We also tried to ascertain the reasons for these differences, including whether the differences were due to bias in item content, or a general risk for more distress or differences in financial toxicity, specifically financial barriers to healthcare. Although the financial distress subscale of the CTXD has not been specifically examined for other associations with predictors or outcomes, overall distress on the CTXD has been associated with lower income [25] suggesting the increased risk of financial distress may at least partially result from an increased risk for general distress. We hypothesized that AYA and middle-aged survivors would report more distress than older survivors.
Methods
Participants
Baseline data, prior to randomization, were used from the INSPIRE trial, a multicenter randomized controlled trial of an online program for HCT survivors [26]. The online program aims to improve health care adherence and reduce cancer-related distress and depression in HCT survivors (NCT01602211). Recruitment occurred at six transplant centers across the United States from 2014 to 2017. Eligibility criteria were: hematologic malignancy survivor between 2 and 10 years after their first HCT at a participating transplant center (transplant could be autologous or allogeneic); at least 18 years old; living in the USA or Canada; no known recurrent or subsequent malignancy that was actively treated with more than surgical excision in the past 2 years; able to read and understand English adequately to complete the assessments; no other health issues prohibiting computer use (such as visual or cognitive impairment). All potentially eligible transplant survivors were approached at each center, in randomized order as set by the study biostatistician. Patients primarily accessed the program via email and the internet. However, those who lacked internet and/or email access but were otherwise eligible and willing to participate were mailed a paper copy of the baseline assessment and a postagepaid return envelope; these patients are included in these analyses.
Procedure
All procedures and materials were reviewed and approved by the institutional review board (IRB) at the Fred Hutchinson Cancer Research Center in Seattle (#7766), as the coordinating center, and by each of the participating sites‟ IRBs. Participants were initially contacted by their transplant center sending up to two letters of approach that included the study URL, followed by up to six phone calls. On the website, participants provided informed consent and completed the baseline assessment. For participants without internet access, assent and assessment were completed on paper. We used data from the baseline assessment of INSPIRE, prior to randomization, and medical records for the analyses reported here.
Measures
The Cancer and Treatment Distress scale (CTXD) is a 28-item measure assessing various aspects of the cancer experience [27–29]. Instructions asked patients to rate “how much distress or worry (such as feeling upset, tense, sad, frustrated) each item caused you in the past week, even if the event has not happened.” Items addressed various aspects of the cancer experience (dealing with insurance, the emotional toll on my family or other caregivers, not knowing what the future will bring). The response scale is: 0 (none) to 3 (severe). The CTXD has six subscales and an overall mean score: financial distress (3 items); uncertainty (4 items); family strain (3 items); medical demands (3 items); identity (4 items); health burden (4 items). Two items are only scored in the overall mean score. Five additional items comprise the interference scale. The total score is the mean of all items except the interference items. Financial distress items include the cost of healthcare, wondering how to support myself and the family financially, and dealing with insurance. The CTXD has been shown to be reliable and valid in numerous HCT samples [27, 28, 30].
The survey included demographic and disease variables. In addition to age and sex, participants self-reported race/ethnicity, income, education, employment status and current medical issues such as ever having chronic Graft-vs-Host Disease (GVHD). Consistent with other studies of HCT survivors, most of the sample (97%) had some form of insurance so we used six survey questions to assess financial barriers to healthcare as a form of financial toxicity. The barriers measure was developed by the co-author (KLS) using multiple steps including qualitative and quantitative methods. An initial list was presented to survivors and they added items that were missing and relevant to them. The composite set of items were then administered to survivors in this sample and the psychometrics of the measure were tested. The final set of questions asked participants to rate the following items on a three point scale (0=never, 1=sometimes, 2=always): My insurance company makes it difficult to get treatment; it’s difficult for me to afford co-pay costs; medical insurance does not cover what I need; I can’t afford it [medical care]; the cost of treatment is a problem for me; and there are things I would like to do but my insurance company doesn’t cover them. Medical record abstraction was used for defining demographic, disease and treatment variables (date of birth, transplant date, diagnosis, type of treatment).
Statistical Analyses
To confirm the reliability of key measures in this sample, we examined the internal consistency of the CTXD and the financial barriers to healthcare scales using Cronbach’s alpha. We then used item response theory (IRT) to test for bias on the financial distress subscale of the CTXD by age (<65 and 65+) and sex. We used the graded response model (GRM) from the IRT family of models [31]. The GRM estimates two types of parameters for each item, the slope and severity parameters. The slope refers to how accurately the item captures the underlying construct (financial and other distress in this case) and measures how sharply the probability of endorsing an item changes at different levels of the construct. For example, a depressive symptom such as fatigue is not particularly accurate as an indicator of depression and the probability of reporting fatigue would only slowly increase as one becomes more depressed. This is contrasted with depressed mood, a more accurate indicator, and a sudden increase in probability of reporting depressed mood would be expected as a person moves from none or minimal depressive symptoms to mild or moderate levels. The severity parameter refers to how much of the construct is reflected by an item or, in the case of multiple category response options, each response category. In the example above, fatigue would likely not indicate severe depression as several other factors could explain the symptom, but suicidal ideation would most definitely indicate severe depression.
To test for bias by age and sex, different slope and severity parameters are estimated for each group and then compared for statistically significant differences using a Χ2 test [32]. Bias refers to an item reflecting the group membership and not the actual construct it is supposed to measure. For example, measures of depression do not typically include measures about crying because they are biased by gender due to social prescriptions about behavior. As testing so many items and across multiple groups can lead to Type-I errors, we used the Benjamini-Hochberg correction for multiple tests [33, 34]. This correction divides the alpha level between each test, allowing for a more lenient alpha level on the largest ranked p-value and the least lenient alpha level for the lowest ranked p-value.
To test for sex and age effects, we used multiple linear regression adjusting for other demographic and disease covariates in the first block: education, income, race/ethnicity, rurality, working part-time or full-time (not working as reference group), transplant center for HCT (site 1 as reference group), time since diagnosis, donor type- autologous (reference group) vs. related-donor allogeneic vs. unrelated-donor allogeneic, treatment intensity, and graft-vs-host disease at any point. The second block entered financial barriers to healthcare to test our hypothesis that financial toxicity may account for the age differences. The third block added age at participation in the study and gender for the first two regressions. For the regressions separated by gender, the regressions were the same but including either only males or females. The financial distress subscale and the CTXD total score were the outcomes. We included the CTXD total score to test our third hypothesized reason for the age difference, namely that younger age is associated with higher overall risk of distress. Age was coded into three groups based on the interest in differences from Medicare beneficiaries (65 and older) and on the definition from the National Cancer Institute that defines AYA survivors as between ages 15 and 39; older adults 65+ were the reference group. We first ran regressions with the total sample, then ran two sensitivity analyses. The first sensitivity analysis stratified the total sample by autologous versus allogeneic transplant (donor type). These analyses did not control for donor type and the autologous analyses did not control for graft-vs-host disease. The second sensitivity analysis stratified the age analyses by gender. CTXD scores were checked for substantial skewness and kurtosis and diagnostics for multicollinearity were examined in the multiple regressions. IRTPRO 4.2 was used for IRT analyses and SPSS 25 was used for regressions and descriptive statistics.
Data Availability Statement
The data that support the findings of this study are available from the corresponding author upon reasonable request.
Results
Sample Description
Of 1,135 enrolled participants who completed the CTXD, 1,006 completed all demographic items and are included in regressions (Figure 1), with income most commonly missing (Table 1). Table 1 provides descriptive statistics. More than half the sample was between the ages of 40 and 64 (57.1%). Only 16.7% reported living in a rural area and slightly less than half the sample was female. The most common cancer diagnosis was non-Hodgkin’s lymphoma (35%). Most participants had an autologous transplant (55%) and myeloablative treatment (88%).
Figure 1:
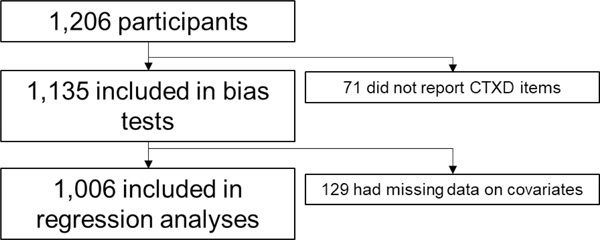
Sample flow diagram.
Table 1:
Demographic and Disease Characteristics of the Sample.
| Variable | N (%) or mean (standard deviation) | ||
|---|---|---|---|
| Total N=1135 | Women n=534 | Men n=601 | |
| Age at survey | 57.37(12.43) | 55.76(12.60) | 58.80(12.10) |
| 18 to 39 years of age | 117(10%) | 69(13%) | 48(8%) |
| 40 to 64 years of age | 645(57%) | 314(59%) | 331(55%) |
| 65 years of age and older | 373(33%) | 151(28%) | 222(37%) |
| Rural residence | 184(16%) | 92(17%) | 92(15%) |
| Female | 534(47%) | 534(100%) | 0(0%) |
| Education | |||
| No post-high school degree | 380(34%) | 197(37%) | 183(30%) |
| 2-year degree or certification or higher | 711(63%) | 315(59%) | 396(66%) |
| Missing | 44(4%) | 22(4%) | 22(4%) |
| Income | |||
| Below $60,000/year | 409(36%) | 222(42%) | 187(31%) |
| $60,000 to $100,000/year | 311(27%) | 138(26%) | 173(29%) |
| More than $100,000/year | 309(27%) | 118(22%) | 191(32%) |
| Missing | 106(9%) | 56(11%) | 50(8%) |
| Race and Ethnicitya | |||
| White only | 1017(90%) | 473(89%) | 544(91%) |
| Hispanic | 44(4%) | 16(3%) | 28(5%) |
| African-American or Black only | 29(3%) | 19(4%) | 10(2%) |
| Other (Mixed race, Asian, Native American) | 45(4%) | 26(5%) | 19(3%) |
| Employment | |||
| Not working for pay | 603(53%) | 298(56%) | 305(51%) |
| Working part-time for pay | 137(12%) | 76(14%) | 61(10%) |
| Working full-time for pay | 351(31%) | 139(26%) | 212(35%) |
| Missing | 44(4%) | 21(4%) | 23(4%) |
| Currently Married | 811(71%) | 353(66%) | 458(76%) |
| Diagnosis | |||
| Non-Hodgkin’s lymphoma | 393(35%) | 155(29%) | 238(40%) |
| Multiple myeloma | 243(21%) | 134(25%) | 109(18%) |
| AML | 173(15%) | 86(16%) | 87(15%) |
| Hodgkin lymphoma | 76(7%) | 43(8%) | 33(6%) |
| MDS | 70(6%) | 34(6%) | 36(6%) |
| ALL | 62(6%) | 26(5%) | 36(6%) |
| Other | 118(10%) | 56(11%) | 62(10%) |
| Time since first transplant, years | 5.26(2.17) | 5.17(2.11) | 5.33(2.22) |
| Donor Type | |||
| Autologous | 629(55%) | 285(53%) | 344(57%) |
| Allogeneic, related donor | 214(19%) | 113(21%) | 101(17%) |
| Allogeneic, unrelated donor | 292(26%) | 136(25%) | 156(27%) |
| Treatment Intensity | |||
| Myeloablative | 1001(88%) | 469 (88%) | 532 (89%) |
| Non-myeloablative | 134(12%) | 65 (12%) | 69 (12%) |
| History of chronic GVHD b | 273(24%) | 143 (27%) | 130 (22%) |
| Completed survey on paper | 139(12%) | 54 (10%) | 85 (14%) |
| CTXD Scores | |||
| Overall mean score | 0.87 (0.61) | 0.94 (0.62) | 0.81 (0.59) |
| Finances | 0.77 (0.82) | 0.82 (0.85) | 0.71 (0.78) |
=80% of Hispanic participants marked “other” or “white” for race
=GVHD, graft versus host disease history of moderate-severe intensity requiring systemic treatment, self-reported; CTXD, Cancer and Treatment Distress
Measure Reliability
For the CTXD with this sample, internal consistency reliability was high (α=0.96 for overall mean and α=0.80 for financial distress). The measure of financial barriers to healthcare had good reliability (α= 0.88). Using principal components analysis with promax rotation, the six items load on one factor with all items loading at 0.69 or higher. The financial barriers scale was negatively associated with two survey items about accessing care: always get health care needed (spearman’s rho=−0.65, p<0.001) and always follow treatment recommendations (cost-related non-adherence, spearman’s rho=−0.45, p<0.001).
Bias Test
When comparing older adults with middle aged and AYA adults, no bias was found on the financial distress subscale (p>0.01). Because of the small number of AYA participants (n=117), we collapsed that group with the middle-aged adult group. For gender, no bias by sex was found on the financial distress items (p>0.21).
Age and Sex Differences
Results for the multiple regressions of the total sample are reported in Table 2. For the financial distress subscale, no significant gender differences were found (p=0.48) but middle-aged adults (40–64 years old, p<0.001) and AYAs (<40 years old, p<0.001) reported significantly more financial distress than older adults. Financial barriers to healthcare could not account for this association and was not significantly associated with financial distress (p=0.58). However, a similar pattern was seen for overall distress (CTXD total score). There was no gender difference in overall distress (p=0.40) but middle-aged adults (p<0.001) and AYAs (p=0.001) reported more distress than older adults. Financial barriers to healthcare were not associated with overall distress (p=0.19). The betas for age differences in financial and overall distress were comparable to the betas for income, although the changes in R2’s were small.
Table 2:
Multiple regressions comparing age group and sex (N=1006, women n=466, men n=540).
| Financial Distress | Total Distress | |||||
|---|---|---|---|---|---|---|
| Block | Variable | Beta | P-value | Variable | Beta | P-value |
| First | Hispanic | 0.063 | 0.043 | Hispanic | 0.046 | 0.128 |
| Black | 0.058 | 0.055 | Black | 0.025 | 0.410 | |
| Other race | 0.104 | 0.001 | Other race | 0.087 | 0.004 | |
| 2-year degree or higher | −0.047 | 0.150 | 2-year degree or higher | −0.087 | 0.006 | |
| Median Income to 100,000/year | −0.150 | <0.001 | Median Income to 100,000/year | −0.112 | 0.001 | |
| Over 100,000/year income | −0.267 | <0.001 | Over 100,000/year income | −0.170 | <0.001 | |
| Years since first transplant | −0.004 | 0.896 | Years since first transplant | −0.030 | 0.345 | |
| Related donor, allogeneic | −0.016 | 0.679 | Related donor, allogeneic | −0.057 | 0.128 | |
| Unrelated donor, allogeneic | 0.002 | 0.971 | Unrelated donor, allogeneic | −0.028 | 0.500 | |
| Non-myeloablative treatment | 0.006 | 0.843 | Non-myeloablative treatment | −0.007 | 0.836 | |
| Rural home address | 0.007 | 0.828 | Rural home address | 0.035 | 0.268 | |
| GVHD | 0.171 | <0.001 | GVHD | 0.238 | <0.001 | |
| Working part-time | 0.028 | 0.376 | Working part-time | −0.062 | 0.046 | |
| Working full-time | 0.012 | 0.725 | Working full-time | −0.134 | <0.001 | |
| Site 2 | 0.022 | 0.551 | Site 2 | 0.015 | 0.679 | |
| Site 3 | 0.032 | 0.353 | Site 3 | 0.061 | 0.071 | |
| Site 4 | 0.005 | 0.892 | Site 4 | 0.007 | 0.855 | |
| Site 5 | 0.007 | 0.842 | Site 5 | 0.061 | 0.076 | |
| Site 6 | 0.046 | 0.184 | Site 6 | 0.003 | 0.926 | |
| R2=0.118 | R2=0.146 | |||||
| Second | Financial Barriers to Healthcare | 0.017 | 0.579 | Financial Barriers to Healthcare | 0.039 | 0.193 |
| R2 change<0.001 | R2 change=0.001 | |||||
| Third | Female | −0.022 | 0.474 | Female | 0.025 | 0.404 |
| Middle-aged adult | 0.246 | <0.001 | Middle-aged adult | 0.168 | <0.001 | |
| AYA | 0.135 | <0.001 | AYA | 0.119 | 0.001 | |
| R2 change=0.040 | R2 change=0.022 | |||||
GVHD=Graft vs. Host Disease, AYA=Adolescent and Young Adult Cancer Survivor.
When stratified by donor type, results from those receiving an allogeneic transplant were similar to those for the total sample (Table 3). For those with only an autologous transplant, middle-aged adults reported more financial (p<0.001) and overall distress (p<0.001) than older adults (Table 4). However, AYAs reported slightly more financial distress (p=0.045) but not more overall distress (p=0.075) than older adults in the autologous subsample. Similar to the total sample, financial barriers to healthcare were not associated with financial distress (p>0.42) nor overall distress (p>0.20) in either the autologous or allogeneic subsamples.
Table 3:
Multiple regressions comparing age groups and sex in allogeneic transplant survivors (n=458).
| Financial Distress | Total Distress | |||||
|---|---|---|---|---|---|---|
| Block | Variable | Beta | P-value | Variable | Beta | P-value |
| First | Hispanic | 0.042 | 0.362 | Hispanic | 0.035 | 0.438 |
| Black | 0.030 | 0.495 | Black | −0.009 | 0.829 | |
| Other race | 0.115 | 0.010 | Other race | 0.064 | 0.141 | |
| 2-year degree or higher | −0.042 | 0.383 | 2-year degree or higher | −0.106 | 0.023 | |
| Median Income to 100,000/year | −0.095 | 0.062 | Median Income to 100,000/year | −0.023 | 0.648 | |
| Over 100,000/year income | −0.283 | <0.001 | Over 100,000/year income | −0.130 | 0.014 | |
| Years since first transplant | 0.033 | 0.483 | Years since first transplant | 0.032 | 0.492 | |
| Non-myeloablative treatment | −0.009 | 0.838 | Non-myeloablative treatment | −0.023 | 0.605 | |
| Rural home address | −0.005 | 0.908 | Rural home address | 0.016 | 0.729 | |
| GVHD | 0.173 | <0.001 | GVHD | 0.251 | <0.001 | |
| Working part-time | 0.028 | 0.547 | Working part-time | −0.086 | 0.057 | |
| Working full-time | −0.054 | 0.281 | Working full-time | −0.192 | <0.001 | |
| Site 2 | 0.016 | 0.739 | Site 2 | 0.004 | 0.922 | |
| Site 3 | 0.043 | 0.370 | Site 3 | 0.081 | 0.086 | |
| Site 4 | 0.042 | 0.425 | Site 4 | 0.033 | 0.521 | |
| Site 5 | 0.054 | 0.291 | Site 5 | 0.105 | 0.035 | |
| Site 6 | 0.063 | 0.182 | Site 6 | −0.020 | 0.660 | |
| R2=0.151 | R2=0.200 | |||||
| Second | Financial Barriers to Healthcare | 0.002 | 0.971 | Financial Barriers to Healthcare | 0.036 | 0.419 |
| R2 change<0.001 | R2 change=0.001 | |||||
| Third | Female | −0.027 | 0.545 | Female | 0.060 | 0.175 |
| Middle-aged adult | 0.273 | <0.001 | Middle-aged adult | 0.141 | 0.012 | |
| AYA | 0.210 | 0.001 | AYA | 0.179 | 0.003 | |
| R2 change=0.043 | R2 change=0.023 | |||||
AYA=Adolescent and Young Adult Cancer Survivor
Table 4:
Multiple regressions comparing age groups and sex in autologous transplant survivors (n=548).
| Financial Distress | Total Distress | |||||
|---|---|---|---|---|---|---|
| Block | Variable | Beta | P-value | Variable | Beta | P-value |
| First | Hispanic | 0.079 | 0.062 | Hispanic | 0.040 | 0.342 |
| Black | 0.079 | 0.062 | Black | 0.040 | 0.333 | |
| Other race | 0.088 | 0.036 | Other race | 0.098 | 0.019 | |
| 2-year degree or higher | −0.042 | 0.349 | 2-year degree or higher | −0.060 | 0.177 | |
| Median Income to 100,000/year | −0.207 | <0.001 | Median Income to 100,000/year | −0.199 | <0.001 | |
| Over 100,000/year income | −0.263 | <0.001 | Over 100,000/year income | −0.212 | <0.001 | |
| Years since first transplant | −0.037 | 0.410 | Years since first transplant | −0.091 | 0.038 | |
| Non-myeloablative treatment | 0.009 | 0.836 | Non-myeloablative treatment | 0.000 | 0.991 | |
| Rural home address | 0.010 | 0.818 | Rural home address | 0.050 | 0.259 | |
| Working part-time | 0.019 | 0.652 | Working part-time | −0.045 | 0.288 | |
| Working full-time | 0.071 | 0.126 | Working full-time | −0.087 | 0.056 | |
| Site 2 | −0.001 | 0.980 | Site 2 | 0.000 | 0.996 | |
| Site 3 | 0.001 | 0.990 | Site 3 | 0.028 | 0.571 | |
| Site 4 | −0.048 | 0.388 | Site 4 | −0.036 | 0.510 | |
| Site 5 | −0.061 | 0.220 | Site 5 | −0.014 | 0.773 | |
| Site 6 | 0.016 | 0.762 | Site 6 | 0.000 | 0.993 | |
| R2=0.097 | R2=0.111 | |||||
| Second | Financial Barriers to Healthcare | 0.034 | 0.418 | Financial Barriers to Healthcare | 0.053 | 0.201 |
| R2 change=0.001 | R2 change=0.003 | |||||
| Third | Female | −0.019 | 0.656 | Female | −0.008 | 0.840 |
| Middle-aged adult | 0.219 | <0.001 | Middle-aged adult | 0.188 | <0.001 | |
| AYA | 0.091 | 0.045 | AYA | 0.081 | 0.075 | |
| R2 change=0.035 | R2 change=0.026 | |||||
AYA=Adolescent and Young Adult Cancer Survivor
When stratified by gender (Tables 5 and 6), the associations of age with distress changed. Financial barriers to healthcare were still not significantly related to either financial distress or overall distress in either men or women (p>0.27). In women, middle-aged adults and AYA women reported more financial distress and more overall distress (p<0.01) than older women. However, in men, only middle-aged men reported more financial distress (p<0.001) and overall distress (p=0.005) than older men whereas AYA men did not differ on distress from older men (p>0.19). Similar to the results for the whole sample, the significant betas for age were comparable in size to those for income but the changes in R2’s were small.
Table 5:
Multiple regressions comparing age group in men (n=540).
| Financial Distress | Total Distress | |||||
|---|---|---|---|---|---|---|
| Block | Variable | Beta | P-value | Variable | Beta | P-value |
| First | Hispanic | 0.109 | 0.011 | Hispanic | 0.075 | 0.078 |
| Black | 0.063 | 0.135 | Black | 0.009 | 0.822 | |
| Other race | 0.133 | 0.002 | Other race | 0.118 | 0.005 | |
| 2-year degree or higher | −0.025 | 0.570 | 2-year degree or higher | −0.060 | 0.167 | |
| Median Income to 100,000/year | −0.155 | 0.002 | Median Income to 100,000/year | −0.092 | 0.064 | |
| Over 100,000/year income | −0.260 | <0.001 | Over 100,000/year income | −0.136 | 0.012 | |
| Years since first transplant | 0.006 | 0.903 | Years since first transplant | −0.001 | 0.980 | |
| Related donor, allogeneic | −0.030 | 0.553 | Related donor, allogeneic | −0.100 | 0.050 | |
| Unrelated donor, allogeneic | −0.017 | 0.765 | Unrelated donor, allogeneic | −0.099 | 0.080 | |
| Non-myeloablative treatment | −0.005 | 0.918 | Non-myeloablative treatment | 0.002 | 0.960 | |
| Rural home address | −0.021 | 0.627 | Rural home address | −0.011 | 0.801 | |
| GVHD | 0.174 | 0.001 | GVHD | 0.256 | <0.001 | |
| Working part-time | 0.066 | 0.128 | Working part-time | −0.011 | 0.800 | |
| Working full-time | 0.049 | 0.303 | Working full-time | −0.149 | 0.002 | |
| Site 2 | −0.006 | 0.911 | Site 2 | −0.036 | 0.467 | |
| Site 3 | 0.071 | 0.136 | Site 3 | 0.069 | 0.139 | |
| Site 4 | 0.007 | 0.899 | Site 4 | 0.002 | 0.973 | |
| Site 5 | 0.008 | 0.860 | Site 5 | 0.031 | 0.514 | |
| Site 6 | 0.034 | 0.484 | Site 6 | −0.024 | 0.612 | |
| R2=0.119 | R2=0.134 | |||||
| Second | Financial Barriers to Healthcare | 0.007 | 0.873 | Financial Barriers to Healthcare | 0.046 | 0.272 |
| R2 change<0.001 | R2 change=0.002 | |||||
| Third | Middle-aged adult | 0.219 | <0.001 | Middle-aged adult | 0.139 | 0.005 |
| AYA | 0.056 | 0.233 | AYA | 0.063 | 0.186 | |
| R2 change=0.034 | R2 change=0.013 | |||||
GVHD=Graft vs. Host Disease, AYA=Adolescent and Young Adult Cancer Survivor, CTXD=Cancer and Treatment Distress Scale.
Table 6:
Multiple regressions comparing age group in women (n=466).
| Financial Distress | Total Distress | |||||
|---|---|---|---|---|---|---|
| Block | Variable | Beta | P-value | Variable | Beta | P-value |
| First | Hispanic | −0.007 | 0.882 | Hispanic | 0.008 | 0.859 |
| Black | 0.059 | 0.186 | Black | 0.031 | 0.476 | |
| Other race | 0.076 | 0.088 | Other race | 0.058 | 0.180 | |
| 2-year degree or higher | −0.065 | 0.189 | 2-year degree or higher | −0.107 | 0.027 | |
| Median Income to 100,000/year | −0.131 | 0.009 | Median Income to 100,000/year | −0.121 | 0.013 | |
| Over 100,000/year income | −0.277 | <0.001 | Over 100,000/year income | −0.181 | <0.001 | |
| Years since first transplant | −0.021 | 0.661 | Years since first transplant | −0.061 | 0.188 | |
| Related donor, allogeneic | 0.011 | 0.859 | Related donor, allogeneic | −0.002 | 0.966 | |
| Unrelated donor, allogeneic | 0.040 | 0.542 | Unrelated donor, allogeneic | 0.064 | 0.314 | |
| Non-myeloablative treatment | 0.019 | 0.700 | Non-myeloablative treatment | −0.014 | 0.774 | |
| Rural home address | 0.033 | 0.493 | Rural home address | 0.078 | 0.096 | |
| GVHD | 0.163 | 0.009 | GVHD | 0.209 | 0.001 | |
| Working part-time | −0.015 | 0.746 | Working part-time | −0.116 | 0.011 | |
| Working full-time | −0.059 | 0.234 | Working full-time | −0.145 | 0.003 | |
| Site 2 | 0.062 | 0.258 | Site 2 | 0.071 | 0.189 | |
| Site 3 | −0.006 | 0.907 | Site 3 | 0.042 | 0.394 | |
| Site 4 | 0.004 | 0.946 | Site 4 | 0.009 | 0.863 | |
| Site 5 | 0.002 | 0.977 | Site 5 | 0.089 | 0.085 | |
| Site 6 | 0.070 | 0.172 | Site 6 | 0.035 | 0.487 | |
| R2=0.142 | R2=0.174 | |||||
| Second | Financial Barriers to Healthcare | 0.043 | 0.342 | Financial Barriers to Healthcare | 0.041 | 0.359 |
| R2 change=0.002 | R2 change=0.002 | |||||
| Third | Middle-aged adult | 0.296 | <0.001 | Middle-aged adult | 0.224 | <0.001 |
| AYA | 0.229 | <0.001 | AYA | 0.191 | 0.001 | |
| R2 change=0.058 | R2 change=0.035 | |||||
GVHD=Graft vs. Host Disease, AYA=Adolescent and Young Adult Cancer Survivor, CTXD=Cancer and Treatment Distress Scale.
Discussion
This study examined the association of age and gender with financial distress in hematologic malignancy survivors treated with HCT. To determine whether these associations were unique to financial distress, we also examined overall distress. First, we established that the measure of interest, the financial distress subscale of the CTXD, did not show bias by age or gender. This eliminated our first hypothesized reason for previous age difference, namely that how the items were written led to people responding differently by age. We found that middle aged adults (40–64 years old) of both genders, and female AYAs (ages 18–39 years) reported more financial and overall distress than older adults (aged 65 years or older). Of note, these age and gender differences in financial distress persisted after adjusting for employment status, financial barriers to healthcare and other socioeconomic and treatment indicators. Our results suggest the increased financial distress in middle aged and AYA survivors was not due to measurement bias or increased difficulty paying for care but rather because these survivors are at increased risk of distress overall with financial distress being an important component. Age differences in the total sample were more consistently seen among allogeneic transplant survivors than autologous transplant survivors, possibly due to the increased costs and burden of graft-vs-host-disease. Although the effect sizes were small, the differences by age were comparable to the size of the effects for income.
The most strongly supported hypothesis, AYA and middle aged survivors are more at risk for distress in general, is consistent with a previous study showing an association of overall distress with financial distress [35] and a longitudinal study of material financial problems that showed financial problems predicted later distress [36]. As the age differences in financial problems [37] and general distress [38, 39] have been shown in the general population, this suggests that the major stressor of a cancer diagnosis and transplant might exacerbate age differences in resources present before the cancer diagnosis. Our results in conjunction with previous research, suggests that age differences in resources before the cancer lead to more financial problems and financial distress and this could then trigger more overall distress.
Overall, our results are consistent with other research showing that adults under age 65 experience more financial toxicity than adults 65 or older [22, 23]. Extending previous research, we also compared AYAs, as well as middle aged adults, to older adults. Middle aged men and women reported more financial distress than their older counterparts while only AYA women, and not AYA men, reported more distress than their older counterparts. A possible explanation for our pattern of results is the so-called ‘sandwich generation’, which is defined as middle age adults who are caring for elderly parents while also raising children or partially supporting young adult children [40, 41]. People in this situation experience more financial demands and depend more on income from employment, making them particularly vulnerable if the cancer affects their ability to work. Although we did control for current income and employment status, we did not have a measure of pre-cancer income. With the proliferation of research on outcomes on AYA cancer survivors, surprisingly few have examined sex differences in survivorship needs, with very few considering financial burden in this context [42].
In addition to financial demands from family caregiving, wealth at diagnosis could also explain the financial distress differences and could be measured in future studies. Wealth is the accumulation of money and other forms of capital, including extended family resources, as opposed to regular income which is recurrent amounts of money coming in [43, 44]. People with more wealth may be better able to endure the financial costs of cancer, despite changes in yearly income. Gender and age differences in wealth could account for the distress effects found in this study [45]. Although we did consider financial barriers to healthcare, it is possible that financial problems outside of the cancer such as paying for basic needs is more difficult for younger adults with less wealth and this accounts for the increased financial and overall distress.
Study Limitations
The contributions of these findings should be noted within the limitations of the study. Our cohort was limited to HCT recipients and may not generalize to hematologic malignancy patients who are not treated with this procedure. Due to sample size limitations, we were only able to test for age bias on the CTXD between two age groups (older adults vs. middle age/AYA) and had to combine the AYA and middle age groups for the bias analyses. Our sample was also predominantly white, consistent with the HCT population as a result of access to donors for other races, although we did include autologous transplants. The focus on survivors means the results might not translate to newly diagnosed people. Patients must have health insurance in order to receive a transplant; hence, the vast majority of our sample was insured although we did not have information on type of insurance. Although we were able to assess whether participants were still working for pay, we did not have a measure of underemployment, which is common after transplant and would be expected to contribute to financial strain [46, 47]. This study was also cross-sectional so we were unable to determine any causal relationship between financial distress òr general distress.
Clinical Implications
These results have implications for policy and clinical research. First, our finding that adults under age 65 reported more financial distress suggests that policy efforts to control cancer costs need to focus on these populations [48]. However, insurance changes may not be sufficient as financial barriers to healthcare was not associated with financial distress. Financial distress may be driven by changes in earning potential and ability to afford basic needs besides healthcare. Second, future research on financial counseling interventions in the oncology setting may need to consider different life stages and more research is needed on the reasons for the age and gender differences, particularly as health insurance and employment not fully account for them. As income was significant, future research may need to consider income and wealth. In sum, our results support a continued focus on novel ways of addressing the financial toxicity often experienced by cancer survivors.
Acknowledgments
Funding Sources: This research was funded by National Institutes of Health, National Cancer Institute (NIH/NCI) grant R01 CA160684 and R01 CA215134. This work was also in part supported by grants from the NIH/NCI CA112631, and CA18029, and through the NIH/NCI Cancer Center Support Grant P30 CA015704
Footnotes
Compliance with Ethical Standards
Ethical Approval: All procedures performed in studies involving human participants were in accordance with the ethical standards of the institutional research committee and with the 1964 Helsinki declaration and its later amendments or comparable ethical standards.
Informed Consent: Informed consent was obtained from all individual participants included in this study.
Conflict of Interest: The authors do not have any financial conflicts of interest to disclose.
Publisher's Disclaimer: This Author Accepted Manuscript is a PDF file of a an unedited peer-reviewed manuscript that has been accepted for publication but has not been copyedited or corrected. The official version of record that is published in the journal is kept up to date and so may therefore differ from this version.
References
- 1.Dieleman JL, et al. , Factors Associated With Increases in US Health Care Spending, 1996–2013. JAMA, 2017. 318(17): p. 1668–1678. [DOI] [PMC free article] [PubMed] [Google Scholar]
- 2.Anderson GF, et al. , It’s the prices, stupid: why the United States is so different from other countries. Health Aff (Millwood), 2003. 22(3): p. 89–105. [DOI] [PubMed] [Google Scholar]
- 3.Morgan SG and Lee A, Cost-related non-adherence to prescribed medicines among older adults: a cross-sectional analysis of a survey in 11 developed countries. BMJ Open, 2017. 7(1): p. e014287. [DOI] [PMC free article] [PubMed] [Google Scholar]
- 4.Hennessy D, et al. , Out-of-pocket spending on drugs and pharmaceutical products and cost-related prescription non-adherence among Canadians with chronic disease. Health Rep, 2016. 27(6): p. 3–8. [PubMed] [Google Scholar]
- 5.Litwin H. and Sapir EV, Forgone health care due to cost among older adults in European countries and in Israel. Eur J Ageing, 2009. 6(3): p. 167–176. [DOI] [PMC free article] [PubMed] [Google Scholar]
- 6.Hossein Z. and Gerard A, Trends in cost sharing among selected high income countries−−2000–2010. Health Policy, 2013. 112(1–2): p. 35–44. [DOI] [PubMed] [Google Scholar]
- 7.Saito AM, et al. , Costs of allogeneic hematopoietic cell transplantation with high-dose regimens. Biol Blood Marrow Transplant, 2008. 14(2): p. 197–207. [DOI] [PMC free article] [PubMed] [Google Scholar]
- 8.Khera N, et al. , Financial burden in recipients of allogeneic hematopoietic cell transplantation. Biol Blood Marrow Transplant, 2014. 20(9): p. 1375–81. [DOI] [PubMed] [Google Scholar]
- 9.Azzani M, Roslani AC, and Su TT, The perceived cancer-related financial hardship among patients and their families: a systematic review. Support Care Cancer, 2015. 23(3): p. 889–98. [DOI] [PubMed] [Google Scholar]
- 10.Yabroff KR, et al. , Financial Hardship Associated With Cancer in the United States: Findings From a Population-Based Sample of Adult Cancer Survivors. J Clin Oncol, 2016. 34(3): p. 259–67. [DOI] [PMC free article] [PubMed] [Google Scholar]
- 11.Kale HP and Carroll NV, Self-reported financial burden of cancer care and its effect on physical and mental health-related quality of life among US cancer survivors. Cancer, 2016. 122(8): p. 283–9. [DOI] [PubMed] [Google Scholar]
- 12.Jagsi R, et al. , Long-term financial burden of breast cancer: experiences of a diverse cohort of survivors identified through population-based registries. J Clin Oncol, 2014. 32(12): p. 1269–76. [DOI] [PMC free article] [PubMed] [Google Scholar]
- 13.Huntington SF, et al. , Financial toxicity in insured patients with multiple myeloma: a cross-sectional pilot study. Lancet Haematol, 2015. 2(10): p. e408–16. [DOI] [PubMed] [Google Scholar]
- 14.Bestvina CM, et al. , Patient-oncologist cost communication, financial distress, and medication adherence. J Oncol Pract, 2014. 10(3): p. 162–7. [DOI] [PMC free article] [PubMed] [Google Scholar]
- 15.Sharp L, Carsin AE, and Timmons A, Associations between cancer-related financial stress and strain and psychological well-being among individuals living with cancer. Psychooncology, 2013. 22(4): p. 745–55. [DOI] [PubMed] [Google Scholar]
- 16.Ell K, et al. , Economic stress among low-income women with cancer: effects on quality of life. Cancer, 2008. 112(3): p. 616–25. [DOI] [PubMed] [Google Scholar]
- 17.Hamilton JG, et al. , Economic survivorship stress is associated with poor health-related quality of life among distressed survivors of hematopoietic stem cell transplantation. Psychooncology, 2013. 22(4): p. 911–21. [DOI] [PMC free article] [PubMed] [Google Scholar]
- 18.Lathan CS, et al. , Association of Financial Strain With Symptom Burden and Quality of Life for Patients With Lung or Colorectal Cancer. J Clin Oncol, 2016. 34(15): p. 1732–40. [DOI] [PMC free article] [PubMed] [Google Scholar]
- 19.Ramsey SD, et al. , Financial Insolvency as a Risk Factor for Early Mortality Among Patients With Cancer. J Clin Oncol, 2016. 34(9): p. 980–6. [DOI] [PMC free article] [PubMed] [Google Scholar]
- 20.Ramsey SD, et al. , Chemotherapy use, outcomes, and costs for older persons with advanced non-small-cell lung cancer: evidence from surveillance, epidemiology and end results-Medicare. J Clin Oncol, 2004. 22(24): p. 4971–8. [DOI] [PubMed] [Google Scholar]
- 21.Rogowski J, Lillard LA, and Kington R, The financial burden of prescription drug use among elderly persons. Gerontologist, 1997. 37(4): p. 475–82. [DOI] [PubMed] [Google Scholar]
- 22.Banegas MP, et al. , Medical Care Costs Associated With Cancer in Integrated Delivery Systems. J Natl Compr Canc Netw, 2018. 16(4): p. 402–410. [DOI] [PubMed] [Google Scholar]
- 23.Ramsey S, et al. , Washington State cancer patients found to be at greater risk for bankruptcy than people without a cancer diagnosis. Health Aff (Millwood), 2013. 32(6): p. 1143–52. [DOI] [PMC free article] [PubMed] [Google Scholar]
- 24.Hjermstad MJ, et al. , Using reference data on quality of life--the importance of adjusting for age and gender, exemplified by the EORTC QLQ-C30 (+3). Eur J Cancer, 1998. 34(9): p. 1381–9. [DOI] [PubMed] [Google Scholar]
- 25.Knight JM, et al. , Patient-Reported Outcomes and Socioeconomic Status as Predictors of Clinical Outcomes after Hematopoietic Stem Cell Transplantation: A Study from the Blood and Marrow Transplant Clinical Trials Network 0902 Trial. Biol Blood Marrow Transplant, 2016. 22(12): p. 2256–2263. [DOI] [PMC free article] [PubMed] [Google Scholar]
- 26.Syrjala KL, et al. , Engagement with INSPIRE, an Online Program for Hematopoietic Cell Transplantation Survivors. Biol Blood Marrow Transplant, 2018. [DOI] [PMC free article] [PubMed] [Google Scholar]
- 27.Syrjala KL, et al. , Cancer and treatment distress psychometric evaluation over time: A BMT CTN 0902 secondary analysis. Cancer, 2017. 123(8): p. 1416–1423. [DOI] [PMC free article] [PubMed] [Google Scholar]
- 28.Syrjala KL, Yi JC, and Langer SL, Psychometric properties of the Cancer and Treatment Distress (CTXD) measure in hematopoietic cell transplantation patients. Psychooncology, 2016. 25(5): p. 529–35. [DOI] [PMC free article] [PubMed] [Google Scholar]
- 29.Syrjala KL, Scoring manual for the Cancer and Treatment Distress (CTXD) Scale. 2016, Fred Hutchinson Cancer Research Center: Seattle, WA. [Google Scholar]
- 30.Majhail NS, et al. , Randomized controlled trial of individualized treatment summary and survivorship care plans for hematopoietic cell transplantation survivors. Haematologica, 2018. [DOI] [PMC free article] [PubMed] [Google Scholar]
- 31.Samejima F, Estimation of a latent ability using a response pattern of graded scores. 1969. 34 (suppl 4). [Google Scholar]
- 32.Lord FM, A study of item bias, using item characteristic curve theory, in Basic Problems in Cross-Cultural Psychology, Portinga YH, Editor. 1977, Swets and Zeitlinger: Amsterdam; p. 19–29. [Google Scholar]
- 33.Benjamini Y. and Hochberg Y, Controlling the false discovery rate: A practical and powerful approach to multiple testing. Journal of the Royal Statistical Society, Series B, 1995. 57: p. 289–300. [Google Scholar]
- 34.Thissen D, Steinberg L, and Kuang D, Quick and easy implementation of the Benjamini-Hochberg procedure for controlling the false positive rate in multiple comparisons. Journal of Educational and Behavioral Statistics, 2002. 27(1): p. 77–83. [Google Scholar]
- 35.Meeker CR, et al. , Relationships Among Financial Distress, Emotional Distress, and Overall Distress in Insured Patients With Cancer. J Oncol Pract, 2016. 12(7): p. e755–64. [DOI] [PMC free article] [PubMed] [Google Scholar]
- 36.Jones SMW, Nguyen T, and Chennupati S, Association of financial burden with self-rated and mental health in older adults with cancer. Journal of Aging and Health, In Press. [DOI] [PubMed] [Google Scholar]
- 37.Yabroff KR, et al. , Prevalence and Correlates of Medical Financial Hardship in the USA. J Gen Intern Med, 2019. 34(8): p. 1494–1502. [DOI] [PMC free article] [PubMed] [Google Scholar]
- 38.Stone AA, et al. , A snapshot of the age distribution of psychological well-being in the United States. Proc Natl Acad Sci U S A, 2010. 107(22): p. 9985–90. [DOI] [PMC free article] [PubMed] [Google Scholar]
- 39.Urry HL and Gross JJ, Emotion regulation in older age. Current Directions in Psychological Science, 2010. 19(6): p. 352–357. [Google Scholar]
- 40.Grundy E. and Henretta JC, Between elderly parents and adult children: a new look at the intergenerational care provided by the ‘ sandwich generation’. Aging and Society, 2006. 26: p. 707–722. [Google Scholar]
- 41.Spillman BC and Pezzin LE, Potential and active family caregivers: changing networks and the “sandwich generation”. Milbank Q, 2000. 78(3): p. 347–74, table of contents. [DOI] [PMC free article] [PubMed] [Google Scholar]
- 42.Geue K, et al. , Gender-specific quality of life after cancer in young adulthood: a comparison with the general population. Qual Life Res, 2014. 23(4): p. 1377–86. [DOI] [PubMed] [Google Scholar]
- 43.Income, in Merriam-Webster. 2019, Merriam-Webster.
- 44.Wealth, in Merriam-Webster. 2019, Merriam Webster.
- 45.Sierminska EM, Frick JR, and Grabka MM, Examining the gender wealth gap. Oxford Economic Papers, 2010. 62(4): p. 669–690. [Google Scholar]
- 46.Tichelli A, et al. , Inability to work and need for disability pension among long-term survivors of hematopoietic stem cell transplantation. Bone Marrow Transplant, 2017. 52(10): p. 1436–1442. [DOI] [PubMed] [Google Scholar]
- 47.Kirchhoff AC, Leisenring W, and Syrjala KL, Prospective predictors of return to work in the 5 years after hematopoietic cell transplantation. J Cancer Surviv, 2010. 4(1): p. 33–44. [DOI] [PMC free article] [PubMed] [Google Scholar]
- 48.Financial Toxicity and Cancer Treatment (PDQ®)–Health Professional Version, N.C. Institute, Editor. 2017: Bethesda, MD. [Google Scholar]
Associated Data
This section collects any data citations, data availability statements, or supplementary materials included in this article.
Data Availability Statement
The data that support the findings of this study are available from the corresponding author upon reasonable request.