

Abstract
The articular cartilage has been the subject of a huge amount of research carried out with a wide array of different techniques. Most of the existing morphological and ultrastructural data on this tissue, however, were obtained either by light microscopy or by transmission electron microscopy. Both techniques rely on thin sections and neither allows a direct, face-on visualization of the free cartilage surface (synovial surface), which is the only portion subject to frictional as well as compressive forces. In the present research, high resolution visualization by scanning electron microscopy and by atomic force microscopy revealed that the collagen fibrils of the articular surface are exclusively represented by thin, uniform, parallel fibrils evocative of the heterotypic type IX-type II fibrils reported by other authors, immersed in an abundant matrix of glycoconjugates, in part regularly arranged in phase with the D-period of collagen. Electrophoresis of fluorophore-labeled saccharides confirmed that the superficial and the deeper layers are quite different in their glycoconjugate content as well, the deeper ones containing more sulfated, more acidic small proteoglycans bound to thicker, more heterogeneous collagen fibrils. The differences found between the synovial surface and the deeper layers are consistent with the different mechanical stresses they must withstand.
Key words: Cartilage, collagen, glycosaminoglycans, SEM, AFM, PAGEFS
Introduction
Pathologies and alterations of the articular cartilage represent the most important chronic conditions in developed countries. With the steady increase of the lifespan and of the active working life these pathologies are bound to impact ever more deeply on the national health expenditure and on the social cost represented by lost work hours. Far more important, however, are the limitation of social activities and the aggravation of the quality of life that these pathologies cause, particularly in elderly subjects.
Articular cartilage has been for a long time the subject of extensive research and the essential lines of its architecture and composition are well known.1 Briefly, the articular cartilage is a fiber-reinforced composite material with collagen fibrils immersed in a functionally amorphous, highly hydrated matrix. The collagen fibrils emerge perpendicularly from the bone/cartilage interface and form wide arches, becoming tangential to the synovial surface as they approach this latter; the interfibrillar matrix contains specific proteins, hyaluronic acid, large proteoglycans (aggrecan and versican) and small leucine-rich proteoglycans2 linked to chondroitinsulfates (CS) and keratansulfates (KS), depending from the availability of oxygen.3 The cartilage is a physiologically hypoxic tissue, whose oxygen content decreases sharply from the synovial surface to the deepest layers.
While the whole thickness of articular cartilage is involved in resisting compressive forces, its synovial surface is the only portion also subject to friction and to additional shearing forces. It is therefore not unreasonable to hypothesize a different architecture of the synovial surface with respect to the underlying matrix, and it does not come unexpected that degenerative processes of this tissue begin with the disruption of this surface.4-6
So far, the vast majority of the research on articular cartilage was carried out with section-based techniques, i.e. light microscopy (LM) and/or transmission electron microscopy (TEM). Although well-known and (in the case of TEM) endowed with an excellent resolution, these techniques are only applicable to cartilage sections (usually radial sections) and cannot provide a direct, face-on visualization of the cartilage surface. Other techniques such as second harmonic generation (SHG)7-9 or diffusion tensor imaging (DTI)10 remain below the resolution of conventional histology and/or still rely on tissue sections. Fourier transform infrared (FT-IR) imaging11-13 also relies on sectioned material and, while it can provide complex chemical information on the structure and composition of the tissue, it is again limited in terms of spatial resolution. RAMAN14-16 and small-angle X-ray scattering (SAXS)17-19 are not imaging techniques at all but they have been applied to the study of collagen fibres orientation10 or of the structural changes at the cartilage/bone interface.15,17-19
Relatively few ultrastructural studies, scattered across a timespan of several decades, tried to investigate the surface of articular cartilage with appropriate high-resolution visualization techniques.9,20-28
The present research was carried out with surface-based visualization techniques such as scanning electron microscopy (SEM) and atomic force microscopy (AFM) on healthy bovine articular cartilage as an attempt to improve our understanding of this tissue. Individual samples from the synovial surface and from the subsurface matrix were also analysed for differences in their glycosaminoglycans (GAGs) content and sulfation state.
Materials and Methods
Fragments of healthy bovine articular cartilages were obtained at the abattoir. Samples were pooled from different joints; samples from fresh cartilage were either shaved off as thin as possible from the cartilage surface or taken from the subsurface matrix and processed for glycoconjugate content.
Light microscopy
Samples intended for light microscopy were fixed overnight in Karnowski’s solution (5% paraformaldehyde + 4% glutaraldehyde in 0.1 M phosphate buffer, pH 7.4), embedded in paraffin, sectioned and stained with Hematoxylin-Eosin (0.5% Harris’ Hematoxylin for 10 min, 0.25% Eosin for 10 min), Toluidine Blue (1% solution for 10-15 min at 70°C), Sirius Red (1% Sirius Red in saturated picric acid for 10 min) or Stains-All (0.005% Stains-All in 50% ethanol for 1 min).
All the samples were observed with a Nikon Eclipse 300 photomicroscope (Nikon, Tokyo, Japan) fitted with a Nikon Digital Sight DS-U1 camera.
Atomic force microscopy
Specimens intended for AFM visualization of the synovial surface were directly dehydrated in graded ethanol and in hexamethyldisilazane (Sigma-Aldrich, St. Louis, MO, USA). Some specimens were frozen in solidifying propane at approximately -188°C and fractured under liquid nitrogen at -196°C in order to obtain clean, unblemished surfaces across the whole cartilage thickness.
Specimens from both the superficial and deeper portions were treated overnight in 0.05% Cupromeronic Blue (Seikagaku Corp., Tokyo, Japan) in 25 mM sodium acetate buffer containing 2.5% glutaraldehyde and 0.1 M MgCl2, then dehydrated as above. Other samples were fixed overnight in Karnowski’s solution, then immersed for 5 days in daily changed NaOH 2N, rinsed for 24 h in distilled water and dehydrated as above.
All these specimens were mounted on appropriate holders and observed with a Digital Instruments (now Bruker, Billerica, MA, USA) MultiMode NanoscopeIIIa Atomic Force Microscope, fitted with MikroMaschHi-Res-C15/Cr-Au-5 probes (MikroMasch, Sofia, Bulgaria) and operated in Tapping Mode at a scan rate of 1 Hz. Images were rendered in 3D with Nanoscope Analysis v1.50 (Bruker).
Scanning Electron Microscopy
Specimens for SEM were fixed in Karnowski’solution, dehydrated in graded ethanol and hexamethyldisilazane, mounted on appropriate stubs with a colloidal silver glue, gold coated with an Emitech K550 sputter-coater (Emitech, Montigny-le-Bretonneux, France) and observed with a FEI XL-30 FEG high resolution SEM (now Thermo Fisher, Waltham, MA, USA) operated in secondary electron imaging at an acceleration voltage of 7 kV. At least three fragments were observed for each sample. Images were directly obtained as 8bpp, 1424x968 TIFF files.
GAGs extraction from bovine articular cartilage
Fresh cartilage from surface layer and deep zone of bovine articular cartilage was collected and used for GAGs extraction. Cartilage explant was cut into smaller pieces of about 1 x 5 mm and subjected to homogenization for 4 h in 1 mL of guanidine buffer, pH 5.0, containing 4 M guanidinium hydrochloride (VWR Chemicals BDH), 50 mM sodium acetate (Sigma-Aldrich) and protease inhibitors (SIGMAFAST™ Protease Inhibitor Cocktail Tablets, EDTA-Free from Sigma-Aldrich). The samples were incubated for 24 h at 4°C in rotation and, after a gentle centrifugation (20 min at 600 g at 4°C), the supernatant was collected. Following Karousou et al.29 method for GAGs isolation, 9 volumes of cold pure ethanol per sample were added and the samples were left for 18 h at -20°C to precipitate proteoglycans and GAGs. After centrifugation (14,000 g x 40 min at 4°C), the pellet containing GAGs and proteins were resuspended in 0.1 M ammonium-acetate pH7. To remove proteins, samples were digested at 50°C for 3 h in gentle agitation with 20 U/mL of proteinase K (Finnzymes, now Thermo Fisher). The enzymatic treatment was terminated by boiling for 5 min. After an overnight incubation with cold pure ethanol (1:9) and a consequently centrifugation, the GAGs have been found in the pellet. Samples were resuspended in water for the quantification and for the agarose gel, while the rest of the sample were lyophilized and used for disaccharides extraction.
Uronic acid determination
The total GAGs concentration was determined measuring the glucuronic acid present in the sample following the method of van den Hoogen et al.30 Using a 96-well plate, at 40 μL of sample were added 200 μL of concentrated sulfuric acid (80% w/w) and the plate was placed in a heater for 1 h at 80°C. After cooling at room temperature, the background absorbance of samples was measured at 540 nm on a microplate reader (Infinite M200 Pro, Tecan, Männedorf, Switzerland). Then 40 μL of 3-Hydroxy-biphenyl solution [100 μL of 3-Hydroxy-biphenyl (Fluka, St. Gallen, Switzerland) in dimethyl sulfoxide (Sigma-Aldrich), 100 mg/mL, mixed with 4.9 ml of 80 % sulfuric acid] was added. After an overnight incubation at room temperature in the dark, the pink-colored compound was read again at 540 nm. A standard curve with D-Glucuronic acid (Fluka) of 0, 0.5, 1, 2.5, 5, 10, 25, 50, 100, 150, 200 μg/mL was included in the plate. The background was subtracted from the last reading and the uronic acid content was interpolated from the corresponding reference curve. From each mg of fresh cartilage were extracted about 6.5 μg (surface) and about 8.3 μg (deep) of GAGs.
Agarose gel of GAGs
Horizontal gel electrophoresis was performed with GAGs isolated from cartilage and standards GAGs to assure their identities. Solutions of 1 mg/mL of each standard were prepared using hyaluronic acid sodium salt from human umbilical cord (Sigma- Aldrich), keratansulfate sodium salt from bovine cornea (Sigma- Aldrich), chondroitin 4-sulfate (CSA) sodium salt from whale cartilage (Seikagaku), chondroitin 6-sulfate (CSC) sodium salt from shark cartilage (Seikagaku), dermatan sulfate (CSB) sodium salt from pig skin (Seikagaku), heparansulfate from bovine kidney (Sigma-Aldrich).
Total GAGs extracted from cartilage (2 μg) and standards GAGs (7 μg) were applied to a 4% agarose gel in TAE 1x. After 40 min at 20 V and 4 h at 40 V, the gel was fixed and stained with 0.005% Stains-All (Sigma-Aldrich) for an overnight incubation in the dark. Then the gel was plated in distilled water in the dark for two days to remove the dye excess.
Disaccharides extraction from long chain GAGs of bovine articular cartilage
Lyophilized GAGs extracted from cartilage were resuspended in 100 μL of ammonium-acetate 0.1 M pH 7 and incubated with 0.1 mU/μL of Chondroitinase ABC from Proteus vulgaris (Sigma- Aldrich) for 5 h at 37°C. After an overnight incubation with cold pure ethanol (1:9) and centrifugation at 14,000 g for 40 min at 4°C, the sample was composed by the supernatant containing disaccharides of CS and the pellet with the others long chain GAGs. Then, to extract heparansulfates (HS) disaccharides, the pellet was resuspended in 100 μL of ammonium-acetate and incubated with a mix of Heparinase I, II and III from Flavobacterium heparinum (Sigma-Aldrich), 0.5 mU/μL each enzyme, for 18 h at 37°C. Disaccharides of HS were recovered in the supernatant and lyophilized. Commercial disaccharides of CS (Sigma-Aldrich) and HS (Seikagaku) were used as standards for polyacrylamide gel electrophoresis of fluorophore-labeled saccharides (PAGEFS) analysis.
Figure 1.
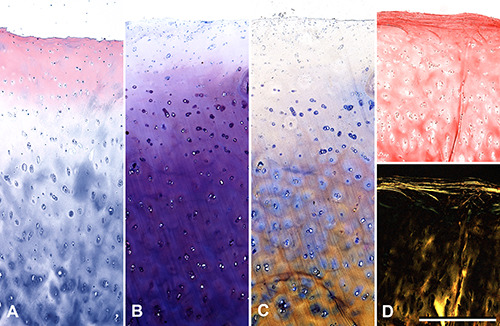
Histological sections of cartilage stained with Hematoxylin-Eosin (A), Toluidine Blue (B), Stains-All (C) and Sirius Red (D, top) consistently demonstrate a differential staining between a superficial zone, approximately 200-300 μm thick, and the underlying matrix. Sirius Red also reveals under crossed polars (D, bottom) a more compact and ordered layout of the superficial collagen fibrils, while Stains-All highlights the difference among the chondrocytes and their territorial matrix in different layers. All pictures are the same magnification; scale bars: 500 μm.
Derivatization procedure
Derivatization of 5 nmol of each standards disaccharides and disaccharides derived from cartilage was done followed as described by Viola et al.31,32 Briefly, a 40 μL volume of 12.5 mM of AMAC solution in glacial acetic acid/DMSO (3:17, v/v) was added and samples were incubated for 15 min at room temperature. A 40 μL volume of 1.25 M NaBH3CN in water was added to each sample followed by an overnight incubation at 37°C.
PAGEFS
A MiniProtean III Cell vertical slab gel electrophoresis apparatus (Bio-Rad, Hercules, CA, USA) was used for disaccharides separation on gel electrophoresis following the protocol described by Viola et al.31,32 PAGEFS for distinguish CS disaccharides requested different conditions in confront to HS disaccharides.
For CS, the stock solutions were 1.5 M Tris-HCl pH 8.8, 1.5 M Tris-Borate pH 8.8 (1.5 M Tris-HCl and 0.7 M of boric acid), acrylamide solution T50%/C7.5% and T50%/C15% (%T refers to the concentration (w/v) of acrylamide monomer and %C refers to the concentration (w/w) of cross-linker relative to the monomer). Using a 7.2 cm plates, 0.75 mm spacer, and wells of 0.5 cm, the resolving gel (for two gels) was prepared adding 5 mL of T50%/C7.5%, 1.25 mL of Tris-HCl, 1.25 mL of Tris-Borate and distilled water up to 10 mL. Then, 5 μL of TEMED and 50 μL of 10% (w/v) ammonium persulfate were added for the polymerization, while the stacking gel was prepared adding 0.5 mL of T50%/C15%, 1.2 mL of Tris-HCl and distilled water up to 5 mL plus TEMED and ammonium persulfate as done for the resolving. The running buffer was 150 mMTris–Borate pH 8.8 and the run was performed at 4°C at 400 V for 1 h.
For HS, an acrylamide solution of T50%/C5% was used for gel preparation. A 6 mL volume of T50%/C5%, 2.5 mL of 1.5 M Tris- HCl pH 8.8 and water up to 10 mL plus 5 μL of TEMED and 50 μL of 10% (w/v) ammonium persulfate were added to make the resolving gel (for two gels), while the stacking gel was arranged with 0.5 mL of T50%/C5%, 1.2 mL of 0.5 M Tris-HCl pH 6.8 and water up to 5 mL plus TEMED and ammonium persulfate as described before. The run was performed in 25 mMTris-HCl and 192 mM of glycine pH 8.3 at 4°C at 180 V for 45 min and at 400 V for 15 min. Gels were scanned in a UV-light box using a CCD camera (Gel Doc 2000 System) from Bio-Rad Laboratories.
Results
All histological techniques confirmed the different nature of the cartilage superficial layer with respect of the underlying matrix (Figure 1). Samples stained with Hematoxylin-Eosin showed near the surface a pink color in unequivocal contrast with the pale blue staining of the deeper matrix. After treatment with Toluidine Blue and with Stains-all the surface remained far less stained than the subsurface matrix. In particular, Stains-All revealed a wider range of reactivity among the surface, the territorial matrix and the pericellular (territorial) matrix. Picro-Sirius Red under polarized light evidenced thin but compact layers of collagen fibrils immediately beneath the synovial surface, again contrasting with the scarce luminescence of the subsurface.
The color-code identification of GAGs (Figure 2) revealed that chondroitin-4-sulfate and dermatansulfate represent the most abundant species, followed by chondroitin-6-sulfate. Heparansulfate was also present, in particular in the deepest layers, while keratansulfate resulted essentially undetectable.
Analysis of the sulfation state of disaccharides required two distinct gels for polyacrylamide gel electrophoresis of fluorophorelabeled saccharides (PAGEFS), with different technical settings for the chondroitinsulfates (Figure 3A) and the heparansulfates (Figure 3B). The standards disaccharides used for PAGEFS are summarized in Table 1. The results reveal an evident undersulfation of the chondroitin residues near the synovial surface (diCS surface) with respect to those of the deeper layers (diCS deep), especially evident in the chondroitin-4-sulfate (ΔdiCS-4S) and the chondroitin sulfate in the position 2 of the uronic acid residue (ΔdiCS-(UA)2S), with more than twice the levels observed on the synovial surface. It is worth mentioning the presence of chondroitin- di- and tri-sulfate. The same trend is present, if somewhat less marked, for the heparansulfates. These contain minor amounts of disulfate, and no trisulfates at all.
Figure 2.

Color identification and analysis of the extracted glycosaminoglycans on agarose gel stained with Stains-All. The seven lanes correspond (left to right) to: hyaluronic acid 250kDa (HA); GAGs from the deep layers of the cartilage (Deep); GAGs from the synovial surface (Surface); keratansulfate (KS), heparansulfate (HS); dermatansulfate (DS); chondroitin-6-sulfate (CS-6S) and chondroitin-4-sulfate (CS-4S). The differences between the superficial and deeper zones is subtle but visible; in particular the deeper zone contains a greater amount of chondroitin-6-sulfate and heparansulfate.
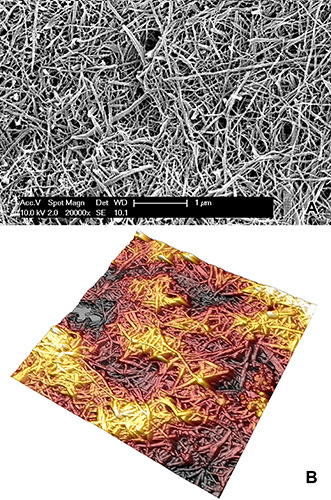
The face-on view of untreated articular cartilage obtained by SEM (Figure 4A) reveals a finely textured surface, randomly scattered with debris and clumps with no apparent pattern; only in some cases collagen fibrils and bound proteoglycans are readily recognizable. Cells were never observed.
By contrast, treatment with Cupromeronic Blue (Figure 4B) exposed very fine parallel fibrils decorated by globular particles and/or interconnected by interfibrillar GAG bridges, especially evident at higher magnification and often regularly arranged in phase with the D-period of collagen. It must be noted that since Cupromeronic Blue precipitates on the GAG chains, these appear thicker than real. The NaOH treatment, by contrast, completely removed the non-collagenous fraction of the synovial surface (Figure 4C). With this technique the surface appeared composed of thin, parallel fibrils of very uniform diameter running parallel for large areas. Because of their small diameter their axial periodicity is barely, if at all, detectable. AFM pictures appeared completely consistent with SEM (Figure 5).
The deeper layer provided pictures quite different from the synovial surface and more consistent with the literature, with collagen fibrils of much larger and heterogeneous diameter laid out almost isotropically (Figure 6A). The thickest fibrils showed an evident D-period. Again, AFM resulted consistent with the SEM data (Figure 6B).
Discussion
Our findings are always consistent among the different techniques used, but under several aspects they diverge from the current knowledge. We did not found clear evidence of the distinct superficial lamina reported by other authors with other techniques.33-36 It must be considered that the synovial surface appears particularly rich in GAGs and in randomly scattered debris, which together on cross-sections may appear as a continuous sheath. Again, we never observed any evidence of the elastic fibers reported by other authors.37 This may be ascribed to speciesrelated differences.38 Both the collagen and the GAG amount seem to increase slightly, if at all, with depth: what does increase visibly is the collagen fibrils diameter and the GAG acidity, which determines the differential staining of the subsurface layers. The specific sulfation pattern of chondroitin and heparansulfates has been shown to critically modulate several aspects of the function and interactions of the extracellular matrix in other tissues39 and in their development.40
Under the SEM, the GAGs of the deeper layers appear smaller and less ordered than the superficial layer, where they form a regular array of interfibrillar filaments in phase with the D-spacing of collagen. It is unclear what may be the contribution of large proteoglycans and hyaluronic acid reported on this site by other authors.41 The Sirius Red staining under crossed polars indicated the presence on and immediately below the surface of compact, organized layers of fibrils. This is consistent with literature9,16,42 and was fully confirmed by our SEM and AFM observation, in particular following the NaOH treatment.
The dimensional heterogeneity of the collagen content between the synovial surface and the deeper layers of articular cartilage is unambiguous and consistent with recent research.28 A recent study43 describes two discrete categories of fibrils with small and uniform fibrils, approximately 20 nm in diameter, distinct from other fibrils characterized by a broad distribution of diameters starting from 40nm, with no fibrils between 20 and 40 nm. SEM requires metal-coated specimens and is not really suited to take quantitative measurements of fibril diameter, but the dimensional homogeneity is unmistakable and consistent with other high-resolution studies.28
Table 1.
Structure of commercial disaccharides used for PAGEFS.
| Chondroitin sulfate (CS) | |
|---|---|
| Abbreviation | Structure |
| Δdi-CS-0S | α-ΔGlcA-GalNAc |
| Δdi-CS-6S | α-ΔGlcA-GalNac(6S) |
| Δdi-CS-4S | α-ΔGlcA-GalNAc(4S) |
| Δdi-CS-(UA)2S | α-ΔGlcA(2S)-GalNAc |
| Δdi-CS-di(4,6)S | α-ΔGlcA(2S)-GalNAc(4S) |
| Δdi-CS-di(2,6)S | α-ΔGlcA(2S)-GalNAc(6S) |
| Δdi-CS-tri(2,4,6)S | α-ΔGlcA(2S)-GalNAc(4,6S) |
| Heparan sulfate (HS) | |
| Abbreviation | Structure |
| Δdi-HS-0S | α-ΔUA-[1→4]-GlcNAc |
| Δdi-HS-NS | α-ΔUA-[1→4]-GlcNS |
| Δdi-HS-6S | α-ΔUA-[1→4]-GlcNAc-6S |
| Δdi-HS-diS2 | α-ΔUA-2S-[1→4]-GlcNS |
| Δdi-HS-diS1 | α-ΔUA-[1→4]-GlcNS-6S |
| Δdi-HS-triS | α-ΔUA-2S-[1→4]-GlcNS-6S |
Figure 3.

Intensity quantification of AMAC-derivatized CS and HS disaccharides from cartilage after PAGEFS. In 3A variously sulfated CS disaccharides[ΔdiCS-0S, ΔdiCS-6S, ΔdiCS-4S and ΔdiCS-(UA)2; see Table 1] extracted from cartilage of surface (diCS surface) and deep (diCS deep) layer were analyzed. In 3B variously sulfated HS disaccharides[ΔdiHS-0S, ΔdiHS-NS, ΔdiHS-6S, ΔdiHS-diS2, ΔdiHS-diS1 and ΔdiHS-triS; see Table 1] extracted from cartilage of surface (diHS surface) and deep (diHS deep) layer were analyzed.
Several studies43-45 point out the different composition of the smaller fibrils, which appear only if collagen XI is present and are composed of type XI, IX and II in a stoichiometric ratio of 1:1:845 or 1:1:6.44 Larger, banded fibrils appear in organisms lacking collagen type XI43or simply when the XI:II ratio falls under 1:8,44 or even when otherwise normal collagen type II is overexpressed45-47 The same thicker fibrils may also represent the lateral aggregation of the thinner fibrils, mediated by enzymatic removal of collagen type IX in the deeper layers.28,43 It must be noted that collagen type XI is structurally and functionally similar to type V:48,49 they both regulate fibrillogenesis by nucleating collagen fibrils, where they remain buried on the inner core and covered by other collagen types. For this reason we did not attempt a direct immunolocalization, which could yield unreliable results. All these data indicate that the synovial surface of the articular cartilage differs from its deeper layers in the composition and architecture of its collagen fibrils and in the species, sulfation and amount of its glycoconjugates; that these differences must reflect a differential production by the superficial and the deep chondrocytes triggered by a different milieu and/or different functional requests, consistently with other studies more focused on the cell fraction that also point out a cause-effect relationship between compressive loading and functional state of chondrocytes, down to chondroptosis and cartilage degeneration;50 and finally that the average composition of the articular cartilage as a whole does not reflect the composition of its synovial surface, which in turn implies that cartilage repair and/or regeneration may be made more efficient by targeting the correct environment and the correct macromolecules. Clearly, this represents just a partial approach to the structural biology of the healthy synovial surface. The research is still underway.
Figure 4.

SEM micrographs of the cartilage surface. The untreated tissue shows a fine, chaotic texture where sporadic bundles of collagen fibrils become visible among a vast amount of debris and GAGs (A). Treatment with Cupromeronic Blue stabilizes the GAGs, which either radiate from the fibrils themselves giving them the appearance of barbed wire, or interconnect adjacent collagen fibrils with orthogonal bridges arranged in phase with the D-period (B). By contrast, NaOH treatment completely removes the GAGs and leaves behind only thin, smooth collagen fibrils of uniform diameter (C).
Figure 5.

AFM micrographs of cartilage specimens corresponding to those of Figure 4. In particular, the untreated surface (A) appears equally irregular while treatment with Cupromeronic Blue (B) thickens the GAG chains and make them more evident on the surface. On the contrary, treatment with NaOH removes everything except the collagen fibrils which are now more clearly visible. All pictures span a viewfield of 5x5 μm.
Figure 6.
Collagen fibrils from the middle layer of freeze-cracked bovine articular cartilage after NaOH treatment. Both SEM (A) and AFM (B) micrographs lie on a fracture plane approximately perpendicular to the cartilage surface, and they both show thicker, heterogeneous collagen fibrils displaying an evident crossbanding. The tissue appears spatially isotropic because the relatively small field of view does not allow a prevailing direction to emerge. Magnification is the same as the previous figures in order to allow a direct comparison with Figures 4C and 5C.
Funding Statement
Funding: The research was entirely supported by the FAR funds of the Insubria University, Varese, Italy.
References
- 1.Benninghoff A. [Form und Bau der Gelenkknorpel in ihren Beziehungen zur Funktion. Zweiter Teil: Der Aufbau des Gelenkknorpels in seinen Beziehungen zur Funktion].[Article in German]. Z Zellforsch Mikrosk Anat 1925;2:783-862. [Google Scholar]
- 2.Iozzo RV, Schaefer L. Proteoglycan form and function: A comprehensive nomenclature of proteoglycans. Matrix Biol 2015;42:11-55. [DOI] [PMC free article] [PubMed] [Google Scholar]
- 3.Scott JE, Stockwell RA, Balduini C, De Luca G. Keratansulphate: a functional substitute for chondroitin sulphate in O2 deficient tissues? Pathol Biol (Paris) 1989;27:742-745. [PubMed] [Google Scholar]
- 4.Buckwalter JA, Mankin HJ. Articular cartilage, part II: degeneration and osteoarthrosis, repair, regeneration, and transplantation. J Bone Joint Surg Am 1997;79:612e32. [Google Scholar]
- 5.Panula HE, Hyttinen MM, Arokoski JP, Långsjö TK, Pelttari A, Kiviranta I, et al. Articular cartilage superficial zone collagen birefringence reduced and cartilage thickness increased before surface fibrillation in experimental osteoarthritis. Ann Rheum Dis 1998;57:237e45. [DOI] [PMC free article] [PubMed] [Google Scholar]
- 6.Bi X, Li G, Doty SB, Camacho NP. A novel method for determination of collagen orientation in cartilage by fourier transform infrared imaging spectroscopy (FT-IRIS). Osteoarthr Cartilage 2005;13:1050e8. [DOI] [PubMed] [Google Scholar]
- 7.Mansfield JC, Mandalia V, Toms A, Winlove CP, Brasselet S. Collagen reorganization in cartilage under strain probed by polarization sensitive second harmonic generation microscopy. J R Soc Interface 2019;16:20180611. [DOI] [PMC free article] [PubMed] [Google Scholar]
- 8.He B, Wu JP, Kirk TB, Carrino JA, Xiang C, Xu J, High-resolution measurements of the multilayer ultra-structure of articular cartilage and their translational potential. Arthritis Res Ther 2014;16:205-15. [DOI] [PMC free article] [PubMed] [Google Scholar]
- 9.Boyanich R, Becker T, Chen F, Kirk TB, Allison G, Wu JP. Application of confocal, SHG and atomic force microscopy for characterizing the structure of the most superficial layer of articular cartilage. J Microsc 2019;275:159–71. [DOI] [PubMed] [Google Scholar]
- 10.Tadimalla S, Tourell MC, Knott R, Momot KI. Assessment of collagen fiber orientation dispersion in articular cartilage by small-angle X-ray scattering and diffusion tensor imaging: Preliminary results. Magn Reson Imaging 2018;48:115-21. [DOI] [PubMed] [Google Scholar]
- 11.Boskey A, Pleshko Camacho N. FT-IR imaging of native and tissue-engineered bone and cartilage. Biomaterials 2007;28:2465-78. [DOI] [PMC free article] [PubMed] [Google Scholar]
- 12.Hanifi A, McCarthy H, Roberts S, Pleshko N. Fourier transform infrared imaging and infrared fiber optic probe spectroscopy identify collagen type in connective tissues. PLoS One 2013;22:e64822. [DOI] [PMC free article] [PubMed] [Google Scholar]
- 13.Oinas J, Rieppo L, Finnilä MA, Valkealahti M, Lehenkari P, Saarakkala S. Imaging of osteoarthritic human articular cartilage using fourier transform infrared microspectroscopy combined with multivariate and univariate analysis. Sci Rep 2016;21:30008. [DOI] [PMC free article] [PubMed] [Google Scholar]
- 14.Bergholt MS, Serio A, Albro MB. Raman spectroscopy: Guiding light for the extracellular matrix. Front Bioeng Biotech 2019;7:303. [DOI] [PMC free article] [PubMed] [Google Scholar]
- 15.Gamsjaeger S, Klaushofer K, Paschalis EP. Raman analysis of proteoglycans simultaneously in bone and cartilage. J Raman Spectrosc 2014;45:794–800. [Google Scholar]
- 16.Mansfield J, Moger J, Green E, Moger C, Winlove CP. Chemically specific imaging and in-situ chemical analysis of articular cartilage with stimulated Raman scattering. J Biophotonics 2013;6:803-14. [DOI] [PubMed] [Google Scholar]
- 17.Žižak I, Paris I, Roschger P, Bernstorff S, Amenitsch H, Klaushofer K, et al. Investigation of bone and cartilage by synchrotron scanning-SAS and -WAXD with micrometer spatial resolution. J App Crystallogr 2000;33:820-3. [Google Scholar]
- 18.Kaabar W, Gundogdu O, Laklouk A, Bunk O, Pfeiffer F, Farquharson MJ, et al. μ-PIXE and SAXS studies at the bonecartilage interface. Appl Radiat Isotopes 2010;68:730-4. [DOI] [PubMed] [Google Scholar]
- 19.Moger CJ, Barrett R, Bleuet P, Bradley DA, Ellis RE, Green EM, et al. Regional variations of collagen orientation in normal and diseased articular cartilage and subchondral bone determined using small angle X-ray scattering (SAXS). Osteoarthr Cartilage 2007;15:682-7. [DOI] [PubMed] [Google Scholar]
- 20.Clark JM. The organisation of collagen fibrils in the superficial zones of articular cartilage. J Anat 1990;171:117-30. [PMC free article] [PubMed] [Google Scholar]
- 21.Walker PS, Sikorski J, Dowson D, Longfield MD, Wright V, Buckley T. Behaviour of synovial fluid on surfaces of articular cartilage. A scanning electron microscope study. Ann Rheum Dis 1969;28:1-14. [DOI] [PMC free article] [PubMed] [Google Scholar]
- 22.Ghadially FN, Ghadially JA, Oryschak AF, Yong NK. The surface of dog articular cartilage: a scanning electron microscope study. J Anat 1977;123:527-36. [PMC free article] [PubMed] [Google Scholar]
- 23.Jurvelin JS, Müller JD, Wong M, Studer D, Engel A, Hunziker EB, Surface and subsurface morphology of bovine humeral articular cartilage as assessed by atomic force and transmission electron microscopy. J Struct Biol 1996;117:45-54. [DOI] [PubMed] [Google Scholar]
- 24.Pellegrini VD, Lane Smith R, Ku CW. Pathobiology of articular cartilage in trapeziometacarpal osteoarthritis. II. Surface ultrastructure by scanning electron microscopy. J Hand Surg 1994;19:79-85 [DOI] [PubMed] [Google Scholar]
- 25.Sawae Y, Murakami T, Matsumoto K, Horimoto M. Study on morphology and lubrication of articular cartilage surface with atomic force microscopy. Jpn J Tribol 2000;45:51-62. [Google Scholar]
- 26.Forster H, Fisher J, The influence of continuous sliding and subsequent surface wear on the friction of articular cartilage. Proc Inst Mech Eng H 1999;213:329-45. [DOI] [PubMed] [Google Scholar]
- 27.Wang M, Peng Z, Wang J, Jiang X. Wear characterisation of articular cartilage surfaces at a nanoscale using atomic force microscopy. Tribol Int 2013;63:235-42. [Google Scholar]
- 28.Gottardi R, Hansen U, Raiteri R, Loparic M, Dueggelin M, Mathys D. Supramolecular organization of collagen fibrils in healthy and osteoarthritic human knee and hip joint cartilage. PloS One 2016;11:e0163552. [DOI] [PMC free article] [PubMed] [Google Scholar]
- 29.Karousou EG, Militsopoulou M, Porta G, De Luca G, Hascall V, Passi A. Polyacrylamide gel electrophoresis of fluorophorelabeled hyaluronan and chondroitin sulfate disaccharides: application to the analysis in cells and tissues. Electrophoresis 2004;25:2919-25. [DOI] [PubMed] [Google Scholar]
- 30.van den Hoogen BM, van Weeren PM, Lopes-Cardozo M, van Golde LM, Barneveld A, van de Lest CH. A microtiter plate assay for the determination of uronic acids. Anal Biochem 1998;257:107-11. [DOI] [PubMed] [Google Scholar]
- 31.Viola M, Karousou EG, Vigetti D, Genasetti A, Pallotti F, Guidetti GF, et al. Decorin from different bovine tissues: study of glycosaminoglycan chain by PAGEFS. J Pharm Biomed Anal 2006;41:36-42. [DOI] [PubMed] [Google Scholar]
- 32.Viola M, Vigetti D, Karousou E, Bartolini B, Genasetti A, Rizzi M, et al. New electrophoretic and chromatographic techniques for analysis of heparin and heparansulfate. Electrophoresis 2008;15:3168-3174. [DOI] [PubMed] [Google Scholar]
- 33.Meachim G, Sheffield SR. Surface ultrastructure of mature adult human articular cartilage. J.Bone Joint Surg Br 1969;51:529-39. [PubMed] [Google Scholar]
- 34.Guerra D, Frizziero L, Losi M, Bacchelli B, Mezzadri G, Pasquali Ronchetti I. Ultrastructural identification of a membrane- like structure on the surface of normal articular cartilage. J Submicr Cytol Pathol 1996;28:385-93. [PubMed] [Google Scholar]
- 35.Kobayashi S, Yonekubo S, Kurogouchi Y. Cryoscanning electron microscopy study of the surface amorphous layer of articular cartilage. J Anat 1995;187:429-44. [PMC free article] [PubMed] [Google Scholar]
- 36.Watanabe M, Leng CG, Toriumi H, Hamada Y, Akamatsu N, Ohno S. Ultrastructural study of upper surface layer in rat articular cartilage by “in vivo cryotechnique” combined with various treatments. Med Electron Microsc 2000;33:16-24. [DOI] [PubMed] [Google Scholar]
- 37.Yu J, Urban JP. The elastic network of articular cartilage: an immunohistochemical study of elastin fibres and microfibrils. J Anat 2010;216:533-41. [DOI] [PMC free article] [PubMed] [Google Scholar]
- 38.Rieppo L, Rieppo J, Jurvelin JS, Saarakkala S. Fourier transform infrared spectroscopic imaging and multivariate regression for prediction of proteoglycan content of articular cartilage. PLoS One 2012;7:e32344. [DOI] [PMC free article] [PubMed] [Google Scholar]
- 39.Hayes AJ, Hughes CE, Ralphs JR, Caterson B. Chondroitin sulphate sulphation motif expression in the ontogeny of the intervertebral disc. Eur Cell Mater 2011;21:1-14. [PubMed] [Google Scholar]
- 40.Collin EC, Kilcoyne M, White SJ, Grad S, Alini M, Joshi L., et al. Unique glycosignature for intervertebral disc and articular cartilage cells and tissues in immaturity and maturity. Sci Rep 2016;6:23062. [DOI] [PMC free article] [PubMed] [Google Scholar]
- 41.Asari A, Miyauchi S, Kuriyama S, Machida A, Kohno K, Uchiyama Y. Localization of hyaluronic acid in human articular cartilage. J Histochem Cytochem 1994;42:513-22. [DOI] [PubMed] [Google Scholar]
- 42.Fujioka R, Aoyama T, Takakuwa T. The layered structure of the articular surface. Osteoarthr Cartilage 2013;21:e1092-8. [DOI] [PubMed] [Google Scholar]
- 43.Holmes DF, Kadler KE. The 10+4 microfibril structure of thin cartilage fibrils. P Natl Acad Sci USA 2006;103:17249-54. [DOI] [PMC free article] [PubMed] [Google Scholar]
- 44.Blaschke UK, Eikenberry E, Hulmes DJS, Galla HJ, Bruckner P. Collagen XI nucleates self-assembly and limits lateral growth of cartilage fibrils. J Biol Chem 2000;275:10370-8. [DOI] [PubMed] [Google Scholar]
- 45.Hagg R, Bruckner P, Hedbom E. Cartilage fibrils of mammals are biochemically heterogeneous: differential distribution of decorin and collagen IX. J Cell Biol 1998;142:285-94. [DOI] [PMC free article] [PubMed] [Google Scholar]
- 46.Vaughan L, Mendler S, Huber P, Bruckner P, Winterhalter KH, Irwin MI, et al. D-periodic distribution of collagen type IX along cartilage fibrils. J Cell Biol 1988;106:991-7. [DOI] [PMC free article] [PubMed] [Google Scholar]
- 47.Garofalo S, Metsäranta M, Ellard J, Smith C, Horton W, Vuorio E, et al. Assembly of cartilage collagen fibrils is disrupted by overexpression of normal type II collagen in transgenic mice. Proc Natl Acad Sci USA 1993;90:3825-9. [DOI] [PMC free article] [PubMed] [Google Scholar]
- 48.[Fichard A, Kleman JP, Ruggiero F. Another look at collagen V and XI molecules. Matrix Biol 1995;14:515-31. [DOI] [PubMed] [Google Scholar]
- 49.Smith SM, Birk DE. Focus on molecules: Collagens V and XI. Exp Eye Res 2012;98:105-6. [DOI] [PMC free article] [PubMed] [Google Scholar]
- 50.Curzi D, Fardetti F, Beccarini A, Salucci S, Burini D, Gesi M, et al. Chondroptotic chondrocytes in the loaded area of chondrocalcinotic cartilage: a clinical proposal? Clin Anat 2018;31:1188-92. [DOI] [PubMed] [Google Scholar]