

SUMMARY
A subset of B-cell acute lymphoblastic leukemia (B-ALL) patients will relapse and succumb to therapy-resistant disease. The bone marrow microenvironment may support B-ALL progression and treatment evasion. Utilizing single-cell approaches, we demonstrate B-ALL bone marrow immune microenvironment re-modeling upon disease initiation and subsequent re-emergence during conventional chemotherapy. We uncover a role for non-classical monocytes in B-ALL survival, and demonstrate monocyte abundance at B-ALL diagnosis is predictive of pediatric and adult B-ALL patient survival. We show human B-ALL blasts alter a vascularized microenvironment promoting monocytic differentiation, while depleting leukemia-associated monocytes in B-ALL animal models prolongs disease remission in vivo. Our profiling of the B-ALL immune microenvironment identifies extrinsic regulators of B-ALL survival supporting new immune-based therapeutic approaches for high-risk B-ALL treatment.
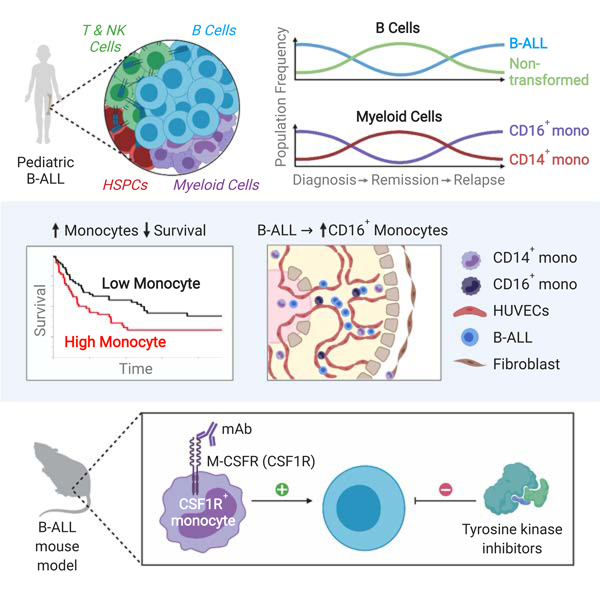
Graphical abstract
INTRODUCTION
B-cell progenitor acute lymphoblastic leukemia (B-ALL) is a clonal hematopoietic neoplasm characterized by the proliferation and accumulation of B-lymphoid progenitor cells throughout the bone marrow. Several important studies have characterized the selective forces and underlying biological pathways that underpin therapy failure by analyzing diagnosis/relapse pairs, ultimately, leading to the discovery of leukemia-intrinsic genetic and epigenetic alterations associated with drug resistance and a model of clonal evolution based on tumor heterogeneity (Evensen et al., 2018; Jones et al., 2015; Ma et al., 2015; Meyer et al., 2013; Mullighan et al., 2008; Yang et al., 2008). Resistance and subsequent relapse associated with standard chemotherapy, targeted therapies and immunotherapeutic approaches (Slayton et al., 2018; Witkowski et al., 2019), remain a leading cause of pediatric cancer-related deaths (Hunger and Mullighan, 2015). One approach to overcoming tumor heterogeneity and immune-based therapy resistance is to assess the role of the bone marrow microenvironment in promoting and supporting leukemia survival and progression.
With the emergence of single-cell transcriptome profiling approaches, it is now possible to deconvolute complex tissues to provide an unprecedented understanding of cellular composition and behavior. A number of recent single-cell studies have characterized the immune microenvironment of human solid tumors (Azizi et al., 2018; Puram et al., 2017; Tirosh et al., 2016), where malignant transformation coincides with extensive re-modeling of the immune microenvironment. These changes have been suggested to support tumor growth through, for example, the establishment of an immunosuppressive milieu resulting from the emergence of regulatory T cell and suppressive myeloid subpopulations as well as an increased abundance of exhausted T cells. In contrast to these solid tumor pathogenesis, B-ALL transformation directly impacts the bone marrow, a major hematopoietic organ, yet the extent to which B-ALL shapes the bone marrow immune microenvironment remains unclear. Furthermore, the architecture of the immune microenvironment and leukemic blast population at disease diagnosis, throughout chemotherapy and, at subsequent disease re-emergence is unknown, and may shed light on mechanisms of extrinsic regulation of relapsed B-ALL.
To address these events during leukemia emergence and progression, we have performed single-cell RNA sequencing (scRNA-Seq) and Cellular Indexing of Transcriptomes and Epitopes by Sequencing (CITE-Seq) (Stoeckius et al., 2017; Zheng et al., 2017). We generated a comprehensive map of the primary human bone marrow immune microenvironment for healthy individuals and primary B-ALL patients at three distinct stages of the leukemic disease process: diagnosis, remission and relapse. We show remodeling of the non-malignant immune bone marrow microenvironment prior to exposure to conventional chemotherapy and identify a non-classical monocyte subpopulation enriched within the myeloid compartment of leukemic diagnosis and relapse bone marrow. Further, through temporal analysis of matched remission and relapse bone marrow samples, we demonstrate the re-emergence of this non-classical monocytic population upon disease recurrence. Using absolute monocyte counts obtained at pediatric B-ALL diagnosis and bulk RNA-Seq data of primary adult B-ALL patient cohorts, we show that monocyte abundance is predictive of inferior overall and relapse-free survival in both pediatric and adult B-ALL, respectively. We then utilize a 3D organotypic microfluidics device to mimic a human vascularized microenvironment, where we show that B-ALL enhances non-classical monocyte differentiation. Finally, using an in vivo Ph+ B-ALL murine model, we demonstrate that targeting monocytes through M-CSFR blockade enhances responses to targeted therapy in vivo, suggesting a conserved role for tumor-associated myeloid subpopulations in acute leukemia survival.
RESULTS
Defining the Immune Microenvironment of Healthy and Diagnosis B-ALL Bone Marrow
The immune landscape of high-risk acute leukemia remains unknown. We performed scRNA-Seq of mononuclear bone marrow specimens taken from seven primary B-ALL patients at disease diagnosis (five EVT6/RUNX1 and two Ph+ B-ALL patients) and four healthy bone marrow donors. To facilitate detailed profiling of the leukemia-associated immune compartment, bone marrow samples were separated into CD19+ B cell and CD19−CD45+ non-B cell fractions by flow-based sorting and then mixed at a ratio of 1:5 CD19+:CD19−CD45+ followed by scRNA-Seq (Figure 1A; Figure S1A-B; Table S1). Total CD45+bone marrow cells were sequenced from healthy donors for comparison. We analyzed 53,447 cells that were processed using the Seurat toolkit utilizing its anchoring-based integration method to account for technical and biological variance between individual samples followed by uniform manifold approximation and projection (UMAP) dimensionality reduction for visualization (Becht et al., 2018; Stuart et al., 2019) (Figure 1B). Sample viability did not significantly correlate with the mean number of detected genes (Pearson r = 0.51, p = 0.108), the number of unique molecular identifiers (UMIs) (Pearson r = 0.38, p = 0.25) nor fraction of mitochondrial RNA transcripts (Pearson r = 0.22, p = 0.522).
Figure 1. B-ALL Remodels the Healthy Bone Marrow Immune Microenvironment.

A, Representative flow cytometry of primary healthy and CD19+CD10+ B-ALL diagnosis bone marrow. B, UMAP visualization of 53,447 individual cells from eleven individual primary thawed mononuclear bone marrow samples taken from healthy donors (n = 4), as well as ETV6/RUNX1 (ETV, n = 5) and Ph+ (PH, n = 2) B-ALL patients. C, Marker-based cell type identification analysis allowed prediction of six broad immune cell types across all profiled single cells. D, Gene expression heatmap of top-10 cell type-specific marker genes as measured by Wilcoxon rank-sum test. E, Expression levels of lineage-specific genes overlaid on the UMAP representation. F, Heatmap showing pair-wise distribution density ratio of the UMAP projections of diagnosis and healthy bone marrow cells. G, Boxplot showing fraction of HSPC, Myeloid and T/NK cells in the non-B cell, non-erythrocytic fraction of individual patients. Wilcoxon rank-sum test performed to measure differences in representation between healthy (H) and diagnosis (D) groups, with p value indicated on plots. Horizontal lines in the boxplots represent the median, the lower and upper hinges correspond to the first and third quartiles, and the whiskers extend from the hinge up to 1.5 times the interquartile range from the hinge. H, Significantly-enriched MSigDB Hallmark gene sets in healthy versus diagnosis cells within each of the immune cell types. Normalized enrichment score (NES) denoted by shade of color highlighted in legend.
We performed extensive unbiased clustering of all bone marrow cells to identify 96 transcriptionally-distinct cell clusters (Figure S1C-D). Cell clusters were classified into six broad hematopoietic cell types-T cell, B cell, Natural Killer (NK), Myeloid (encompassing dendritic cell (DC)/monocytic/granulocytic lineages), Erythrocytic and Hematopoietic Stem and Progenitor Cells (HSPC)-based on relative expression levels of manually curated gene signatures encompassing lineage-specific transcription factors, effector genes and surface markers (Figure 1C-E; Figure SID; Table S2). Due to transcriptional similarities that exist between NK cells and effector T cells, such as CD3D and CD3G mRNA expression within the NK cell cluster, we subsequently merged these cell types to form a “T/NK” group (Figure SID). The response of the different hematopoietic lineages to the emergence of bone marrow B-ALL remains unclear. Specifically, we observed distinct shifts in the composition of the B cell lineage, as well as significant reductions in the fraction of myeloid cells in diagnosis compared to healthy bone marrow (Figure 1F-G). Gene set enrichment analysis across individual cell types using the Molecular Signatures Database (MSigDB) Hallmark gene sets (Liberzon et al., 2015), showed diagnosis B cell lineage cells significantly enriched for gene expression profiles associated with DNA repair and cell cycle progression, likely resulting from a large proportion of transformed B cell progenitors (Figure 1H; Figure S1E). Within the non-B cell immune cell populations of diagnosis samples, for example, interferon alpha and interferon gamma response gene signatures were most pronounced in leukemia-associated myeloid cells, as well as T/NK and HSPC subpopulations (Figure 1H; Figure S1F).
Extensive Remodeling of the Bone Marrow Microenvironment Composition at B-ALL Diagnosis
Having observed significant differences in the response of bone marrow to B-ALL, we hypothesized that individual cell type subpopulation composition may highlight important immune cell changes coinciding with B-ALL pathogenesis. To address this, we directly compared the composition of the broad cell types present in healthy and diagnosis bone marrow. As expected, we observed pronounced changes within the bone marrow B cell compartment at B-ALL diagnosis when compared to healthy controls (Figure 1F, Figure S2A-B). While intrinsic drivers of B-ALL pathogenesis have been extensively characterized using genomic and transcriptomic approaches using bulk cell analysis, single-cell gene expression profiling enables high-resolution dissection of changes in normal B cell development upon leukemic transformation. Here, we identified seven transcriptionally-distinct B cell clusters with differential representation when comparing healthy and diagnosis samples (Figure S2A-C). Notably, two distinct clusters, Healthy/Diagnosis B cell cluster 1 (HD-B1) and HD-B3, were significantly overrepresented in diagnosis B cells when compared to healthy control B cells, likely representing the transformed B cell progenitors (Figure S2B-C). With this in mind, we used diffusion map analysis and gene set enrichment analysis of B cell clusters in order to understand the impact of transformation on B cell differentiation. Here, we found that diagnosis-enriched clusters (HD-B1 and HD-B3) expressed low MKI67 mRNA expression and high IGLL1 mRNA expression, indicative of a B-cell progenitor state (Figure S2D). Interestingly, these diagnosis-enriched clusters exhibited increased Hedgehog Signaling, G2/M Checkpoint and Mitotic Spindle gene expression profiles, indicative of a functional difference to healthy B cell progenitor counterparts (Figure S2E).
Bone marrow T cell proportions in the non-B cell immune population appeared to increase with the reduction of myeloid cells, despite not reaching statistical significance. We identified six transcriptionally-distinct T cell clusters, whereby a CCR7- and LEF1-expressing naive T cell cluster, HD-T1, appeared to be enriched at diagnosis, however, this did not reach statistical significance due to high patient-to-patient variability (Figure S2F-H). High patient-to-patient variability was confirmed using an independent reference-based cell type identification method SingleR based on the Database of Immune Cell Expression (DICE) reference dataset (Aran et al., 2019) (Figure S2I). Here, we observed a significant decrease in “Th1” cells in diagnosis patients when compared to healthy, with all other T cell subsets showing variable representation across both healthy and diagnosis conditions (Figure S2J).
Pronounced Remodeling of the Myeloid Compartment at Diagnosis Significantly Alters Monocyte Differentiation
The myeloid compartment was significantly diminished as a result of emergence of B-ALL in the bone marrow (Figure 1F-G). To understand the specific myeloid subpopulations impacted by leukemia, we identified six transcriptionally-distinct myeloid cell clusters (Figure 2A-C). Here, within the myeloid compartment, we observed a significant reduction in the Healthy/Diagnosis Myeloid cluster, HD-M1, at diagnosis compared to healthy controls. Strikingly, we observed a significant increase in the fraction of myeloid cluster HD-M5 within diagnosis bone marrow (Figure 2E-F). Myeloid cluster-specific gene expression data and diffusion map analysis identified the two myeloid cell types most significantly affected by the presence of bone marrow B-ALL as classical CD14-expressing monocytes (HD-M1), and non-classical CD 16-expressing monocytes (HD-M5), expressing high levels of CSF1R and FCGR3A (encoding CD 16) mRNA (Figure 2C-G). We also noted the presence of CD14+CD16+ monocyte cells (HD-M2), granulocytic myeloid progenitors (HD-M3), CD1C+ dendritic cells (DCs) (HD-M4) and plasmacytoid DCs (HD-M6) (Figure 2G). To validate these findings, we performed an enrichment analysis of validated human myeloid cell transcriptional signatures within our myeloid clusters and found that previously characterized non-classical (Mono2) and classical monocytes (Mono1) are transcriptionally concordant with the HD-M5 and HD-M1 clusters, respectively (Villani et al., 2017) (Figure 2H). To understand functional differences between leukemia-associated non-classical monocytes and their healthy counterparts, we performed differential gene expression analysis, revealing a leukemia-associated upregulation of genes involved in monocyte interactions with vascular endothelium during inflammation and vascular endothelial repair (Gerhardt and Ley, 2015; Getzin et al., 2018; Manuneedhi Cholan et al., 2018), such as PECAM1, CD44, ITGA4, CX3CR1 and TNFSF10, as well as significant downregulation of genes encoding subunits of HLA-DR (Figure 2I).
Figure 2. Bone Marrow-resident Myeloid Cells are Altered in the Presence of Leukemia.

A, UMAP visualization of 7,122 individual Myeloid cells from eleven individual primary thawed mononuclear bone marrow samples taken from healthy donors and B-ALL patients. B, Six transcriptionally distinct Myeloid cell clusters overlaid on the UMAP representation. Cluster abbreviations, for example, HD-M1 is based on Healthy/Diagnosis Myeloid cluster L C, Relative expression of top Myeloid cluster-specific marker genes. D, Expression levels of CD14, FCGR3A and CSF1R in the Myeloid cells overlaid on the UMAP representation. E, Heatmap showing pair-wise distribution density ratio of the UMAP projections of diagnosis and healthy Myeloid cells. F, Boxplot showing fraction of Myeloid clusters in the Myeloid fraction of individual patients. Wilcoxon rank-sum test performed to measure differences in representation between healthy (H) and diagnosis (D) groups, with p value indicated on plots. Horizontal lines in the boxplots represent the median, the lower and upper hinges correspond to the first and third quartiles, and the whiskers extend from the hinge up to 1.5 times the interquartile range from the hinge. G, Diffusion map of Myeloid cells, highlighting putative cluster cell type identity. H, GSVA gene set enrichment scores of myeloid cluster expression profiles based on established human blood monocyte and dendritic cell gene signatures (Villani et al., 2017). I. Heatmap of select differentially-expressed genes (based on KEGG pathways for leukocyte migration, chemotaxis, cytokines, antigen processing) distinguishing diagnosis and healthy non-classical monocytes (HD-M5).
Defining the Changes in the Hematopoietic/Immune Bone Marrow Microenvironment in Response to Chemotherapy
Leukemia relapse remains a leading cause of cancer-related death in children, although the contribution of the leukemia-associated immune microenvironment to this phenomenon remains unclear. We hypothesized that dissection of the microenvironment at leukemic remission and relapse may highlight extrinsic cellular regulators fostering B-ALL re-emergence. To address this, we assessed the immune bone marrow microenvironment composition of remission and relapse samples acquired from the previously described diagnosis B-ALL patients. In all but one case, patients initially diagnosed with B-ALL relapsed with CD19+ B-ALL, whereas patient PH002 relapsed with acute myeloid leukemia (AML). Flow cytometry analysis of PH002 confirmed the presence of a Lineage-negative, CD34+ relapse population immunophenotypically-distinct from the CD19+CD10+ B-ALL present at disease diagnosis (Figure S3A). Here, we analyzed a total of 97,456 single cell transcriptomes from diagnosis (n = 34,407), remission (n = 28,154) and relapse (n = 34,895) B-ALL patient bone marrow samples (Figure 3A). Sample viability did not significantly correlate with the mean number of detected genes (Pearson r = 0.44, p = 0.053), the number of unique molecular identifiers (UMIs) (Pearson r = 0.21, p = 0.386) nor fraction of mitochondrial RNA transcripts (Pearson r = 0.14, p = 0.563). Cells were partitioned into 98 clusters and subsequently classified into six broad immune cell types (Figure 3B; Figure S3B-D).
Figure 3. Bone Marrow Immune B-ALL Microenvironment Throughout Conventional Chemotherapy.

A, UMAP visualization of 97,456 individual cells from seven individual B-ALL patients with matched diagnosis and relapse bone marrow samples-ETV6/RUNX1 B-ALL (ETV, n = 5) and Ph+ B-ALL (PH, n = 2)-as well as matched remission samples in all patients except ETV001. B, Marker-based cell type identification of six broad immune cell types across all profiled cells. C, Six transcriptionally-distinct Myeloid cell clusters overlaid on the UMAP representation. Cluster abbreviations, for example, DRR-M1 is based on Diagnosis/Remission/Relapse Myeloid cluster L D, Gene expression heatmap of top Myeloid cluster-specific marker genes. E, Expression levels of CD14, CSF1R, FCGR3A, CD1C, CDKN1C and FLT3 in the Myeloid cells overlaid on the UMAP representation. F, Boxplot showing fraction of Myeloid clusters in the Myeloid fraction of individual patients. Wilcoxon rank-sum test performed to measure pair-wise differences in representation between diagnosis, remission and relapse groups, with p value indicated on plots. Horizontal lines in the boxplots represent the median, the lower and upper hinges correspond to the first and third quartiles, and the whiskers extend from the hinge up to 1.5 times the interquartile range from the hinge. G, Diffusion map of Myeloid cells, highlighting putative cluster cell type identity. H, GSVA gene set enrichment scores of myeloid cluster expression profiles (Villani et al., 2017). I, Heatmap of select differentially-expressed genes (based on KEGG pathways) distinguishing leukemic (diagnosis or relapse) and remission non-classical monocytes (DRR-M1).
We observed a modest increase in the proportion of the total bone marrow myeloid population at disease remission, when compared to leukemic states (Figure S3E). Further, we found a significant increase in erythropoiesis at remission when compared to diagnosis and relapse, presumably due to the re-emergence of normal hematopoiesis after treatment (Figure S3F). We also identified five major B cell clusters across each disease stage with, for example, a significantly reduction of the largest B-cell cluster, Diagnosis/Remission/Relapse B cell cluster 1 (DRR-B1), from diagnosis to remission, followed by re-emergence at relapse (Figure S4A-C). This cluster appeared to represent non-cycling B cell progenitors, based on low MKI67 mRNA expression and high mRNA expression of early B cell progenitor marker, such as RAG1 and IGLL1 (Figure S4C, S4D-E). Conversely, B cell clusters enriched at remission (DRR-B3, DRR-B4 and DRR-B5), represented progressive B cell maturation, evidenced by increased IGHM and CD40 mRNA expression. Collectively, these data highlight how conventional chemotherapy effectively depletes B cell progenitors while sparing more committed B lineage cells (fig. Figure S4C, S4D-E).
The effect of conventional chemotherapy on the T/NK lineage was highly variable between patients (Figure S3E). Amongst the seven distinct T/NK cell clusters, we observed an increase in the fraction of naïve T cells (DRR-T3) cluster cells at remission when compared to leukemic stages, whilst cytotoxic T cells (DRR-T5 and DRR-T6) appeared to significant increase at disease relapse when compared to remission (Figure S4F-H). Complementary automated annotation using SingleR of T cell subset cells based on the DICE reference dataset, however, revealed no significant differences between conditions, most likely due to high patient-to-patient variability (Figure S4I-J).
Non-classical Monocytes Re-emerge in B-ALL Relapse Following Conventional Chemotherapy
While we observed extensive re-modeling of the myeloid compartment at disease diagnosis, the impact of conventional chemotherapy and disease re-emergence on leukemia-associated myeloid cells is unknown. Remission resulting from conventional chemotherapy led to a partial increase in the fraction of myeloid cells found within the non-B cell immune microenvironment, however, this effect was reversed at disease relapse (Figure S3). To investigate this further, we analyzed Myeloid cells and identified six clusters present in the combined diagnosis, remission and relapse bone marrow (Figure 3C-E). Here, we observed a significant increase in the fraction of non-classical monocytes, DRR-M1, throughout both diagnosis and relapse when compared to remission bone marrow (Figure 3F). Conversely, we observed a significant reduction in the fraction of CD1C+ dendritic cells (DRR-M6) when compared to remission samples (Figure 3F). Diffusion map analysis and comparison to human myeloid gene expression profiles (Frankenberger et al., 2012; Villani et al., 2017) provided further validation of myeloid cell cluster identity and developmental trajectory (Figure 3E; Figure 3G-H). Notably, non-classical monocytes present at diagnosis and relapse showed increased expression of genes involved in vascular endothelial interactions when compared to remission non-classical monocytes, including PECAM1, TNFSF10 and CX3CR1 (Figure 3I).
Non-classical Monocyte Emergence in B-ALL Bone Marrow and Peripheral Blood Using Single-Cell Proteomic and Gene Expression Approaches
To validate our transcriptional observations, we employed multiple orthologonal protein-based approaches to establish the presence of monocytes in both bone marrow and peripheral blood of primary B-ALL patients. First, we used Cellular Indexing of Transcriptomes and Epitopes by Sequencing (CITE-Seq) (Stoeckius et al., 2017), which allows for simultaneous characterization of single cell transcriptomes and cell surface proteins composition. Using an immune system-specific oligonucleotide-labelled CITE-Seq antibody panel, we performed CITE-Seq on matched diagnosis, remission and relapse bone marrow mononuclear cells from four primary B-ALL patients. This patient group comprised of two patients previously subjected to scRNA-Seq alone (ETV003 and PH002), as well as two additional B-ALL patients – one MLL-AFF1 infant pre-B ALL case (MLL001, previously described as SJINF001 (Andersson et al., 2015)) and one Ph+ B-ALL case (PH003). Here, we profiled 42,621 bone marrow cells, allowing identification and quantification of broad immune cell types in each patient sample (Figure S5A-C). Sample viability did not significantly correlate with the mean number of detected genes (Pearson r = −0.01, p = 0.982), the number of unique molecular identifiers (UMIs) (Pearson r = −0.14, p = 0.655) nor fraction of mitochondrial RNA transcripts (Pearson r = 0.33, p = 0.292). Notably, the amount of detected DNA-barcoded CITE-Seq antibodies labelling the major immune cell types showed high concordance with corresponding mRNA detection levels (Figure S5D). We then analyzed the myeloid compartment of these four patient samples, highlighting five distinct myeloid clusters (CITE-M1–5) (Figure 4A-B). We identified a CD14dimCD16 CD115+ non-classical monocyte-enriched cluster (CITE-M1) and, consistent with our previous transcriptional data, levels of genes involved in vascular endothelial interactions, namely PECAM1/CD31 and CD49d/ITGA4, were highest in non-classical monocytes (Figure 4C-D).
Figure 4. Protein-based Approaches Confirms Presence of Distinct Leukemia-associated Non-classical Monocytes.

A, UMAP visualization of 10,480 individual Myeloid cells of four primary B-ALL patients with mononuclear bone marrow samples taken at diagnosis, remission and relapse B-ALL samples. B, Five transcriptionally distinct Myeloid cell clusters overlaid on the UMAP representation. C, Expression levels of CD14/CD14 and FCGR3A/CD16 across Myeloid cells overlaid on the UMAP representation, and based on mRNA and CITE-Seq antibody measurements. D, Heatmap showing select CITE-Seq antibodies and their corresponding mRNA allowing cell type subpopulation identification, scaled independently. E, Representative immunofluorescence microscopy analysis of primary bone marrow sections from independent B-ALL patients at disease diagnosis and relapse, with scale bars and fluorescent markers indicated for all sections. F, Representative flow cytometry of CD45CD19CD3CD56’ CX3CR1+ gate comparing CD 14 and CD 16 expression of primary healthy and B-ALL diagnosis bone marrow. G, Quantification of fraction of classical (CD14+CD16dim), intermediate (CD14+ CD16+) and non-classical monocytes (CD14dimCD16+) within the CD45+CD19−CD3−CD56− gate of bone marrow (top) and peripheral blood (bottom) of healthy donors and individual B-ALL patients at diagnosis or relapse. Diagnosis and relapse samples are not matched, and relapse samples were not analyzed for peripheral blood. Gating strategy adapted from (Cassetta et al., 2019). Statistical analysis performed using unpaired t-test. Error bars represent mean ± SEM, *P< 0.05, ***P< 0.001.
Using fluorescence microscopy analysis of primary bone marrow sections from independent B-ALL patients at disease diagnosis and relapse, we showed the CD68+CSF1R+ monocytic population is distributed throughout the dominant CD19+ leukemic blast population at diagnosis and relapse (Figure 4E). We then performed flow cytometric analysis of independent primary B-ALL patient bone marrow spanning numerous B-ALL subtypes taken at disease diagnosis (n = 13) and relapse (n = 4), as well as healthy donor bone marrow (n = 4) (Figure S5E; Table S3). Within the myeloid-enriched compartment (defined as CD45+CD19−CD3−CD56− (Cassetta et al., 2019)), we showed a significant increase in the proportion of CD14dimCD16+ non-classical monocytes at both B-ALL diagnosis and relapse when compared to healthy controls, as well as a significant reduction of CD14+CD16dim classical monocytes at diagnosis when compared to healthy controls (Figure 4F-G). In addition, we performed flow cytometric analysis of peripheral blood taken from three independent primary B-ALL patients and four healthy donors, where we also observed a significant increase in CD14dimCD16+ non-classical monocytes and significant reduction of CD14+CD16dim classical monocytes within the myeloid-enriched compartment at B-ALL diagnosis when compared to healthy controls (Figure 4G). These findings confirm the overrepresentation of non-classical monocytes within the myeloid microenvironment of primary B-ALL patient bone marrow and peripheral blood independent of B-ALL subtype. We then performed scRNA-Seq of diagnosis peripheral blood mononuclear cells (PBMCs) from two independent B-ALL patients, B-ALL-PB1 (Ph-like: P2RY8-CRLF2, JAK2 R683G, and KRASG12A mutation) and B-ALL-PB2 (MLL-rearranged), and compared them to two healthy PBMC donors (Figure S5F, Table S3). Following integration and clustering, peripheral blood cells were classified into five broad immune cell types (Figure S5G). Within the myeloid compartment of peripheral blood, we identified four myeloid cell clusters (Figure S5H-I). Using cluster-specific gene expression profiles, we identified an increased fraction of non-classical monocytes (PB-M2) in the peripheral blood myeloid cell compartment of leukemic patients when compared to healthy donors, bearing a gene expression profile of published non-classical monocytes, Mono2 (Villani et al., 2017) (Figure S5I-L).
Monocytes are Predictive of B-ALL Patient Overall and Relapse-Free Survival
It is unclear whether the described non-leukemic monocytic subpopulations offer prognostic significance for B-ALL patient survival. With this in mind, we assessed the impact of peripheral blood monocyte counts on B-ALL patient outcome. Here, we took advantage of an independent cohort of 568 pediatric newly diagnosed B-ALL patients, in which peripheral blood parameters were assessed at four time points: disease diagnosis (baseline), end of induction therapy (Day 29), initiation of maintenance therapy, and end of therapy. In this trial, eligibility criteria included a primary diagnosis of B-lineage ALL independent of disease subtype, as well as receiving the entirety of treatment at Texas Children’s Hospital. Patients meeting the following criteria were excluded: infants under 365 days old or patients with trisomy 21. For each of the four time points analyzed, B-ALL patients were separated on the basis of peripheral blood absolute monocyte count (AMC), generating two groups: (1) patients with absolute monocytosis, AMC > 1000 cells/μL; and (2) AMC ≤ 1000 cells/μL. Strikingly, we found significantly inferior overall survival (OS) and relapse-free survival (RFS) for B-ALL patients presenting with absolute monocytosis at disease diagnosis, independent of other risk factors (Figure 5A-B; Table S4). The absolute monocyte counts at the other timepoints assessed did not demonstrate prognostic impact, suggesting there may be phenotypic differences in the monocytes present at these time points when the leukemic burden is reduced (Table S4).
Figure 5. Non-classical Monocyte Abundance Predicts Inferior Overall Survival in Pediatric B-ALL Cases.

A-B, Kaplan-Meier analysis of newly-diagnosed pediatric B-ALL patient (A) overall survival (OS) and (B) relapse-free survival (RFS). Patients were separated on the basis of absolute monocytosis at disease presentation, with two cohorts absolute monocyte counts (AMC) >1000 cells/μL and AMC ≤ 1000 cells/μL. Number of patients indicated (n). Log-rank tests of equality were used to compare the differences in survival rates. C-D, Kaplan-Meier analysis of adolescent/young adult (AYA) human B-ALL patient (C) overall survival and (D) relapse-free survival with cohorts separated by monocyte enrichment within the bulk RNA-Seq of individual patients from St. Jude Children’s Research Hospital and COG trials (Gu et al., 2019). Monocyte High patients represent the upper-quartile of monocyte scores, and Monocyte Low represents the lower-quartile. Number of patients indicated (n).
Having demonstrated a prognostic role for monocyte abundance in the peripheral blood of pediatric B-ALL, we sought to extend our analysis to adult B-ALL cases that harbor an inferior patient outcome to pediatric cases (Roberts et al., 2014). To assess whether monocyte abundance was predictive of outcome in high-risk adult B-ALL, we utilized an established method for deconvolution of cellular composition of complex tissue using bulk RNA-Seq data, CIBERSORT (Newman et al., 2015), to predict the abundance of monocytes in primary adult B-ALL patient bone marrow (Gu et al., 2019). We calculated the Monocyte abundance score of B-ALL patient RNA-Seq bone marrow samples, then compared RFS of patients scoring in the upper-quartile (Monocytehigh) to the lower-quartile (Monocytelow) of this adult B-ALL cohort (Table S5). Here, we noted a significantly inferior EFS and OS in adult Monocytehigh B-ALL patients when compared to adult Monocytelow patients, further suggesting that monocytes play a protective role in tumor cell survival (Figure 5C-D). These findings, in combination with our scRNA-Seq and protein-based data of human B-ALL bone marrow and peripheral blood, suggest that the non-classical monocyte subpopulation may represent the majority of circulating and bone marrow monocytes associated with inferior treatment outcome.
B-ALL Promotes Monocyte Differentiation in a Vascularized Ex Vivo Organotypic Device
Next, we sought to define the origin of such non-classical monocytes detected in the B-ALL bone marrow. Previous studies have highlighted a critical role for vascular endothelium in promoting the differentiation of classical to non-classical monocytes (Gamrekelashvili et al., 2016). As we observed leukemia-associated monocytes upregulating multiple genes involved in vascular endothelial interactions (e.g. PECAM1/CD31), we hypothesized that B-ALL cells interact with the vascular microenvironment to favor the emergence of non-classical monocytes. We generated a 3D microfluidics-based organotypic device vascularized by human umbilical vein endothelial cells (HUVECs) that contains an interface of seeded human B-ALL cells, HUVECs and human CD14+ monocytes interactions (Boussommier-Calleja et al., 2019; Ma et al., 2016b; Polacheck et al., 2017). Upon microvessel formation, we seeded with two independent human B-ALL cell lines – Ph+ B-ALL cell line, SUP-B15, and ETV6-RUNX1+ B-ALL line, REH-via the device’s central vascular sinus (Figure S6A). Following two days of co-culture, primary human peripheral blood CD14+ monocytes were seeded into the central sinus, and allowed to interact with HUVEC and B-ALL cell lines for three days. Confocal microscopy analysis revealed that seeding of human CD14+ monocytes resulted in the appearance of CD 16-expressing monocytes in devices lacking human B-ALL Figure 6A). The presence of B-ALL significantly increased the percentage of human CD 16-expressing monocytes ex vivo and increased microvessel diameter, which was reversed by addition of human monocytes (Figure 6A-C; Figure S6B). These experiments, together with the monocytic RNA-Seq profiling, suggest that non-classical monocyte differentiation is augmented by the presence of human B-ALL presence most likely as a response to vascular damage.
Figure 6. B-ALL Enhances Human Non-classical Monocyte Emergence Ex Vivo.

A, Confocal microscopy of vascular endothelium (CD31) and monocyte markers (CD14 and CD16) from 3D organotypic devices seeded with HUVEC and human CD14+ Monocytes ex vivo, and either with or without seeding of human Ph-like B-ALL cell line, SUP-B15. B, Quantification of CD16-expressing cells in monocyte-seeded devices, and C, vascular endothelial diameter under different co-culture conditions described. Indicated p value derived from one-way ANOVA test. Error bars represent mean ± SEM, ****p. <0.0001.
Pre-clinical Ph+ B-ALL Animal Modeling Demonstrates Functional Roles for Monocytes in B-ALL Therapy Responsiveness
To further validate the importance of leukemia-associated non-classical monocytes during B-ALL progression, we took advantage of a well-characterized animal model of pediatric Ph+ B-ALL (Li et al., 1999) allowing derivation of multiple independent leukemias capable of efficient disease transplantation in non-irradiated C57BL/6 recipient mice. Recipient animals developed B-ALL and moribund mice showed significant splenomegaly and elevated peripheral white blood cell counts composed of a dominant CD19+GFP+ leukemic blast population (Figure S6C-D). Upon B-ALL transplantation of vascular-endothelial cell reporter (VEcad-Cre; Rosa26-tdTomato) recipient mouse bone marrow, GFP+ B-ALL blasts localized adjacent to CD68+ myeloid cells throughout the bone marrow (Figure S6E). We noted a significant increase in absolute number of CD1 lb+CX3CRl+ monocytes in the spleen and peripheral blood of moribund B-ALL recipients when compared to healthy littermate controls, however, the leukemia bone marrow compartment displayed a significant decrease in the abundance of this population (Figure S6F-G). This is similar to what we have shown in human B-ALL bone marrow, where disease bone marrow would result in a net loss of all leukemia-associated immune cells. Interestingly, however, throughout the bone marrow, spleen and peripheral blood, we observed a significant increase in the proportion of CD1 lb+CX3CR1+ monocytes that did not express Ly6C, reminiscent of non-classical monocytes (Figure S6H-I), in agreement to the human B-ALL findings presented above. In addition, non-classical monocytes from either healthy or B-ALL did not suppress T cell proliferation in vitro (Figure S6J-K).
To further understand the impact of murine B-ALL on the bone marrow and peripheral blood, we performed scRNA-Seq of two independent primary B-ALL recipient animals and two healthy littermate controls. Here, we sequenced 17,051 and 10,111 single cells from mouse bone marrow and peripheral blood, respectively. Single cells were subjected to integration, clustering, and subsequent classification into six broad cell types-B cells, Granulocytes, HSPCs, Monocyte-Dendritic Cell (Mono-DC), NK and T cells (Figure 7A; Table S2). Based on our observation of monocyte compartment remodeling in our pre-clinical Ph+ B-ALL model, we analyzed the Mono-DC subset and identified six clusters (Figure S7A-B). To identify the underlying cell types associated with our murine myeloid cell clusters, we performed both inter-and intra-species comparisons to myeloid cell gene expression profiles. Here, we observed an increased fraction of non-classical murine monocytes (murine Healthy/B-ALL Myeloid Cluster 2, mHB-M2) in the peripheral blood Mono-DC compartment of the B-ALL recipient compared to healthy controls, that harbored a transcriptional profile concordant with human CD16+ monocytes from our own data and existing datasets (Villani et al., 2017; Zilionis et al., 2019) (Figure S7C-E). Interestingly, B-ALL recipient murine non-classical monocytes also showed high Pecam1 expression relative to healthy non-classical monocytes, and down-regulation of MHC class II genes, such as H2-Aa, consistent with observations in leukemia-associated human non-classical monocytes (Figure 7B).
Figure 7. Leukemia-associated Monocyte Targeting Enhances TKI Responsiveness In Vivo.

A, Marker-based cell type identification analysis allowed prediction of six broad murine immune cell types across 27,162 profiled single cells from both bone marrow and peripheral blood of leukemia-bearing B-ALL recipients and healthy littermates. B, Heatmap of select differentially-expressed genes (based on KEGG pathways) distinguishing B-ALL recipient and healthy littermate non-classical monocytes. C, Csf1r mRNA expression overlaid on UMAP representation split into bone marrow or peripheral blood, and healthy or B-ALL conditions. D, Kaplan-Meier analysis of Ph+GFP+ B-ALL transplant recipient survival following TKI and mAb treatment. Treatment regimen and number of recipients per condition are indicated. Three primary B-ALL were each transplanted into n > 4 recipient mice per condition. *P< 0.05, ****p < 0.0001, log-rank test.
We then hypothesized that targeting monocyte subsets may affect B-ALL treatment responsiveness in vivo. Previous studies have demonstrated the use of CSF1R blockade in blocking the maturation of non-classical monocytes in vivo (MacDonald et al., 2010). Our studies showed high levels of Csf1r mRNA expression within the Mono-DC compartment of both bone marrow and peripheral blood of B-ALL recipient mice (Figure 7C). Following B-ALL transplantation, recipients received intraperitoneal injection of anti-CSFIR (AFS98) or IgG control antibody every two days. At 12 days post-transplantation we were able to see that anti-CSFIR treatment effectively depleted leukemia-associated monocytes, including both CD1 lb+CX3CRl+Ly6C+ classical monocytes and CD1 lb+CX3CRl+Ly6C− non-classical monocytes (Figure S7F).
Having established the effects of M-CSFR blockade on monocytic development in vivo, we sought to test the significance of non-classical monocytes in B-ALL therapy responsiveness. Following leukemia transplantation, recipient mice received either IgG or anti-CSFIR mAb every two days, then at 12 days post-transplantation, individual cohorts of mAb treated mice received five daily doses of TKI, nilotinib, or vehicle whilst continuing mAb treatment. Here, vehicle-treated mice administered either IgG or anti-CSFIR mAb did not show any significant differences in disease latency consistent with previous observations that M-CSFR signaling blocking alone has minimal effect on tumor cell survival (Kumar et al., 2017) (Figure 7D). While nilotinib treatment significantly prolonged IgG-treated recipient survival, the majority of animals (−85%) eventually succumbed to re-emerging B-ALL. Strikingly, however, the combination of anti-CSFIR and nilotinib not only enhanced the overall survival but also decreased the percentage (53%) of mice succumbing to re-emerging leukemia by 70 days post-transplantation (Figure 7D). Collectively, this data implicates the monocytic lineage and underscores its role in promoting B-ALL progression in vivo.
DISCUSSION
To date, the impact of B-ALL (or other lymphoid malignancies) on its immune microenvironment as well as the role of this microenvironment in disease establishment and progression is unknown. To address this, we have provided an overarching assessment of dynamic shifts in cellular composition and behavior of the leukemia-associated bone marrow immune microenvironment throughout the course of B-ALL progression. As B-ALL blasts represent the vast majority of cells in B-ALL bone marrow, we tailored our approach to maximize the representation of leukemia-associated immune cell types through the enrichment of non-B cell immune populations. As such, we performed single-cell profiling from 36 human bone marrow samples, four human peripheral blood samples, as well as murine bone marrow and peripheral blood, allowing for prospective identification of bone marrow-resident immune cell types from both healthy and B-ALL human patients and pre-clinical B-ALL models using both scRNA-Seq and CITE-Seq. Consistent with recent single-cell studies dissecting transformed and non-transformed constituents of AML pathogenesis (van Galen et al., 2019), our approach enabled the analysis of previously underappreciated subpopulations that were not detected by bulk RNA-Seq B-ALL studies.
Relapse B-ALL remains a leading cause of cancer-related death in children (Hunger and Mullighan, 2015). Numerous studies have provided in-depth analysis of relapse-associated genetic lesions (Ma et al., 2015; Meyer et al., 2013; Mullighan et al., 2009; Mullighan et al., 2011; Tzoneva et al., 2013), however, this has resulted in limited clinical treatment advances specifically targeting these genetic events (Churchman et al., 2015; Roberts et al., 2014). We hypothesized that components of the immune microenvironment may promote leukemic blast survival in a subtype-independent manner and, therefore, represent a unique means of overcoming resistance to treatment. While the expansion of B-cell progenitors dramatically reshaped almost the all bone marrow hematopoietic compartments, bone marrow-resident myeloid cells were the most sensitive to the presence of leukemia. Specifically, we showed that non-classical monocyte subpopulations emerged in diagnosis and relapse bone marrow at the expense of classical monocyte population using transcriptional and protein-based approaches, such as scRNA-Seq, CITE-Seq, flow cytometry and immunofluorescence. We provide evidence of the potential importance of this phenomenon, by connecting monocyte abundance in both pediatric and adult B-ALL patients, with inferior relapse-free and overall survival.
Non-classical monocytes are thought to patrol vascular endothelium for signs of inflammation and damage which, upon encounter, may elicit a pro-inflammatory response and removal of cellular debris of damaged endothelial cells (Carlin et al., 2013; Wong et al., 2012; Yang et al., 2014). In addition, recent studies have shown altered monocyte states present throughout various solid tumors. Consistent with this notion, we observe human and murine leukemia-associated monocytes upregulating multiple genes involved in vascular-endothelial interactions and inflammatory response, when compared to their healthy counterparts. Considering the requirement of vascular endothelial-derived signaling for non-classical monocytes differentiation (Gamrekelashvili et al., 2016), we designed a human 3D vascularized ex vivo platform and showed the differentiation of human classical monocytes toward the non-classical monocyte lineage is enhanced by the presence of human B-ALL, while monocytes appeared to revert B-ALL-induced changes in vascular endothelial diameter. Using a syngeneic B-ALL mouse model, leukemia-associated non-classical monocytes did not suppress T cell proliferation, consistent with our observation that leukemia-associated T cells from individual B-ALL patient bone marrow did not appear to exhibit any consistent exhaustion transcriptional program. However, we suggested a role for leukemia-associated monocytes in promoting B-ALL survival, demonstrating that M-CSFR (CSF1R) receptor blockade resulted in non-classical monocyte depletion and enhanced sensitivity of B-ALL to TKI therapy in vivo. This is consistent with recent observations of CSF1R+ “supporting” cells promoting human AML survival, however it is unclear if this AML-associated subpopulation are non-classical monocytes (Edwards et al., 2019).
Collectively, this work sheds light on the composition of the B-ALL immune microenvironment that may be important for understanding extrinsic regulators of B-ALL survival, such as the existence and function of non-classical monocytes. Based on our observations, non-classical monocytes may emerge in response to leukemia-induced tissue inflammation to repair damaged endothelium in a marrow infiltrated by leukemia cells. In agreement with this notion and experiments detailed here, it was previously shown that acute leukemia interacts with vascular endothelium leading to a number of defects, including increased vascular permeability (Passaro et al., 2017; Passaro et al., 2015; Pitt et al., 2015). We believe our characterization of the B-ALL bone marrow microenvironment may be highly relevant when considering immune microenvironment components potentially influencing the effectiveness of immune-based therapies targeting high-risk B-ALL.
STAR METHODS
RESOURCE AVAILABILITY
Lead Contact
Further information and requests for resources and reagents should be directed to and will be fulfilled by the Lead Contact, Iannis Aifantis (Ioannis.Aifantis@nvulangone.orgy
Materials Availability
Mouse B-ALL lines generated and plasmids used in this study are available upon request from the Lead Contact.
Data and Code Availability
Data is available under the GEO SuperSeries accession GSE134759. We annotated these data with treatment date, processing batch, patient information, antibody (for CITE-seq experiments and cell hashing experiments only) and treatment type, and also all basic steps of the computational pipeline to reproduce the results. The source code of computational analysis of single-cell studies in the Aifantis laboratory have been incorporated as an R package (available at https://github.com/igordot/scooter).
EXPERIMENTAL MODEL AND SUBJECT DETAILS
Human Patient Samples
Cryopreserved matched pairs or trios of pediatric B-lymphoblastic leukemia marrow specimens from diagnosis, remission, and relapse were obtained from the Children’s Oncology Group (COG) ALL cell bank. All patients were treated on COG protocols for newly diagnosed ALL. Additional banked samples were from NYU Langone Health Medical Center and St. Jude Children’s Research Hospital Total XV protocol (Pui et al., 2009) (ClinicalTrials.gov Identifier NCT00137111). Cryopreserved peripheral blood samples were obtained from the Texas Children’s Hospital. All subjects (or their parents) provided written consent for banking and future research use of these specimens in accordance with the regulations of the institutional review boards of all participating institutions.
Analysis of pediatric B-ALL patient outcome with absolute monocyte count, we performed a retrospective chart review of pediatric patients between the ages of one and 21 years with newly diagnosed B-ALL who were treated from 2007 to 2015 at Texas Children’s Hospital (TCH) in Houston, Texas. This research was approved by the Baylor College of Medicine Institutional Review Board. Electronic medical records were analyzed for all eligible patients. Eligibility criteria included a primary diagnosis of B-lineage ALL as well as receiving the entirety of treatment at TCH. Patients meeting the following criteria were excluded: those under 365 days old or diagnosed with trisomy 21. Patients were enrolled on or treated according to Children’s Oncology Group front line B-ALL therapeutic protocols that were active at the time of their diagnosis.
Frozen primary human CD14+ monocytes (STEMCELL Technologies, #70035) isolated from peripheral blood were thawed for immediate use in microfluidics device. Frozen primary human whole bone marrow mononuclear cells were obtained from Lonza (Catalogue #125C), Weill Cornell (courtesy of Giorgio Inghirami. MD) and STEMCELL Technologies (Catalogue #70001).
Animals
8–12 weeks-old C57BL/6 mice were purchased from Jackson Laboratory. 8–12 weeks-old B6.FVB-Tg(Cdh5-cre)7Mlia/J (VEcad-Cre) and B6.Cg-Gt(ROSA)26Sortm9(CAG-tdTomato)Hze/J (Rosa26-tdTomato) mice were obtained from Jackson Laboratory (Alva et al., 2006; Madisen et al., 2010). Mice were bred and maintained in individual ventilated cages and fed with autoclaved food and water at NYU School of Medicine Animal Facility. All animal experiments were done in accordance with approved protocols from the Institutional Animal Care and Use Committees, according to national and institutional guidelines. Kaplan-Meier survival curves were compared using the Wilcoxon Rank-Sum test via GraphPad Prism. All animal experiments were performed in accordance with protocols approved by the New York University Institutional Animal Care and Use Committee (IACUC).
Human Cell Lines
HUVEC (C2519A, Lonza) and human fibroblast cells (CC-2512, Lonza) were maintained in EGM-2 (CC-3162, Lonza) and FGM-2 (CC-3132, Lonza), respectively, prior to use in microfluidics experiments. Human B-ALL cell lines, SUP-B15 (ATCC, CRL-1929) and REH (ATCC, CRL-8286), were maintained in RPMI 1640 (Corning) supplemented with 20% Fetal Bovine Serum (FBS) (Sigma Aldrich) and 2-Mercaptoethanol (2-ME, 55nM) (Thermo Fisher Scientific). Retrovirus was generated using transfection of the Platinum-E cell line (Cell Biolabs, RV-101).
METHOD DETAILS
Absolute Monocyte Count Patient Data Collection
The absolute monocyte counts of pediatric B-ALL patients were abstracted from the Texas Children’s Hospital electronic medical record at four time points: diagnosis, end of induction (day 29), start of maintenance, and end of therapy.
Adult B-ALL CIBERSORT Monocyte Abundance
For CIBERSORT analysis of St. Jude adult B-ALL cases (Gu et al., 2019), the raw counts were obtained from St. Jude Pecan Data Portal and normalized using edgeR as counts per million (CPM) (Robinson et al., 2010). CIBERSORT R script was used to estimate the abundances of immune cell types, specifically ‘Monocytes’, based on the LM22 reference gene expression signatures (Chen et al., 2018).
Frozen Human Bone Marrow and Peripheral Blood Mononuclear Cells Preparation, Flow Cytometry and Cell Sorting
Frozen human bone marrow and peripheral blood specimens were rapidly thawed and transferred into 50 mL conical tubes. 20 mL Pre-warmed RPMI 1640 (Corning) supplemented with 5% Fetal Bovine Serum (FBS) (Sigma Aldrich) and 2-Mercaptoethanol (2-ME, 55nM) (Thermo Fisher Scientific) was added drop-wise to tubes. Cell suspensions were subjected to centrifugation at 400 × g for 5 min at 4°C and supernatant was discarded. Pellets were re-suspended in 5mL RPMI 1640 with 5% FBS and 2-ME, and filtered using a 70 μm nylon mesh (Thermo Fisher Scientific) with residual cell clumps discarded. After centrifuging at 400 × g at 4°C for 5 min, the supernatant was discarded, and the cell pellet was re-suspended in PBS (Corning) with 2% FCS and placed on ice prior to staining for FACS.
Single-cell suspensions were re-suspended in PBS with 2% FCS and Human TruStain FcX Blocking Solution (BioLegend) and incubated on ice for 10 mins. Cell suspensions were centrifuged at 400 × g at 4°C for 5 min, and supernatant discarded. Cell pellets were re-suspended in PBS with 2% FCS, FITC-conjugated anti-human CD45 (1:200, BD Pharmingen), APC-conjugated anti-human CD19 (1:200 concentration, BioLegend) and PE-conjugated antihuman CD10 (1:200, BioLegend), and incubated on ice for 30 mins. Following incubation, cell suspensions were subjected to two wash cycles involving re-suspension of cell pellets in 3 mL PBS with 2% FCS, followed by centrifuging at 400 × g at 4°C for 5 min, followed by supernatant removal. Finally, samples were re-suspended in 300 μL of PBS with 2% FCS per 2 × 10⁶ cells, supplemented with DAPI (0.5 μg/mL) for live/dead staining. Cell sorting was performed using the SY3200™ highly automated parallel sorting (HAPS) cell sorter (Sony). Additional flow cytometric analysis of bone marrow samples derived from PH002 were stained using a Brilliant Violet 711-conjugated individual antibodies to generate a CD3, CD14, CD16, CD71 lineage cocktail (1:200 per antibody, BD Pharmingen), PE-Cy7-conjugated anti-human CD34 (1:100, BD Pharmingen), Brilliant Ultra Violet 496-conjugated anti-human CD38 (1:100, BD Pharmingen), Alexa Fluor 700-conjugated anti-human CD19 (1:200, BD Pharmingen), and APC-Cy7-conjugated anti-human CD45 (1:200, BD Pharmingen), with flow cytometry performed using the BD Symphony™ A5 Cytometer. Flow cytometry of human monocyte subsets was performed using PerCP-conjugated anti-human CD45 (1:200, BioLegend), FITC-conjugated anti-human CD14 (1:200, BioLegend), PE/Cy7-conjugated anti-human CD3 (1:300, BioLegend), PE/Cy7-conjugated anti-human CD56 (1:200, BioLegend), Alexa Fluor 700-conjugated anti-human CD16 (1:200, BioLegend), APC-conjugated anti-human CD19 (1:200 concentration, BioLegend) and PE-conjugated anti-human CD10 (1:200, BioLegend), with flow cytometry performed using the BD Fortessa. All fluorescence-conjugated antibodies are listed in Key Resources.
For cell sorting, all samples were gated based on forward and side scatter, followed by exclusion of doublets, then gated on viable cells (DAPIlow). In the case of healthy bone marrow and peripheral blood samples, CD45+ cells were sorted into 1.5 mL tubes containing 300 μL ice-cold RPMI 1640 with 5% FBS and 2-ME. For cell sorting of B-ALL patient samples, viable cells were sorted into two populations-CD19+ cells or CD45CD19’ cells-by sorting into 1.5 mL tubes containing 300 μL ice-cold RPMI 1640 with 5% FBS and 2-ME. For B-ALL samples, CD19+ cells and CD45+CD19− cells were then manually mixed at a ratio of 1:5 CD19+:CD45+CD19−. Following cell sorting and mixing, individual samples were centrifuged at 400 × g at 4°C for 5 min, and re-suspended in ice-cold RPMI 1640 with 5% FBS at a concentration of 1000 cells per μL prior to scRNA-Seq. For human peripheral blood studies, samples were tagged with cell hashing (Stoeckius et al., 2018) oligo-tagged antibodies (BioLegend) according to manufacturer’s instructions. For CITE-Seq experiments, CITE-Seq antibodies were stained according to manufacturer’s instructions (https://cite-seq.com/protocol/), with the exception of PBS supplemented with 2% FBS as the washing and staining buffer. CITE-Seq panel shown in Key Resources. The libraries were prepared using the Chromium Single Cell 3’ Reagent Kits (v2 and v3): Single Cell 3’ Library & Gel Bead Kit v2 (PN-120237), Single Cell 3’ Library & Gel Bead Kit v3 (PN-1000075), Single Cell 3’ Chip Kit v2 (PN-120236), Chromium Next GEM Chip G Single Cell Kit (PN-100120) and i7 Multiplex Kit (PN-120262) (10× Genomics) (Zheng et al., 2017), and following Single Cell 3’ Reagent Kits (v2) User Guide (manual part no. CG00052 Rev A) and Single Cell 3’ Reagent Kits (v3) (manual part no. CG000183 Rev C). Libraries were run on an Illumina HiSeq 4000 as 150-bp paired-end reads, at one full lane per sample.
scRNA-Seq Data Pre-processing
Sequencing results were demultiplexed and converted to FASTQ format using Illumina bcl2fastq software. The Cell Ranger Single-Cell Software Suite (https://support.1Oxgenomics.com/single-cell-gene-expression/software/pipelines/latest/what-is-cell-ranger) was used to perform sample demultiplexing, barcode processing, and single-cell 3’ gene counting. The cDNA insert was aligned to the hg38/GRCh38 reference genome. Only confidently mapped, non-PCR duplicates with valid barcodes and UMIs were used to generate the gene-barcode matrix. Further analysis including the identification of highly variable genes, dimensionality reduction, standard unsupervised clustering algorithms, and the discovery of differentially expressed genes was performed using the Seurat R package (Butler et al., 2018).
To exclude low quality cells as well as cells that were extreme outliers in terms of library complexity and may possibly include multiple cells or doublets, the distribution of genes detected per cell was calculated and cells in the top and bottom 2% quantiles within each sequencing library were removed. Cells with more than 10% of the transcripts coming from mitochondrial genes were additionally removed. The data was normalized by the total expression, multiplied this by a scale factor of 100,000 and log-transformed.
For sequencing libraries utilizing cell hashing (Stoeckius et al., 2018), hashtag oligo (HTO) counts were quantified using CITE-seq-count. HTOs for each cell were normalized using a centered log ratio (CLR) transformation across cells and demultiplexed using the HTODemux function in Seurat. Cell doublets and background empty droplets were removed. RNA counts for each cell were preprocessed as described above.
Integrated Analysis of Single-Cell Datasets
To account for biological and technical batch differences between the patients and scRNA-seq libraries, the Seurat anchor-based integration method (Stuart et al., 2019) for merging datasets that identifies pairwise correspondences between cells pairs across datasets to transform them into a shared space was utilized. The 11 healthy and diagnosis samples were processed first. Genes that were detected in fewer than 10 cells were filtered out and the 2,000 most variable genes based on standardized variance were selected for canonical correlation analysis (CCA) as an initial dimensional reduction. The integration anchors were then identified based on the first 20 dimensions and used to generate a new dimensional reduction for further analysis. The combined 11 human healthy and diagnosis bone marrow filtered dataset included 53,447 cells with a mean and median of 1,337.5 and 1,129 detected genes, respectively. The analysis was performed for the 20 human diagnosis, remission, and relapse bone marrow samples with a chosen dimensionality of 50 and the dataset included 97,456 cells with a mean and median of 1,355.9 and 1,136.5 detected genes, respectively. The analysis was performed for the 4 human peripheral blood samples using 20 dimensions and included 10,221 cells with a mean and median of 1,572.8 and 1,364 detected genes, respectively. The analysis was performed for the 8 murine samples using 20 dimensions and included 27,162 cells with a mean and median of 2,763.2 and 2,527 detected genes, respectively.
Visualization and Clustering
To visualize the data, the dimensionality of the scaled integrated data matrix was further reduced to project the cells in two-dimensional space using PC A followed by uniform manifold approximation and projection (UMAP) (Becht et al., 2018) with 30 nearest neighbors were used to define the local neighborhood size with a minimum distance of 0.3 for the healthy and diagnosis dataset. 60 neighbors with a distance of 0.1 were used for the diagnosis, remission, and relapse dataset. The resulting PCs were also used as a basis for partitioning the dataset into clusters using a smart local moving (SLM) community detection algorithm (Waltman and van Eck, 2013) using 30 nearest neighbors and 60 for the diagnosis, remission, and relapse dataset. A range of resolutions (0.1–10) was utilized to establish a sufficient number of clusters to separate known populations based on the expression of established markers.
To improve the single-cell visualization of the expression level of individual genes with low to moderate expression that are poorly captured with a scRNA-seq protocol, single-cell analysis via expression recovery (SAVER) was used to recover expression values (Huang et al., 2018). Heatmaps representing the distribution density ratios of the events in the UMAP embeddings were generated by determining the density for a 200×200 square grid (100×100 for individual cell types) of the UMAP projections for cells representing each stage and then calculating the ratio.
Diffusion maps were calculated based on the integrated expression matrix using the destiny package (Angerer et al., 2016), with the local estimation of Gaussian kernel width and the number of nearest neighbors for diffusion matrix approximation set to a value between 100 and the total number of cells.
Clusters were assigned known broad cell types based on the expression of defined population markers. Specifically, the cluster-average expression values were filtered for genes expressed in any clusters based on a detection threshold of 10 counts per million (~3 transcripts per cell), the values for each gene were normalized relative to the maximum level across all clusters, and the rescaled values were averaged across all markers for each population, with each cell assigned to the population with the highest value.
Following separation into the broad cell types, cluster marker genes were determined by performing differential expression analysis using the Wilcoxon rank sum test with Bonferroni multiple-comparison correction for cells within each cluster against all other cells within the cell type. For each cluster, the significant genes (detected in at least 20% of the cluster cells, fold-change difference >20%, adjusted p value <0.001) with the 10 highest fold-changes were kept. The cluster-average expression matrix was subset to the marker genes, scaled, and hierarchical clustering was performed. Adjacent clusters were merged and cluster markers were recalculated until the resulting clusters could be differentiated based on the expression of those genes.
To find markers that define individual clusters, we performed pairwise differential expression analysis using the Wilcoxon rank sum test with Bonferroni multiple-comparison correction for each cluster against all other clusters for genes that were detected in at least 10% of the cluster cells, keeping the genes that were significant in each of the comparisons (fold-change difference >10% with adjusted p value <0.01).
Device Design and Fabrication
3D microfluidics-based organotypic device composed of three distinct functional regions: a central sinus region vascularized by human umbilical vein endothelial cells (HUVECs), an inner ring region that serves as an interface of seeded human B-ALL cells, HUVECs and human CD14+ monocytes interactions, and the outer ring channels, which is used to seed fibroblasts required for the formation of a vascularized network – all of which are connected with four media reservoirs, for cell culture media supplies and waste removal. HUVECs and fibroblast cells were embedded in a fibrin hydrogel to maintain 3D cell culture. The microfluidic device was fabricated using standard soft lithography replica molding technique (Ma et al., 2016a; Ma et al., 2016b). The mold for the microfluidic device was fabricated with SU-8 negative photoresist (2050, Microchem) at a thickness of 100 (μm on a silicon wafer by employing photolithography. Prior to the replica molding process, the SU-8 mold was surface-modified by trichloro (lH,lH,2H,2H-perfluorooctyl) (448931, Sigma-Aldrich) vapor overnight in vacuum desiccation to facilitate later PDMS (Polydimethylsiloxane) release. Then, a mixture of PDMS base and curing agent (Dow Corning) at 10:1 weight-to-weight (w/w) ratio were well mixed, cast on the mold, degassed, and then solidified in an 80 °C oven for 1 h. Once PDMS was peeled from the mold, 1 mm and 3 mm holes were punched for three inlets and four media reservoirs, respectively. The cleaned PDMS slabs were finally bounded onto glass coverslips (22 × 22 mm; Thermo Fischer-Scientific) to assemble the microfluidic device using oxygen plasma (PE50XL, Plasma Etch; 350 W, 2 min). Afterward, the microfluidic devices were subsequently treated to ultraviolet for sterilization in a Type 2 class laminar flow hood for 20 min.
Hydrogel Solutions
The sacrificial gelatin solution (12 mg/ml) was prepared by dissolving gelatin powder from porcine skin (G2500, Sigma) in 1x Dulbecco’s PBS (DPBS without calcium and magnesium, Invitrogen), warming and vigorously stirring at 60 °C for 30 min. The gelatin solution was then sterile-filtered, aliquot and stored at 4 °C for future use. The fibrinogen solution (6 mg/mL) was prepared by dissolving lyophilized fibrinogen from bovine plasma (F8630, Sigma) in DPBS at 37 °C for 2h. The sterile-filtered fibrinogen solution was stored at 4 °C for future use within one week. The thrombin solution was prepared by reconstituting lyophilized thrombin (604980, Sigma-Aldrich) in sterile DPBS to 100 U/mL and stored in aliquots at −20 °C.
Cell Loading and Culture Process
First, a sacrificial gelatin hydrogel solution (12 mg/ml in DPBS) was injected into the central area and solidified at 4 °C for 15 min or −20°C for 10 min. Then, 5×l06 HUVEC (C2519A, Lonza) in fibrinogen solution (3 mg/ml in DPBS) containing 4 U/ml thrombin (Sigma) were injected into the inner ring area of the leukemia microfluidic device and solidified at room temperature for 5 min, followed by injection of 1×10⁶ human fibroblast cells (CC-2512, Lonza) in 3 mg/ml fibrinogen hydrogel containing 4 U/ml thrombin into the outer ring area of the device. Following the gelation, cell culture media [a mixture of EGM-2 (CC-3162, Lonza) and FGM-2 (CC-3132, Lonza) at 2:1 vol/vol with 25 ng/ml VEGF (230–00012, RayBiotech)] was added into the four media reservoirs and the device was incubated at 37 °C for 10 min. The gelled gelatin will then become liquefied and be removed thereafter. At last, some HUVECs will be seeded at the central area. The established devices were cultured and monitored for 7–10 days to ensure the formation of vascular network.
Once the microvessel network was established, 10,000 B-ALL cells were loaded from the central sinus into the whole microvessel network and cultured for 2 days with the cell culture media (a mixture of EGM-2, FGM-2 and RPMI1640 or IMDM at 2:1:1 vol/vol with 25 ng/ml VEGF). Following the engraftment of B-ALL cells, 10,000 monocytes were also loaded from the central sinus into the whole microvessel network and cultured for 3 days with the cell culture media (a mixture of EGM-2, FGM-2 and RPMI1640 or IMDM at 2:1:1 vol/vol with 25 ng/ml VEGF). Control groups were set in parallel to the described experiments.
Immunostaining and Imaging
At the end of the experiment, microfluidics devices were blocked with Human TruStain FcX™ for 1 h at 4°C, then stained them with Alexa647-conjugated anti-human CD14 (BioLegend), FITC-conjugated anti-human CD16 (BioLegend), Brilliant Violet 421-conjugated anti-human CD19 (BioLegend) and either PE-conjugated anti-human CD31 (BioLegend) or PE-conjugated anti-human VE-Cad (BioLegend) following the manufacturer’s instruction. Following 4–6 hr at 4°C, the devices were fixed with 4% PFA for 20 min and washed with DPBS for at least three times. The devices were then imaged with Zeiss microscopy with 20× or 40× objective. The number of CD14+, CD16+, and CD19+ cells was manually counted in each images taken. The diameters of vessel network were randomly chosen and quantified in different groups of conditions, with each condition had three technical replicates. The significance of results from different group were compare using one-way ANOVA test in Prism, GraphPad.
Generation of Pre-clinical High-risk Ph+ B-ALL Mouse Model and In Vivo Drug Treatment
To obtain hematopoietic stem and progenitor cells for transduction with BCR-ABL1-expressing retroviral constructs, both femurs and tibias were harvested from three independent 8 week old male C57BL/6 mice, bone marrow was flushed via centrifugation. Specifically, individual PCR strip tubes (USA Scientific Cat #1402–4700) were pierced at the base of the tube with a 19G needle and placed inside a 1.5 mL tube. One femur and one tibia were then placed within the PCR tube followed by the addition of 300 μL of PBS with 2% FCS. 1.5 mL tubes were centrifuged at 8000 rpm for 1 min and supernatant was discarded. Cells were then subjected to red blood cell lysis using 500 μL ammonium-chloride-potassium (ACK) Lysing Buffer (Quality Biological) for 1 min at room temperature and filtered into a 50 mL conical tube using a 70 μm nylon mesh (Thermo Fisher Scientific) with residual cell clumps discarded. Following filtering, 20 mL PBS with 2% FCS was added to each tube to quench red cell lysis and cells were centrifuged at 300 × g at 4°C for 5 min with supernatant discarded. Bone marrow cells from individual mice were then subjected to Kit+ cell enrichment using magnetic separation (AutoMACS). Specifically, mouse CD117 MicroBeads (Miltenyl Biotec) were used to separate C57BL/6 bone marrow cells and autoMACS separation was performed according to manufacturer’s instructions. Following separation, Kit-enriched cells were re-suspended in Iscove’s Modified Dulbecco’s Medium (IMDM) buffer with GlutaMax (Gibco) with 10% FBS, murine stem cell factor (SCF) (100 ng/mL, Peprotech), murine Flt3 ligand (50 ng/mL, Peprotech), murine IL-7 (10 ng/mL) and polybrene (1 μg/mL,) at a cell concentration of 1 × 10⁶ cells per mL, and incubated overnight at 37°C with 5% CO2.
We then adapted an established protocol (Li et al., 1999) to preferentially drive B-ALL rather than CML upon retroviral expression of BCR-ABL1P190. To generate retrovirus, all plasmid transfections were performed in Platinum-E cells (Cell Biolabs, RV-101) using Polyethylenimine (PEI) reagent at 4:3 ratios of retroviral plasmids MSCV-IRES-GFP (Pear et al., 1998) (Empty vector) or MSCV-BCR-ABL1-IRES-GFP (Witkowski et al., 2017) (cDNA encoding the human P190 isoform of BCR-ABL1-Addgene Plasmid #38185 (Heisterkamp et al., 1990)) in OPTI-MEM solution. Viral supernatant was collected 48 hrs and 72 hrs post-transfection. Kit-enriched bone marrow cells were re-suspended in fresh media at 2 × 10⁶ cells/ml. 12-well Retronectin-coated (lmg/mL, Takara), non-tissue culture treated plates (Thermo Fisher Scientific) were coated with 1 mL of MSCV-BCR-ABL1-IRES-GFP (Human PI90 BCR-ABL1 cDNA fragment from Addgene #38185 sub-cloned into MSCV-IRES-GFP Addgene #27490 (Witkowski et al., 2017)) or MSCV-IRES-GFP (Addgene #27490) retrovirus, and centrifuged at 4000 rpm for 2 hours at 4°C. Viral supernatant was aspirated, and 2 mL of Kit-enriched cell suspension was plated per well, followed by incubation of cells at 37°C, 10% CO2 for 48 hours. Following incubation, 500,000 cell-sorted GFP+ cells were injected retro-orbitally into individual sub-lethally irradiated C57BL/6 recipient mice (1 irradiation dose, 550 rads). Moribund recipient mice were sacrificed, and splenic GFP+ B-ALL cells were sorted for secondary transplantation into non-irradiated 8−12 week old C57BL/6 recipient mice via retroorbital injection (100,000 cells per recipient). Moribund secondary recipient mice transplanted with three independent primary B-ALL cells were sacrificed, and splenic GFP+ B-ALL were harvested and cryopreserved. For all transplantation experiments described, 10,000 GFP+ B-ALL cells harvested from secondary recipient mice were transplanted into non-irradiated 8−12-week-old C57BL/6 recipient mice via retroorbital injection. C57BL/6 B-ALL recipient sex per condition is as follows: ‘Vehicle + IgG’-14 female and 18 male recipients (n = 32). ‘Vehicle + anti-CSFIR’ −14 female and 12 male recipients (n = 26). ‘Nilotinib + IgG’ − 13 female and 18 male recipients (n = 31). ‘Nilotinib + anti-CSFIR’ − 11 female and 11 male recipients (n = 22).
For M-CSFR blockade experiments, each treatment condition attempted to use equal numbers of male and female C57BL/6 recipient mice. Individual leukemia recipient mice were treated every two days following transplantation with either 300 μg anti-mouse CSF1R (CD115) monoclonal antibody (AFS98 clone, BioXCell) or 300 μg rat IgG2a isotype control (BioXCell) for 30 days post-transplantation. At 12 days post-transplantation, mice received five daily doses of nilotinib (75 mg/kg, AMN-107, Selleckchem) or vehicle (90% PEG300 with 10% Methylpyrrolidone, Sigma-Aldrich).
Processing of B-ALL Recipient Mice, Organ Flow Cytometry and scRNA-Seq Preparation
Following disease onset, moribund mice were sacrificed with bone marrow, spleen and peripheral blood processed. Specifically, both tibia and femurs were flushed using centrifugation and subsequent red cell lysis. Spleens were gently dissociated through 70 μm nylon mesh into 50 mL conical tubes and centrifuged at 300 g for 5 min at 4°C followed by discarding of supernatant. Cells were then subjected to red blood cell lysis using 2 mL ACK Lysing Buffer (Quality Biological) for 1 min at room temperature and filtered into a 50 mL conical tube using a 70 μm nylon mesh (Thermo Fisher Scientific) with residual cell clumps discarded. Following filtering, 20 mL PBS with 2% FCS was added to each tube to quench red cell lysis and cells were centrifuged at 300 × g at 4°C for 5 min with supernatant discarded. Murine Fc blocking (Purified Rat Anti-Mouse CD 16/32, BD Pharmingen) was performed for 10 min on ice prior to fluorescence antibody staining for 30 mins at 4°C. Cells were subsequently washed in two cycles with 3 mL PBS with 2% FCS added to each tube followed by centrifugation at 300 ×g at 4°C for 5 min with supernatant discarded. Finally, samples were re-suspended in 300 μL of PBS with 2% FCS per 2 × 10⁶ cells, supplemented with DAPI (0.5 μg/mL) for live/dead staining. FACS analysis was performed using the LSR Fortessa ×20 (BD), based on forward and side scatter, followed by exclusion of doublets, and gating on viable cells (DAPIlow). Primary tumors classified as CD19+IgM− B-ALL using an antibody cocktail containing PE-conjugated anti-mouse IgM (1:300, eBioscience) and APC-conjugated anti-mouse CD19 (1:300, BioLegend). B-ALL were transplanted into non-irradiated secondary recipient C57BL/6 mice (three mice per tumor with 5 × 10⁵ splenic tumor cells per mouse). For monocyte lineage analysis of tertiary recipient mice, organs were stained with an antibody cocktail of PE-conjugated CD11b (1:300, BD), APC-conjugated anti-mouse CD19 (1:300, BioLegend), PE-Cy7-conjugated anti-mouse CX3CR1 (1:300, BioLegend), PerCP-Cy5.5-conjugated anti-mouse CD45 (1:300, BioLegend), APC-Cy7-conjugated anti-mouse Ly-6C (1:300, BioLegend), Brilliant Violet 605-conjugated anti-mouse Ly-6G (1:300, BioLegend) and Alexa Fluor 700-conjugated anti-mouse I-A/I-E (MHCII) (1:300, BioLegend).
For scRNA-Seq, recipient mice were sacrificed 16 days post-transplantation upon signs of splenomegaly and reduced motility, with healthy littermate controls were processed simultaneously. Both femurs were harvested, as well as peripheral blood and spleen. Peripheral blood was obtained through cardiac bleeding, and subjected to red blood cell lysis using 2 mL ACK Lysing Buffer (Quality Biological) for 5 min at room temperature. Following filtering, 4 mL PBS with 2% FCS was added to each tube to quench red cell lysis and cells were centrifuged at 300 × g at 4°C for 5 min with supernatant discarded. Murine Fc blocking (Purified Rat Anti-Mouse CD 16/32, BD Pharmingen) was performed for 10 min on ice prior to fluorescence antibody staining for 30 mins at 4°C. For scRNA-Seq, processed cells were stained with APC-conjugated anti-mouse CD19 (1:300, BioLegend), PerCP-Cy5.5-conjugated anti-mouse CD45 (1:300, BioLegend), and Brilliant Violet 605-conjugated anti-mouse Ly-6G (1:300, BioLegend). Cells were sorted based on the following: GFP+CD19+ B-ALL blasts, GFP-CD45+Ly-6G’ non-granulocytic cells, and GFP-CD45+Ly-6G+ granulocytic cells. To maximize the diversity of cell types analyzed by scRNA-Seq (particularly given the absence of granulocytes in human mononuclear cell preparations), input cells were fractionated into defined populations prior to loading for scRNA-Seq. For healthy recipients, processed bone marrow or peripheral blood cells were separated into GFP’CD45+Ly-6G− non-granulocytic cells and GFP’CD45+Ly-6G− non-granulocytic cells, then mixed at a ratio of 8 parts GFP’CD45+Ly-6G− non-granulocytic cells and 1 part GFP’CD45+Ly-6G+ granulocytic cells. For B-ALL recipients, cells were sorted and mixed to give 1 part GFP+CD19+ B-ALL blasts, 8 parts GFP’CD45+Ly-6G− non-granulocytic cells, and 1 part GFP’CD45+Ly-6G+ granulocytic cells. For murine scRNA-Seq studies, individual samples were tagged with cell hashing (Stoeckius et al., 2018) oligo-tagged antibodies (BioLegend) according to manufacturer’s instructions.
Multiplex Immunofluorescence Staining of Primary Human B-ALL Bone Marrow Specimens
Five-micron paraffin sections were stained with Akoya Biosciences® Opal™ multiplex automation kit on a Leica BondRX® autostainer, according to the manufacturers’ instructions. Prior to initiation of antibody incubations, sections were heat-retrieved with ER2 buffer (Leica, AR9640) and then treated for 15 mins with hydrogen peroxide, which is critical when staining bone marrow. Primary antibodies were against CD19 (1:400, Biocare, clone 56C6), CD68 (1:75, Dako; clone KP1), CSF1R (1:200, E4T8Z, Cell Signaling) and CD45 (1:250, Cell Signalling, clone D9M8I). Sequential staining of each primary antibody was followed by incubation with a combination of horse radish peroxidase-conjugated secondary antibodies (Akoya Biosciences®, CAT# ARH1001) and tyramide mediated signal amplification (TSA) with covalent linkage of individual fluorophores (Opal 520, 570, 650 or 690) to the tissue at the antibody binding site. Primary and secondary antibodies were subsequently stripped using heat mediated antigen retrieval with ER2 solution (Leica, AR9640) and the next round of immunostaining initiated. After completion of the sequential incubations and stripping steps, slides were counterstained with spectral DAPI (Akoya Biosciences®, FP1490) and mounted with ProLong™ Gold antifade reagent (Invitrogen). Monoplex controls were used to confirm appropriate staining for antibodies integrated into the multiplex panels. Multispectral imaging was performed on a Vectra 3.0 imaging system (Akoya Biosciences®) at 20x. The fluorophore emission signatures were captured by a multispectral camera and then unmixed with InForm® software version 2.4 (Akoya Biosciences®). Autofluorescence, obtained from an unstained slide, was removed from the composite images and pseudo-colored images were exported as .tif files.
Immunofluorescent Labeling of Murine Bone Marrow
B6.FVB-Tg(Cdh5-cre)7Mlia/J (VEcad-Cre) and B6.Cg-Gt(ROSA)26Sortm9(CAG-tdTomato)Hze/J (Rosa26-tdTomato) mice were obtained from Jackson Laboratory (Alva et al., 2006; Madisen et al., 2010). FI progeny enabled visualization of VEcad+ cells via Cre-inducible TdTomato fluorescent reporter expression. Reporter mice were injected with either 10,000 tertiary GFP+ Ph+ B-ALL blasts, or vehicle injection to serve as littermate controls. Following 14 days post-transplantation, leg bones were dissected from euthanized animals and fixed overnight in 4% paraformaldehyde (PFA) at 4°C. For analysis by IF, fixed femurs were placed in 0.5 M EDTA solution (Fisher Scientific), pH 8.0 for six days to allow décalcification. Decalcified tissues were then placed in 30% sucrose solution for 24 hours and subsequently frozen in OCT. Bone marrow 6–8 mm cryostat sections were dried at room temperature overnight in the dark, rehydrated and blocked using PBS with donkey serum at 4°C for 30 mins. Blocking solution was aspirated and slides were stained with the primary antibody cocktail containing anti-GFP (1:200, Invitrogen) and APC conjugated anti-mouse CD68 antibody (1:200, BioLegend) at 4°C overnight. Slides were washed five times with PBS, followed by staining with Alexa Fluor 488 goat anti-rabbit IgG (H+L) secondary antibody (1:500, Invitrogen) for 2 hours at room temperature. Slides were washed five times with PBS, and sections were stained with DAPI for 5 min and mounted with Fluoromount-G (Southern Biotech). Images were taken using Zeiss 880 Confocal Microscope and analyzed on Leica Microsystems imaging software. Composite images and pseudo-colored images were generated using Fiji software (Schindelin et al., 2012).
In Vitro T-cell Suppression Assay
10,000 sorted tertiary GFP+ cells were transplanted into non-irradiated C57BL/6 recipient mice, and following 16 days recipient mice were sacrificed, as well as healthy littermate controls. Spleens were processed and stained for monocyte subsets as described above. CD45GFP’ CD1 lb+Ly6g−Ly6ClowCX3CRl+were sorted from B-ALL bearing mice or healthy littermates (n = 6 independent donors). In parallel, four 8-week old C57BL/6 mice were sacrificed, and isolated splenocytes were processed using the Pan T-cell isolation kit (Pan T Cell Isolation Kit II, mouse, Miltenyi Biotec), and subjected to Automatic Magnetic Activated Cell Sorting (AutoMACS, Miltenyi Biotec). Following T cell isolation, 1 × 10⁵ total T cells were labelled with CFSE according to manufacturer’s instructions (CellTrace Far Red Cell Proliferation Kit, ThermoFisher Scientific), and plated in flat-bottom 96-well plates containing 200 μL RPMI supplemented with 20% FBS and 30U/mL murine IL-2. Depending on the conditions, T cells were cultured with a 1:1 ratio of CD3:CD28 T cell stimulation beads (Dynabeads Mouse T-Activator CD3/CD28 for T-Cell Expansion and Activation, ThermoFisher Scientific) and 1 × 10⁴ sorted non-classical monocytes for 72 hours at 37°C, 5% CO2. Flow cytometry and cell sorting were performed using the LSR Fortessa and SY3200™ HAPS cell sorter, respectively. Proliferation analysis was performed using FlowJo v10 software.
QUANTIFICATION AND STATISTICAL ANALYSIS
Absolute Monocyte Count and Pediatric B-ALL Patient Outcome
The absolute monocyte count values were grouped into quartiles, and the upper and lower quartile were assessed at each time point. Cox regression analyses were used to generate hazard ratios (HR) and 95% confidence intervals (Cl) for overall survival (OS) and relapse-free survival (RFS) based on upper versus lower absolute monocyte count quartile assignment. Additionally, each Cox regression model was adjusted for the following patient characteristics: NCI risk category, race/ethnicity, gender, and age. OS and RFS rates were plotted using Kaplan-Meier curves, and log-rank tests of equality were used to compare the differences in survival rates for absolute monocyte count upper versus lower quartile. p values <0.05 were deemed significant in all analyses. All statistical analyses were performed using Stata 14.0 (StataCorp LP, College Station, TX).
Human Bone Marrow and Peripheral Blood Flow Cytometry
Statistical analysis of human monocyte subsets quantified by flow cytometry from bone marrow and peripheral blood was performed using unpaired t-test, with p values indication.
Adult B-ALL CIBERSORT Analysis
For adult B-ALL cases in which B-ALL subtype patient number exceeded n = 36 (n = 9 per quartile), we compared the patients with the predicted monocyte abundance in the upper-quartile (Monocyte high) to those in the lower-quartile of this cohort (Monocyte low). Kaplan-Meier survival curve p values were performed using Log rank Mantel-COX test. Data with statistical significance are as indicated, *P< 0.05.
Human scRNA-Seq and CITE-Seq Statistical Analysis
Gene set module scores for each cell were calculated using the average expression levels of every gene signature, subtracting the aggregated expression of randomly selected control genes. To quantify the pathways altered across the stages, genes were ranked based on the fold-changes between them. Statistical analysis was performed using the fgsea R package (Sergushichev, 2016) for the pre-ranked gene list based on the differential expression against the MSigDB gene sets (Subramanian et al., 2005) with 10,000 iterations.
To determine the similarity of cell types across datasets, Gene Set Variation Analysis (GSVA) (Hanzelmann et al., 2013) was utilized to evaluate the enrichment of population-specific markers within each cluster based on the cluster-averaged log-transformed expression matrix.
For cross-species comparisons, gene homologs were provided by HUGO Gene Nomenclature Committee at the European Bioinformatics Institute which integrates the ortholog assertions predicted for human genes by eggNOG, Ensembl Compara, HGNC, HomoloGene, Inparanoid, NCBI Gene Orthology, OMA, OrthoDB, OrthoMCL, Panther, PhylomeDB, TreeFam and ZFIN. For each human equivalent within each species, the ortholog supported by the largest number of databases was used. Wilcoxon rank-sum test performed to measure differences in cell cluster/type groups, as well as gene expression heatmap of marker genes, with p value indicated on plots.
Pre-clinical Platform Statistical Analysis
Indicated p value shown for the quantification of CD 16-expressing cells in monocyte-seeded devices and vascular endothelial diameter under different co-culture conditions is derived from one-way ANOVA test. Statistical analysis of absolute/proportions of murine B-ALL and leukemia-associated monocytes generated by whole blood cell counts and flow cytometry performed using unpaired t-test, with p value indicated. Kaplan-Meier analysis of Ph+GFP+ B-ALL transplant recipient survival following TKI and mAb treatment, p value, treatment regimen and number of recipients per condition are indicated. Three primary B-ALL were each transplanted into n > 4 recipient mice per condition.
Supplementary Material
Table S1. Primary B-ALL Patient Data Analyzed by scRNA-Seq and CITE-Seq, Related to STAR Methods. Data includes diagnosis, remission and relapse date, patient age and sex, percentage of viable cells and viable CD 19+ in thawed samples, disease diagnosis clinical karyotype, identified genetic lesions and institute patient codes.
Table S2. Gene Signatures Used for Cell Type Identification, Related to STAR Methods. Genes selected by modification of cell type-specific gene sets generated by Aran et al. (Genome Biology 2017), in addition to lineage-specific genes curated by the authors.
Table S3. Primary B-ALL Patient Data from Monocyte Subset Flow-based Validation and Peripheral Blood scRNA-Seq, Related to Figure 4.
Table S4. Texas Children’s Hospital B-ALL Patient Cohort Details and Multivariate Analysis, Related to Figure 5. Pediatric B-ALL outcome-overall survival (OS) and relapse-free survival (RFS)-based on Absolute Monocyte Count at disease diagnosis, end of induction therapy (Day 29), initiation of maintenance therapy, and end of therapy.
Table S5. CIBERSORT Monocyte Fraction Rankings from Primary B-ALL Ph+/Ph-like Patient RNA-Seq data, Related to Figure 5.
KEY RESOURCES TABLE
| REAGENT or RESOURCE | SOURCE | IDENTIFIER |
|---|---|---|
| Antibodies | ||
| FITC anti-human CD45 | BD | Cat#347463; Lot#B230035; Clone:2D1 |
| APC anti-human CD19 | BioLegend | Cat#302212; Lot#B245672; Clone:HIB19 |
| PE anti-human CD10 | BioLegend | Cat#312204; Lot#B223795; Clone:HI10a |
| Alexa Fluor 700 anti-human CD16 | BioLegend | Cat#302025; Lot#B266049; Clone:3G8 |
| Alexa Fluor 488 anti-human CD14 | BioLegend | Cat#301811; Lot#B277931; Clone:M5E2 |
| PerCP anti-human CD45 | BioLegend | Cat#304025; Lot#B283980; Clone:HI30 |
| PE/Cy7 anti-human CD3 | BioLegend | Cat#317333; Lot#B249890; Clone:OKT3 |
| PE/Cy7 anti-human CD56 | BioLegend | Cat#318317; Lot#B259278; Clone:HCD56 |
| CD45 anti-human APC/Cy7 | BD | Cat#557833; Lot#8059688; Clone:2D1 |
| PE/Cy7 anti-human CD34 | BD | Cat#560710; Lot#7341871; Clone:581 |
| BUV496 anti-human CD38 | BD | Cat#564657; Lot#8138506; Clone:HIT2 |
| BV711 anti-human CD3 | BD | Cat#563724; Lot#7193553; Clone:UCHT1 |
| BV711 anti-human CD14 | BD | Cat#563372; Lot#8025911; Clone:MΦP9 |
| BV711 anti-human CD16 | BD | Cat#563127; Lot#8149698; Clone:3G8 |
| BV711 anti-human CD71 | BD | Cat#563767; Lot#8039974; Clone:M-A712 |
| Mouse anti-human CD68 | Dako | Cat#M0814; Lot#20053851; Clone:KP1 |
| Rabbit anti-human CSF1R | Cell Signaling Technology | Cat#28917; Lot#2; Clone:E4T8Z |
| Rabbit anti-human CD45 | Cell Signaling Technology | Cat#13917S; Lot#1; Clone:D9M8I |
| AlexaFluor700 anti-human CD19 | BD | Cat#557921; Lot#8053612; Clone:HIB19 |
| InVivoMAb anti-mouse CSF1R (CD115) | BioXCell | Cat#BE0213; Clone: AFS98 |
| InVivoMAb rat IgG2a isotype control, anti-trinitrophenol | BioXCell | Cat#BE0089; Clone: 2A3 |
| Purified Rat Anti-Mouse BD Fc Block | BD | Cat#553142; Lot#5341775; Clone:2.4G2 |
| PE anti-mouse CD150 | BioLegend | Cat#115904; Lot#B256074; Clone:TC15–12F12.2 |
| APC anti-mouse CD117 | BioLegend | Cat#105812; Lot#B272462; Clone:2B8 |
| APC/Cy7 hamster anti-mouse CD3ε | BD | Cat#557596; Lot#2257650; Clone:145–2C11 |
| APC/Cy7 anti-mouse CD4 | BioLegend | Cat#100526; Lot#B260852; Clone:RM4–5 |
| APC/Cy7 anti-mouse CD8a | BioLegend | Cat#100714; Lot#B260276; Clone:53–6.7 |
| APC/Cy7 rat anti-mouse CD11b | BioLegend | Cat#101226; Lot#B259668; Clone:M1/70 |
| APC/Cy7 anti-mouse/human CD45R | BioLegend | Cat#103224; Lot#B266028; Clone:RA3–6B2 |
| APC/Cy7 rat anti-mouse Ter-119 | BD | Cat#560509; Lot#7166662; Clone:Ter-119 |
| APC/Cy7 mouse anti-mouse NK-1.1 | BD | Cat#560618; Lot#7285761; Clone:PK136 |
| PE/Cy7 rat anti-mouse Ly-6A/E | BioLegend | Cat#108114; Lot#B253060; Clone:D7 |
| PerCP/Cy5.5 anti-mouse CD48 | BioLegend | Cat#103422; Lot#B154875; Clone:HM48–1 |
| PE rat anti-mouse CD11b | BD | Cat#553311; Lot#5141630; Clone:M1/70 |
| APC anti-mouse CD19 | BioLegend | Cat#115512; Lot#B252571; Clone:6D5 |
| Alexa Fluor 700 anti-mouse I-A/I-E Antibody | BioLegend | Cat#107622; Lot#B264454; Clone:M5/114.15.2 |
| PE/Cy7 anti-mouse CX3CR1 | BioLegend | Cat#149015; Lot#B259778; Clone:SA011F11 |
| PerCP/Cy5.5 anti-mouse CD45 | BioLegend | Cat#103132; Lot#B272167; Clone:30-F11 |
| APC-Cy7 anti-mouse Ly-6C | BioLegend | Cat#128026; Lot#B248351; Clone:HK1.4 |
| Brilliant Violet 605 rat anti-mouse Ly-6G | BioLegend | Cat#127639; Lot#B234355; Clone:1A8 |
| PE anti-mouse IgM | eBioscience | Cat#12–5790-81; Lot#E01774–1632; Clone: 11/41 |
| Mouse anti-human CD19 | Biocare | Cat#CM310; Lot#112817; Clone:56C6 |
| APC anti-mouse CD68 | BioLegend | Cat#137007; Lot#B220773; Clone:FA-11 |
| APC mouse IgG2a, k isotype control | BioLegend | Cat#400219; Lot#B222746; Clone:MOPC-173 |
| Alexa Fluor 488 conjugated anti-GFP, rabbit polyclonal antibody | Invitrogen | Cat#A21311; Lot#1891008; Clone:Polyclonal |
| Alexa Fluor 488 goat anti-rabbit IgG (H+L) | Invitrogen | Cat#A11008; Lot#1981125; Clone:Polyclonal |
| PE anti-human CD31 | BioLegend | Cat#303106; Lot#B267974; Clone:WM59 |
| PE anti-human CD144 (VE-Cadherin) | BioLegend | Cat#348506; Lot#B283762; Clone:BV9 |
| Alexa Fluor 647 anti-human CD14 | BioLegend | Cat#325612; Lot#B238527; Clone:HCD14 |
| FITC anti-human CD16 | BioLegend | Cat#302006; Lot#B256873; Clone:3G8 |
| Brilliant Violet 421TM anti-human CD19 | BioLegend | Cat#302234; Lot#B275425; Clone:HIB19 |
| PE Mouse IgG1 anti-human CD31 | BioLegend | Cat#303106; Lot#B267974; Clone:WM59 |
| PE Mouse IgG2a anti-human CD144 (VEcad) | BioLegend | Cat#348506; Lot#B283762; Clone:BV9 |
| Alexa Fluor 647 Mouse IgG1 anti-human CD14 | BioLegend | Cat#325612; Lot#B238527; Clone:HCD14 |
| FITC Mouse IgG1 anti-human CD16 | BioLegend | Cat#302006; Lot#B256873; Clone:3G8 |
| Brilliant Violet 421 Mouse IgG1 anti-human CD19 | BioLegend | Cat#302234; Lot#B275425; Clone:HIB19 |
| CITE-Seq: CD1a-GATCGTGTTGTGTTA | BioLegend | Cat#300133; Lot#B271405; Clone:HI149 |
| CITE-Seq: CD1c-GAGCTACTTCACTCG | BioLegend | Cat#331539; Lot#B271540; Clone:L161 |
| CITE-Seq: CD2-TACGATTTGTCAGGG | BioLegend | Cat#309229; Lot#B271801; Clone:TS1/8 |
| CITE-Seq: CD3-CTCATTGTAACTCCT | BioLegend | Cat#300475; Lot#B268760; Clone:UCHT1 |
| CITE-Seq: CD4-GAGGTTAGTGATGGA | BioLegend | Cat#344649; Lot#B270517; Clone:SK3 |
| CITE-Seq: CD5-CATTAACGGGATGCC | BioLegend | Cat#300635; Lot#B269358; Clone:UCHT2 |
| CITE-Seq: CD7-TGGATTCCCGGACTT | BioLegend | Cat#343123; Lot#B260269; Clone:CD7–6B7 |
| CITE-Seq: CD8-GCGCAACTTGATGAT | BioLegend | Cat#344751; Lot#B277210; Clone:SK1 |
| CITE-Seq: CD10-CAGCCATTCATTAGG | BioLegend | Cat#312231; Lot#B276155; Clone:HI10a |
| CITE-Seq: CD11b-GACAAGTGATCTGCA | BioLegend | Cat#301353; Lot#B271395; Clone:ICRF44 |
| CITE-Seq: CD11c-TACGCCTATAACTTG | BioLegend | Cat#371519; Lot#B270802; Clone:S-HCL-3 |
| CITE-Seq: CD13-TTTCAACGCCCTTTC | BioLegend | Cat#301729; Lot#B277201; Clone:WM15 |
| CITE-Seq: CD14-TCTCAGACCTCCGTA | BioLegend | Cat#301855; Lot#B269442; Clone:M5E2 |
| CITE-Seq: CD15-TCACCAGTACCTAGT | BioLegend | Cat#323046; Lot#B261038; Clone:W6D3 |
| CITE-Seq: CD16-AAGTTCACTCTTTGC | BioLegend | Cat#302061; Lot#B271398; Clone:3G8 |
| CITE-Seq: CD19-CTGGGCAATTACTCG | BioLegend | Cat#302259; Lot#B271400; Clone:HIB19 |
| CITE-Seq: CD20-TTCTGGGTCCCTAGA | BioLegend | Cat#302359; Lot#B278747; Clone:2H7 |
| CITE-Seq: CD22-GGGTTGTTGTCTTTG | BioLegend | Cat#363514; Lot#B261039; Clone:S-HCL-1 |
| CITE-Seq: CD25-TTTGTCCTGTACGCC | BioLegend | Cat#302643; Lot#B271394; Clone:BC96 |
| CITE-Seq: CD26-GGTGGCTAGATAATG | BioLegend | Cat#302720; Lot#B261043; Clone:BA5b |
| CITE-Seq: CD33-TAACTCAGGGCCTAT | BioLegend | Cat#366629; Lot#B276154; Clone:P67.6 |
| CITE-Seq: CD34-GCAGAAATCTCCCTT | BioLegend | Cat#343537; Lot#B273771; Clone:581 |
| CITE-Seq: CD36-TTCTTTGCCTTGCCA | BioLegend | Cat#336225; Lot#B277728; Clone:5–271 |
| CITE-Seq: CD38-TGTACCCGCTTGTGA | BioLegend | Cat#303541; Lot#B274648; Clone:HIT2 |
| CITE-Seq: CD41-ACGTTGTGGCCTTGT | BioLegend | Cat#303737; Lot#B271597; Clone:HIP8 |
| CITE-Seq: CD42b-TCCTAGTACCGAAGT | BioLegend | Cat#303937; Lot#B271616; Clone:HIP1 |
| CITE-Seq: CD45-TCCCTTGCGATTTAC | BioLegend | Cat#368543; Lot#B277182; Clone:2D1 |
| CITE-Seq: CD45 RA-TCAATCCTTCCGCTT | BioLegend | Cat#304157; Lot#B275037; Clone:HI100 |
| CITE-Seq: CD45 RO-CTCCGAATCATGTTG | BioLegend | Cat#304255; Lot#B283484; Clone:UCHL1 |
| CITE-Seq: CD48-CTACGACGTAGAAGA | BioLegend | Cat#336709; Lot#B260028; Clone:BJ40 |
| CITE-Seq: CD56-TCCTTTCCTGATAGG | BioLegend | Cat#362557; Lot#B270522; Clone:5.1H11 |
| CITE-Seq: CD61-AGGTTGGAGTAGACT | BioLegend | Cat#336423; Lot#B271605; Clone:VI-PL2 |
| CITE-Seq: CD64-AAGTATGCCCTACGA | BioLegend | Cat#305037; Lot#B278748; Clone:10.1 |
| CITE-Seq: CD66b-AGCTGTAAGTTTCGG | BioLegend | Cat#392905; Lot#B268771; Clone:6/40c |
| CITE-Seq: CD69-GTCTCTTGGCTTAAA | BioLegend | Cat#310947; Lot#B272035; Clone:FN50 |
| CITE-Seq: CD71-CCGTGTTCCTCATTA | BioLegend | Cat#334123; Lot#B277624; Clone:CY1G4 |
| CITE-Seq: CD99-ACCCGTCCCTAAGAA | BioLegend | Cat#371317; Lot#B281964; Clone:3B2/TA8 |
| CITE-Seq: CD115-AATCACGGTCCTTGT | BioLegend | Cat#347325; Lot#B270929; Clone:9–4D2–1F4 |
| CITE-Seq: CD117-AGACTAATAGCTGAC | BioLegend | Cat#313241; Lot#B271396; Clone:104D2 |
| CITE-Seq: CD123-CTTCACTCTGTCAGG | BioLegend | Cat#306037; Lot#B265914; Clone:6H6 |
| CITE-Seq: CD127-GTGTGTTGTCCTATG | BioLegend | Cat#351352; Lot#B270804; Clone:A019D5 |
| CITE-Seq: CD134-AACCCACCGTTGTTA | BioLegend | Cat#350033; Lot#B272585; Clone:Ber-ACT35 |
| CITE-Seq: CD135-CAGTAGATGGAGCAT | BioLegend | Cat#313317; Lot#B272437; Clone:BV10A4H2 |
| CITE-Seq: CD137-CAGTAAGTTCGGGAC | BioLegend | Cat#309835; Lot#B272601; Clone:4B4–1 |
| CITE-Seq: CD138-GTATAGACCAAAGCC | BioLegend | Cat#352325; Lot#B280243; Clone:DL-101 |
| CITE-Seq: CD141-GGATAACCGCGCTTT | BioLegend | Cat#344121; Lot#B271806; Clone:M80 |
| CITE-Seq: CD152-ATGGTTCACGTAATC | BioLegend | Cat#369619; Lot#B269951; Clone:BN13 |
| CITE-Seq: CD161-GTACGCAGTCCTTCT | BioLegend | Cat#339945; Lot#B275494; Clone:H P-3G10 |
| CITE-Seq: CD163-GCTTCTCCTTCCTTA | BioLegend | Cat#333635; Lot#B270553; Clone:GHI/61 |
| CITE-Seq: CD177-AGTATGGAGCCATAT | BioLegend | Cat#315811; Lot#B270922; Clone:MEM-166 |
| CITE-Seq: CD183-GCGATGGTAGATTAT | BioLegend | Cat#353745; Lot#B277619; Clone:G025H7 |
| CITE-Seq: CD197-AGTTCAGTCAACCGA | BioLegend | Cat#353247; Lot#B277726; Clone:G043H7 |
| CITE-Seq: CD223-CATTTGTCTGCCGGT | BioLegend | Cat#369333; Lot#B272033; Clone:HI264+A54:H62 |
| CITE-Seq: CD235a-AGAGTATGTATGGGA | BioLegend | Cat#349117; Lot#B272995; Clone:HI264 |
| CITE-Seq: CD244-TCGCTTGGATGGTAG | BioLegend | Cat#329527; Lot#B278859; Clone:C1.7 |
| CITE-Seq: CD278-CGCGCACCCATTAAA | BioLegend | Cat#313555; Lot#B282675; Clone:C398.4A |
| CITE-Seq: CD279-ACAGCGCCGTATTTA | BioLegend | Cat#329955; Lot#B273256; Clone:EH12.2H7 |
| CITE-Seq: CD294-TGTTTACGAGAGCCC | BioLegend | Cat#350127; Lot#B259969; Clone:BM16 |
| CITE-Seq: CD274-GTTGTCCGACAATAC | BioLegend | Cat#329743; Lot#B278846; Clone:29E2A3 |
| CITE-Seq: IgM-TAGCGAGCCCGTATA | BioLegend | Cat#314541; Lot#B277177; Clone:MHM-88 |
| CITE-Seq: IgD-CAGTCTCCGTAGAGT | BioLegend | Cat#348243; Lot#B275896; Clone:IA6–2 |
| CITE-Seq: TIGIT-TTGCTTACCGCCAGA | BioLegend | Cat#372725; Lot#B273257; Clone:A15153G |
| CITE-Seq: Mouse IgG2a-CTCCTACCTAAACTG | BioLegend | Cat#400285; Lot#B277632; Clone:MOPC-173 |
| CITE-Seq: Mouse IgG2b-ATATGTATCACGCGA | BioLegend | Cat#400373; Lot#B271809; Clone:MPC-11 |
| CITE-Seq: Rat IgG2a-AAGTCAGGTTCGTTT | BioLegend | Cat#400571; Lot#B263575; Clone:RTK2758 |
| CITE-Seq: Mouse IgG1-GCCGGACGACATTAA | BioLegend | Cat#400199; Lot#B274761; Clone:MOPC-21 |
| CITE-Seq: Armenian Hamster IgG-CCTGTCATTAAGACT | BioLegend | Cat#400973; Lot#B279512; Clone:HTK888 |
| CITE-Seq: Rat IgG1-ATCAGATGCCCTCAT | BioLegend | Cat#400459; Lot#B263610; Clone:RTK2071 |
| CITE-Seq: HLA-DR-AATAGCGAGCAAGTA | BioLegend | Cat#307659; Lot#B269913; Clone:L243 |
| CITE-Seq: TotalSeq-A anti-human Hashtag #1-GTCAACTCTTTAGCG | BioLegend | Cat#394601; Lot#B272595; Clone:LNH-94;2M2 |
| CITE-Seq: TotalSeq-A anti-human Hashtag #2-TGATGGCCTATTGGG | BioLegend | Cat#394603; Lot#B76159; Clone:LNH-94;2M2 |
| CITE-Seq: TotalSeq-A anti-human Hashtag #3-TTCCGCCTCTCTTTG | BioLegend | Cat#394605; Lot#B272598; Clone:LNH-94;2M2 |
| CITE-Seq: TotalSeq-A anti-human Hashtag #4-AGTAAGTTCAGCGTA | BioLegend | Cat#394607; Lot#B276157; Clone:LNH-94;2M2 |
| CITE-Seq: TotalSeq-A anti-human Hashtag #5-AAGTATCGTTTCGCA | BioLegend | Cat#394609; Lot#B276152; Clone:LNH-94;2M2 |
| CITE-Seq: TotalSeq-A anti-human Hashtag #6-GGTTGCCAGATGTCA | BioLegend | Cat#394611; Lot#B272604; Clone:LNH-94;2M2 |
| Chemicals, Peptides, and Recombinant Proteins | ||
| Murine Stem Cell Factor (SCF) | Peprotech | Cat#250–03 |
| Murine Flt3 Ligand | Peprotech | Cat#250–31L |
| Murine interleukin-7 (IL-7) | Peprotech | Cat#217–17 |
| VEGF | RayBiotech | Cat#230–00012 |
| Polyethylenimine (PEI) | Polysciences, Inc | Cat#23966 |
| Polybrene transfection reagent | Fisher Scientific | Cat#TR1003G |
| Retronectin | Takara Bio | Cat#T202 |
| Dimethyl sulfoxide (DMSO) | Fisher | Cat#D128–500 |
| SU-8 2050 | Microchem | N/A |
| SYLGARD™ 184 Silicone Elastomer Kit (Polydimethylsiloxane,PDMS) | Dow Corning | Cat#DC2065622 |
| Gelatin | Sigma | Cat#G2500 |
| Thrombin | Sigma | Cat#604980 |
| Fibrinogen from bovine plasma | Sigma | Cat#F8630 |
| EGM-2 | Lonza | Cat#CC-3162 |
| FGM-2 | Lonza | Cat#CC-3132 |
| Critical Commercial Assays | ||
| Single Cell 3′ Library & Gel Bead Kit v2 | 10x Genomics | PN-120237 |
| Single Cell 3′ Chip Kit v2 | 10x Genomics | PN-120236 |
| i7 Multiplex Kit | 10x Genomics | PN-120262 |
| Chromium Next GEM Chip G Single Cell Kit | 10x Genomics | PN-100120 |
| Chromium Next GEM Single Cell 3’ GEM, Library & Gel Bead Kit v3.1 | 10x Genomics | PN-1000075 |
| Dynabeads Mouse T-Activator CD3/CD28 for T-Cell Expansion and Activation | ThermoFisher Scientific | Cat#11456D |
| Pan T-cell isolation kit II (mouse) | Miltenyi Biotec | Cat#130–095-130 |
| Akoya Biosciences Opal multiplex automation kit | Akoya | Cat#NEL821001KT |
| Deposited Data | ||
| Sequencing reads, feature-barcode matrices | This paper | GSE134759 |
| Experimental Models: Cell Lines | ||
| Human: Reh | ATCC | CRL-8286 |
| Human: SUP-B15 | ATCC | CRL-1929 |
| Human Umbilical Vein Endothelial cells (HUVEC) | Lonza | C2519A |
| Human fibroblast cells | Lonza | CC-2512 |
| Platinum E | Cell Biolabs | RV-101 |
| Experimental Models: Organisms/Strains | ||
| Mouse: C57BL/6 | JAX | Cat#000664 |
| Mouse: B6.FVB-Tg(Cdh5-cre)7Mlia/J | JAX | Cat#006137 |
| Mouse: B6.Cg-Gt(ROSA)26Sortm9(CAG-tdTomato)Hze/J | JAX | Cat#007909 |
| Recombinant DNA | ||
| MSCV-IRES-GFP | Addgene | Addgene: 27490 |
| MSCV-BCR-ABL1-IRES-GFP | Witkowski et al., 2017 | Sub-cloned from Addgene: 38185 |
| Software and Algorithms | ||
| FlowJo V10 | TreeStar (BD Biosciences) | https://www.flowjo.com/ |
| Prism 7.0 | GraphPad | https://www.graphpad.com |
| InForm® software v2.4 | Akoya/PerkinElmer | https://www.perkinelmer.com/lab-solutions/resources/docs/PRD_010576B_01_inForm.pdf |
| Leica Microsystems imaging software | Leica | N/A |
| Fiji software | Schindelin et al., 2012 | https://imagej.net/Fiji |
| Cell Ranger | 10x Genomics | https://support.10xgenomics.com/single-cell-gene-expression/software/pipelines/latest/what-is-cell-ranger |
| Seurat | Stuart et al., 2019 | https://cran.r-project.org/package=Seurat |
| destiny | Angerer et al., 2015 | https://bioconductor.org/packages/destiny/ |
| SAVER | Huang et al., 2018 | https://cran.r-project.org/package=SAVER |
| fgsea | Sergushichev, 2016 | https://bioconductor.org/packages/fgsea/ |
| msigdbr | Subramanian et al., 2005 | https://cran.r-project.org/package=msigdbr |
| GSVA | Hanzelmann et al., 2013 | https://bioconductor.org/packages/GSVA/ |
| SingleR | Aran et al., 2019 | https://bioconductor.org/packages/SingleR/ |
| Other | ||
| PerkinElmer IVIS Lumina III XR | PerkinElmer | N/A |
| Illumina HiSeq 4000 | Illumina | N/A |
| BD LSRFortessa | BD | N/A |
| BD Symphony A5 Cytometer | BD | N/A |
| SY3200 highly automated parallel sorting (HAPS) cell sorter | Sony | N/A |
| AutoMACS | Miltenyl Biotec | Cat#130–092-545 |
| Zeiss 880 Confocal Microscope | Zeiss | N/A |
| Vectra 3.0 imaging system | Akoya Bio | N/A |
| Leica BondRX® autostainer | Leica | N/A |
| EVG620 Mask Aligner | EV Group | N/A |
| PE-50 XL Benchtop Low Pressure Plasma System | Plasma Etch | N/A |
HIGHLIGHTS.
Patient B-ALL bone marrow displays extensively remodeled myeloid compartment.
Monocyte abundance is predictive of pediatric and adult B-ALL patient survival.
Human B-ALL promotes emergence of CD16+ non-classical monocytes ex vivo.
Anti-CSFIR therapy enhances targeted treatment of Ph+ B-ALL models in vivo.
SIGNIFICANCE.
While the outcomes for pediatric ALL now approach 90%, this disease remains a leading cause of cancer-related death in children. Outgrowth of tumor subclones with genetic and epigenetic lesions underpin tumor escape from both conventional and immunotherapies. Targeting a genetically stable supportive microenvironment is one promising avenue to overcome this roadblock. Here, we describe dynamic shifts in cellular composition of the leukemia-associated bone marrow immune microenvironment throughout B-ALL progression, and highlight the predictive value of leukemia-specific monocyte abundance in B-ALL patient survival. We demonstrate B-ALL promotes non-classical monocyte emergence, and that targeting leukemia-associated monocytes in combination with targeted therapy leads to prolonged disease remission in vivo. This study identifies monocytes as a potential targetable component of the leukemic immune microenvironment.
ACKNOWLEDGEMENTS
We would like to thank the NYU School of Medicine core facilities including High Performance Computing, Flow Cytometry and the Genome Technology Center (this shared resource is partially supported by the Cancer Center Support Grant P30CA016087 at the Laura and Isaac Perlmutter Cancer Center). We are grateful to J. Rubnitz and M. Lear from St Jude Children’s Hospital, and T. Tello, J. Lund and Y. Dai from the Children’s Oncology Group for assistance with patient bone marrow biopsy acquisition. We are grateful to P. Chattopadhyay at the NYU Precision Immunology Incubator for assistance with the BD Symphony. We are grateful to the NYU Histopathology Core for assistance with primary human tissue sectioning and imaging, Y. Deng and M. Cammer from the NYU Langone’s Microscopy Laboratory for assistance with imaging. We are grateful to B. Reizis for manuscript suggestions. Experimental Pathology Research Lab by the Cancer Center Support Grant P30CA016087 and the PerkinElmer Vectra® multispectral imaging system awarded through a Shared Instrumentation Grant S10 OD021747. This research was supported by the US National Institutes of Health (ROlCA202025, R01CA202027, R01CA216421, 1R01CA228135 and P01CA229086), the Leukemia & Lymphoma Society (TRP#6580), the Alex’s Lemonade Stand Foundation for Childhood Cancer, and the St. Baldrick’s Cancer Research Foundation (I.A). M.W. is a Fellow of The Leukemia & Lymphoma Society. This project was supported by funds from The Jeffrey Pride Foundation for Pediatric Cancer Research and the Children’s Oncology Group Foundation. The work was also supported by the New York State Department of Health (NYSTEM Program). A.N.T. was supported by the Leukemia and Lymphoma Society and the Alex’s Lemonade Stand Foundation for Childhood Cancer. Fig. Sla and Graphical Abstract generated using BioRender.
Footnotes
DECLARATION OF INTERESTS
The authors declare no competing interests.
Publisher's Disclaimer: This is a PDF file of an unedited manuscript that has been accepted for publication. As a service to our customers we are providing this early version of the manuscript. The manuscript will undergo copyediting, typesetting, and review of the resulting proof before it is published in its final form. Please note that during the production process errors may be discovered which could affect the content, and all legal disclaimers that apply to the journal pertain.
REFERENCES
- Alva JA, Zovein AC, Monvoisin A, Murphy T, Salazar A, Harvey NL, Carmeliet P, and Iruela-Arispe ML (2006). VE-Cadherin-Cre-recombinase transgenic mouse: a tool for lineage analysis and gene deletion in endothelial cells. Dev Dyn 235, 759–767. [DOI] [PubMed] [Google Scholar]
- Andersson AK, Ma J, Wang J, Chen X, Gedman AL, Dang J, Nakitandwe J, Holmfeldt L, Parker M, Easton J, et al. (2015). The landscape of somatic mutations in infant MLL-rearranged acute lymphoblastic leukemias. Nat Genet 47, 330–337. [DOI] [PMC free article] [PubMed] [Google Scholar]
- Angerer P, Haghverdi L, Büttner M, Theis FJ, Marr C, and Buettner F. (2016). destiny: diffusion maps for large-scale single-cell data in R. Bioinformatics 32, 1241–1243. [DOI] [PubMed] [Google Scholar]
- Aran D, Looney AP, Liu L, Wu E, Fong V, Hsu A, Chak S, Naikawadi RP, Wolters PJ, Abate AR, et al. (2019). Reference-based analysis of lung single-cell sequencing reveals a transitional profibrotic macrophage. Nat Immunol 20, 163–172. [DOI] [PMC free article] [PubMed] [Google Scholar]
- Azizi E, Carr AJ, Plitas G, Cornish AE, Konopacki C, Prabhakaran S, Nainys J, Wu K, Kiseliovas V, Setty M, et al. (2018). Single-Cell Map of Diverse Immune Phenotypes in the Breast Tumor Microenvironment. Cell 174, 1293–1308 el236. [DOI] [PMC free article] [PubMed] [Google Scholar]
- Becht E, Mclnnes L, Healy J, Dutertre CA, Kwok IWH, Ng LG, Ginhoux F, and Newell EW (2018). Dimensionality reduction for visualizing single-cell data using UMAP. Nat Biotechnol. [DOI] [PubMed] [Google Scholar]
- Boussommier-Calleja A, Atiyas Y, Haase K, Headley M, Lewis C, and Kamm RD. (2019). The effects of monocytes on tumor cell extravasation in a 3D vascularized microfluidic model. Biomaterials 198, 180–193. [DOI] [PMC free article] [PubMed] [Google Scholar]
- Butler A, Hoffman P, Smibert P, Papalexi E, and Satija R. (2018). Integrating single-cell transcriptomic data across different conditions, technologies, and species. Nat Biotechnol 36, 411–420. [DOI] [PMC free article] [PubMed] [Google Scholar]
- Carlin LM, Stamatiades EG, Auffray C, Hanna RN, Glover L, Vizcay-Barrena G, Hedrick CC, Cook HT, Diebold S, and Geissmann F. (2013). Nr4al-dependent Ly6C(low) monocytes monitor endothelial cells and orchestrate their disposal. Cell 153, 362–375. [DOI] [PMC free article] [PubMed] [Google Scholar]
- Cassetta L, Fragkogianni S, Sims AH, Swierczak A, Forrester LM, Zhang H, Soong DYH, Cotechini T, Anur P, Lin EY, et al. (2019). Human Tumor-Associated Macrophage and Monocyte Transcriptional Landscapes Reveal Cancer-Specific Reprogramming, Biomarkers, and Therapeutic Targets. Cancer Cell 35, 588–602 e510. [DOI] [PMC free article] [PubMed] [Google Scholar]
- Chen B, Khodadoust MS, Liu CL, Newman AM, and Alizadeh AA (2018). Profiling Tumor Infiltrating Immune Cells with CIBERSORT. Methods Mol Biol 1711, 243–259. [DOI] [PMC free article] [PubMed] [Google Scholar]
- Churchman ML, Low J, Qu C, Paietta EM, Kasper LH, Chang Y, Payne-Turner D, Althoff MJ, Song G, Chen SC, et al. (2015). Efficacy of Retinoids in IKZFl-Mutated BCR-ABL1 Acute Lymphoblastic Leukemia. Cancer Cell 28, 343–356. [DOI] [PMC free article] [PubMed] [Google Scholar]
- Edwards D.K.t., Watanabe-Smith K, Rofelty A, Damnernsawad A, Laderas T, Lamble A, Lind EF, Kaempf A, Mori M, Rosenberg M, et al. (2019). CSF1R inhibitors exhibit antitumor activity in acute myeloid leukemia by blocking paracrine signals from support cells. Blood 133, 588–599. [DOI] [PMC free article] [PubMed] [Google Scholar]
- Evensen NA, Madhusoodhan PP, Meyer J, Saliba J, Chowdhury A, Araten DJ, Nersting J, Bhatla T, Vincent TL, Teachey D, et al. (2018). MSH6 haploinsufficiency at relapse contributes to the development of thiopurine resistance in pediatric B-lymphoblastic leukemia. Haematologica 103, 830–839. [DOI] [PMC free article] [PubMed] [Google Scholar]
- Frankenberger M, Hofer TP, Marei A, Dayyani F, Schewe S, Strasser C, Aldraihim A, Stanzel F, Lang R, Hoffmann R, et al. (2012). Transcript profiling of CD16-positive monocytes reveals a unique molecular fingerprint. Eur J Immunol 42, 957–974. [DOI] [PubMed] [Google Scholar]
- Gamrekelashvili J, Giagnorio R, Jussofie J, Soehnlein O, Duchene J, Briseno CG, Ramasamy SK, Krishnasamy K, Limbourg A, Kapanadze T, et al. (2016). Regulation of monocyte cell fate by blood vessels mediated by Notch signalling. Nat Commun 7, 12597. [DOI] [PMC free article] [PubMed] [Google Scholar]
- Gerhardt T, and Ley K. (2015). Monocyte trafficking across the vessel wall. Cardiovasc Res 107, 321–330. [DOI] [PMC free article] [PubMed] [Google Scholar]
- Getzin T, Krishnasamy K, Gamrekelashvili J, Kapanadze T, Limbourg A, Hager C, Napp LC, Bauersachs J, Haller H, and Limbourg FP (2018). The chemokine receptor CX3CR1 coordinates monocyte recruitment and endothelial regeneration after arterial injury. EMBO Mol Med 10, 151–159. [DOI] [PMC free article] [PubMed] [Google Scholar]
- Gu Z, Churchman ML, Roberts KG, Moore I, Zhou X, Nakitandwe J, Hagiwara K, Pelletier S, Gingras S, Berns H, et al. (2019). PAX5-driven subtypes of B-progenitor acute lymphoblastic leukemia. Nat Genet 51, 296–307. [DOI] [PMC free article] [PubMed] [Google Scholar]
- Hanzelmann S, Castelo R, and Guinney J. (2013). GSVA: gene set variation analysis for microarray and RNA-seq data. BMC Bioinformatics 14, 7. [DOI] [PMC free article] [PubMed] [Google Scholar]
- Heisterkamp N, Jenster G, ten Hoeve J, Zovich D, Pattengale PK, and Groffen J. (1990). Acute leukaemia in bcr/abl transgenic mice. Nature 344, 251–253. [DOI] [PubMed] [Google Scholar]
- Huang M, Wang J, Torre E, Dueck H, Shaffer S, Bonasio R, Murray JI, Raj A, Li M, and Zhang NR (2018). SAVER: gene expression recovery for single-cell RNA sequencing. Nat Methods 15, 539–542. [DOI] [PMC free article] [PubMed] [Google Scholar]
- Hunger SP, and Mullighan CG (2015). Acute Lymphoblastic Leukemia in Children. N Engl J Med 373, 1541–1552. [DOI] [PubMed] [Google Scholar]
- Jones CL, Gearheart CM, Fosmire S, Delgado-Martin C, Evensen NA, Bride K, Waanders AJ, Pais F, Wang J, Bhatla T, et al. (2015). MAPK signaling cascades mediate distinct glucocorticoid resistance mechanisms in pediatric leukemia. Blood 126, 2202–2212. [DOI] [PMC free article] [PubMed] [Google Scholar]
- Kumar V, Donthireddy L, Marvel D, Condamine T, Wang F, Lavilla-Alonso S, Hashimoto A, Vonteddu P, Behera R, Goins MA, et al. (2017). Cancer-Associated Fibroblasts Neutralize the Anti-tumor Effect of CSF1 Receptor Blockade by Inducing PMN-MDSC Infiltration of Tumors. Cancer Cell 32, 654–668 e655. [DOI] [PMC free article] [PubMed] [Google Scholar]
- Li S, liana RL Jr., Million RP, Daley GQ, and Van Etten RA. (1999). The P190, P210, and P230 forms of the BCR/ABL oncogene induce a similar chronic myeloid leukemia-like syndrome in mice but have different lymphoid leukemogenic activity. J Exp Med 189, 1399–1412. [DOI] [PMC free article] [PubMed] [Google Scholar]
- Liberzon A, Birger C, Thorvaldsdottir H, Ghandi M, Mesirov JP, and Tamayo P. (2015). The Molecular Signatures Database (MSigDB) hallmark gene set collection. Cell Syst 1, 417–425. [DOI] [PMC free article] [PubMed] [Google Scholar]
- Ma C, Tian C, Zhao L, and Wang J. (2016a). Pneumatic-aided micro-molding for flexible fabrication of homogeneous and heterogeneous cell-laden microgels. Lab Chip 16, 2609–2617. [DOI] [PubMed] [Google Scholar]
- Ma C, Zhao L, Zhou EM, Xu J, Shen S, and Wang J. (2016b). On-Chip Construction of Liver Lobule-like Microtissue and Its Application for Adverse Drug Reaction Assay. Anal Chem 88, 1719–1727. [DOI] [PubMed] [Google Scholar]
- Ma X, Edmonson M, Yergeau D, Muzny DM, Hampton OA, Rusch M, Song G, Easton J, Harvey RC, Wheeler DA, et al. (2015). Rise and fall of subclones from diagnosis to relapse in pediatric B-acute lymphoblastic leukaemia In Nature Communications (Nature Publishing Group; ), pp. 1–12. [DOI] [PMC free article] [PubMed] [Google Scholar]
- MacDonald KP, Palmer JS, Cronau S, Seppanen E, Olver S, Raffelt NC, Kuns R, Pettit AR, Clouston A, Wainwright B, et al. (2010). An antibody against the colony-stimulating factor 1 receptor depletes the resident subset of monocytes and tissue-and tumor-associated macrophages but does not inhibit inflammation. Blood 116, 3955–3963. [DOI] [PubMed] [Google Scholar]
- Madisen L, Zwingman TA, Sunkin SM, Oh SW, Zariwala HA, Gu H, Ng LL, Palmiter RD, Hawrylycz MJ, Jones AR, et al. (2010). A robust and high-throughput Cre reporting and characterization system for the whole mouse brain. Nat Neurosci 13, 133–140. [DOI] [PMC free article] [PubMed] [Google Scholar]
- Manuneedhi Cholan P, Cartland SP, Dang L, Rayner BS, Patel S, Thomas SR, and Kavurma MM (2018). TRAIL protects against endothelial dysfunction in vivo and inhibits angiotensin-II-induced oxidative stress in vascular endothelial cells in vitro. Free Radic Biol Med 126, 341–349. [DOI] [PubMed] [Google Scholar]
- Meyer JA, Wang J, Hogan LE, Yang JJ, Dandekar S, Patel JP, Tang Z, Zumbo P, Li S, Zavadil J, et al. (2013). Relapse-specific mutations in NT5C2 in childhood acute lymphoblastic leukemia. Nat Genet 45, 290–294. [DOI] [PMC free article] [PubMed] [Google Scholar]
- Mullighan CG, Phillips LA, Su X, Ma J, Miller CB, Shurtleff SA, and Downing JR (2008). Genomic analysis of the clonal origins of relapsed acute lymphoblastic leukemia. In Science, pp. 1377–1380. [DOI] [PMC free article] [PubMed] [Google Scholar]
- Mullighan CG, Su X, Zhang J, Radtke I, Phillips LA, Miller CB, Ma J, Liu W, Cheng C, Schulman BA, et al. (2009). Deletion of IKZF1 and prognosis in acute lymphoblastic leukemia. N Engl J Med 360, 470–480. [DOI] [PMC free article] [PubMed] [Google Scholar]
- Mullighan CG, Zhang J, Kasper LH, Lerach S, Payne-Turner D, Phillips LA, Heatley SL, Holmfeldt L, Collins-Underwood JR, Ma J, et al. (2011). CREBBP mutations in relapsed acute lymphoblastic leukaemia. Nature 471, 235–239. [DOI] [PMC free article] [PubMed] [Google Scholar]
- Newman AM, Liu CL, Green MR, Gentles AJ, Feng W, Xu Y, Hoang CD, Diehn M, and Alizadeh AA (2015). Robust enumeration of cell subsets from tissue expression profiles. Nat Methods 12, 453–457. [DOI] [PMC free article] [PubMed] [Google Scholar]
- Passaro D, Di Tullio A, Abarrategi A, Rouault-Pierre K, Foster K, Ariza-McNaughton L, Montaner B, Chakravarty P, Bhaw L, Diana G, et al. (2017). Increased Vascular Permeability in the Bone Marrow Microenvironment Contributes to Disease Progression and Drug Response in Acute Myeloid Leukemia. Cancer Cell 32, 324–341 e326. [DOI] [PMC free article] [PubMed] [Google Scholar]
- Passaro D, Irigoyen M, Catherinet C, Gachet S, Da Costa De Jesus C, Lasgi C, Tran Quang C, and Ghysdael J. (2015). CXCR4 Is Required for Leukemia-Initiating Cell Activity in T Cell Acute Lymphoblastic Leukemia. Cancer Cell 27, 769–779. [DOI] [PubMed] [Google Scholar]
- Pear WS, Miller JP, Xu L, Pui JC, Soffer B, Quackenbush RC, Pendergast AM, Bronson R, Aster JC, Scott ML, et al. (1998). Efficient and rapid induction of a chronic myelogenous leukemia-like myeloproliferative disease in mice receiving P210 bcr/abl-transduced bone marrow. Blood 92, 3780–3792. [PubMed] [Google Scholar]
- Pitt LA, Tikhonova AN, Hu H, Trimarchi T, King B, Gong Y, Sanchez-Martin M, Tsirigos A, Littman DR, Ferrando AA, et al. (2015). CXCL12-Producing Vascular Endothelial Niches Control Acute T Cell Leukemia Maintenance. Cancer Cell 27, 755–768. [DOI] [PMC free article] [PubMed] [Google Scholar]
- Polacheck WJ, Kutys ML, Yang J, Eyckmans J, Wu Y, Vasavada H, Hirschi KK, and Chen CS (2017). A non-canonical Notch complex regulates adherens junctions and vascular barrier function. Nature 552, 258–262. [DOI] [PMC free article] [PubMed] [Google Scholar]
- Pui CH, Campana D, Pei D, Bowman WP, Sandlund JT, Kaste SC, Ribeiro RC, Rubnitz JE, Raimondi SC, Onciu M, et al. (2009). Treating childhood acute lymphoblastic leukemia without cranial irradiation. N Engl J Med 360, 2730–2741. [DOI] [PMC free article] [PubMed] [Google Scholar]
- Puram SV, Tirosh I, Parikh AS, Patel AP, Yizhak K, Gillespie S, Rodman C, Luo CL, Mroz EA, Emerick KS, et al. (2017). Single-Cell Transcriptomic Analysis of Primary and Metastatic Tumor Ecosystems in Head and Neck Cancer. Cell 171, 1611–1624 el 624. [DOI] [PMC free article] [PubMed] [Google Scholar]
- Roberts KG, Li Y, Payne-Turner D, Harvey RC, Yang YL, Pei D, McCastlain K, Ding L, Lu C, Song G, et al. (2014). Targetable kinase-activating lesions in Ph-like acute lymphoblastic leukemia. N Engl J Med 371, 1005–1015. [DOI] [PMC free article] [PubMed] [Google Scholar]
- Robinson MD, McCarthy DJ, and Smyth GK (2010). edgeR: a Bioconductor package for differential expression analysis of digital gene expression data. Bioinformatics 26, 139–140. [DOI] [PMC free article] [PubMed] [Google Scholar]
- Schindelin J, Arganda-Carreras I, Frise E, Kaynig V, Longair M, Pietzsch T, Preibisch S, Rueden C, Saalfeld S, Schmid B, et al. (2012). Fiji: an open-source platform for biological-image analysis. Nat Methods 9, 676–682. [DOI] [PMC free article] [PubMed] [Google Scholar]
- Sergushichev AA (2016). An algorithm for fast preranked gene set enrichment analysis using cumulative statistic calculation. bioRxiv, 060012. [Google Scholar]
- Slayton WB, Schultz KR, Kairalla JA, Dévidas M, Mi X, Pulsipher MA, Chang BH, Mullighan C, Iacobucci I, Silverman LB,, et al. (2018). Dasatinib Plus Intensive Chemotherapy in Children, Adolescents, and Young Adults With Philadelphia Chromosome-Positive Acute Lymphoblastic Leukemia: Results of Children’s Oncology Group Trial AALL0622. J Clin Oncol 36, 2306–2314. [DOI] [PMC free article] [PubMed] [Google Scholar]
- Stoeckius M, Hafemeister C, Stephenson W, Houck-Loomis B, Chattopadhyay PK, Swerdlow H, Satija R, and Smibert P. (2017). Simultaneous epitope and transcriptome measurement in single cells. Nat Methods 14, 865–868. [DOI] [PMC free article] [PubMed] [Google Scholar]
- Stoeckius M, Zheng S, Houck-Loomis B, Hao S, Yeung BZ, Mauck WM 3rd, Smibert P, and Satija R. (2018). Cell Hashing with barcoded antibodies enables multiplexing and doublet detection for single cell genomics. Genome Biol 19, 224. [DOI] [PMC free article] [PubMed] [Google Scholar]
- Stuart T, Butler A, Hoffman P, Hafemeister C, Papalexi E, Mauck WM 3rd, Hao Y, Stoeckius M, Smibert P, and Satija R. (2019). Comprehensive Integration of Single-Cell Data. Cell 177, 1888–1902 el821. [DOI] [PMC free article] [PubMed] [Google Scholar]
- Subramanian A, Tamayo P, Mootha VK, Mukherjee S, Ebert BL, Gillette MA, Paulovich A, Pomeroy SL, Golub TR, Lander ES, et al. (2005). Gene set enrichment analysis: a knowledge-based approach for interpreting genome-wide expression profiles. Proc Natl Acad Sci U S A 102, 15545–15550. [DOI] [PMC free article] [PubMed] [Google Scholar]
- Tirosh I, Izar B, Prakadan SM, Wadsworth MH 2nd, Treacy D, Trombetta JJ, Rotem A, Rodman C, Lian C, Murphy G, et al. (2016). Dissecting the multicellular ecosystem of metastatic melanoma by single-cell RNA-seq. Science 352, 189–196. [DOI] [PMC free article] [PubMed] [Google Scholar]
- Tzoneva G, Perez-Garcia A, Carpenter Z, Khiabanian H, Tosello V, Allegretta M, Paietta E, Racevskis J, Rowe JM, Tallman MS, et al. (2013). Activating mutations in the NT5C2 nucleotidase gene drive chemotherapy resistance in relapsed ALL. Nat Med 19, 368–371. [DOI] [PMC free article] [PubMed] [Google Scholar]
- van Galen P, Hovestadt V, Wadsworth Ii MH, Hughes TK, Griffin GK, Battaglia S, Verga JA, Stephansky J, Pastika TJ, Lombardi Story, J., et al. (2019). Single-Cell RNA-Seq Reveals AML Hierarchies Relevant to Disease Progression and Immunity. Cell 176, 1265–1281 el224. [DOI] [PMC free article] [PubMed] [Google Scholar]
- Villani AC, Satija R, Reynolds G, Sarkizova S, Shekhar K, Fletcher J, Griesbeck M, Butler A, Zheng S, Lazo S, et al. (2017). Single-cell RNA-seq reveals new types of human blood dendritic cells, monocytes, and progenitors. Science 356. [DOI] [PMC free article] [PubMed] [Google Scholar]
- Waltman L, and van Eck NJ (2013). A smart local moving algorithm for large-scale modularity-based community detection. The European Physical Journal B 86, 471. [Google Scholar]
- Witkowski MT, Hu Y, Roberts KG, Boer JM, McKenzie MD, Liu GJ, Le Grice OD, Tremblay CS, Ghisi M, Willson TA, et al. (2017). Conserved IKAROS-regulated genes associated with B-progenitor acute lymphoblastic leukemia outcome. J Exp Med 214, 773–791. [DOI] [PMC free article] [PubMed] [Google Scholar]
- Witkowski MT, Lasry A, Carroll WL, and Aifantis I. (2019). Immune-Based Therapies in Acute Leukemia. Trends Cancer 5, 604–618. [DOI] [PMC free article] [PubMed] [Google Scholar]
- Wong KL, Yeap WH, Tai JJ, Ong SM, Dang TM, and Wong SC (2012). The three human monocyte subsets: implications for health and disease. Immunol Res 53, 41–57. [DOI] [PubMed] [Google Scholar]
- Yang J, Zhang L, Yu C, Yang XF, and Wang H. (2014). Monocyte and macrophage differentiation: circulation inflammatory monocyte as biomarker for inflammatory diseases. Biomark Res 2, 1. [DOI] [PMC free article] [PubMed] [Google Scholar]
- Yang JJ, Bhojwani D, Yang W, Cai X, Stocco G, Crews K, Wang J, Morrison D, Devidas M, Hunger SP, et al. (2008). Genome-wide copy number profiling reveals molecular evolution from diagnosis to relapse in childhood acute lymphoblastic leukemia. Blood 112, 4178–4183. [DOI] [PMC free article] [PubMed] [Google Scholar]
- Zheng GX, Terry JM, Belgrader P, Ryvkin P, Bent ZW, Wilson R, Ziraldo SB, Wheeler TD, McDermott GP, Zhu J, et al. (2017). Massively parallel digital transcriptional profiling of single cells. Nat Commun 8, 14049. [DOI] [PMC free article] [PubMed] [Google Scholar]
- Zilionis R, Engblom C, Pfirschke C, Savova V, Zemmour D, Saatcioglu HD, Krishnan I, Maroni G, Meyerovitz CV, Kerwin CM, et al. (2019). Single-Cell Transcriptomics of Human and Mouse Lung Cancers Reveals Conserved Myeloid Populations across Individuals and Species. Immunity. [DOI] [PMC free article] [PubMed] [Google Scholar]
Associated Data
This section collects any data citations, data availability statements, or supplementary materials included in this article.
Supplementary Materials
Table S1. Primary B-ALL Patient Data Analyzed by scRNA-Seq and CITE-Seq, Related to STAR Methods. Data includes diagnosis, remission and relapse date, patient age and sex, percentage of viable cells and viable CD 19+ in thawed samples, disease diagnosis clinical karyotype, identified genetic lesions and institute patient codes.
Table S2. Gene Signatures Used for Cell Type Identification, Related to STAR Methods. Genes selected by modification of cell type-specific gene sets generated by Aran et al. (Genome Biology 2017), in addition to lineage-specific genes curated by the authors.
Table S3. Primary B-ALL Patient Data from Monocyte Subset Flow-based Validation and Peripheral Blood scRNA-Seq, Related to Figure 4.
Table S4. Texas Children’s Hospital B-ALL Patient Cohort Details and Multivariate Analysis, Related to Figure 5. Pediatric B-ALL outcome-overall survival (OS) and relapse-free survival (RFS)-based on Absolute Monocyte Count at disease diagnosis, end of induction therapy (Day 29), initiation of maintenance therapy, and end of therapy.
Table S5. CIBERSORT Monocyte Fraction Rankings from Primary B-ALL Ph+/Ph-like Patient RNA-Seq data, Related to Figure 5.
Data Availability Statement
Data is available under the GEO SuperSeries accession GSE134759. We annotated these data with treatment date, processing batch, patient information, antibody (for CITE-seq experiments and cell hashing experiments only) and treatment type, and also all basic steps of the computational pipeline to reproduce the results. The source code of computational analysis of single-cell studies in the Aifantis laboratory have been incorporated as an R package (available at https://github.com/igordot/scooter).