



Summary
Activated T‐cells make both interleukin‐2 (IL2) and its high‐affinity receptor component CD25. Regulatory CD4 T‐cells (Treg cells) do not make IL2, and the IL2‐CD25 circuit is considered a paracrine circuit crucial in their generation and maintenance. Yet, all T‐cells are capable of making IL2 at some stage during differentiation, making a cell‐intrinsic autocrine circuit additionally possible. When we re‐visited experiments with mixed bone marrow chimeras using a wide range of ratios of wild‐type (WT) and IL2−/− genotype progenitors, we found that, as expected, thymic Treg cells were almost equivalent between WT and IL2−/− genotypes at ratios with WT prominence. However, at WT‐limiting ratios, the IL2−/− genotype showed lower thymic Treg frequencies, indicating a role for cell‐intrinsic autocrine IL2 in thymic Treg generation under IL2‐limiting conditions. Further, peripheral IL2−/− naive CD4 T‐cells showed poor conversion to inducible Tregs (pTregs) both in vivo and in vitro, again indicating a significant role for cell‐intrinsic autocrine IL2 in their generation. Peripherally, the IL2−/− genotype was less prominent at all WT:IL2−/− ratios among both thymic Tregs (tTregs) and pTregs, adoptively transferred IL2−/− Tregs showed poorer survival than WT Tregs did, and RNA‐seq analysis of WT and IL2−/− Tregs showed interesting differences in the T‐cell receptor and transforming growth factor‐beta‐bone morphogenetic protein‐JNK pathways between them, suggesting a non‐titrating role for cell‐intrinsic autocrine IL2 in Treg programming. These data indicate that cell‐intrinsic autocrine IL2 plays significant roles in Treg generation and maintenance.
Keywords: autocrine, FOXP3, IL2, paracrine, Tregs
While intercellular interactions are commonly visualized as paracrine, in that they are mediated by either receptor‐counter‐receptor engagement or by aqueous‐phase molecules secreted by one cell binding to receptors on another cell, individual cells can also sense their own signals in a cell‐autocrine fashion, and examples of biological circuits formed from the resultant modulation of self‐behaviour are known. In the immune system, T lymphocytes are capable of both secreting and sensing several cytokines and chemokines, such as activated CD4 T‐cells, making both the cytokine interleukin‐2 (IL2) and its high‐affinity receptor component CD25; yet, few cell‐autocrine circuits have been reported so far. Our data now indicate that this signalling module has a distinct cell‐autocrine component in the role it plays in generation and homeostasis of regulatory CD4 T‐cells, and generates major interest in the genesis and consequences of this autocrine loop in immune homeostasis and disease.
Abbreviations
- AICD
activation‐induced cell death
- BMP
bone morphogenetic protein
- CFSE
carboxyfluorescein succinimide ester
- CTV
Cell Trace Violet
- DN
CD4−CD8− double‐negative
- DP
CD4+ CD8+ double‐positive
- FOXP3
forkhead box P3
- IL2
interleukin 2
- iTregs
Tregs induced in vitro
- pTregs
peripheral Tregs
- SP
CD4+/CD8+ single‐positive
- TCR
T‐cell receptor
- TGF‐beta
transforming growth factor‐beta
- Tregs
regulatory T‐cells
- tTregs
natural Tregs
- WT
wild‐type
Introduction
Intercellular interactions are commonly visualized as paracrine, in that they are mediated by either receptor‐counter‐receptor engagement or by aqueous‐phase molecules secreted by one cell binding to receptors on another cell. However, individual cells can also sense their own signals in a cell‐autocrine fashion, and examples of biological circuits formed from the resultant modulation of self‐behaviour are known. 1 , 2 In the immune system, T lymphocytes are capable of both secreting and sensing several cytokines and chemokines, yet no resultant truly cell‐autocrine circuits have been reported so far. 3 , 4 , 5 , 6 , 7 , 8 , 9
One major example of a T‐cell cytokine‐receptor communication circuit involves interleukin‐2 (IL2). Activated T‐cells make both the cytokine IL2 and its high‐affinity receptor component CD25. 10 , 11 , 12 , 13 While this signalling module was initially conceived as a general activator of T‐cells, more recent data have clarified further complexities. IL2 plays a dual role in the lifetime of the T‐cell. One crucial role of IL2 lies in the generation and maintenance of regulatory CD4 T‐cells (Treg cells). 14 , 15 , 16 Further, while IL2 can help in clonal expansion of antigen‐specific T‐cells, it also contributes to the contraction of the effector cell response after antigenic clearance, by sensitizing activated T‐cells to activation‐induced cell death (AICD), possibly explaining its influence on the maintenance of effector‐memory T‐cell populations. 17 , 18 , 19 However, it has been shown that lack of Tregs rather than lack of AICD contributes to the uncontrolled proliferation of effector T‐cells observed in IL2‐deficient mice eventually leading to autoimmunity. 14 , 15 , 16
Thus, IL2 can potentially modulate the behaviour of both self and neighbouring cell/s, and the IL2‐CD25 circuit has both paracrine and autocrine potential. There is evidence that, in responding CD4 and CD8 T‐cells, IL2 functions both as a paracrine and as a cell‐autocrine modulator. 7 , 8 , 20 , 21 In this context, CD25 is considered to play a role in IL2 elimination, 22 suggesting the feasibility of rapid and preferential binding of secreted IL2 by cell‐intrinsic autocrine CD25, thereby making a cell‐autocrine signalling circuit plausible. However, in murine mixed bone marrow chimeras made from wild‐type (WT) plus IL2−/− genotype progenitors, the IL2−/− phenotypes have been shown to be corrected, 22 arguing for the paracrine nature of the IL2‐CD25 signalling module.
On this background, we have re‐examined WT + IL2−/− mixed bone marrow chimeras, and we report here evidence in support of cell‐intrinsic autocrine IL2‐signalling components, a titrating one in the generation and a non‐titrating one in the programming of thymic natural Treg (tTreg) cells as well as peripherally induced Treg (pTreg) cells.
Materials and methods
Mice
The following mouse strains were used: C57BL/6 (B6), B6.SJL‐PtprcaPep3b/BoyJ congenic strain of C57BL/6, B6 Thy1.1‐ B6.PL‐Thy1a/CyJ, B6 GFP‐ C57BL/6‐Tg(UBC‐GFP)30Scha/J, IL2 null – C3.129P2(B6)‐Il2tm1Hor/J and Rag‐1−/− B6.129S7‐Rag1tm1Mom/J. All strains were obtained from the Jackson Laboratory (Bar Harbor, ME) and maintained in the animal facility of the National Institute of Immunology. CD45.1 × CD45.2 double‐positive mice were generated as F1 mice from crossing B6 and B6.SJL parents. All mice were used at 6–12 weeks of age, and bi‐parental chimeras were used 2–4 months post‐reconstitution. For making mixed bone marrow chimeras, bone marrow cells from donors were transferred intravenously by retro‐orbital injection, after anaesthetizing mice using ketamine‐xylazine given by intra‐peritoneal injection according to relevant guidelines. Mice were killed by cervical dislocation in all experiments. All mice were maintained and used, and the study was carried out in accordance with the guidelines and with the prior approval of the duly constituted ‘Institutional Animal Ethics Committee’ (IAEC) of the National Institute of Immunology. All methods were performed in accordance with relevant guidelines and regulations. All experimental protocols were approved by the Institutional Animal Ethics Committee (IAEC) authorized for this purpose.
Reagents
The following anti‐mouse antibodies were used for sorting and phenotyping: FOXP3 (FJK‐16s or 150D/E4) (AF488, PE, eFluor 450), Helios (22F6) (PE, eFluor 450), pStat5 (SRBCZX) APC, pJNK, CD8α (53–6·7) (FITC, PE, APC, Pecy7), CD4 (RM4–5) (V500, PercP5.5, APC, eFlour 450), CD25 (PC61.5) (PE, APC‐eFluor 780, eFluor 450), CD62L (MEL‐14) (PE, APC, APC‐eFluor 780), CD44 (IM7) (APC, eFluorV450), CD45.2 (104) (FITC, PE, APC, V500, eFlour 450) and CD45.1 (A20) (PercP5.5, APC, eFlour 450, Pecy7) (from eBioscience, San Diego, CA, or from BD Biosciences, San Jose, CA). Carboxyfluorescein succinimide ester (CFSE), Cell Trace Violet (CTV) and fixable violet (all from Molecular Probes, Carlsbad, CA) were used where shown. Functional grade purified anti‐mouse anti‐CD3 (145‐2C11) and anti‐CD28 (37.51) antibodies (eBioscience, San Diego, CA) were used for T‐cell stimulation. Cells were cultured in RPMI‐1640 (Biological Industries, Beit Haemek, Israel) supplemented with 10% fetal bovine serum (Sigma‐Aldrich), 2 mm l‐glutamine and antibiotics (Sigma‐Aldrich). For fixation and permeabilization of cells for intracellular staining, the FOXP3 staining buffer kit (eBioscience) was used. Staining buffer was made as phosphate‐buffered saline (PBS) with 1% fetal calf serum (FCS) with/without 0·05% sodium azide (Sigma). Dispase (Gibco), collagenase Type 4 and DNase I (Worthington, Lakewood, NJ) were used for lamina propria cell isolation.
Ex vivo cell population preparations
Spleen, lymph nodes, bones, small intestine and large intestine as appropriate were obtained from mice killed by cervical dislocation. Single cell suspensions were prepared, and red blood cells removed by osmotic lysis. For intestinal lamina propria, gut tissue was slit longitudinally, washed with ice‐cold PBS, minced and incubated in HBSS containing 10% fetal bovine serum (FBS; Gibco Grand Island, NY), 1 mm dithiothreitol, 2 mm EDTA and 25 mm HEPES (Sigma) for 20 min at 37°. Tissue pieces were washed, chopped and digested in RPMI containing 5% FBS, 300 U/ml collagenase type 4, 10 U/ml DNase I and 0·5 mg/ml dispase (Gibco) for 60 min at 37°. The cell suspension was cleared, cells pelleted, and washed.
Staining for flow cytometry and sorting
For flow cytometric analysis, cells were incubated in staining buffer (PBS‐FCS‐NaN3) with staining antibodies on ice for 30 min. The cells were then washed and analysed on the flow cytometer. For detecting intracellular proteins, cells were fixed with Fix/Perm buffer for 30–45 min at room temperature, and then washed twice with permeabilization buffer. Staining for intracellular proteins was done in permeabilization buffer, and then samples were washed with permeabilization buffer before analysis.
For identifying dead cells, cells were incubated with fixable violet (Invitrogen, ThermoFisher Scientific, Carlsbad, CA) in PBS for 60 min on ice before staining. Flow cytometric data collection was done (FACSVerse; BD Biosciences) and data analysed with flowjo software (Treestar, Ashland, OR). All flow cytometric data followed a normal distribution, and mean fluorescence intensities were calculated where applicable. Scaling in histograms was calculated by normalizing to the peak height at the mode of the distribution so that the maximum y‐axis value in the absolute count histogram was 100%.
For sorting, cells were incubated in staining buffer with staining antibodies on ice for 30 min, and washed with staining buffer before re‐suspending them in medium for sorting (BD FACSAria III). Tregs and naïve CD4 T‐cells were sort‐purified flow cytometrically as CD4+ CD25hi and CD4+ CD25− CD44loCD62Lhi, respectively. For differentiating between the donor partners in samples from chimeras, CD45.1 and CD45.2 antibodies were used. For sorting Tregs for RNA sequencing, CD4+ CD25+ cells were sorted from both CD45.1+ and CD45.2+ donors. Sorted cells were rested in complete RPMI at 37° for 2 hr before being re‐suspended in 1 ml TRIzol reagent (Thermofisher Scientific, CA) and stored at −80°. Two such biological repeats of WT and IL2−/− Tregs were collected.
For cell proliferation quantification, cell suspensions were incubated with 10 μm CFSE or 5 μm CTV at a density of 100 million cells/ml in FCS‐free medium for 5 min at room temperature, followed by washing with serum‐containing medium and sort‐purification (BD FACSAria III). Sort‐purified cells were stimulated with plate‐bound anti‐CD3 and anti‐CD28 (5 µg/ml), and CFSE/CTV dilution was assessed 60–72 hr later.
Naive CD4 T‐cells were sorted from B6.GFP mice and labelled with CTV dye. For estimating suppression in vitro, these labelled NCD4 T‐cells were cultured in the absence or presence of varying numbers of WT or IL2−/− Treg cells purified from bi‐parental chimeras, with soluble anti‐mouse CD3 (3 µg/ml) and gamma‐irradiated (10 Gy) CD90− C57BL/6 spleen cells in complete RPMI. After 60 hr of culture, the degree of proliferation of the live NCD4 T‐cells was determined by dye dilution to test the suppressive function of the respective Treg population.
Bi‐parental bone marrow chimera generation and adoptive transfers
B6.GFP, B6. Thy1.1 or C57BL/6 × B6.SJL F1 (CD45.1+CD45.2+) recipient mice were subjected to a 10 Gy dose of gamma‐radiation (Source: Co60, BARC, Mumbai). Ten million bone marrow cells each from WT (B6.SJL; CD45.1) and IL2−/− (CD45.2) mice, mixed in different ratios ranging from 1:9 to 9:1, were transferred intravenously into the gamma‐irradiated mice and were allowed to reconstitute. After 8 weeks, reconstitution of both donors within the recipient was assessed in the peripheral blood of the recipients. Mice with > 80% overall donor reconstitution were used for analysis.
For quantifying relative Treg survival in vivo, WT and IL2−/− Tregs were sort‐purified from mixed bone marrow chimeras, mixed in a 1:1 ratio, and 0·5–1·0 million cells were transferred intravenously into recipient mice.
Dendritic cell and Tregs induced in vivo
Bone marrow cells from IL2−/− mouse femora were harvested and cultured with granulocyte‐macrophage colony‐stimulating factor (GM‐CSF; 10 ng/ml) at a cell density of 0·5 million/ml at 37°. Fresh medium was supplemented on alternate days after removing spent medium from the cultures. Bone‐marrow‐derived dendritic cells (BMDCs) were obtained at the end of 7 days as clusters of non‐adherent rounded cells and used for experiments. The generation of pTreg cells in vitro was done either with or without exogenous IL2. In the absence of exogenous IL2, naïve CD4 T‐cells were stimulated with anti‐CD3 (5 µg/ml) and transforming growth factor (TGF)‐beta (10 ng/ml) in the presence of BMDCs. Generation of pTreg cells in the presence of exogenous IL2 was done by stimulating naive CD4 T‐cells with plate‐coated anti‐CD3 (5 µg/ml) and anti‐CD28 (5 µg/ml) in the presence of IL‐2 (10 U/ml) and TGF‐beta (10 ng/ml).
RNA analyses – quantitative polymerase chain reaction and RNA‐seq
Wild‐type and IL2−/− Tregs were isolated as described above from bi‐parental bone marrow chimeras (pooled from ratios of 1:2–2:1; n = 8) 2 months after bone marrow reconstitution. Sorted cells were rested in complete RPMI at 37° for 2 hr before being re‐suspended in 1 ml TRIzol reagent (Thermofisher Scientific, CA) and stored at −80°. Two such biological repeats of WT and IL2−/− Tregs were collected. RNA was isolated by treatment with chloroform, isopropanol and ethanol according to the RNA isolation protocol using TRIzol reagent as recommended. The RNA extracted was quantified using NanoDrop1000 (Thermofisher Scientific, CA).
The quantitative polymerase chain reaction (qPCR) for IL2 expression was set up with 50 ng of RNA, and fold‐change was calculated by ∆Ct method. The primers used to detect IL2 were CCTGAGCAGGGAGAATTACA and TCCAGAACATGCCGCAGA.
RNA‐seq libraries were prepared using Truseq RNA sample prep kit v2 (Ilumina) as per the manufacturer’s protocols. Barcoded libraries were sequenced (Hiseq2500). Library preparation and sequencing were done commercially (Macrogen, S. Korea). Raw reads were processed to remove adapter sequences, and the resulting fastq file was mapped to the mouse genome (Ensembl) using HISAT2. HTseq‐count was used to count the reads mapped per gene with current GTF file from Ensembl. Galaxy server was used for read quality check, mapping and counting. Differential expression was analysed using DEseq2 package, and GO analysis was done using g:profiler web tool. Only those genes showing a Padj value less than 0·1 and log2 fold‐change greater than +1 or less than −1 were selected as differentially expressed. For GO analysis, only the terms (with a size of 15–500) that show a Padj less than 0·05 were selected.
Statistical analysis and data plotting
For comparison of means between two groups from chimeras, Student's t‐test or Mann−Whitney test were performed to determine P‐values. Data are shown as mean ± SEM.
Data and figures were plotted using Microsoft Excel and Graphpad Prism.
Results
Roles for both paracrine and cell‐intrinsic autocrine IL2 in thymic Treg generation
To investigate potential roles of paracrine versus cell‐intrinsic autocrine IL2 signalling in maintaining Treg homeostasis, we used a mixed bone marrow chimera‐based approach. The mixed bone marrow chimeras were generated by transferring bone marrow progenitors from congenic IL2−/− (CD45.2+ CD90.2+) plus WT (CD45.1+ CD90.2+) into an irradiated recipient in varying ratios. The recipient used was congenic to both IL2−/− and WT donors (CD45.1+ CD45.2+ or B6.GFP or B6.Thy1.1) in order to differentiate each donor population and the residual endogenous population if any. Recipients were allowed to reconstitute for 50–60 days after the transfer of donor bone marrow cells, and then analysed for donor contributions to various re‐constituted T‐cell compartments (Fig. S1a). Gating strategies for thymic Treg cells were based on expression of CD4, CD8, CD25 and FOXP3 (Fig. S1b). Input ratios of the bone marrow progenitors were varied to titrate the amount of IL2 available in the system. The output of chimeric reconstitution showed a fair degree of variation despite broad concordance with input ratios. However, because it would be the output chimerism that would define availability of IL2 and the resultant phenotype if any, we used the output chimerism ratios in all our analyses below.
Upon analysis of data across the range of ratios of output WT:IL‐2−/− chimerism, it was observed that the IL2−/− donor genotype showed decreasing representation in the Treg compartment as the WT:IL2−/− chimerism ratio declined, limiting IL2 in the system (Fig. 1a). This change in the WT:IL2−/− ratios was not observed in the precursor thymic CD4+ CD8+ (double‐positive; DP) compartment (Fig. S2). Based on this trend, we also analysed the data by grouping them into two categories, one relatively IL2‐limited group where WT:IL2−/− donor ratios were < 1, and the other relatively IL2‐sufficient group where WT:IL2−/− donor ratios were > 1. As expected, Treg contribution from IL2−/− donor genotype was poor in IL2‐limited chimeras (ratio < 1; Fig. 1b). Thymic Tregs have been recently reported to develop from two different progenitor categories, −CD25+ FOXP3− or CD25− FOXP3+, ‐and the two are shown to play very different roles in the periphery. 23 We, therefore, quantified both immature subsets in the chimeras. In both precursor types, the IL2−/− group contributed poorly in IL2‐limited but not in IL2‐unlimited chimeras (Fig. 1c,d). These data suggested that, under IL2‐limiting conditions, cell‐intrinsic autocrine IL2 signalling can play a role in thymic Treg differentiation.
Figure 1.
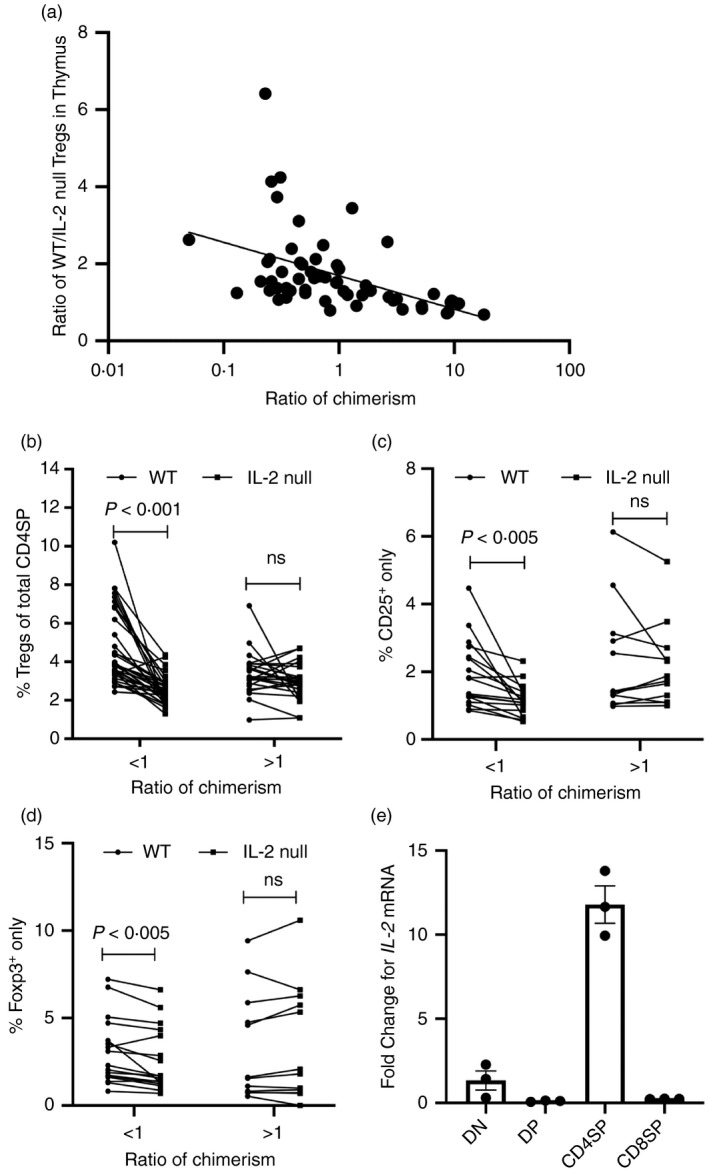
Efficiency of regulatory T‐cells (Treg) generation from wild‐type (WT) and interleukin (IL)2−/− genotypes in the thymus of mixed bone marrow chimeras. Thymocytes from mixed bone marrow chimeras were isolated and analysed by flow cytometry. Bone marrow chimeras were made with a wide range of WT:IL2−/− bone marrow cells. (a) WT:IL2−/− donor genotype ratios for Treg cells (CD4+ CD8− CD25+ FOXP3+) were calculated in each individual recipient mouse and plotted versus output chimerism in each recipient mouse (n = 57). For further analysis, the chimeras were divided into two groups, one with a chimerism ratio of < 1 (range: 0·1–0·9; n = 34), and the second with a ratio of > 1 (range: 1·1–36; n = 23). For each group, paired data are shown for WT versus IL2−/− donor genotypes in each recipient mouse, in Treg lineage cell frequencies in CD4SP thymocytes [(b), CD25+ FOXP3+ CD4+ CD8− Tregs; (c) CD25+ FOXP3− CD4+ CD8− Treg precursors; (d) CD25‐FOXP3+ CD4+ CD8− Treg precursors]. Student's t‐test was used to calculate P‐values. ns: P > 0·05. (e) IL2 mRNA levels, by quantitative reverse transcriptase‐polymerase chain reaction (qRT‐PCR), in sorted CD4SP, CD8SP, double‐negative (CD4− CD8−) and double‐positive (CD4+ CD8+) thymocytes from WT mice (n = 3).
We examined the potential cellular sources of IL2 in the thymus through quantitative reverse transcriptase (qRT)‐PCR assays on isolated thymocyte subsets; CD4−CD8− (double‐negative; DN), CD4+ CD8+ (DP), CD4−CD8+ (CD8‐single‐positive; CD8SP) and CD4+ CD8− (CD4‐single‐positive; CD4SP) cells. IL2 transcript levels were specifically observed predominantly in CD4SP cells (Fig. 1e), identifying them as the most likely source for thymic IL2.
Insufficiency of paracrine IL2 in maintaining peripheral Treg compartment size
We next quantified the peripheral Treg compartment in the spleen (CD4+ CD25+ FOXP3+; Fig. S3a). IL2−/− genotype donor‐origin Treg cells were substantially present in all chimeras as reported extensively. Unlike in the chimeric thymus, there was no titration in the efficiency of Treg generation from the IL2−/− donor genotype as observed for thymic counterpart (Fig. 2a). Therefore, we analysed the data by grouping them into two categories as above in one relatively IL2‐limited group with WT:IL2−/− donor ratios < 1, and the other relatively IL2‐sufficient group with WT:IL2−/− donor ratios > 1. IL2−/− Treg cell frequencies in lymphoid tissues consistently remained significantly fewer than those for WT cells in all chimeras (Fig. 2b). However, the naive:memory (CD44lo:CD44hi; Fig. S3b) ratios in both the peripheral CD4 and the CD8 T‐cell compartments, known to be altered in IL2−/− mice (Fig. S3c), 14 , 24 were not different between IL2−/− and WT donors in the chimeric mice (Fig. 2c,d). We further specifically quantified the ratio of naïve (CD44loCD62Lhi) and effector‐memory (CD44hiCD62Llo) in splenic CD4 and CD8 cells, and found that they showed no difference in any of the chimeras tested (Fig. S4a). Because Tregs are also reported to show distinctions between ‘naive’ and ‘effector’ phenotypes, we also quantified the ratios of naïve (CD44loCD62Lhi) and effector‐memory (CD44hiCD62Llo) Tregs in the chimeric mice, and found no significant differences in these ratios between WT and IL2−/− donors (Fig. S4b), indicating that the Treg deficit in the IL2−/− donor genotype was common to both naive and effector Tregs. As expected, there was no difference between the WT and IL2−/− donors in the B220 + splenic B‐cell compartment in any of the chimeras tested (Fig. S4c). These data suggested that the modest but consistent deficit in the IL2−/− Treg compartment was specific.
Figure 2.
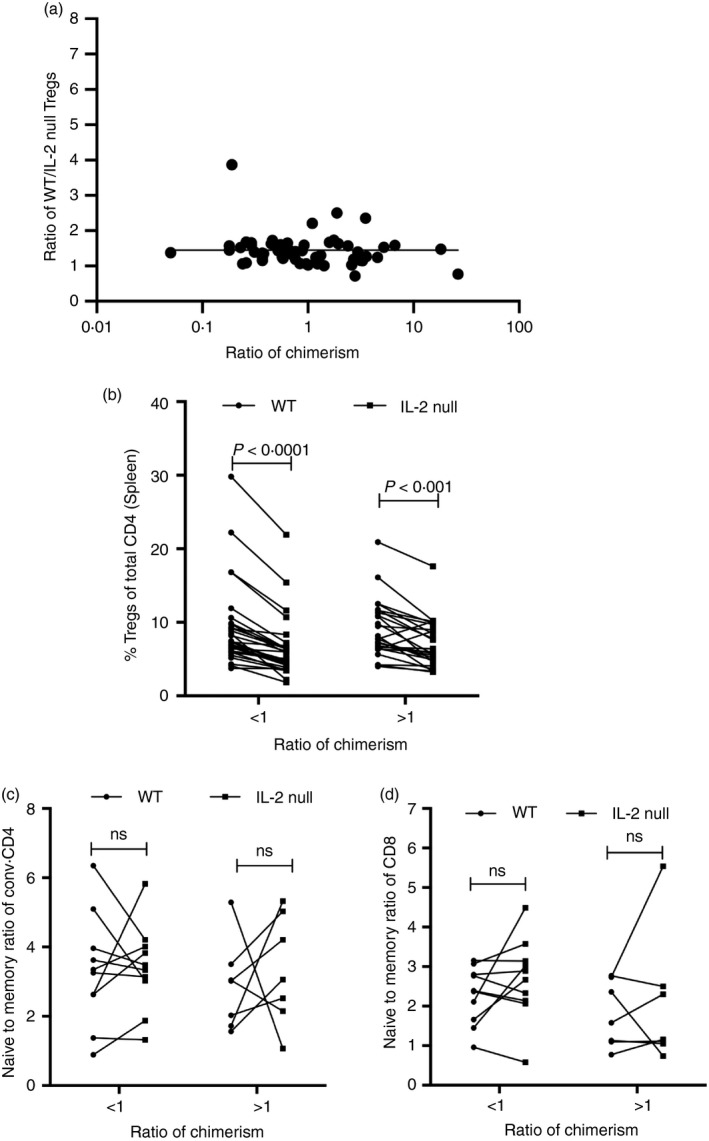
Relative levels of regulatory T‐cells (Treg) subsets of wild‐type (WT) and interleukin (IL)2−/− genotypes in peripheral lymphoid tissues of mixed bone marrow chimeras. Splenic cells, small or large intestinal lamina propria cells, or mesenteric lymph node cells (as indicated) from mixed bone marrow chimeras were isolated and analysed by flow cytometry. (a) WT:IL2−/− donor genotype ratios for Tregs (CD4+ CD25+ FOXP3+) were calculated in each individual recipient mouse and plotted versus output chimerism in each recipient mouse (n = 55). For further analysis, bone marrow chimeras were divided into two groups, one with a chimerism ratio of < 1 (range: 0·1–0·9; n = 32), and the second with a ratio of > 1 (range: 1·1–48; n = 23). For each chimera group, paired data are shown for WT versus IL2−/− donor genotypes in each recipient mouse. (b) Quantification of splenic Treg (CD4+ CD25+ FOXP3+) frequencies in total CD4 T‐cells of WT or IL2−/− genotypes in chimeric mice. (c,d) Quantification of naïve:memory ratios in CD4 (c) or CD8 (d) T‐cells in mixed bone marrow chimeras gated on either CD45.1 (WT) or CD45.2 (IL2−/−) donors. Naïve cells were gated as CD4+ CD44loCD25− or CD8+ CD44lo, while memory T‐cells were gated as CD4+ CD44hi CD25− or CD8+ CD44hi. For each chimera group, paired data are shown for WT versus IL2−/− donor genotypes in each recipient mouse in two groups with ratios of < 1 (range: 0·1–0·9; n = 10) or > 1 (range: 1·3–26; n = 7), respectively. Student's t‐test was used to quantify P‐values. ns: P > 0·05.
We also examined the Treg compartment in a non‐lymphoid tissue, the gut, and found that IL2−/− Treg cells were less prominent than WT Treg cells in the small intestine (Fig. 3a), the large intestine (Fig. 3b) as well as in mesenteric lymph nodes (Fig. 3c).
Figure 3.
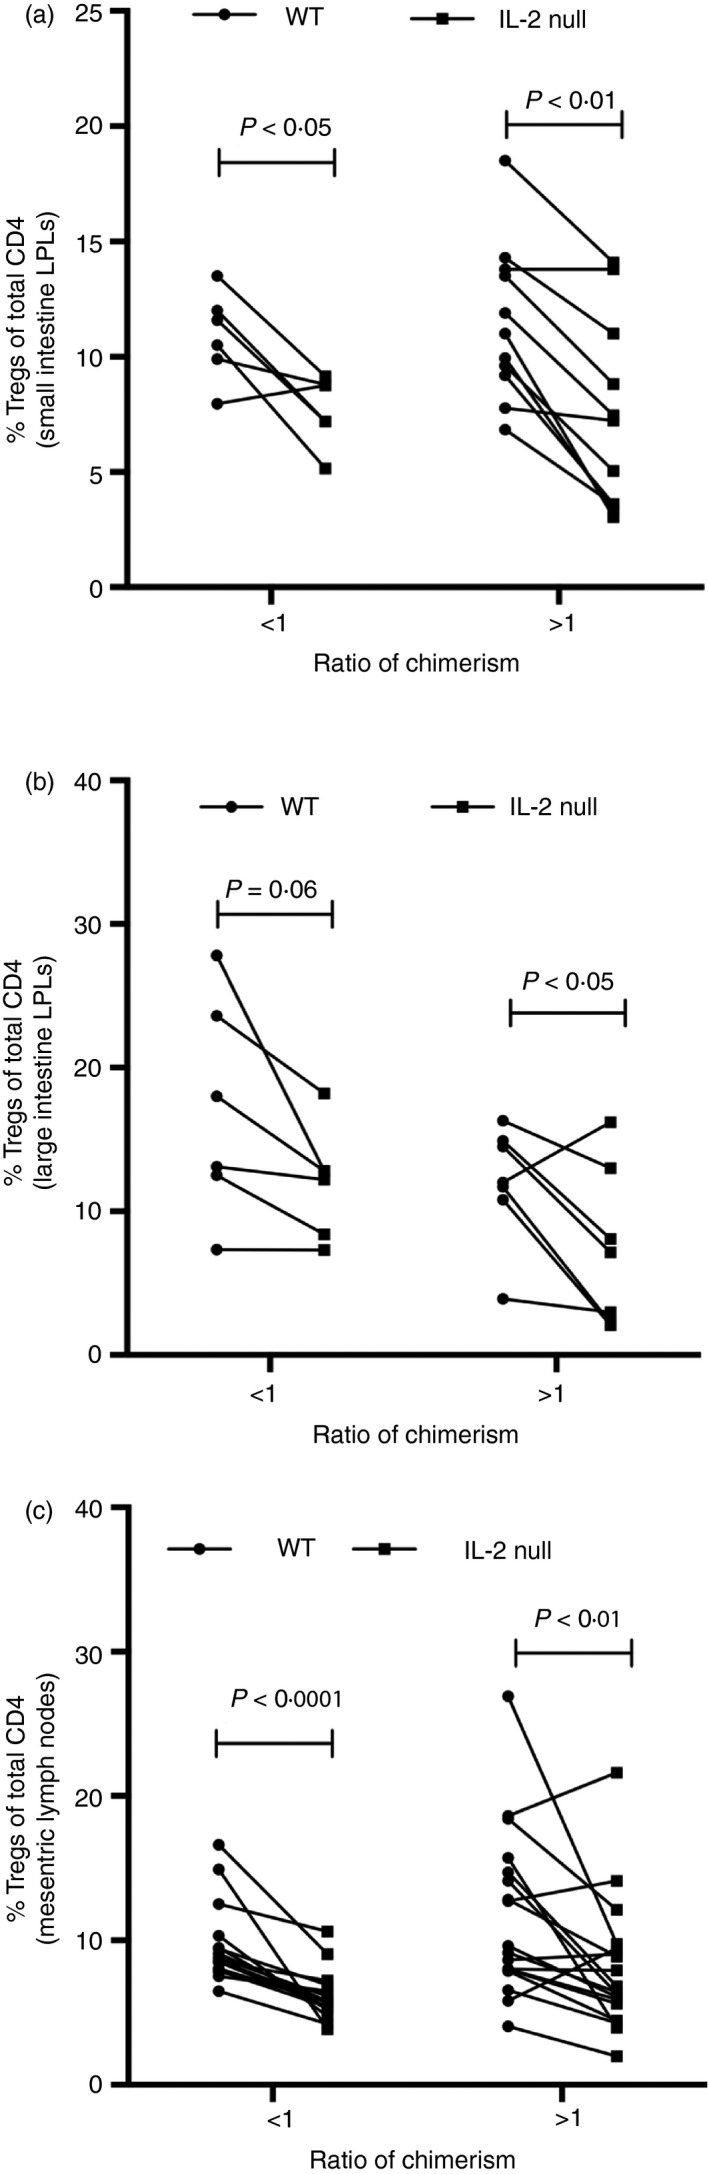
Relative levels of regulatory T‐cells (Treg) subsets of wild‐type (WT) and interleukin (IL)2−/− genotypes in peripheral non‐lymphoid tissues of mixed bone marrow chimeras. Small or large intestinal lamina propria cells, or mesenteric lymph node cells (as indicated) from mixed bone marrow chimeras were isolated and analysed by flow cytometry. For further analysis, bone marrow chimeras were divided into two groups, one with a chimerism ratio of < 1 and the second with a ratio of > 1. For each chimera group, paired data are shown for WT versus IL2−/− donor genotypes in each recipient mouse. Student's t‐test was used to quantify P‐values. ns: P > 0·05. (a–c) Tregs were quantified as CD4+ CD25+ FOXP3+ frequencies in total CD4 T‐cells in either CD45.1 or CD45.2 gated donor populations in bone marrow chimeras. (a) In small intestine lamina propria, with chimerism ratios of < 1 (range: 0·1–0·9; n = 6) or > 1 (range: 1·1–26; n = 7), (b) large intestine lamina propria, with chimerism ratios of < 1 (range: 0·1–0·9; n = 6) or > 1 (range: 1·1–26; n = 7), or (c) in mesenteric lymph nodes, with chimerism ratios of < 1 (range: 0·1–0·9; n = 18) or > 1 (range: 1·1–26; n = 18).
Unlike thymic Tregs, Tregs in the periphery would be expected to be a mixture of tTregs and peripherally induced pTregs. 25 It has been previously described that pTreg cells can be distinguished from tTregs by the absence of expression of the Ikaros family transcription factor Helios, 26 although the distinction is not necessarily rigorously accurate. 27 , 28 We found that IL2−/− Treg cells were generally less prominent than WT cells in both the Helios+ and Helios− (Fig. S5) splenic subsets of chimeric mice (Fig. 4a,b). Because pTregs are known to be prominent in the gut, we examined putative tTregs and pTregs in the gut, and found that IL2−/− Treg cells were less prominent than WT cells in both the Helios+ and Helios− subsets in the small intestine, large intestine and mesenteric lymph nodes, with the exception of tTreg cells in the small intestine (Fig. 4c–h).
Figure 4.
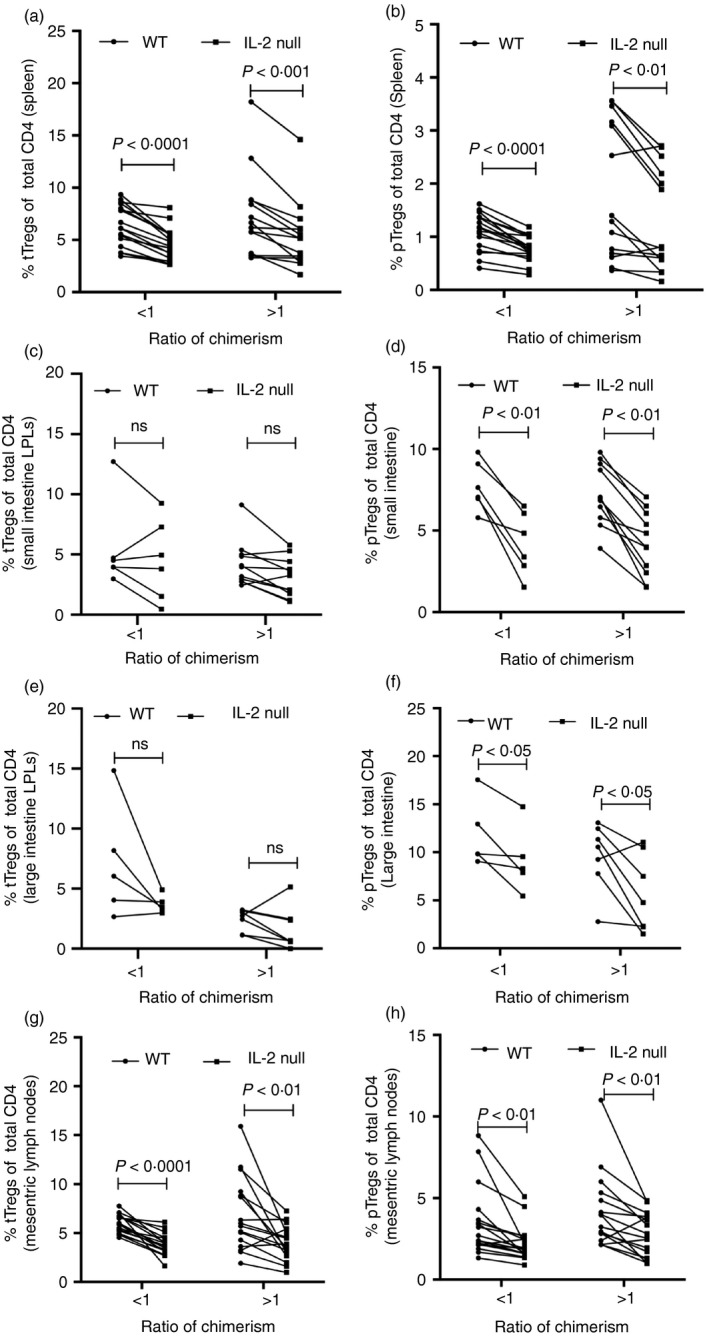
Reduced frequencies of interleukin (IL)2−/− tTregs and pTregs in both lymphoid and non‐lymphoid organs. Peripheral tissue cells from wild‐type (WT):IL2−/− mixed bone marrow chimeras were isolated and analysed by flow cytometry. For analysis, bone marrow chimeras were divided into two groups, one with a chimerism ratio of < 1, and the second with a ratio of > 1. Helios expression was used to distinguish between putative nTregs (CD4+ CD25+ FOXP3+ Helios‐hi) and pTregs (CD4+ CD25+ FOXP3+ Helios‐lo). Cell populations as frequencies in total CD4 T‐cells were quantified, and are shown as tTregs and pTregs in: (a,b) spleen, with chimerism ratios of < 1 (range: 0·1−0·9; n = 16) or > 1 (range: 1·1−26; n = 14); (c,d) small intestine, with chimerism ratio of < 1 (range: 0·1−0·9; n = 6) or > 1 (range: 1·1−26; n = 7); (e,f) large intestine, with chimerism ratios of < 1 (range: 0·1–0·9; n = 5) or > 1 (range: 1·1–26; n = 7); and (g,h) mesenteric lymph nodes, with chimerism ratios of < 1 (range: 0·1–0·9; n = 18) or > 1 (range: 1·1–26; n = 16). For each chimera group, paired data are shown for WT versus IL2−/− donor genotypes in each recipient mouse. Student's t‐test was used to quantify P‐values. ns: P > 0·05.
Defects in peripheral generation and survival of IL2−/− Treg cells
To examine the possible genesis of the lower frequencies of IL2−/− pTreg cells, we examined if pTreg cells could be generated as efficiently from naive CD4 T‐cells from IL2−/− mice as from WT mice. It has been reported that, when naïve CD4 T‐cells (CD4+ CD25− CD44loCD62Lhi) from WT mice are stimulated with plate‐bound anti‐CD3 and anti‐CD28 in the presence of TGF‐beta and IL2, they proliferate and differentiate into pTreg cells. 20 Because we intended to test the role of cell‐autocrine IL2 in pTreg generation, no additional exogenous IL2 was provided in our cultures. Naïve CD4 T‐cells from WT and IL2−/− mice were mixed in various ratios in culture to mimic both cell‐autocrine and paracrine IL2 sources. We used syngeneic BMDCs from IL2−/− mice as supportive stroma with anti‐CD3 (5 µg/ml) and TGF‐beta (10 ng/ml). After 48 hr of culture, cells were stained with fixable violet to label dead cells, and fixed, permeabilized and stained for CD25 and FOXP3 for quantifying Tregs. The IL2−/− donor cells showed consistently lower frequencies of pTreg generation as compared with WT cells in these cultures (Fig. 5a). However, when these cultures were done with the addition of exogenous saturating IL2 concentrations, the pTreg generation was equally efficient between WT and IL2−/− donor cells (Fig. 5b). Further, the frequencies of these responding CD4 T‐cells expressing activation‐induced genes such as CD69 and CD25 at 24 hr after activation were similar between WT and IL2−/− genotypes (Fig. S6).
Figure 5.
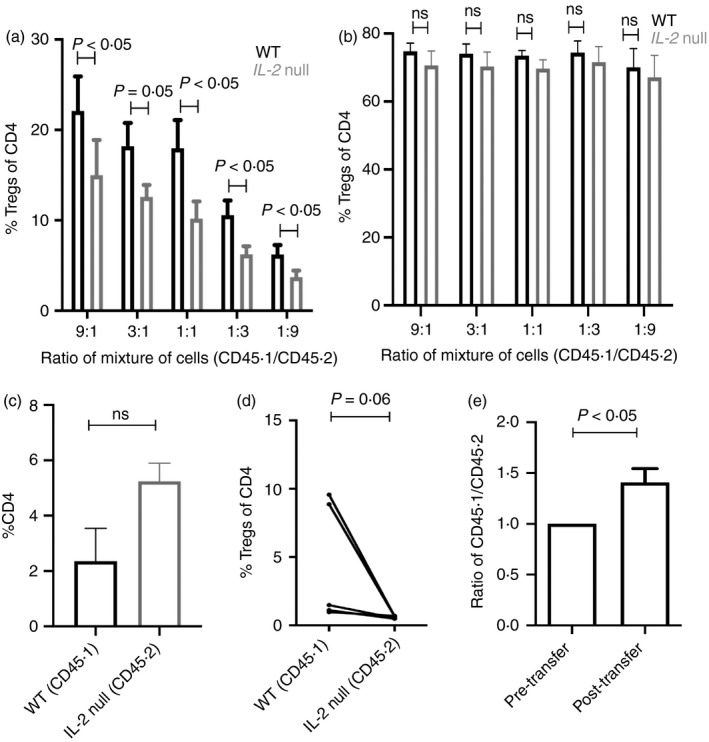
Interleukin (IL)‐2−/− genotype cells show defective regulatory T‐cells (Treg) generation and survival in the periphery. (a,b) Naïve CD4 T‐cells (CD4+ CD25− CD44lo) from both wild‐type (WT) and IL2−/− donor partners were isolated from mixed bone marrow chimeras and mixed in different ratios (9:1, 3:1, 1:1, 1:3, 1:9), and stimulated with bone‐marrow‐derived dendritic cells (BMDCs), anti‐CD3 and transforming growth factor (TGF)‐beta in the absence of IL2 (a; n = 3/group), or with plate‐coated anti‐CD3 + anti‐CD28 and TGF‐beta in the presence of IL2 (b; n > 3/group). Tregs were quantified as CD4+ CD25+ FOXP3+. Data are representative of three independent experiments. (c,d) For in vivo Treg generation, naïve CD4 T‐cells (CD4+ CD25− CD44lo) cells from both WT and IL2−/− donor partners were isolated from mixed bone marrow chimeras and mixed in a 1:1 ratio and transferred into Rag−/− mice along with congenic WT Tregs. After 2 months, spleen cells from the Rag−/− recipients were analysed for (c) CD4 expansion and (d) Treg induction from these donor populations. Because Treg induction in vivo was variable from mouse to mouse, the data are shown separately for each mouse. X‐axes show donor genotypes. Tregs were scored as CD4+ CD25+ FOXP3+ (n = 5/group). (e) For quantification of survival of Tregs in vivo, CD4 + CD25+ Tregs were sorted from both WT and IL2−/− donor partners from mixed bone marrow chimeras, mixed in 1:1 ratio and adoptively transferred into congenic recipient mice. Ratios were quantified at day 3 post‐transfer (n = 4/group). Data are representative of two independent experiments.
We also tested pTreg generation in vivo from WT versus IL2−/− naive CD4 T‐cells. For this, we adoptively transferred, into Rag1‐null recipient mice, naïve CD4 T‐cells from WT and IL2−/− mice (2 million cells each/mouse), along with purified WT Treg cells (0·2 million cells/mouse) to prevent any autoreactive T‐cell responses and to ensure that the generation of pTreg cells was physiological. While the expansion of naive CD4 T‐cells was comparable between WT and IL2−/− donors (Fig. 5c), the IL2−/− compartment showed consistently lower frequencies of pTreg cells (Fig. 5d). Our data showed notable variation between individual recipient Rag1−/− mice in the frequencies of pTreg cells generated from transferred naive CD4 T‐cells within the 2‐month follow‐up period, necessitating caution in interpretation. The transferred naive CD4 T‐cells were tested for FOXP3 expression, and showed no evidence of pre‐existing Treg contamination from either genotype (Fig. S7). However, in each case, pTreg generation efficiency remained consistently less for transferred IL2−/− CD4 T‐cells than for WT donor T‐cells. Together, these data suggested that cell‐autocrine IL2 may provide an added advantage for pTreg generation.
Another possible explanation for the lower peripheral prominence of IL2−/− Treg cells in chimeric mice could be provided by differential survival. We tested this possibility by purifying both WT and IL2−/− Treg cells from the mixed bone marrow chimeras, mixing them in a 1 : 1 ratio and transferring into congenic WT recipients. Three days later, the relative survival of WT and IL2−/− Treg cells was quantified in the recipient mice. Consistently, IL2−/− Treg cells showed poorer survival compared with WT Tregs (Fig. 5e), suggesting that lack of cell‐autocrine IL2 during Treg differentiation altered the survival programming of Treg cells.
Phenotypic and functional similarity of IL2−/− and WT Treg cells
On the background of these data suggesting altered programming of Treg cells in the absence of cell‐autocrine IL2 during Treg generation, we examined if IL2−/− Treg cells showed any gross phenotypic and/or functional alterations. The cellular levels of the lineage‐specific transcription factor FOXP3 are an indicator for the suppressive capacity of Tregs. 29 Both WT and IL2−/− Tregs from chimeric mice (pooled from ratios of 1:2–2:1) were phenotypically equivalent in terms of FOXP3 levels (Fig. 6a). CD25 has been shown to regulate Treg suppressive capacity, notably by limiting T‐cell activation. 30 Again, both WT and IL2−/− Tregs from chimeric mice showed similar CD25 levels (Fig. 6b). Peripheral WT and IL2−/− Treg cells showed similar phospho‐Stat5 levels (Fig. 6c), suggesting that IL2 signalling was equivalent in the peripheral Treg compartment.
Figure 6.
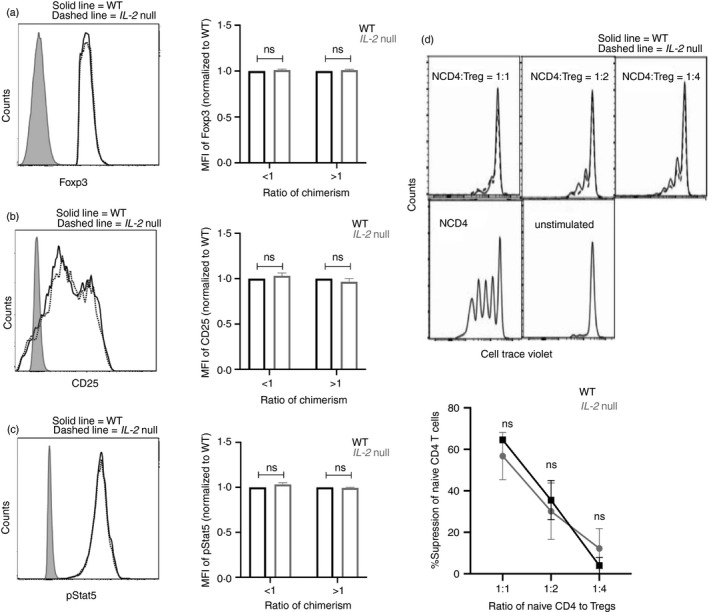
Wild‐type (WT) and interleukin (IL)‐2−/− regulatory T‐cells (Tregs) show phenotypic and functional similarities. (a–c) Tregs (CD4+ CD25+ FOXP3+) from spleen of mixed bone chimeras with WT:IL2−/− chimerism ratios of < 1 (range: 0·2–0·8; n = 11 mice/group) or > 1 (range: 1·1–3; n = 7 mice/group) were analysed by flow cytometry for mean fluorescent intensity of (a) FOXP3, (b) CD25 and (c) phospho‐Stat5. (d) Tregs of both WT and IL2−/− donor partners were sorted from mixed bone marrow chimeras. These sorted Tregs were co‐cultured in different ratios with Cell Trace Violet (CTV)‐labelled naïve CD4 T‐cells from congenic WT mice, stimulated with soluble anti‐mouse CD3 (3 µg/ml) in the presence of gamma‐irradiated (10 Gy) CD90‐ C57BL/6 spleen cells, to assess suppression of proliferation. Data represent three independent experiments.
We also tested the suppressive capacity of WT and IL2−/− Treg cells. CFSE‐labelled WT CD4 T (CD4+ CD25− CD44lo) cells were stimulated with anti‐CD3 with addition of titrating numbers of sort‐purified WT or IL2−/− Tregs (CD4+ CD25+) from the mixed bone marrow chimeras. Both WT and IL2−/− Tregs similarly suppressed the proliferation of WT T‐cells (Fig. 6d).
Effects of cell‐autocrine‐IL2 deficiency on the Treg transcriptome
To compare the differences in gene expression profile due to lack of autocrine IL2 signalling, we analysed the transcriptomes of WT and IL2−/− Treg cells purified from bi‐parental mixed bone marrow chimeras (pooled from ratios of 1:2‐2:1; n = 8). In the analysis, we considered only those genes that were at least twofold upregulated or downregulated (Fig. 7a). In a gene ontology analysis with g:profiler, the gene set downregulated in the IL2−/− cells showed moderate enrichment for the terms ‘TGF‐beta receptor signalling pathway’ and a related term, ‘positive regulation of bone morphogenetic protein (BMP) signalling pathway’ (Fig. 7b). On the other hand, the most prominent gene ontologies that were enriched in the genes upregulated in the IL2−/− cells included ‘T‐cell activation’‐associated genes (Fig. 7c) and ‘antigen processing and presentation by MHC class II’ associated genes.
Figure 7.
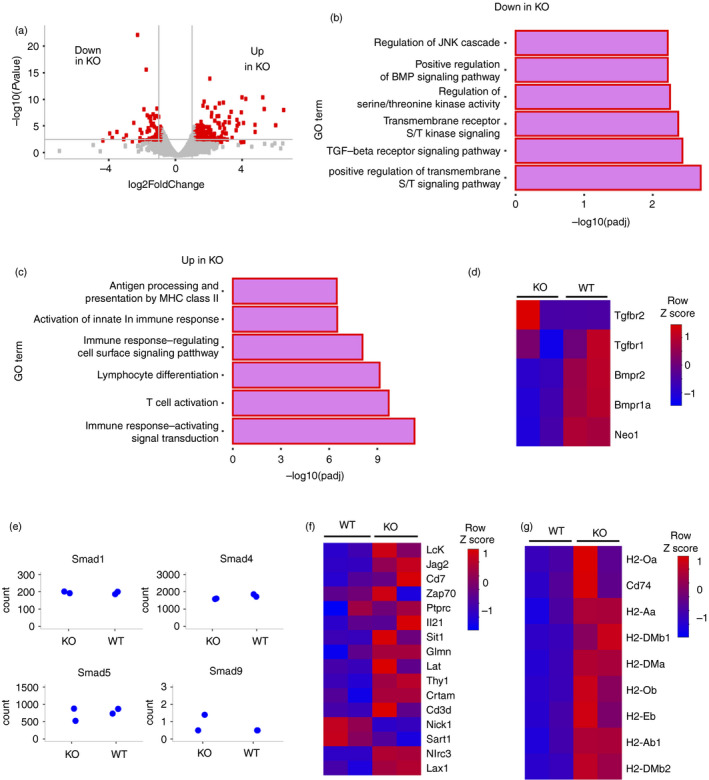
Wild‐type (WT) and interleukin (IL)‐2−/− regulatory T‐cells (Tregs) show differences in their transcriptomes. Treg cells deficient in autocrine IL2 signalling show impaired expression of T‐cell activation and bone morphogenetic protein (BMP) signalling pathway genes. (a) Volcano plot showing differentially expressed genes. Comparison was made with respect to WT Treg cells. Genes upregulated at least twofold in IL2−/− cells are red dots on the right, and the genes that were downregulated are the red dots on the left. (b,c) Bar plots showing relevant gene ontologies enriched among the genes that were downregulated (b) and upregulated (c) in IL2−/− cells. (d) Normalized expression levels of various receptors involved in transforming growth factor (TGF)‐beta signalling pathway. Heatmap is normalized by rows. (e) Plot showing the normalized read counts for various Smad genes involved in the BMP pathway. (f,g) Heatmaps showing normalized expression levels of genes associated with ‘T‐cell activation’ set from MolSigDB (f) and genes part of MHC pathways (g). Heatmap colours are normalized by row Z scores.
It is known that activation of T‐cell receptor (TCR) leads to downregulation of the TGF‐beta pathway in naive T‐cells. 31 TGF‐beta signalling plays a major role in the development and maintenance of Treg cells. 32 BMPs form a class of TGF‐beta family of cytokines that initiate signalling through heterodimeric receptors made up of Bmpr1 and Bmpr2. 33 Apart from TGF‐beta, BMP signalling is also important for Treg development. 34 Moreover, dysregulation of BAMBI, an inhibitor of the TGF‐beta pathway, is known to affect the Th17/Treg ratio in chronic obstructive pulmonary disease. 35 Because the GO terms associated with TGF‐beta signalling and BMP signalling were enriched in the IL2−/− Tregs, we compared the expression levels of the TGF‐beta receptor genes and BMP receptor genes (Fig. 7d). While the BMP receptors Bmpr1, Bmpr2 and Neo1 showed decreased expression in the IL2−/− cells, Tfgr1 and Tfgr2 did not show any such trend, suggesting that BMP pathway could be specifically affected by the lack of autocrine IL2 signalling. However, no differences in the mRNA levels of the downstream effectors of the BMP pathway were seen in the data (Fig. 7e). A comparison of the relative expression levels of a subset of genes from the ‘T‐Cell Activation’ gene set on MolSigDB 36 showed that many of the T‐cell activation associated genes were upregulated in IL2−/− cells compared (Fig. 7f). Interestingly, we also found that the IL2−/− cells also exhibited higher expression levels of MHC class II‐related genes (Fig. 7g). Because Smad activity is regulated by phosphorylation rather than transcript levels, and because BMPs are known to promote Treg differentiation independently of Smad proteins by influencing the JNK pathway, 34 we tested if phospho‐JNK levels were different between WT versus IL2−/− Treg cells in chimeras, and found no differences in preliminary experiments (Fig. S8).
Discussion
Autocrine signalling systems are hard to study because they are self‐sustaining and recursive in nature. In homotypic cell populations, the autocrine versus paracrine components of signals mediated by secreted ligands become difficult to dissect. One such situation of interest is the effect IL2 on T‐cell populations. IL2 is an alpha‐helical cytokine primarily produced by activated T‐cells, and it can bind both to a low‐affinity receptor, IL2Rbeta, expressed constitutively on many cells, 37 as well as to a high‐affinity receptor formed by the addition of IL2Ralpha, or CD25, expressed upon activated T‐cells. 37 Because CD25 expression can be induced by IL2 itself, 38 there is a clear potential for a cell‐intrinsic autocrine signalling loop. This signalling module was initially conceived as an activator of T‐cell proliferation as well as a modulator of T‐cell death 39 and, in fact, there is accumulating evidence that there is likely a cell‐intrinsic autocrine component of this module operative in both CD4 and CD8 T‐cells. 7 , 8 , 21
The more crucial role of IL2 lies in the generation and maintenance of regulatory CD4 T‐cells. 14 , 15 , 16 IL2−/− mice T‐cells undergo uncontrolled T‐cell proliferation with multi‐organ failure due to the lack of Tregs. 14 , 24 , 40 The immune alterations observed in IL2−/− or CD25−/− mice are rectified either upon transfer of the WT Treg cells or when Treg cells are generated in mixed bone marrow chimeras. 15 , 16 , 22 Notably, Treg cells are known to be unable to make IL2 themselves, 39 making cell‐intrinsic autocrine IL2 signalling unlikely, and IL2−/− genotype progenitor cells generate Tregs in mixed bone marrow chimeras using IL2 from WT cells in paracrine fashion, 22 as IL2 signalling is required for Treg generation in the thymus. 14
However, there is recent evidence that developing CD4 T‐cells in the thymus (CD4SP thymocytes), including some cells eventually fated to become Tregs, express substantial amounts of IL2. 41 Peripherally, too, as naive conventional CD4 T‐cells stimulated in a microenvironment rich in TGF‐beta become pTregs, 42 it is plausible that pTregs have had the ability to make IL2 at some point during their differentiation. On this background, our data indicate that there are indeed differential consequences of cell‐intrinsic autocrine versus paracrine IL2 signalling on Treg generation and functionality. For this, we made mixed bone marrow chimeras by titrating the input ratios of haematopoietic cell numbers of WT versus IL2−/− genotypes. With this approach, we could ‘titrate’ the availability of IL2 from the WT sources, so as to dissect the consequences caused by paracrine IL2 versus cell‐autocrine IL2. It would be expected that, as the relative prominence of WT cells decreased, paracrine IL2 availability would become limiting, and cell‐intrinsic autocrine IL2 availability would show differential effects, if any, on WT versus IL2−/− genotype cells.
In the thymus, Tregs appear to be generated via two somewhat different pathways. Thymic Treg precursors may initially express either CD25 but not FOXP3, or vice versa, 23 and there is some evidence that the Tregs from these two pathways may differ in their contribution to autoimmune disease modulation. 23 When we quantified both these thymic precursors as well as CD25+ FOXP3+ thymic Tregs in WT/IL2−/− chimeras, it was evident that WT and IL2−/− genotypes showed no detectable differences in their Treg commitment when WT cells and IL2 were plentiful. However, in WT/IL2‐limiting conditions, the IL2−/− genotype was detectably somewhat poorer in generating all three Treg lineage subsets.
As paracrine IL2 signalling was enough, when WT donor cells were prominent, to generate equivalent thymic Treg frequencies, it would be expected that peripheral Treg frequencies in the chimeras would be equivalent as well. However, this was not the case. IL2−/− Tregs were less prominent at all the ratios of WT/IL2−/− chimerism. This was true in both lymphoid and non‐lymphoid organs, with the exception of tTreg cells in the small intestine. However, when we quantified other subsets of CD4 and CD8 T‐cells in the periphery, it was evident that they were equivalent between the WT and IL2−/− compartments, suggesting that the Treg deficit was specific, although it was not ‘titrating’ as it was observed at all WT:IL2−/− chimerism ratios.
There were three possible explanations for the persistent, albeit modest, reduction in IL2−/− Tregs in the mixed chimeras regardless of WT/IL2−/− ratios. One possibility was that peripherally, pTregs were poorly generated in the absence of cell‐intrinsic autocrine IL2, and that the peripheral Treg deficit of the IL2−/− genotype was restricted to pTregs. Indeed, when we tested if IL2−/− naïve CD4 T‐cells were compromised in differentiating into iTregs (Tregs induced in vivo) in vitro under TGF‐beta influence, or into pTregs in vivo, it was evident that naive CD4 T‐cells from IL2−/− mice formed both iTregs in vitro and pTregs in vivo at lower frequencies, indicating a cell‐intrinsic non‐titrating autocrine role for IL2 in pTreg formation, consistent with previous reports showing that cell‐intrinsic autocrine IL2 was advantageous for the maturation of antigen‐specific CD4 and CD8 T‐cell responses. 7 , 8 , 30
However, it was not true that the persistent peripheral deficit of IL2−/− Tregs in the mixed chimeras was restricted to pTregs. Both pTreg and tTreg IL2−/− populations showed a deficit in the periphery despite tTregs not showing it in the thymus, although these data are limited by our use of Helios expression to distinguish tTregs and pTregs, as Helios does not necessarily provide a reliable distinction. 26 , 27 , 28 Nonetheless, it was possible that all Tregs of IL2−/− origin behaved differently in the periphery, which would suggest that cell‐intrinsic IL2 signalling may be non‐redundantly required for the programming of such cellular behaviour.
When we tested for peripheral Treg phenotype and function, it was clear that, despite the difference in frequencies of WT versus IL2−/− Tregs in the periphery, both Treg groups showed similar levels of FOXP3, CD25 and pStat5. They also showed comparable capacities to suppress naive CD4 T‐cell proliferation in vitro. However, when survival was specifically assayed by adoptive transfer of Tregs, IL2−/− Tregs showed poorer survival, consistent with their reduced steady‐state frequencies in the mixed bone marrow chimeras. While it has been reported that Tregs receiving low IL2 signalling show compromised survival, it must be noted that we have not observed any differences in pSTAT5 levels between WT and IL2−/− Tregs.
We, therefore, examined if there were global differences in the programming of peripheral WT and IL2−/− Tregs, by carrying out an RNA‐seq analysis. A comparison of the transcriptomes of WT Treg cells and IL2−/− Treg cells lacking autocrine IL2 signalling showed a number of interesting patterns. Curiously, our data show that expression levels of many of the genes in MHC class II‐related pathways were upregulated in IL2−/− Treg cells. The implications of this observation remain unclear.
More interestingly, our RNA‐seq analysis showed that the IL2−/− cells had higher expression of T‐cell activation associated genes, while receptors for the BMP signalling pathway were downregulated in them. It is known that high TCR activation leads to downregulation of TGF‐beta signalling in naive T‐cells. 31 Activated T‐cells from SLE patients exhibit lower levels of Tgfbr1 expression, reiterating the importance of this interaction between T‐cell activation and TGF‐beta signalling pathways. 31 It is also well understood that TGF‐beta signalling is important for the development and function of Treg cells. 43 Apart from Tgfbr1, BMP receptors were also downregulated in IL2−/− Tregs. BMP signalling is also known to enhance Treg development synergistically with TGF‐beta. 34 Our data did not show any differences in the mRNA expression of Smads 1, 4, 5 and 9, which are important for BMP signalling, perhaps related to the fact that Smad activity is regulated by phosphorylation rather than transcript levels. In fact, BMPs are known to promote Treg differentiation independently of Smad proteins by influencing the JNK pathway 34 and, interestingly, our data also showed that JNK pathway genes are enriched in the downregulated gene set in IL2−/− cells.
Our data may be plausibly interpreted to suggest that the addition of cell‐intrinsic autocrine IL2 signalling may allow somewhat lower levels of TCR signalling to permit Treg commitment. This in turn may lead to both the commitment of a higher proportion of cells to the Treg lineage, and yet to the maintenance of somewhat higher TGF‐beta signalling in the WT genotype. There is known to be cross‐talk for Treg differentiation and survival between the IL2‐driven and TGF‐beta‐driven signalling pathways in thymic Tregs as well, 32 and the balance may be modified by autocrine‐paracrine versus paracrine‐alone provision of IL2.
Thus, our data indicate a significant role for cell‐intrinsic autocrine IL2 in the generation and maintenance of Treg populations. The genesis and consequences of this autocrine loop in immune homeostasis and disease are likely to be issues of significant interest.
Disclosure
SR is a non‐executive director of Ahammune Biosciences Private Limited, Pune, India, and a member of the scientific advisory boards of Curadev Pharma Private Limited, NOIDA, India, and Mynvax Private Limited, Bangalore, India. Other authors have no competing interests to declare.
Author contributions
ASC planned and performed critical experiments, analysed data and wrote the manuscript. JKK planned and performed critical experiments, and analysed data. AD, SG and DU helped in planning, performing and analysing some key experiments critical for the study. GAA, VB, AG and SR conceived the questions and approach, planned experiments, analysed data, wrote the manuscript, and share senior authorship. All authors read and approved the final manuscript.
Supporting information
Figure S1. Thymocytes from mixed bone marrow chimeras were isolated and analysed by flow cytometry. Bone marrow chimeras were made with a wide range of WT:IL2−/− bone marrow cells.
Figure S2 . Thymocytes from mixed bone marrow chimeras were isolated and analysed by flow cytometry. Bone marrow chimeras were made with a wide range of WT:IL2−/− bone marrow cells. WT:IL2−/− donor genotype ratios for DP cells (CD4+ CD8+) were calculated in each individual recipient mouse and plotted versus output chimerism in each recipient mouse.
Figure S3 . Splenic cells from WT:IL2−/− mixed bone marrow chimeras were isolated and analysed by flow cytometry.
Figure S4 . Splenic cells from mixed bone marrow chimeras were isolated and analysed by flow cytometry.
Figure S5 . Splenic cells from WT:IL2−/− mixed bone marrow chimeras were isolated and analysed by flow cytometry.
Figure S6 . Naïve CD4 T‐cells (CD4+ CD25− CD44lo) from both WT and IL2−/− (KO) donor genotypes were isolated from mixed bone marrow chimeras and mixed in different ratios as shown, and stimulated with plate‐coated anti‐CD3+anti‐CD28 and TGF‐beta in the presence of exogenous IL2.
Figure S7 . Naïve CD4 T‐cells (CD4+ CD25− CD44lo) from both WT and IL2−/− donor partners were isolated from mixed bone marrow chimeras for transfer for in vivo pTreg generation.
Figure S8 . Tregs (CD4+ CD25+ FOXP3+) from spleen of mixed bone chimeras were analysed by flow cytometry for mean fluorescent intensity of phospho‐JNK as shown.
Acknowledgements
The authors thank Mr Inder Jit Singh for help with animal maintenance, and Mr Rajesh Kumar for extensive help with electronic cell sorting. The study was supported in part by grants from the Department of Biotechnology (to AG # BT/PR12849/MED/15/35/2009; to VB # BT/PR14420/Med/29/213/2010; and to SR # BT/PR‐14592/BRB/10/858/2010), and from the Department of Science and Technology, Government of India (to VB # SR/SO/HS‐0005/2011 and #EMR/2015/001074; to SR # SB/SO/HS/210/2013). The National Institute of Immunology is supported by the Department of Biotechnology, Government of India.
Data Availability Statement
The RNA‐seq data generated and analysed in the manuscript have been made available by submission to the Geo repository (accession number awaited).
References
- 1. Youk H, Lim WA. Secreting and sensing the same molecule allows cells to achieve versatile social behaviors. Science 2014; 343:1 242 782. [DOI] [PMC free article] [PubMed] [Google Scholar]
- 2. Youk H, Lim WA. Sending mixed messages for cell population control. Cell 2014; 158:973–5. [DOI] [PMC free article] [PubMed] [Google Scholar]
- 3. De Souza DP, Achuthan A, Lee MKS, Binger KJ, Lee M‐C, Davidson S et al Autocrine IFN‐I inhibits isocitrate dehydrogenase in the TCA cycle of LPS‐stimulated macrophages. J Clin Invest 2019; 129:4239–44. [DOI] [PMC free article] [PubMed] [Google Scholar]
- 4. Gonzalez‐Junca A, Driscoll KE, Pellicciotta I, Du S, Lo CH, Roy R et al Autocrine TGFβ is a survival factor for monocytes and drives immunosuppressive lineage commitment. Cancer Immunol Res 2019; 7:306–20. [DOI] [PMC free article] [PubMed] [Google Scholar]
- 5. Luo X, Zhou W, Tao Y, Wang X, Li D. TLR4 activation promotes the secretion of IL‐8 which enhances the invasion and proliferation of endometrial stromal cells in an autocrine manner via the FAK signal pathway. Am J Reprod Immunol 2015; 74:467–79. [DOI] [PubMed] [Google Scholar]
- 6. Ogawa H, Mukai K, Kawano Y, Minegishi Y, Karasuyama H. Th2‐inducing cytokines IL‐4 and IL‐33 synergistically elicit the expression of transmembrane TNF‐α on macrophages through the autocrine action of IL‐6. Biochem Biophys Res Commun 2012; 420:114–8. [DOI] [PubMed] [Google Scholar]
- 7. Redeker A, Welten SPM, Baert MRM, Vloemans SA, Tiemessen MM, Staal FJT et al The quantity of autocrine IL‐2 governs the expansion potential of CD8+ T cells. J Immunol 2015; 195:4792–801. [DOI] [PubMed] [Google Scholar]
- 8. McKinstry KK, Strutt TM, Bautista B, Zhang W, Kuang Y, Cooper AM et al Effector CD4 T‐cell transition to memory requires late cognate interactions that induce autocrine IL‐2. Nat Commun 2014; 5:5377. [DOI] [PMC free article] [PubMed] [Google Scholar]
- 9. Wood MW, Breitschwerdt EB, Gookin JL. Autocrine effects of Interleukin‐6 mediate acute‐phase proinflammatory and tissue‐reparative transcriptional responses of canine bladder mucosa. Infect Immun 2011; 79:708–15. [DOI] [PMC free article] [PubMed] [Google Scholar]
- 10. Paliard X, de Waal Malefijt R, Yssel H, Blanchard D, Chrétien I, Abrams J et al. Simultaneous production of IL‐2, IL‐4, and IFN‐gamma by activated human CD4+ and CD8+ T cell clones. J Immunol 1988; 141:849–55. [PubMed] [Google Scholar]
- 11. Depper JM, Leonard WJ, Krönke M, Noguchi PD, Cunningham RE, Waldmann TA, et al Regulation of interleukin 2 receptor expression: effects of phorbol diester, phospholipase C, and reexposure to lectin or antigen. J Immunol 1984; 133:3054–61. [PubMed] [Google Scholar]
- 12. Leonard WJ, Krönke M, Peffer NJ, Depper JM, Greene WC. Interleukin 2 receptor gene expression in normal human T lymphocytes. Proc Natl Acad Sci USA 1985; 82:6281–5. [DOI] [PMC free article] [PubMed] [Google Scholar]
- 13. Depper JM, Leonard WJ, Drogula C, Krönke M, Waldmann TA, Greene WC. Interleukin 2 (IL‐2) augments transcription of the IL‐2 receptor gene. Proc Natl Acad Sci USA 1985; 82:4230–4. [DOI] [PMC free article] [PubMed] [Google Scholar]
- 14. Malek TR, Yu A, Vincek V, Scibelli P, Kong L. CD4 regulatory T cells prevent lethal autoimmunity in IL‐2Rbeta‐deficient mice. Implications for the nonredundant function of IL‐2. Immunity 2002; 17:167–78. [DOI] [PubMed] [Google Scholar]
- 15. Wolf M, Schimpl A, Hünig T. Control of T cell hyperactivation in IL‐2‐deficient mice by CD4(+)CD25(‐) and CD4(+)CD25(+) T cells: evidence for two distinct regulatory mechanisms. Eur J Immunol 2001; 31:1637–45. [DOI] [PubMed] [Google Scholar]
- 16. Suzuki H, Zhou YW, Kato M, Mak TW, Nakashima I. Normal regulatory α/β T cells effectively eliminate abnormally activated T cells lacking the interleukin 2 receptor β in vivo. J Exp Med 1999; 190:1561–72. [DOI] [PMC free article] [PubMed] [Google Scholar]
- 17. Van Parijs L, Biuckians A, Ibragimov A, Alt FW, Willerford DM, Abbas AK. Functional responses and apoptosis of CD25 (IL‐2R alpha)‐deficient T cells expressing a transgenic antigen receptor. J Immunol 1997; 158:3738–45. [PubMed] [Google Scholar]
- 18. Refaeli Y, Van Parijs L, London CA, Tschopp J, Abbas AK. Biochemical mechanisms of IL‐2‐regulated Fas‐mediated T cell apoptosis. Immunity 1998; 8:615–23. [DOI] [PubMed] [Google Scholar]
- 19. Lenardo MJ. lnterleukin‐2 programs mouse αβ T lymphocytes for apoptosis. Nature 1991; 353:858–61. [DOI] [PubMed] [Google Scholar]
- 20. Long M, Adler AJ. Cutting edge: paracrine, but not autocrine, IL‐2 signaling is sustained during early antiviral CD4 T cell response. J Immunol 2006; 177:4257–61. [DOI] [PMC free article] [PubMed] [Google Scholar]
- 21. Kalia V, Sarkar S. Regulation of effector and memory CD8 T cell differentiation by IL‐2—a balancing act. Front Immunol 2018; 9:2987. [DOI] [PMC free article] [PubMed] [Google Scholar]
- 22. Almeida ARM, Legrand N, Papiernik M, Freitas AA, Willerford DM, Abbas AK. Homeostasis of peripheral CD4+ T cells: IL‐2R alpha and IL‐2 shape a population of regulatory cells that controls CD4+ T cell numbers. J Immunol 2002; 169:4850–60. [DOI] [PubMed] [Google Scholar]
- 23. Owen DL, Mahmud SA, Sjaastad LE, Williams JB, Spanier JA, Simeonov DR et al Thymic regulatory T cells arise via two distinct developmental programs. Nat Immunol 2019; 20:195–205. [DOI] [PMC free article] [PubMed] [Google Scholar]
- 24. Chastagner P, Reddy J, Thèze J, Kumano K, Saito Y, Iwamoto I. Lymphoadenopathy in IL‐2‐deficient mice: further characterization and overexpression of the antiapoptotic molecule cellular FLIP. J Immunol 2002; 169:3644–51. [DOI] [PubMed] [Google Scholar]
- 25. Lathrop SK, Bloom SM, Rao SM, Nutsch K, Lio C‐W, Santacruz N et al Peripheral education of the immune system by colonic commensal microbiota. Nature 2011; 478:250–4. [DOI] [PMC free article] [PubMed] [Google Scholar]
- 26. Thornton AM, Korty PE, Tran DQ, Wohlfert EA, Murray PE, Belkaid Y et al Expression of Helios, an Ikaros transcription factor family member, differentiates thymic‐derived from peripherally induced FOXP3 + T regulatory cells. J Immunol 2010; 184:3433–41. [DOI] [PMC free article] [PubMed] [Google Scholar]
- 27. Singh K, Hjort M, Thorvaldson L, Sandler S. Concomitant analysis of Helios and Neuropilin‐1 as a marker to detect thymic derived regulatory T cells in naïve mice. Sci Rep 2015; 5:7767. [DOI] [PMC free article] [PubMed] [Google Scholar]
- 28. Szurek E, Cebula A, Wojciech L, Pietrzak M, Rempala G, Kisielow P et al Differences in expression level of Helios and Neuropilin‐1 do not distinguish thymus‐derived from extrathymically‐induced CD4+FOXP3+ regulatory T cells. PLoS ONE 2015; 10:e0141161. [DOI] [PMC free article] [PubMed] [Google Scholar]
- 29. Valencia X, Stephens G, Goldbach‐Mansky R, Wilson M, Shevach EM, Lipsky PE. TNF downmodulates the function of human CD4+CD25hi T‐regulatory cells. Blood 2006; 108:253–61. [DOI] [PMC free article] [PubMed] [Google Scholar]
- 30. Chinen T, Kannan AK, Levine AG, Fan X, Klein U, Zheng Y et al An essential role for the IL‐2 receptor in Treg cell function. Nat Immunol 2016; 17:1322–33. [DOI] [PMC free article] [PubMed] [Google Scholar]
- 31. Tu E, Chia CPZ, Chen W, Zhang D, Park SA, Jin W et al T cell receptor‐regulated TGF‐β Type I receptor expression determines T cell quiescence and activation. Immunity 2018; 48(4):745–59.e6. [DOI] [PMC free article] [PubMed] [Google Scholar]
- 32. Chen W, Konkel JE. Development of thymic FOXP3(+) regulatory T cells: TGF‐β matters. Eur J Immunol 2015; 45:958–65. [DOI] [PMC free article] [PubMed] [Google Scholar]
- 33. Pickup MW, Owens P, Moses HL. TGF‐β, bone morphogenetic protein, and activin signaling and the tumor microenvironment. Cold Spring Harb Perspect Biol 2017; 9:a022285. [DOI] [PMC free article] [PubMed] [Google Scholar]
- 34. Lu L, Ma J, Wang X, Wang J, Zhang F, Yu J et al Synergistic effect of TGF‐β superfamily members on the induction of FOXP3+ Treg. Eur J Immunol 2009; 40:142–52. [DOI] [PMC free article] [PubMed] [Google Scholar]
- 35. Zhang J‐C, Chen G, Chen L, Meng Z‐J, Xiong X‐Z, Liu H‐J et al TGF‐β/BAMBI pathway dysfunction contributes to peripheral Th17/Treg imbalance in chronic obstructive pulmonary disease. Sci Rep 2016; 6:31 911. [DOI] [PMC free article] [PubMed] [Google Scholar]
- 36. Subramanian A, Tamayo P, Mootha VK, Mukherjee S, Ebert BL, Gillette MA et al Gene set enrichment analysis: a knowledge‐based approach for interpreting genome‐wide expression profiles. Proc Natl Acad Sci USA 2005; 102:15 545–50. [DOI] [PMC free article] [PubMed] [Google Scholar]
- 37. Liao W, Lin J‐X, Leonard WJ. Interleukin‐2 at the crossroads of effector responses, tolerance, and immunotherapy. Immunity 2013; 38:13–25. [DOI] [PMC free article] [PubMed] [Google Scholar]
- 38. Sereti I, Gea‐Banacloche J, Kan M‐Y, Hallahan CW, Lane HC. Interleukin 2 leads to dose‐dependent expression of the alpha chain of the IL‐2 receptor on CD25‐Negative T lymphocytes in the absence of exogenous antigenic stimulation. Clin Immunol 2000; 97:266–76. [DOI] [PubMed] [Google Scholar]
- 39. Nelson BH. IL‐2, regulatory T cells, and tolerance. J Immunol 2004; 172:3983–8. [DOI] [PubMed] [Google Scholar]
- 40. Sadlack B, Löhler J, Schorle H, Klebb G, Haber H, Sickel E et al Generalized autoimmune disease in interleukin‐2‐deficient mice is triggered by an uncontrolled activation and proliferation of CD4+ T cells. Eur J Immunol 1995; 25:3053–9. [DOI] [PubMed] [Google Scholar]
- 41. Hemmers S, Schizas M, Azizi E, Dikiy S, Zhong Y, Feng Y et al IL‐2 production by self‐reactive CD4 thymocytes scales regulatory T cell generation in the thymus. J Exp Med 216:2466–78. [DOI] [PMC free article] [PubMed] [Google Scholar]
- 42. Kanamori M, Nakatsukasa H, Okada M, Lu Q, Yoshimura A. Induced regulatory T cells: their development, stability, and applications. Trends Immunol 2016; 37:803–11. [DOI] [PubMed] [Google Scholar]
- 43. Wan YY, Flavell RA. Regulatory T‐cell functions are subverted and converted owing to attenuated FOXP3 expression. Nature 2007; 445:766–70. [DOI] [PubMed] [Google Scholar]
Associated Data
This section collects any data citations, data availability statements, or supplementary materials included in this article.
Supplementary Materials
Figure S1. Thymocytes from mixed bone marrow chimeras were isolated and analysed by flow cytometry. Bone marrow chimeras were made with a wide range of WT:IL2−/− bone marrow cells.
Figure S2 . Thymocytes from mixed bone marrow chimeras were isolated and analysed by flow cytometry. Bone marrow chimeras were made with a wide range of WT:IL2−/− bone marrow cells. WT:IL2−/− donor genotype ratios for DP cells (CD4+ CD8+) were calculated in each individual recipient mouse and plotted versus output chimerism in each recipient mouse.
Figure S3 . Splenic cells from WT:IL2−/− mixed bone marrow chimeras were isolated and analysed by flow cytometry.
Figure S4 . Splenic cells from mixed bone marrow chimeras were isolated and analysed by flow cytometry.
Figure S5 . Splenic cells from WT:IL2−/− mixed bone marrow chimeras were isolated and analysed by flow cytometry.
Figure S6 . Naïve CD4 T‐cells (CD4+ CD25− CD44lo) from both WT and IL2−/− (KO) donor genotypes were isolated from mixed bone marrow chimeras and mixed in different ratios as shown, and stimulated with plate‐coated anti‐CD3+anti‐CD28 and TGF‐beta in the presence of exogenous IL2.
Figure S7 . Naïve CD4 T‐cells (CD4+ CD25− CD44lo) from both WT and IL2−/− donor partners were isolated from mixed bone marrow chimeras for transfer for in vivo pTreg generation.
Figure S8 . Tregs (CD4+ CD25+ FOXP3+) from spleen of mixed bone chimeras were analysed by flow cytometry for mean fluorescent intensity of phospho‐JNK as shown.
Data Availability Statement
The RNA‐seq data generated and analysed in the manuscript have been made available by submission to the Geo repository (accession number awaited).