

Abstract
Mutations in ARID1A, a subunit of the SWI/SNF chromatin remodeling complex, are the most common alterations of the SWI/SNF complex in estrogen-receptor-positive (ER+) breast cancer. We identify that ARID1A inactivating mutations are present at a high frequency in advanced endocrine-resistant ER+ breast cancer. An epigenome CRISPR-CAS9 knockout (KO) screen identifies ARID1A as the top candidate whose loss determines resistance to the eR degrader fulvestrant. ARID1A inactivation in cells and in patients leads to resistance to ER degraders by facilitating a switch from ER-dependent luminal cells to ER-independent basal-like cells. Cellular plasticity is mediated by loss of ARIDIA-dependent SWI/SNF complex targeting to genomic sites of the luminal lineage-determining transcription factors including ER, forkhead box protein A1 (FOXA1) and GATA-binding factor 3 (GATA3). ARID1A also regulates genome-wide ER-FOXA1 chromatin interactions and ER-dependent transcription. Altogether, we uncover a critical role for ARID1A in maintaining luminal cell identity and endocrine therapeutic response in ER+ breast cancer.
Breast cancer is divided into molecularly distinct subtypes based on the expression of ER, progesterone receptor and/or the amplification of ERBB2 (also known as HER2) that dictate clinical outcomes and therapy choice1,2. Genomic characterization efforts have established the landscape of genomic alterations that typify each class of primary disease, namely ER+, HER2+ and basal-like tumors that are negative for these receptors and HER2 (refs.3–10). ER+ tumors, also referred to as luminal breast cancers, represent over 70% of breast cancers. In these tumors, ER is the driving transcription factor whose target genes control proliferation and endocrine response; these cancers are treated with hormone therapy11. Despite the success of endocrine therapies, resistance to these agents develops in the majority of patients with metastatic disease; thus, a better understanding of the mechanisms of endocrine resistance is required. Important insights into the mechanisms of endocrine resistance have been gained with the identification of activating mutations in ESR1 (the gene encoding ER) in approximately 18% of tumors with acquired resistance to aromatase inhibitors12,13. However, the mechanisms of resistance in the remaining 82% of cases are largely unknown.
Among the genomic alterations observed in ER+ breast cancer, mutations are often found in genes encoding the subunits of the SWI/SNF chromatin remodeling complexes, with ARID1A being the most frequently mutated SWI/SNF subunit gene14,15. The SWI/SNF multiunit complexes remodel the chromatin structure in an ATP-dependent manner to modulate transcription and enable transcription factor binding16–20. The ARID family of subunits is thought to potentiate SWI/SNF complex activity via recruitment of the ATPase catalytic module21.
Our interest in studying the role of ARID1A in influencing resistance to endocrine therapies came from two sets of independent observations. First, we have reported that mutations in genes encoding the subunits of the SWI/SNF complexes, including ARID1A, are enriched in the endocrine-resistant metastatic setting, suggesting that they may play a role in resistance to endocrine therapy22. Second, a CRISPR-CAS9-based KO screen found that loss of ARID1A is a top determinant of endocrine resistance. This set of observations in patients’ tumors and in the CRISPR screen prompted us to explore the mechanisms whereby disruption of ARID 1A may influence breast cancer progression and/or endocrine therapy resistance.
Results
ARID1A loss mediates endocrine resistance.
We first confirmed that ARID1A is the most frequently mutated gene in the SWI/SNF complex in ER+ breast cancer, according to the analysis of an internal targeted exome sequencing platform (Memorial Sloan Kettering-Integrated Mutation Profiling of Actionable Cancer Targets (MSK-IMPACT))23 and the datasets of The Cancer Genome Atlas (TCGA) and Molecular Taxonomy of Breast Cancer International Consortium (Extended Data Fig. 1a,b). Moreover, reanalysis of our recent work22 demonstrated that ARID1A alterations are enriched in the post-endocrine therapy metastatic setting compared to treatment-naive primary tumors (Fig. 1a).
Fig. 1 |. ARID1A loss mediates endocrine therapy resistance.
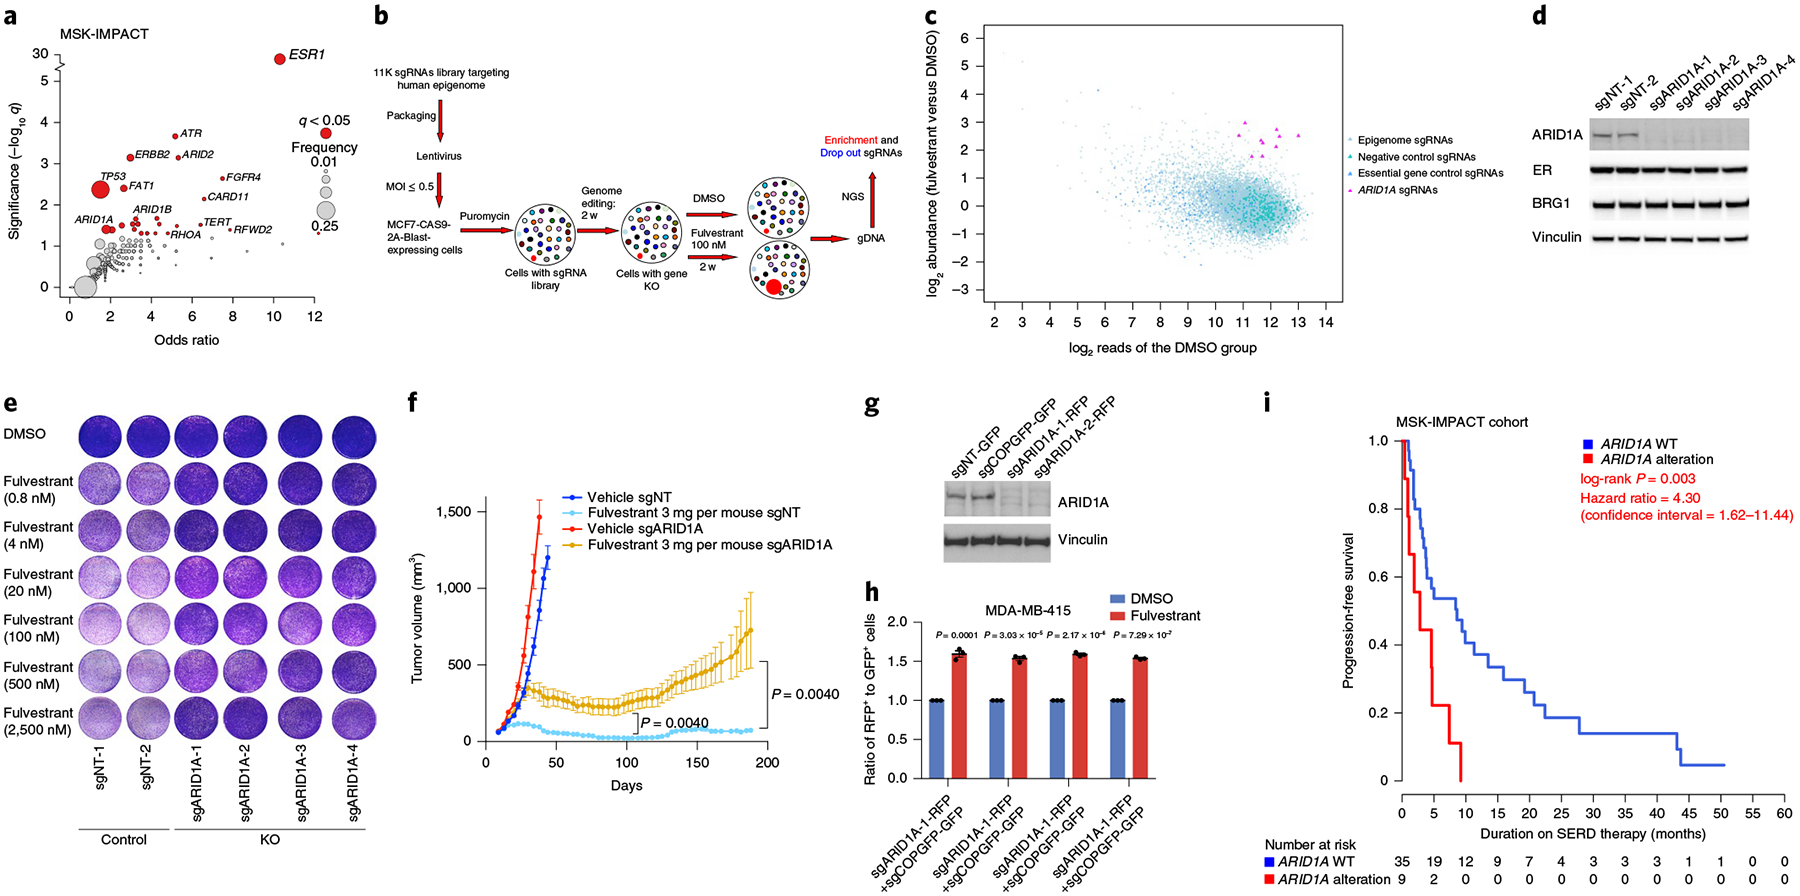
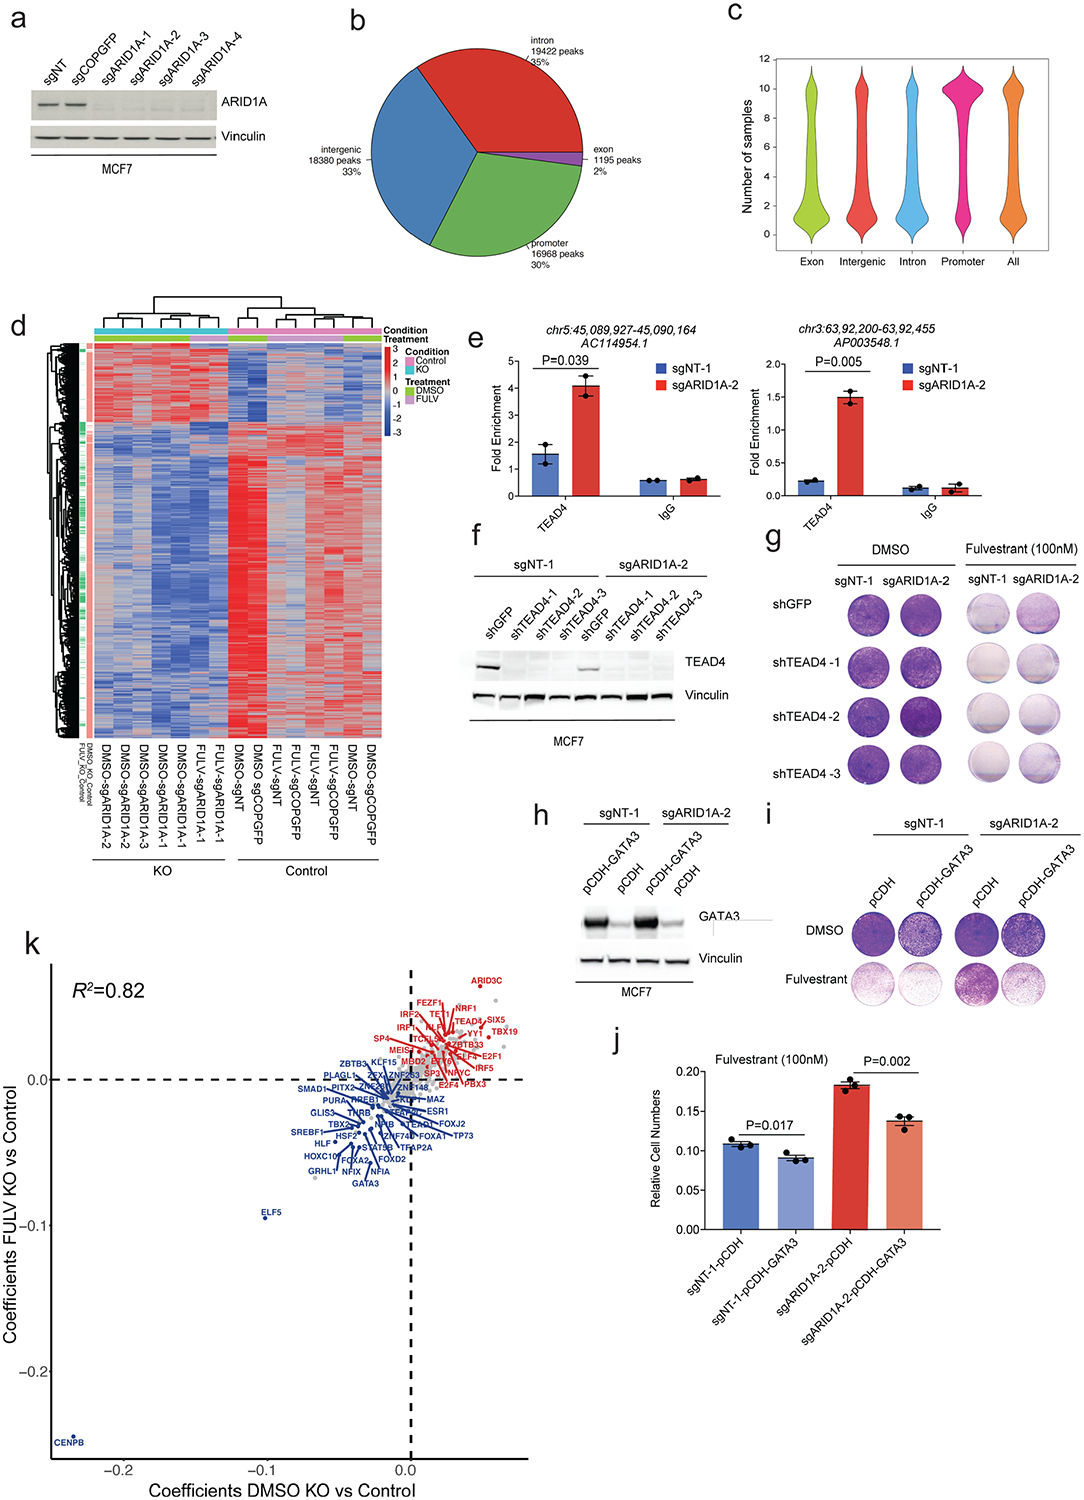
a, Gene-level enrichment analysis of mutations in genes that are significantly more common in metastases compared to primary tumors (q<0.05) in ER+/HER2− breast cancer (MSK primary = 739; TCGA primary = 579; MSK metastatic = 762). b, Workflow of the epigenome-wide CRISPR-CAS9 screen on treatment with fulvestrant. MOI, multiplicity of infection. NGS, next-generation sequencing. c, Sequencing data analysis demonstrating ARID1A sgRNAs (10 out of 12 sgRNAs targeting ARID1A) to mediate fulvestrant resistance. d, Cropped western blot with the indicated antibodies in MCF7 cells expressing sgNT as controls and distinct sgRNAs targeting ARID1A. e, In vitro proliferation assay of MCF7 cells expressing sgNT-1 and sgNT-2 as controls and four sgRNAs against ARID1A on DMSO or fulvestrant treatment (n = 3 independent experiments). f, In vivo xenografts of MCF7 ARID1A KO and control cells treated with vehicle or fulvestrant (3 mg per mouse per week) for 13 weeks. Error bars, s.e.m., n = 5 per group, center values represent the means. P values were calculated using a two-sided Mann-Whitney U-test. g, Cropped western blot with the indicated antibodies of MDA-MB-415 cells expressing sgNT-GFP, sgCOPGFP-GFP, sgARID1A-1-RFP and sgARID1A-2-RFP. h, Ratio of RFP+ ARID1A KO cells (sgARID1A-1 or sgARID1A-2) to GFP+ control cells (sgNT-GFP or sgCOPGFP-GFP) on DMSO or fulvestrant administration (100 nM) for 14d as measured by flow cytometry. P values are shown. A two-sided Student’st-test was used. The error bars indicate the mean±s.e.m.; n = 3 biologically independent samples; the center values are the means. i, Kaplan-Meier curves displaying the progression-free survival of patients receiving SERD therapy based on ARID1A alterations from the MSK-IMPACT cohort. Pvalue as indicated. A log-rank test was used.
In parallel, we conducted a CRISPR-CAS9 KO screen in MCF7 breast cancer cells using an 11K single guide RNA (sgRNA) library (Supplementary Table 1) targeting the human epigenome (along with CAS9) in cells treated with fulvestrant, an ER degrader that is standard of care for ER+ breast cancer patients (Fig. 1b). Ten of twelve distinct sgRNAs targeting ARID1A were among the top 3% enriched sgRNAs in the setting of fulvestrant exposure, such that ARID1A was the top candidate in the screen whose loss conferred fulvestrant resistance (Fig. 1c). Additional candidates found include other subunits of the SWI/SNF complex, SMARCB1 and SMARCE1, also members of the core functional module24 (Supplementary Table 2). Since ARID1A was the top candidate in the CRISPR screen and ARID1A-inactivating mutations are enriched in advanced endocrine-resistant ER+ breast cancer, we focused our study on the role of ARID1A. To validate these findings, we knocked out ARID1A completely in the whole population of MCF7 cells by using four distinct guide RNAs (gRNAs) (Fig. 1d). ARID1A KO had no effect on the expression levels of the ER protein or the catalytic subunit of the SWI/SNF complex, BRG1 (Fig. 1d). We performed in vitro cell proliferation assays in cells transduced with four distinct gRNAs targeting ARID1A. ARID1A disruption by itself did not affect proliferation (Extended Data Fig. 2a). Concomitantly, cell cycle analysis by FACS of MCF7 cells grown in complete medium, or serum-free medium that synchronizes cells to the G1 phase, demonstrated that ARID1A KO did not alter cell cycle transition (Extended Data Fig. 2b). However, in vitro cell proliferation assays and crystal violet assays showed increased growth on fulvestrant treatment after ARID1A KO (Fig. 1e and Extended Data Fig. 2c). We confirmed these findings with another ER degrader, GDC-0927 (Extended Data Fig. 2d). Moreover, ARID1A loss in MCF7 cells, compared with control cells, resulted in increased proliferation of cells under estrogen-deprived conditions, suggesting an estrogen-independent growth advantage of these cells after ARID1A loss (Extended Data Fig. 2e,f). In the in vivo setting, orthotopic xenografts of ARID1A KO MCF7 cells showed a growth advantage over control cells on fulvestrant treatment (Fig. 1f). The ARID1A KO tumors displayed stable disease, as compared with control cells, which showed tumor eradication on fulvestrant treatment up to 6 months (Fig. 1f). ARID1A KO in MDA-MB-415 breast cancer cells (Fig. 1g) also led to resistance to fulvestrant (Fig. 1h); KO of additional SWI/SNF subunits identified in the screen, namely SMARCB1 and SMARCE1, by using five distinct gRNAs (Extended Data Fig. 2g), also resulted in fulvestrant resistance in MCF7 cells (Extended Data Fig. 2h,i).
Given the role of ARID1A loss in mediating resistance to ER degraders, we next studied whether ARID1A alterations in patients were associated with therapy resistance to selective ER degraders (SERDs). Our cohort consisted of a total of 2,752 tumors from 2,475 breast cancers where prospective sequencing using the MSK-IMPACT platform23 was performed and for which detailed clinical information was available. Of note, the clinico-genomic analyses of 1,918 tumors from 1,756 breast cancer patients were part of the study by Razavi et al.22. Notably, patients with tumors harboring ARID1A alterations had a significantly shorter progression-free survival on SERDs compared with wild-type (WT) tumors, with a median progression-free survival of 2.8 versus 5.7 months (Fig. 1i). Taken together, these findings suggest a role for ARID1A in endocrine therapy resistance prompting mechanistic delineation.
ARID1A regulates chromatin accessibility in breast cancer.
Since the SWI/SNF complex regulates chromatin accessibility in coordination with transcription factors, we investigated the chromatin landscape of breast cancer on ablation of ARID1A and treatment with fulvestrant. We performed assay for transposase-accessible chromatin using sequencing (ATAC-seq) on MCF7 breast cancer cells expressing three distinct sgARID1As or two control sgRNAs in dimethylsulfoxide (DMSO)- or fulvestrant-treated cells (Extended Data Fig. 3a). We obtained a total atlas of 59,000 peaks, with 33% of peaks found in intergenic regions, approximately 30% found in promoter regions and 35% in intron regions (Extended Data Fig. 3b,c). We observed thousands of sites with significantly decreased accessibility or increased accessibility after ARID1A loss (Fig. 2a,b and Extended Data Fig. 3d), with the majority of sites losing accessibility (Fig. 2a,b and Extended Data Fig. 3d). Notably, peaks that were differentially accessible on ARID1A KO in the fulvestrant setting were similar to the differentially accessible peaks on ARID1A KO in DMSO-treated cells (Extended Data Fig. 3d). These data suggest that ARID1A loss alters the chromatin accessibility of breast cancer epigenome independently of fulvestrant treatment. The majority of peaks were located in intergenic regions or introns, indicative of enhancers, while promoters displayed fewer dynamic peaks (Fig. 2b,c). In addition, when we characterized the histone modification associated with active cz’s-regulatory elements (H3K27ac) at differentially accessible sites, we observed a significant reduction of H3K27ac levels in sites that lost chromatin accessibility on ARID1A loss (Fig. 2d,e). Since H3K27ac distinguishes active from poised and inactive enhancers, these data suggest that ARID1A loss may affect enhancer utilization in breast cancer.
Fig. 2 |. ARID1A impacts the accessibility of several transcription factor motifs involved in luminal differentiation.
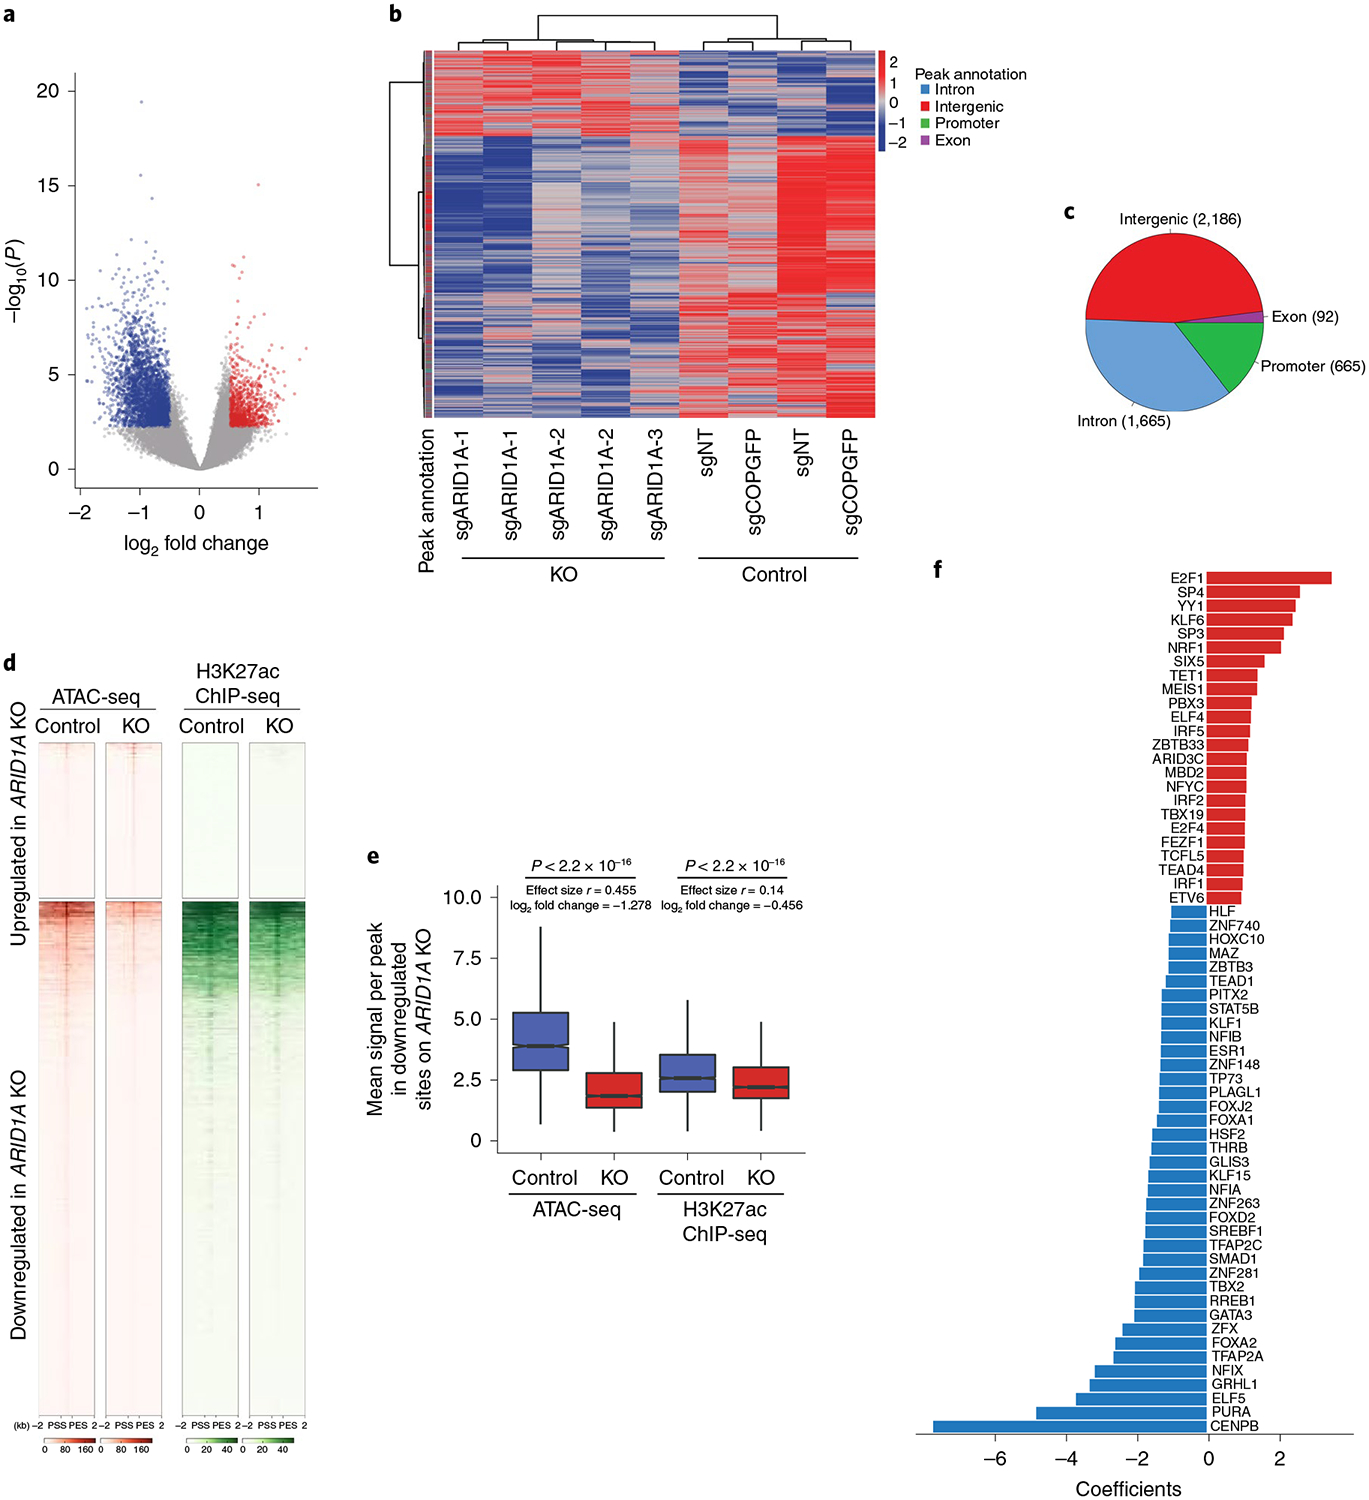
a, Volcano plot of ATAC-seq assays in control and ARID1A KO cells. The x axis shows the log2 fold change and the y axis shows the −log10(P). The red dots represent a significant increase in chromatin accessibility (1,701 sites) whereas the green dots represent a significant decrease in chromatin accessibility (3,537 sites) (absolute log2 fold change >0.5 and Benjamini-Hochberg-adjusted P<0.05). b, Heatmap of significantly differentially accessible sites in MCF7 cells expressing three distinct sgRNAs against ARID1A and two control sgRNAs (4,608 differential peaks; log2 fold change > 0.5 and Benjamini-Hochberg-adjusted P< 0.05). c, Pie chart showing the distributions of differential peaks to various genic parts. d, Heatmap of H3K27ac ChlP-seq in the differentially accessible sites obtained by ATAC-seq on ARID1A loss (±2-kb regions centered at the peak summit). PSS, peak start site; PES, peak end site. e, Box plot showing the mean signal across peaks that lost chromatin accessibility on ARID1A KO. Also shown is the H3K27ac ChlP-seq differential binding in control and ARID1A KO cells. P values are as shown. A two-sided Mann-Whitney U-test and effect size (Rosenthal’s coefficient) are also shown. The log2 fold change calculated as log2 (mean KO/mean control) is also shown (n = 15). The box shows the 25th, median and 75th percentiles with the whiskers extending to ±1.5× interquartile range (IQR). f, Top significant transcription factor motifs enriched in the lost or gained accessible sites on ARID1A KO as analyzed by a ridge regression model (FDR< 0.01). The x axis represents the ridge regression coefficients.
The SWI/SNF complexes function in coordination with transcription factors to regulate gene expression16,20,25. To define the transcription factor motifs that are the most strongly associated with lost or gained accessible sites after ARID1A KO, we performed differential motif analysis using a regularized regression framework restricted to a database ofwell-curated motifs of transcription factors that are expressed in breast cancer26. We observed several transcription factor motifs whose inferred occupancy is either significantly increased or reduced when ARID1A is silenced (false discovery rate (FDR) < 0.01; Fig. 2f and Supplementary Table 3). Among the transcription factors whose occupancy was predicted to be reduced, we identified master regulators of ER-dependent transcription and key determinants of luminal (ER+) cell identity such as ER itself (ESR1 gene), FOXA1 (refs.27,28) and GATA3 (refs.29,30). Motif analysis also identified TEA domain family member 4 (TEAD4) motifs among the transcription factors whose occupancy is predicted to be enriched. TEAD4 was enriched in basal compared to luminal cells31. Further validation of TEAD4 via chromatin immunoprecipitation sequencing (ChIP)-quantitative PCR (qPCR) assays demonstrated increased binding of TEAD4 at predicted loci after ARID1A loss (Extended Data Fig. 3e). Moreover, to determine whether TEAD4 silencing might in part sensitize ARID1A KO cells to fulvestrant, we knocked down TEAD4 using three individual short hairpin RNAs (shRNAs) in MCF7 cells. TEAD4 knockdown partially sensitized ARID1A loss cells to fulvestrant treatment as demonstrated by crystal violet assays (Extended Data Fig. 3f,g). In contrast, further validation of a selected transcription factor, namely GATA3, whose binding is predicted to be decreased, showed that overexpression of GATA3 in the ARID1A KO cells partially sensitized the cells to fulvestrant treatment as demonstrated by crystal violet and cell counting-based proliferation assays (Extended Data Fig. 3h–j).
Furthermore, in agreement with similar accessibility changes after ARID1A KO in DMSO- or fulvestrant-treated cells, we observed the same transcription factor motifs enriched after ARID1A KO in both settings (Pearson’s r = 0.82, P=2.2 × 10⁻¹⁶) (Extended Data Fig. 3k). Altogether, our genome-wide ATAC-seq data suggest that loss of ARID1A mediates reprogramming of the chromatin landscape of breast cancer, thus leading to the enrichment of the transcription factor binding sites involved in basal-like phenotypes and the depletion of transcription factor targets involved in ER-dependent transcription and luminal cell identity.
ARID1A loss enriches for a basal-like gene signature.
We next assessed the impact of ARID1A loss on gene expression through RNA sequencing (RNA-seq) analysis, which showed significant changes in gene expression on ARID1A loss (Fig. 3a). When we integrated ATAC-seq differential changes with the messenger RNA expression levels of the nearest genes, the sites that were more accessible after ARID1A KO also showed increased gene expression (Fig. 3b, left panel). In contrast, sites that were downregulated in accessibility after ARID1A KO showed decreased gene expression of the nearest genes (Fig. 3b, right panel). This highlights the critical role chromatin accessibility controlled by ARID1A plays in gene expression in ER+ breast cancer. To identify the top gene signatures that are enriched or lost after ARID1A KO, we next performed gene set enrichment analysis (GSEA), which identified significant activation of a basal-like (ER−) transcriptional program after ARID1A loss (Fig. 3c and Supplementary Table 4). In contrast, the gene sets that were downregulated after ARID1A loss consisted of a number of genes important for the luminal (ER+) signature (Supplementary Table 4).
Fig. 3 |. ARID1A loss results in enrichment of a basal-like signature in cells and patient samples.
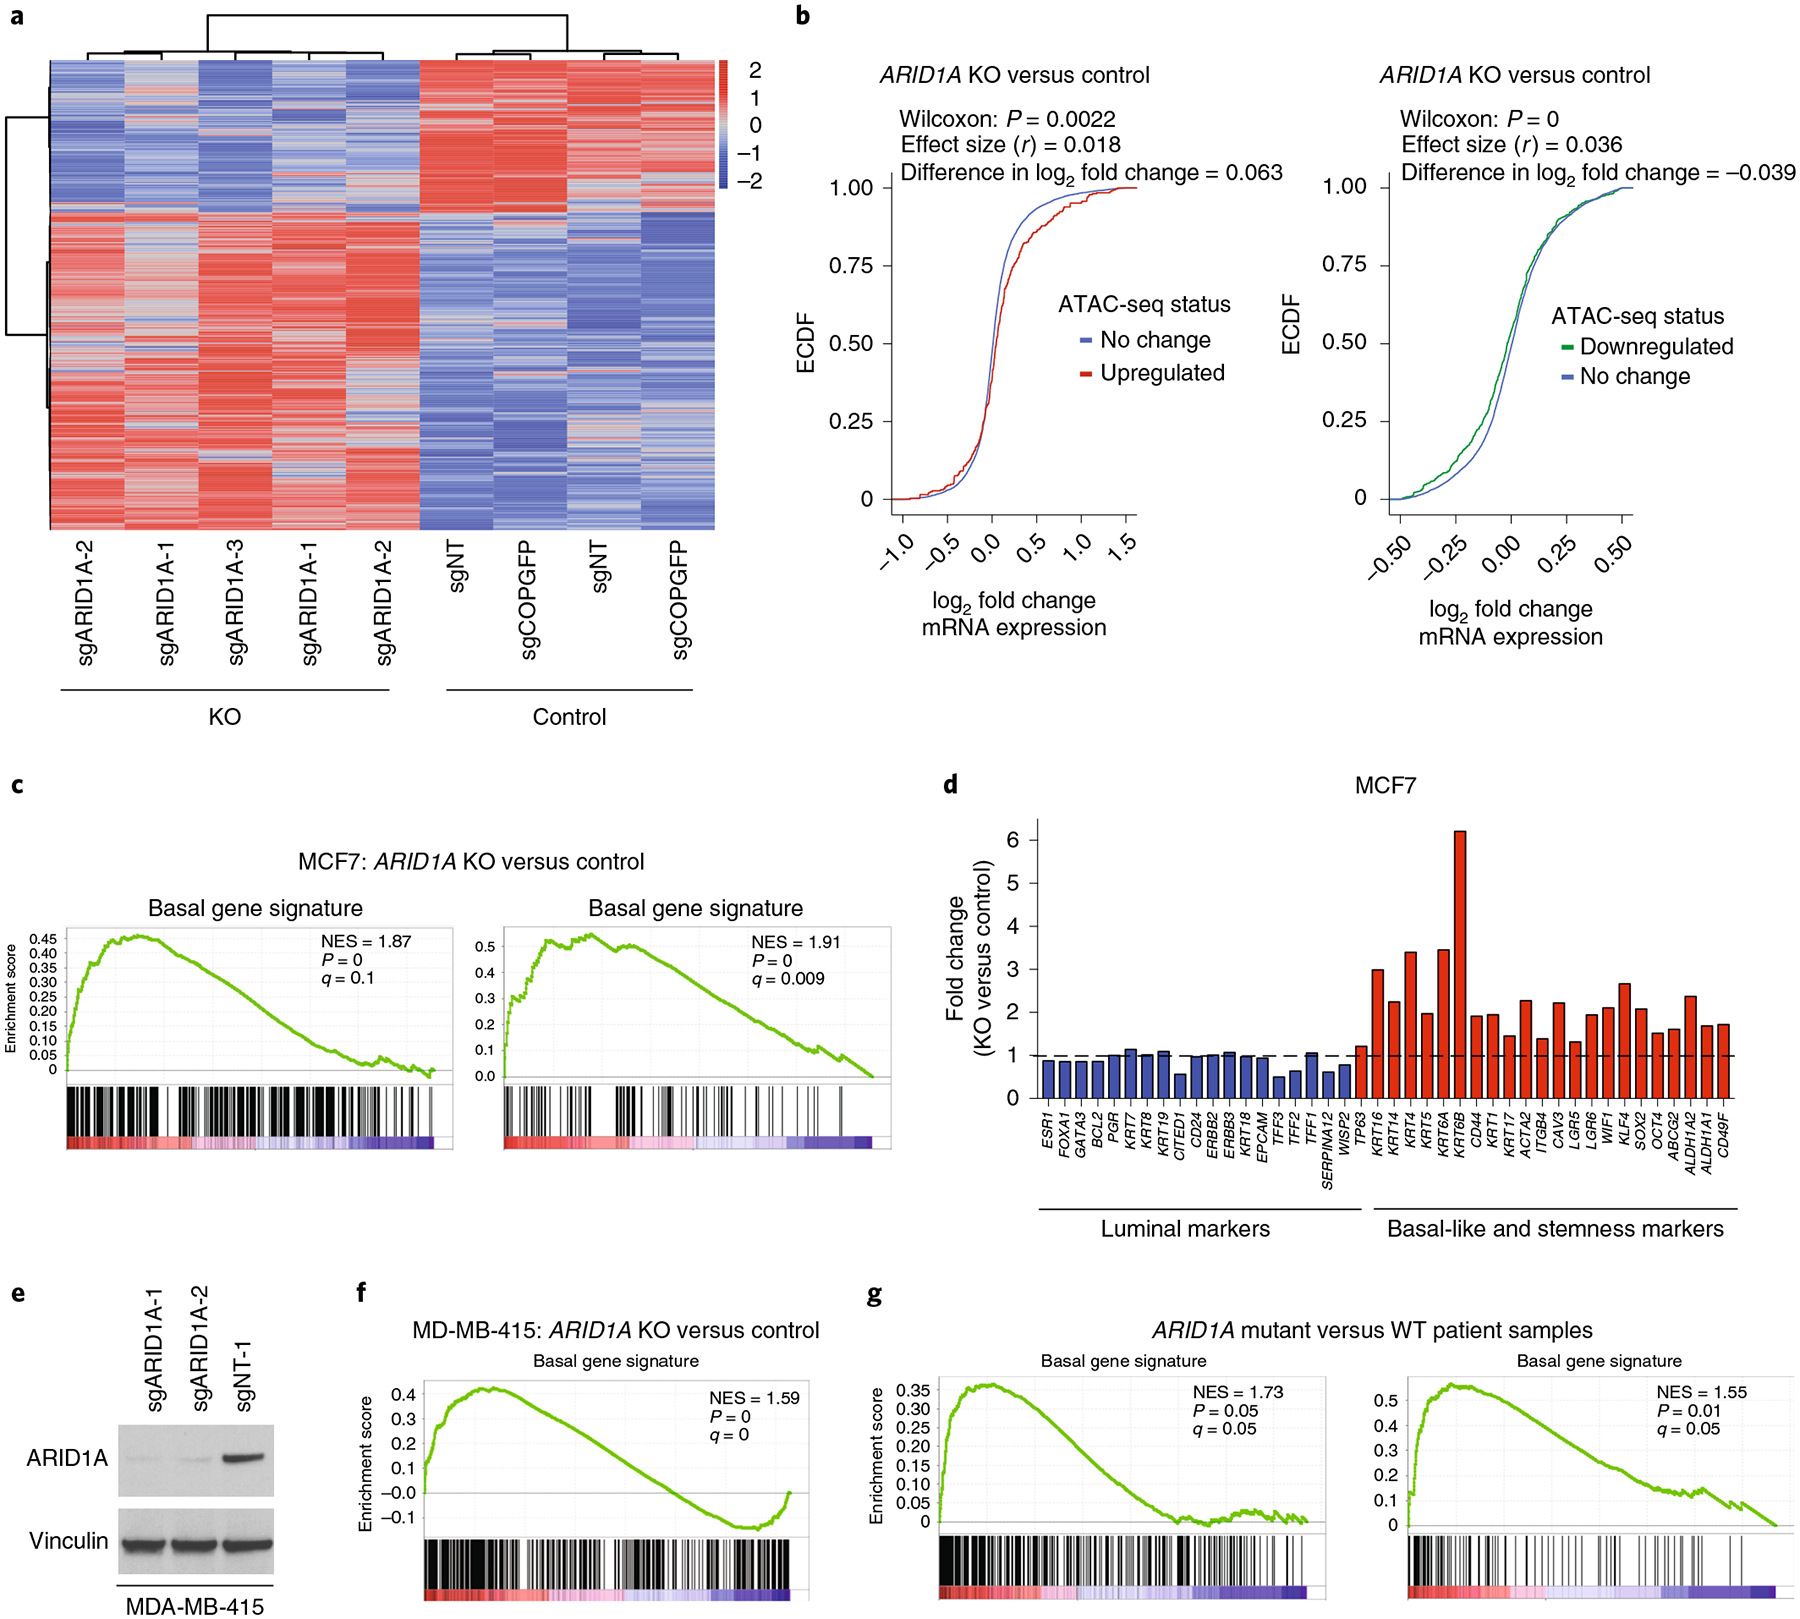
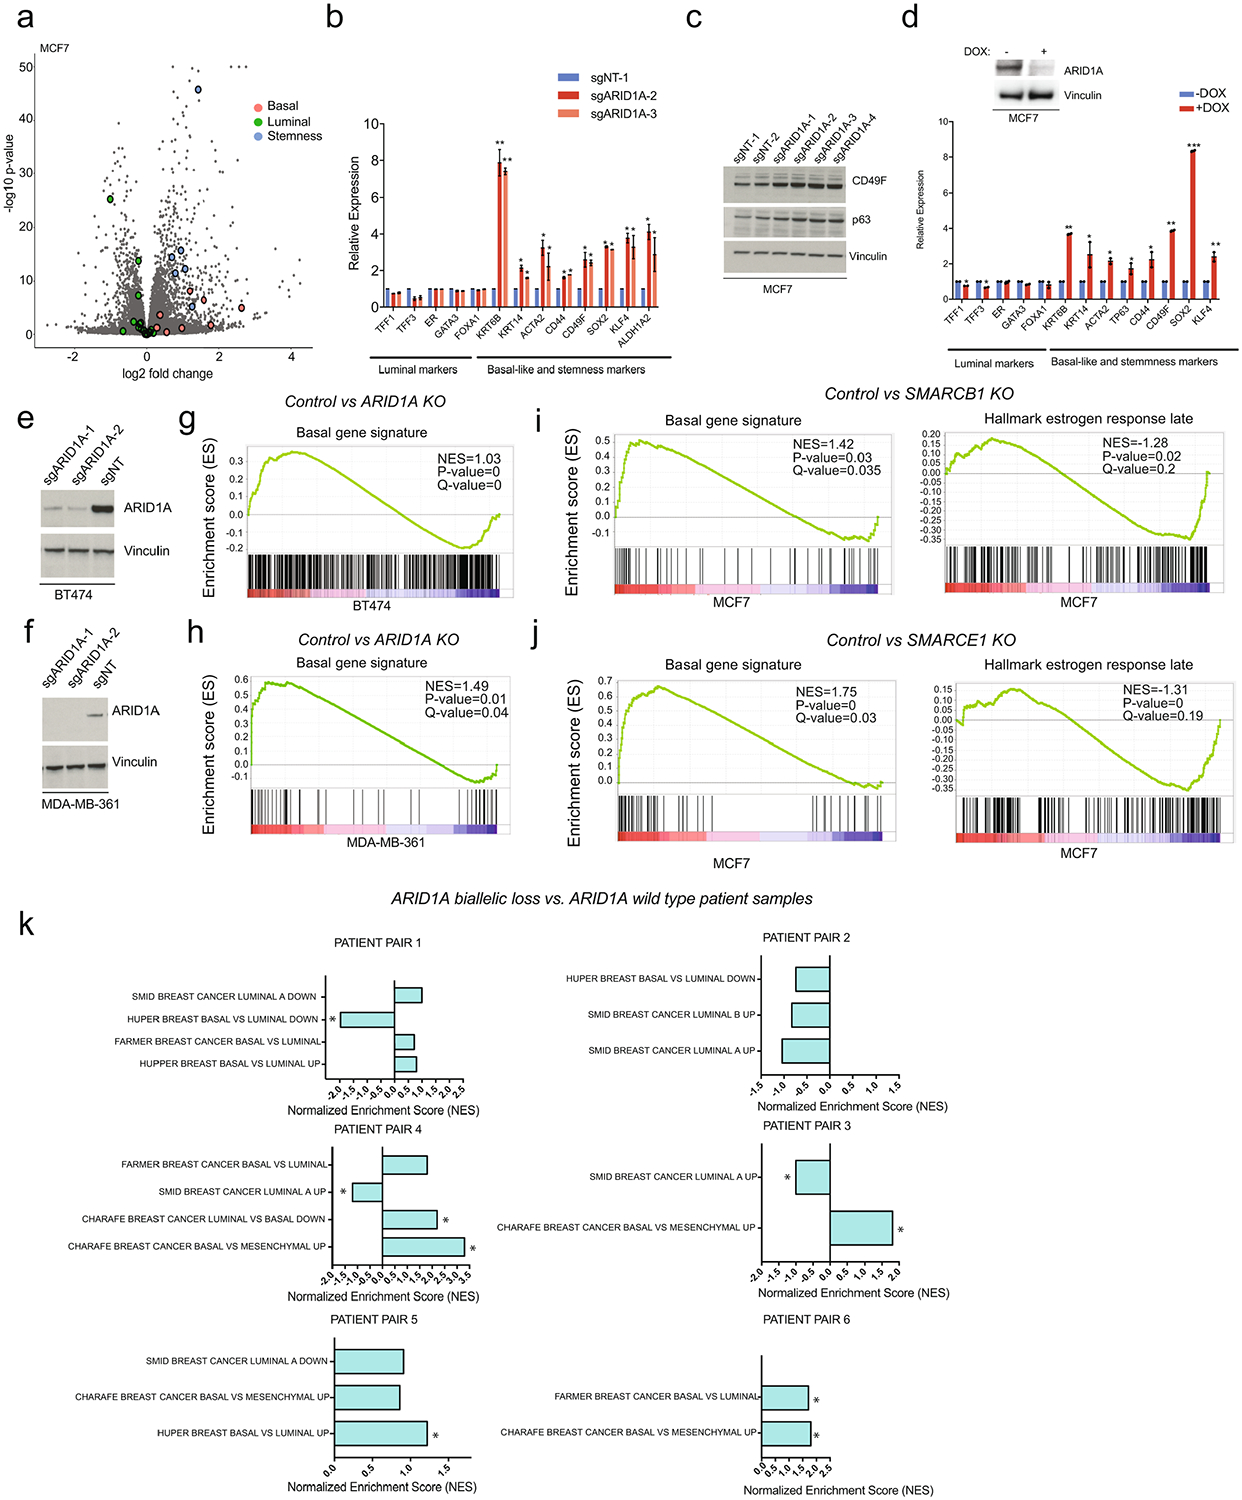
a, Heatmap displaying significantly differential gene expression as obtained by RNA-seq performed in two control (sgNT, sgCOPGFP) and three sgRNAs against ARID1A (sgARID1A-1, sgARID1A-2, sgARID1A-3) MCF7 cells (1,230 downregulated, 2,585 upregulated genes; absolute log2 fold change>0.5, Benjamini-Hochberg-adjusted P<0.01). b, ECDF plot of the log2 fold change of nearest gene expression (ARID1A KO versus control cells) in sites that have increased or decreased chromatin accessibility. P values are as shown. A two-sided Mann-Whitney U-test and effect size (Rosenthal’s coefficient) are also shown. Also shown is the difference in mean log2 fold change between two distributions (n = 9). c, GSEA in MCF7 after ARID1A KO (log2 fold change calculated using n = 9; nominal P values and FDR-adjusted P values were calculated using the GSEA package). NES, normalized enrichment score. d, Fold change (ARID1A KO versus control) of luminal and basal-like/stemness markers in MCF7 as obtained by RNA-seq (absolute log2 fold change> 0.5, Benjamini-Hochberg-adjusted P< 0.01). e, Cropped western blot with indicated antibodies of MDA-MB-415 cells expressing sgNT and two distinct sgRNAs against ARID1A. f, Enrichment of basal-like signatures in MDA-MB-415 on ARID1A KO; log2 fold change calculated using n = 6, nominal P values and FDR-adjusted P values were calculated using the GSEA package. g, Enrichment of basal signatures in patient samples with biallelic ARID1A loss versus patient samples WT for ARID1A; log2 fold change calculated using n = 12, nominal P values and FDR-adjusted P values were calculated using the GSEA package v.2.2.1.
To further evaluate this potential switch in cell fate after ARID1A loss, we surveyed the expression of established genes that define luminal, basal and stemness phenotypes32,33. Stemness gene markers are enriched in basal-like cells that are associated with a more aggressive phenotype, as compared with luminal subtypes34. ARID1A KO in MCF7 breast cancer cells resulted in a significant increase in the expression of basal-like/stemness genes, including KRT6, KRT15, KRT5, CD44 and TP63, whereas the expression of luminal markers such as GATA3, ER, FOXA1, KRT8, TFF3, WISP2/CCN5 and CITED1 were either downregulated or unaffected (Fig. 3d and Extended Data Fig. 4a). We validated the RNA-seq results using reverse transcription quantitative qPCR (RT-qPCR) for a subset of these markers. (Extended Data Fig. 4b). Moreover, western blotting demonstrated an increase in basal/stemness markers including p63 and CD49F (Extended Data Fig. 4c). Of note, p63 was recently shown to be sufficient and required to program breast luminal cells into basal cells35. The same gene expression changes in cell fate markers were observed using a doxycycline-inducible model to knock down ARID1A by shRNAs, suggesting these are on-target effects (Extended Data Fig. 4d). KO of ARID1A in MDA-MB-415, BT-474 and MDA-MB-361 ER+ breast cancer cells (Fig. 3e and Extended Data Fig. 4e,f) also led to an enrichment of basal-like gene signatures (Fig. 3f and Extended Data Fig. 4g,h). Moreover, KO of SMARCB1 or SMARCE1 also resulted in an enrichment of basal-like signatures and a downregulation of estrogen response (Extended Data Fig. 4i,j).
To further explore the uniformity of this enrichment from luminal to basal signatures, we studied ER+ tumor samples from patients. We identified in our institutional biobank six ARID1A mutant ER+ breast cancers with either homozygous deletion or truncating mutations accompanied by loss of heterozygosity of the WT allele, with resultant biallelic loss of ARID1A. We compared these samples to six matched ARID1A WT tumor samples. Global transcriptome profiling showed a significant enrichment of basal-like signatures across ARID1A mutant tumor samples compared to WT samples (Fig. 3g). When we investigated each patient pair individually, we observed significant enrichment of basal-like signatures in five out of six paired samples (Extended Data Fig. 4k). Thus, the same lineage switch observed in ARID1A KO cancer cells is also present in breast tumors with ARID1A loss.
ARID1A loss impairs SWI/SNF binding at ER-FOXA1-GATA3 sites.
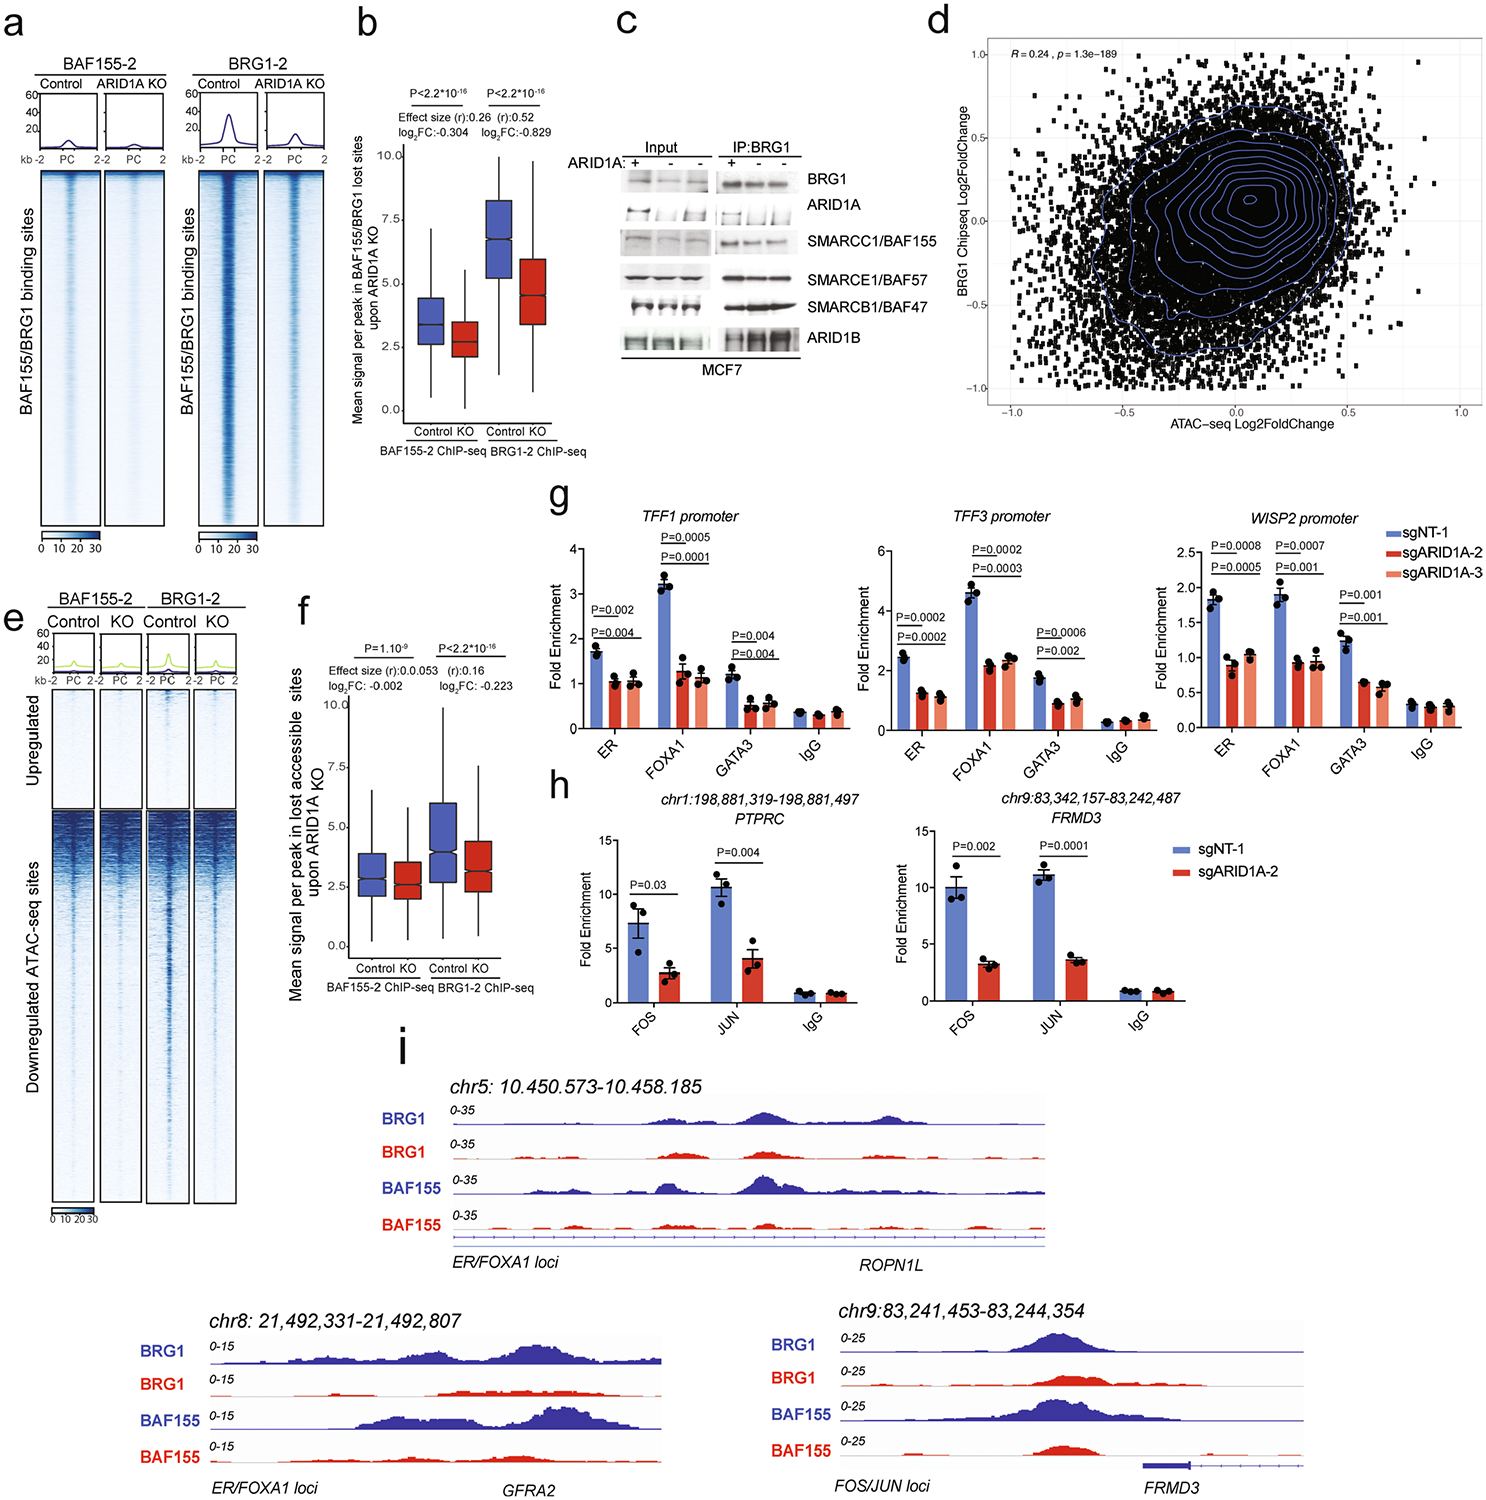
To delineate the mechanism(s) of how ARID1A loss induces an enrichment toward a basal-like phenotype and endocrine resistance, we examined the consequences of ARID1A loss on the chromatin recruitment of the SWI/SNF complex in breast cancer. To this end, we performed ChIP-seq for core subunits of the complex—BRG1 (SMARCA4) and BAF155 (SMARCC1)—in control and ARID1A KO MCF7 cells. As expected, in control MCF7 breast cancer cells, when assessing shared BRG1-BAF155 sites (n = 14,007), we observed widespread overlap in the cistromes of BRG1 and BAF155 (Fig. 4a). As in previous studies, we defined SWI/SNF complex sites as shared BRG1-BAF155 sites16,17. ARID1A KO cells showed marked loss of BRG1 and BAF155 occupancy, consistent with a critical role for this subunit in the SWI/SNF complex recruitment in breast cancer cells (Fig. 4a). A second round of ChIP-seq assays, using distinct antibodies for BAF155/BRG1, indicated as BAF155–2 and BRG1–2, demonstrated a robust co-occupancy of BAF155–2 and BRG1–2 with BAF155/BRG1 sites in ARIDlA-intact cells. Conversely, on loss of ARID1A, the BAF155–2 and BRG1–2 binding profiles are significantly reduced (Extended Data Fig. 5a,b). Moreover, immunoprecipitation assays demonstrated that the interaction between BRG1 and other core subunits of SWI/SNF was largely unaffected after ARID1A loss in MCF7 cells, indicating that SWI/SNF binding to chromatin is impaired by ARID1A loss while complex assembly remains unaffected, most probably due to residual ARID1B-containing SWI/SNF complexes (Extended Data Fig. 5c).
Fig. 4 |. ARID1A loss causes defects in SWI/SNF targeting to chromatin at luminal lineage-determining transcription factor loci.
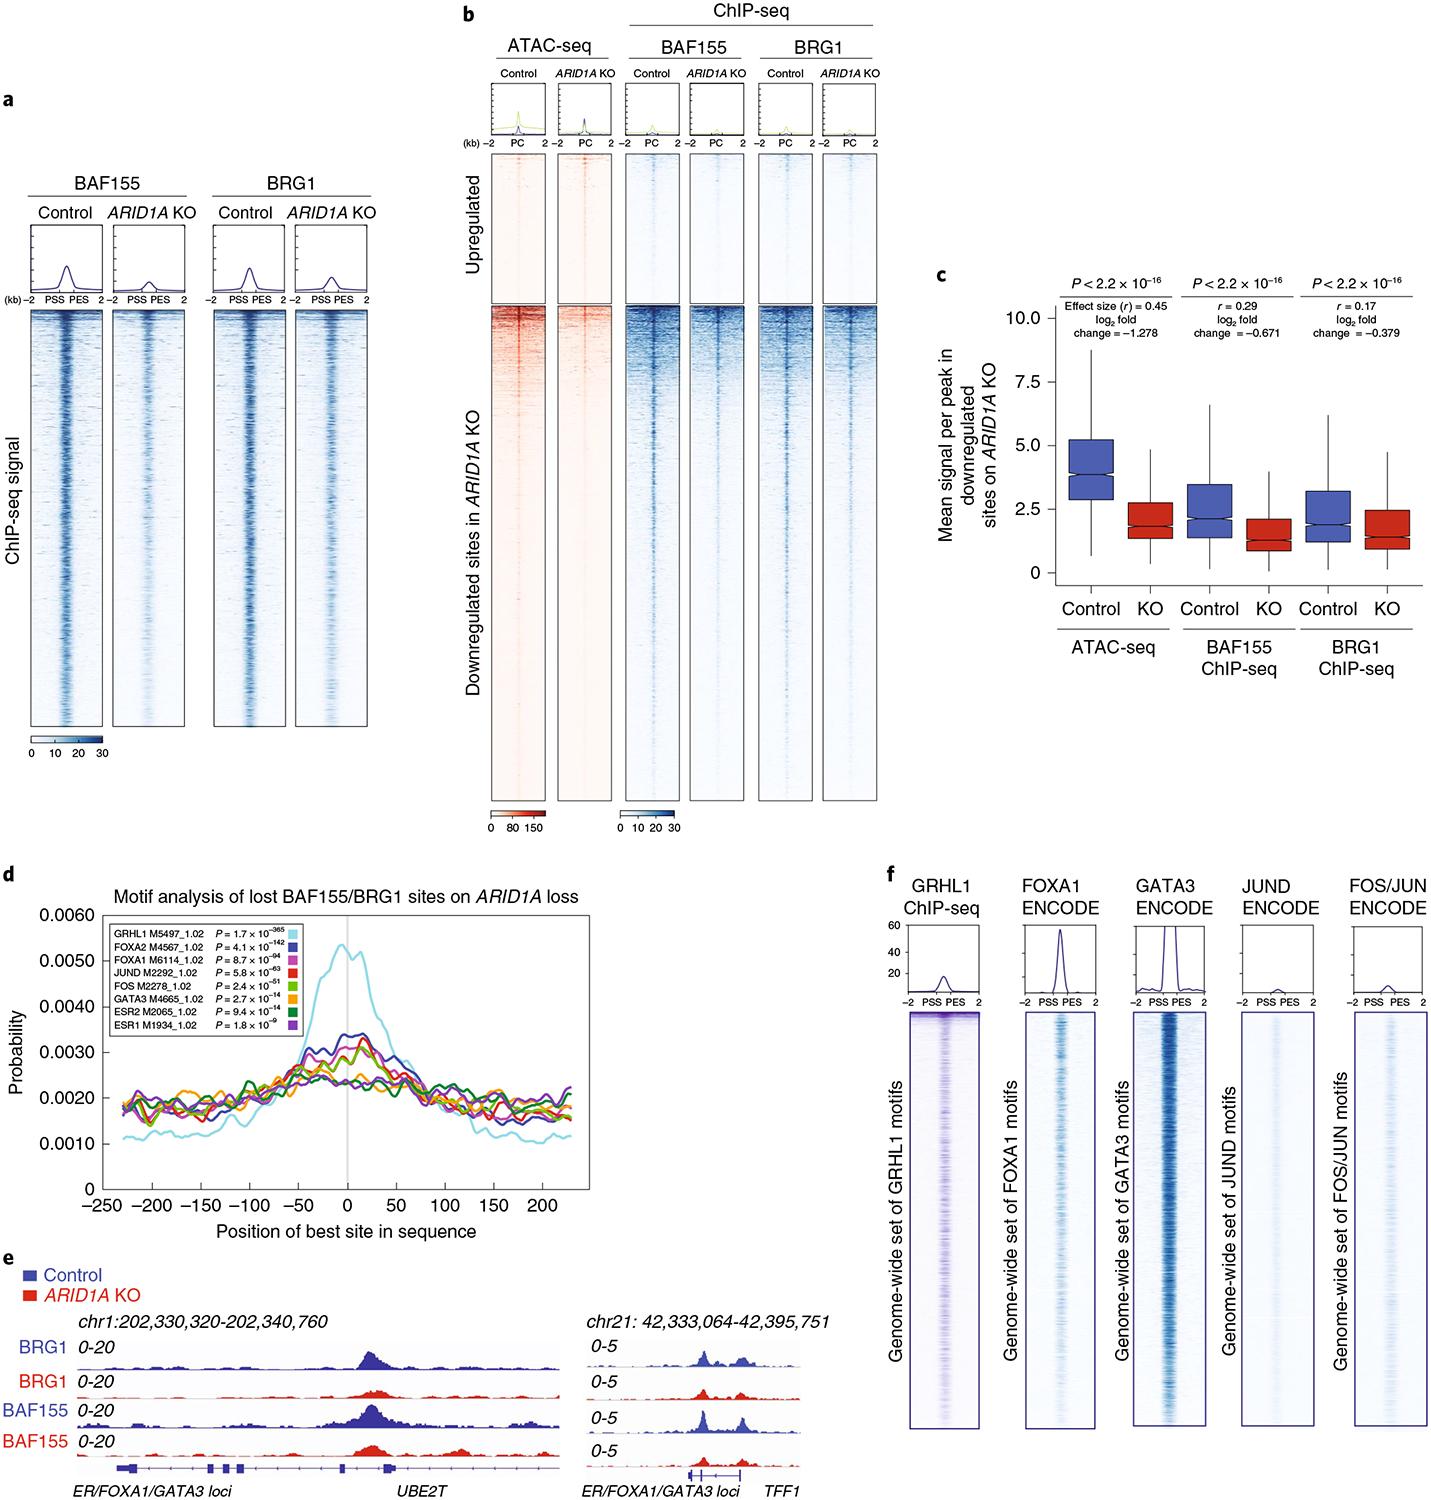
a, Heatmap of the ChIP-seq profiles of the SWI/SNF binding sites, as probed by the overlap of BAF155/BRG1 peaks (14,007 common peaks) for the core subunits in control and ARIDlA mutant MCF7 cells shown in a horizontal window of ±2 kb from the peak center. The experiment was conducted once. b, Enrichment of BAF155 and BRG1 occupancy in the differentially accessible sites observed by ATAC-seq. The experiment was conducted once. PC, peak center. c, Box plot representing the mean signal across peaks that lose chromatin accessibility on ARIDlA KO cells. Also shown are the BAF155 and BRG1 ChIP-seq differential binding in control and ARIDlA KO cells. P values were calculated using a two-sided Mann-Whitney U-test; the effect size (Rosenthal’s coefficients) was calculated as described in the Methods. The log2 fold change, which was calculated as log2 (mean KO/mean control) is also shown (n = 13). The box shows the 25th, median and 75th percentiles with the whiskers extending to ±1.5× IQR. d, Motif enrichment of transcription factors found in lost BAF155/BRG1 sites on ARIDlA silencing; n = 9,555peaks, P values were calculated using CentriMo v.4.11.4. e, ChIP-seq tracks of BRG1 and BAF155 in control and ARIDlA KO cells. The experiment was conducted once. f, ChIP-seq profiles for GRHL1 (generated in this study), FOXA1 (ENCODE ENCSR126YEB), GATA3 (ENCODE ENCSR000BST), FOS/JUN (ENCODE ENCSR176EXN) and JUND (ENCODE ENCSR000BSU) at the predicted motif sites obtained from lost SWI/SNF binding sites after ARIDlA loss (n = 1).
Additionally, we found that most sites that lost chromatin accessibility after ARIDlA KO also showed significant loss of binding of the core subunits of the SWI/SNF complex (Fig. 4b,c and Extended Data Fig. 5d–f), in agreement with previous studies linking SWI/SNF integrity with DNA accessibility17,19,36,37.
We next sought to identify candidate transcription factors that are directly associated with the SWI/SNF complex. To this end, we analyzed transcription factor sequence motifs at the sites that lost SWI/SNF complex binding after ARID1A silencing. At these sites, we observed enrichment for AP-1 transcription factor (FOS/JUN) motifs, which correlate with SWI/SNF complex binding in other contexts16,19,38,39. AP-1 transcription factor binding motifs are also enriched in luminal breast cancer cells compared to basal cells31. In agreement with the impact of ARIDlA loss on luminal cell fate, we identified enrichment of binding motifs for FOXA1, GATA3 and ER in the set of sites that lost SWI/SNF binding on ARIDlA KO (Fig. 4d and Supplementary Table 5). Indeed, ChIP-qPCR for ER, FOXA1 and GATA3, demonstrated a reduction of transcription factor binding at their loci in the setting of ARIDlA loss (Extended Data Fig. 5g). Similar findings were also found when ChIP-qPCR experiments were performed for the AP-1 transcription factors, FOS and JUN, at predicted loci after ARIDlA loss (Extended Data Fig. 5h). Examples of SWI/SNF occupancy at the FOXA1/ER, GATA3 or FOS/JUN loci are shown in Extended Data Fig. 5i and Fig. 4e. The same sites that lost binding of SWI/SNF complex also showed enrichment of grainyhead-like protein 1 homolog (GRHL1), a transcription factor thought to be involved in epithelial cell identity30 but whose function in ER+ breast cancer is not well defined. When we overlapped the predicted sites of these motifs with available ChIP-seq data from the Encyclopedia of DNA Elements (ENCODE) and our own ChIP-seq data for the GRHL1 transcription factor, we observed occupancy of these transcription factors at these sites, indicating that these motifs obtained from ATAC-seq closely recapitulate ChIP-seq binding data (Fig. 4f). Thus, transcription factor motifs such as ER, FOXA1, GRHL1, GATA3 and others that are enriched at SWI/SNF complex binding sites and lost on ARIDlA KO correspond to the transcription factors detected by our ATAC-seq changes.
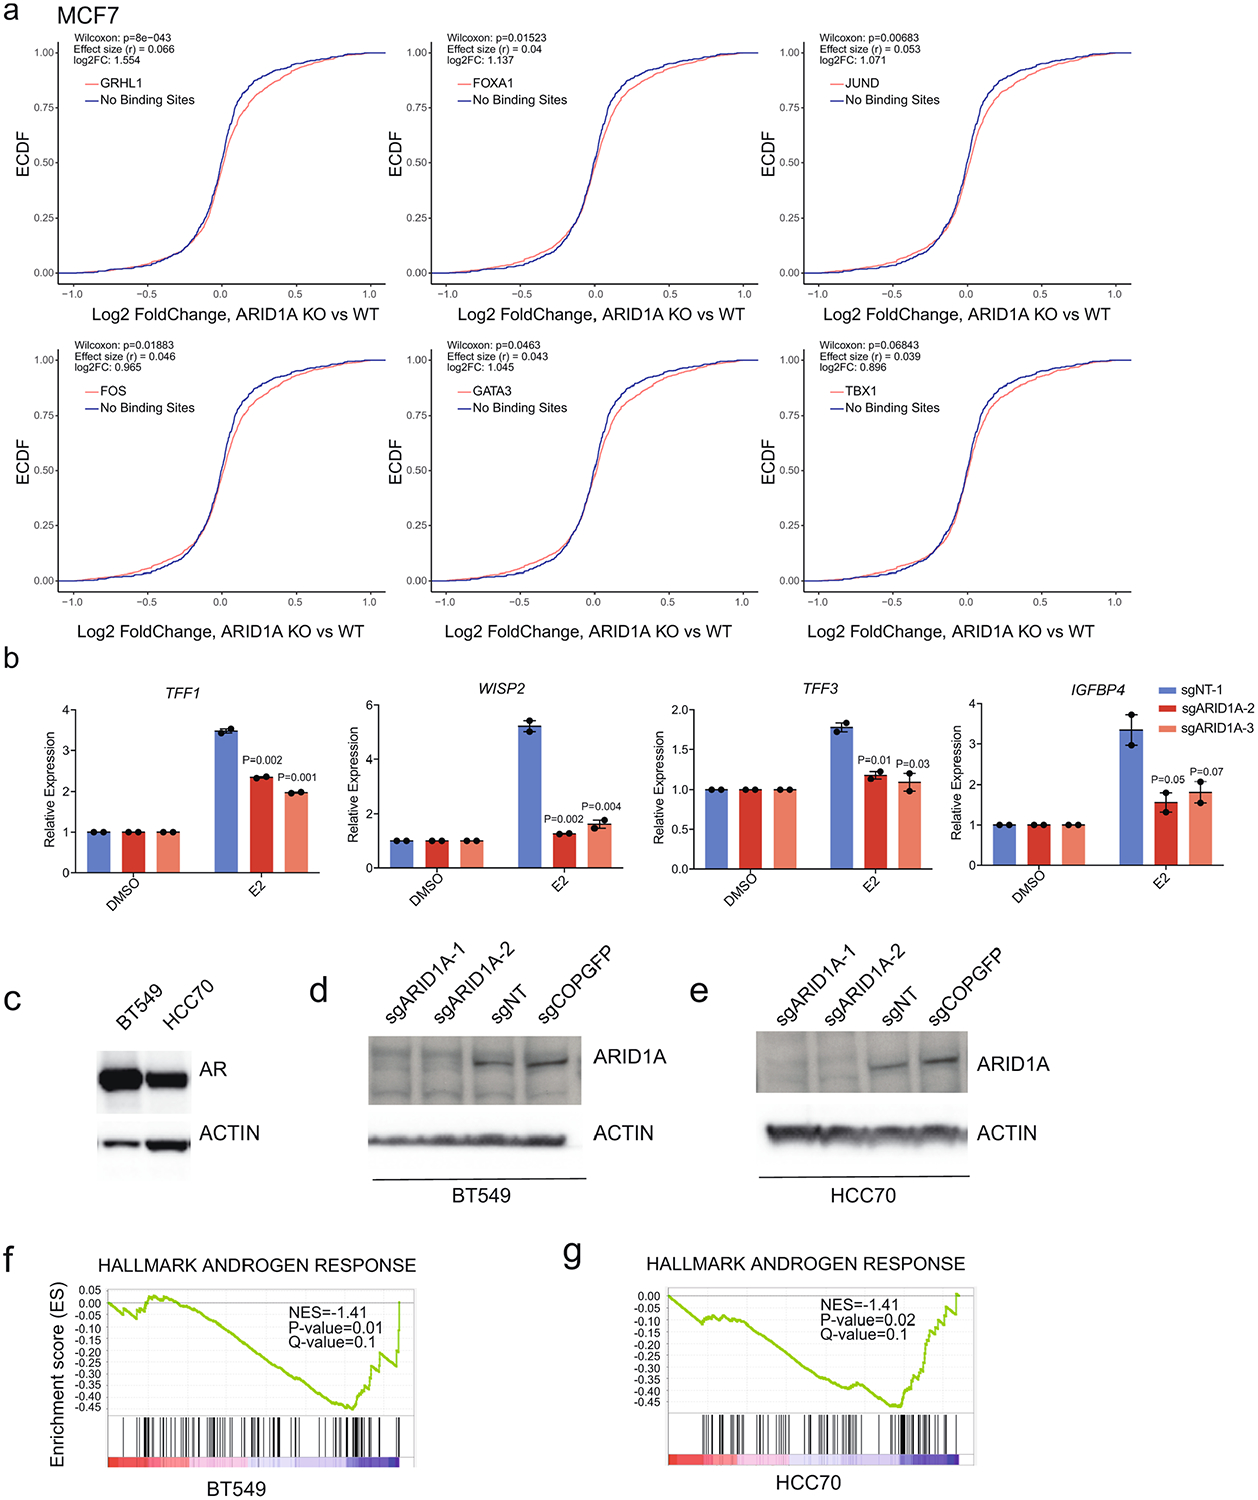
To further dissect the relationship between SWI/SNF-mediated enrichment of these transcription factors with target gene expression changes, we analyzed the nearest gene expression associated with the peaks where GRHL1, FOXA1, FOS, JUN and GATA3 bind, which were enriched in the ARID1A-mediated SWI/SNF-depleted binding sites. This analysis demonstrated that altered SWI/SNF binding observed on ARIDlA KO at these transcription factor target sites was associated with differential gene expression, as compared to control nearest gene regions without enrichment for these transcription factor motifs (Extended Data Fig. 6a).
ARID1A regulates ER-FOXA1 occupancy and ER activity.
Given the effect of ARIDlA loss on SWI/SNF targeting to ER sites and the critical role of ER as the master regulator of luminal ER+ breast cancer1, we sought to dissect the impact of ARIDlA loss on genome-wide ER localization and ER-dependent transcription. We performed ER ChIP-seq in control and ARIDlA KO MCF7 cells. In ARIDlA control cells, we found colocalization of ER with BAF155 and BRG1, indicating a genome-wide co-occupancy of ER and the SWI/SNF complex in breast cancer cells. Notably, we observed significant loss of ER binding at shared ER and BAF155/BRG1 sites after ARIDlA silencing, even though ER protein levels did not change (Fig. 5a,b). In addition, these same sites also show reduced binding of the SWI/SNF complex on ARIDlA loss (Fig. 5a,b). These observations demonstrate that binding of ER to chromatin is dependent on ARIDlA-containing SWI/SNF complexes.
Fig. 5 |. ARID1A regulates ER and FOXA1 chromatin occupancy and ER-dependent transcription.
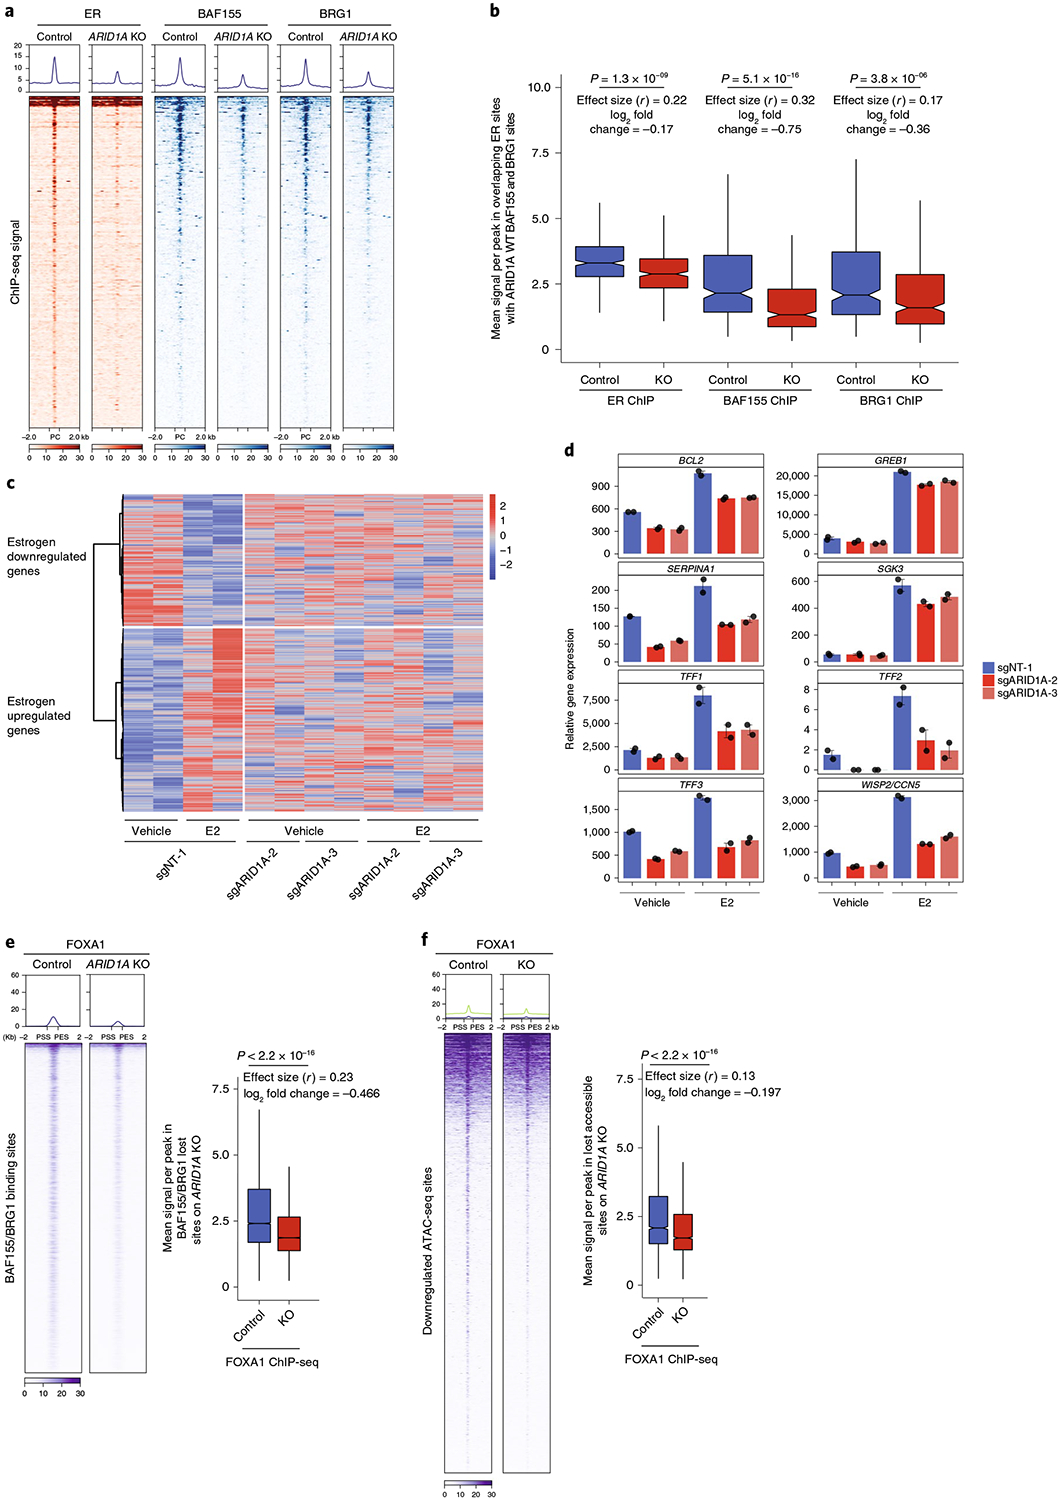
a, ChIP-seq of ER (n = 2 independent experiments) in control and ARIDlA KO cells at ER peaks that overlap with BAF155/BRG1 peaks (n = 344) Also shown are the BAF155 and BRG1 ChIP-seq levels. b, Box plot representing the mean signal of ER sites shown in a in control cells and after ARIDlA KO. Also shown are the mean signals for BAF155 and BRG1 ChIP-seq. The log2 fold change is shown (n = 8). c, Heatmap displaying the differential gene expression changes obtained by RNA-seq in ARIDlA KO versus control MCF7 cells. Cells were estrogen-depleted for 3d, and this was followed by estrogen treatment for 12h. d, Examples of expression of estrogen-dependent genes in control and ARIDlA KO cells on vehicle or estrogen treatment by RNA-seq. The bar plot shows the mean expression and s.e.m. bars (n = 12). e, ChIP-seq levels of FOXA1 at the BAF155/BRG1 shared sites in control and ARIDlA KO MCF7 cells. Also shown is the box plot representing the mean signal across differential FOXA1 sites at the BAF155/BRG1 sites after ARIDlA KO. f, ChIP-seq of FOXA1 at differential ATAC-seq sites on ARIDlA loss. Also shown is the box plot demonstrating the mean signal across differential FOXA1 sites at the ATAC-seq sites after ARIDlA KO. P values, two-sided Mann-Whitney U-test and effect size (Rosenthal’s coefficient) are shown. The log2 fold change, which was calculated as log2 (mean KO/mean control) is also shown (n = 4). The box shows the 25th, median and 75th percentiles with the whiskers extending to ±1.5× IQR.
In addition to the baseline effects of ARIDlA silencing, we investigated the effects of ARIDlA silencing on ER-dependent transcription. Hormone-deprived MCF7 cells and ARIDlA loss cells were treated with estrogen and subjected to RNA-seq analysis. ARIDlA loss led to widespread changes in the expression of estrogen-responsive gene targets. Out of the approximately 3,000 estrogen-responsive genes that were either downregulated or upregulated by estrogen, 1,247 genes were affected by ARIDlA loss (Fig. 5c). Thus, ARIDlA loss globally affected the estrogen-mediated transcrip-tome, with more than 40% of all estrogen-regulated genes requiring ARID1A for estrogen regulation. Indeed, the expression of canonical ER target genes was substantially downregulated after ARIDlA loss as shown by RNA-seq (Fig. 5d). These findings were also validated using RT-qPCR assays (Extended Data Fig. 6b).
To determine whether ARIDlA affects the regulation of additional nuclear receptors in other breast cancer types such as androgen receptors in androgen-receptor-positive triple negative breast cancer (TNBC), we knocked out ARIDlA using two distinct sgRNAs in the whole population of two TNBC cell lines, namely BT-549 and HCC70, and subjected the cells to RNA-seq (Extended Data Fig. 6c,e). RNA-seq analyses demonstrated a loss of androgen response after ARIDlA KO in both cell lines, indicating that ARID1A has a broader affect in regulating the activity of nuclear receptors in breast cancer (Extended Data Fig. 6f,g).
FOXA1 is a master regulator of luminal identity and dictates ER binding and activity27,28. Given that the FOXA1 motif exhibited significant enrichment across both lost accessible sites and lost SWI/SNF sites after ARID1A KO, we sought to determine whether ARID1A regulates FOXA1-chromatin interactions. To this end, we performed FOXA1 ChIP-seq in control and ARID1A KO MCF7 cells. We found widespread co-occupancy of FOXA1 and BAF155/BRG1 in ARID1A-intact MCF7 cells (Fig. 5e). Conversely, ARID1A KO resulted in substantial loss of FOXA1 occupancy at BAF155-BRG1 sites across the genome and at the lost accessible sites after ARID1A KO (Fig. 5f), suggesting a role for ARID1A in altering the FOXA1 cistrome genome-wide in breast cancer. FOXA1 is referred to as a pioneer transcription factor that keeps enhancer nucleosomes accessible in chromatin40. However, our data suggest that there are defined features of chromatin mediated by ARID1A SWI/SNF complexes that may aid FOXA1 binding in breast cancer cells, as previously shown with the association between FOXA1 and H3K4me1/2 modifications altered by lysine-specific histone demethylase 1A41 and histone-lysine N-methyltransferase 2D42. Nevertheless, it remains to be determined if FOXA1, due to its pioneering activity, may also regulate the cistrome of ARID1A-containing SWI/SNF complexes.
In summary, we have found that ARID1A deficiency leads to a loss of ER and FOXA1 chromatin interactions and estrogen response in breast cancer cells; this together with the transcriptomic and epigenomic alterations at luminal identity gene loci drives endocrine resistance (Fig. 6).
Fig. 6 |. Proposed model.
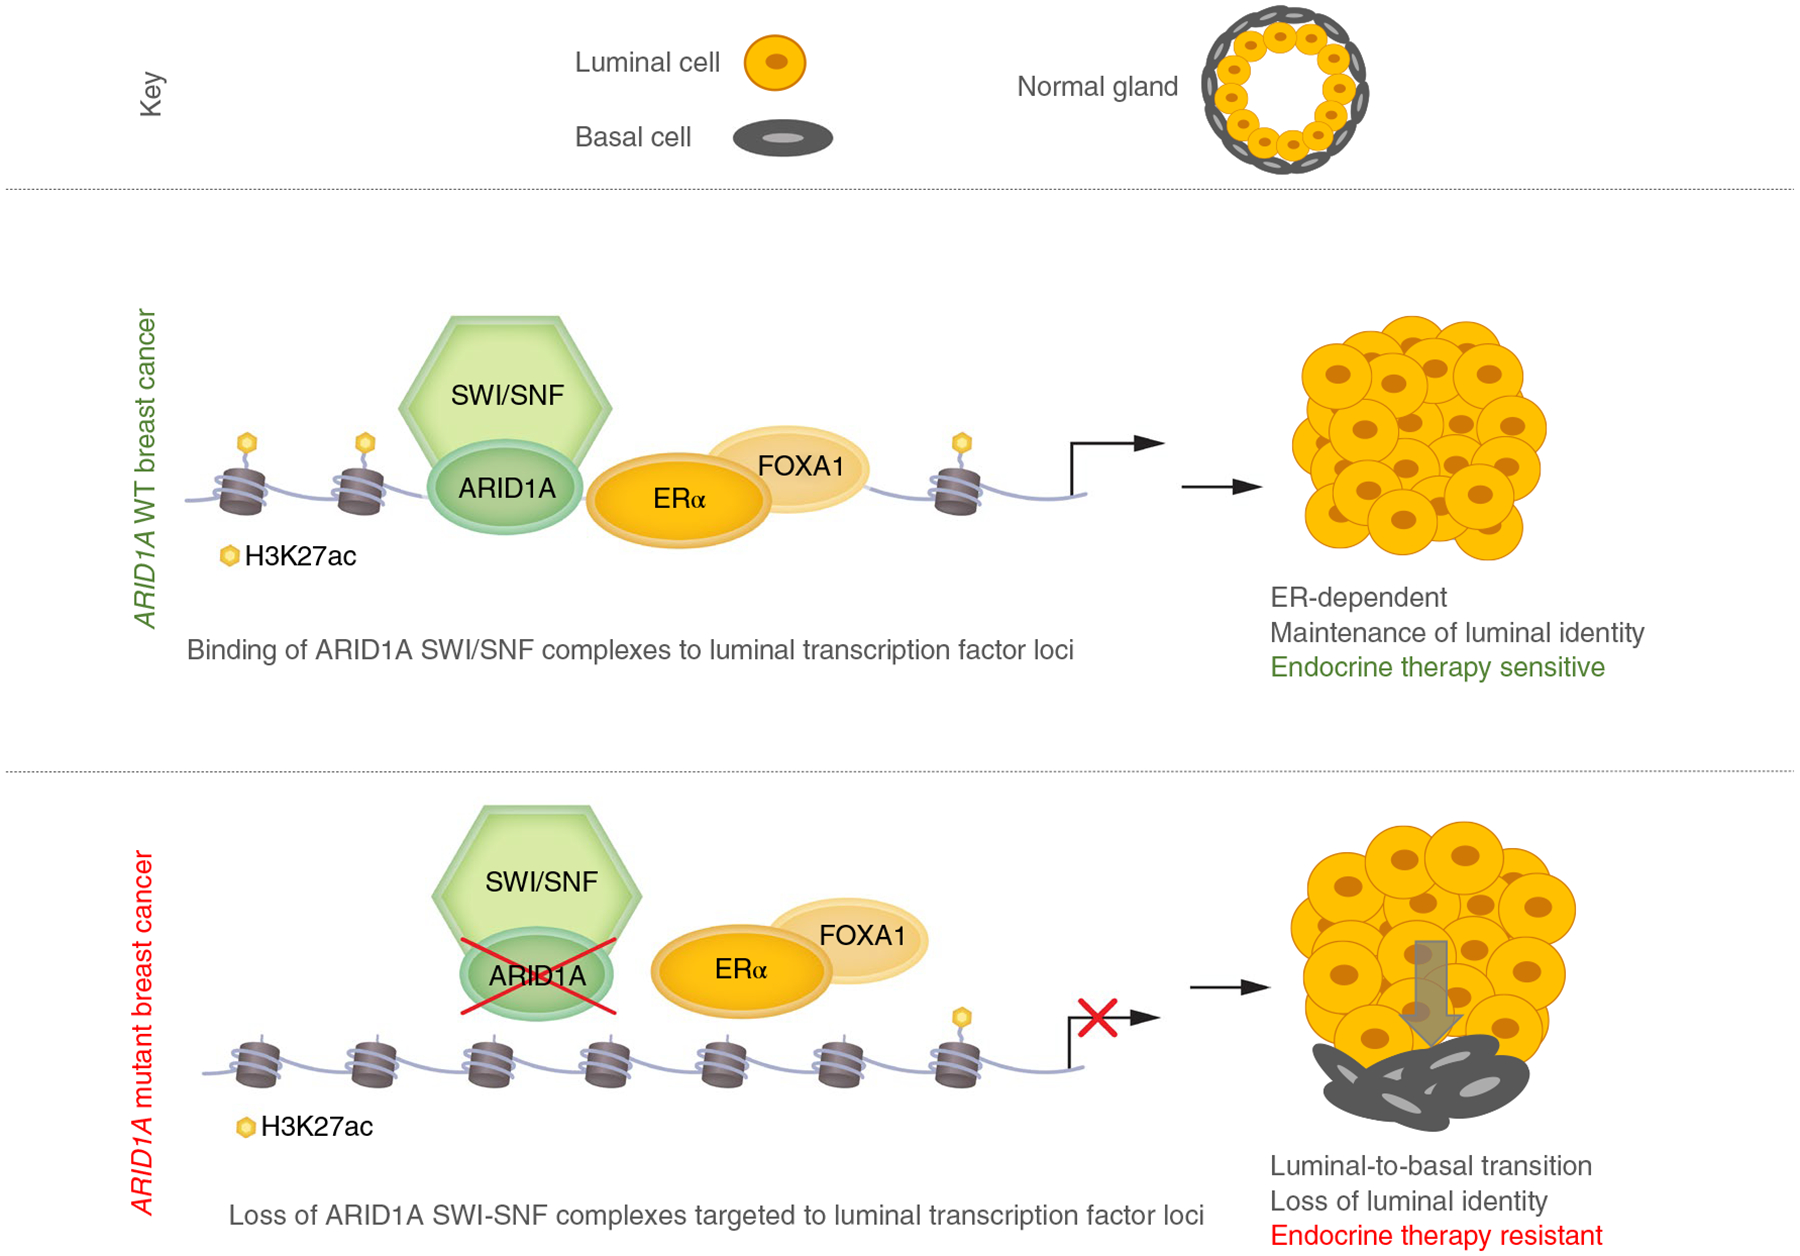
Model depicting lineage plasticity and endocrine therapy resistance in ER+ breast cancer due to loss of ARID1A compared to ER+ breast cancer with WT ARID1A.
Discussion
Our findings establish a major role for ARID1A in breast luminal lineage fidelity and sensitivity to endocrine therapy. Our clinico-genomic study of a large cohort of clinically annotated patients with metastatic breast cancer confirmed that patients with ARID1A alterations had poor responses to ER degraders, suggesting that ER dependence may be attenuated in these patients. Our study also defines a mechanism through widespread chromatin reprogramming and functional regulation of master luminal transcription factors, by which tumor cells can alter lineage fidelity and become less responsive to luminal-specific anti-ER therapy (Fig. 6).
While there is evidence that a cooperative network among ER, FOXA1 and GATA3 sustains the differentiation of luminal tumors27,28, there was little understanding about the chromatin-based programs that collectively govern the luminal phenotype and the mechanisms underlying breast cancer lineage plasticity. We have demonstrated that ARID1A plays an important role in chromatin reprogramming and regulation of the master luminal transcription factor binding and activity. ARID1A loss reduces chromatin accessibility and SWI/SNF chromatin targeting at the transcription factor binding sites that regulate the gene expression programs needed to sustain luminal cell fate. Indeed, our transcriptional profiling data in ARID1A KO cells and patient samples harboring ARID1A-inactivating mutations reveal a shift from a luminal to a basal-like gene expression phenotype. The ARID1A-dependent response to estrogen gene expression and ER-FOXA1 occupancy also supports a role for ARID1A in regulating ER activity, which is the defining feature of luminal breast cancers.
We have identified that inactivating ARID1A mutations are present at a higher frequency in metastatic tumors and tumors that have progressed on hormonal therapy22. Our current observations may provide an explanation for the long-standing clinical observation that ER+ tumors exposed to the selective pressure of endocrine therapy may switch to a basal-like phenotype and become endocrine therapy-resistant43–46. In this regard, it has been suggested that breast cancer is a heterogeneous disease and that prolonged suppression of ER could facilitate the outgrowth of ER− clones. However, our findings suggest that an alternative mechanism may be at play, namely that prolonged selective suppression of ER may also enable the emergence of cells with acquired inactivating ARID1A mutations that confer a basal-like phenotype and independence from ER therapy. Future studies are required to determine whether epigenetic modulation may reverse or delay lineage switching, extending the response of endocrine therapies. Examples may include histone-lysine N-methyltransferase EZH2 and bromodomain and extra-terminal motif protein (BET) inhibitors, which have been shown to represent a treatment strategy for ovarian cancers involving ARIDlA mutations47,48.
In summary, our results show that ARIDlA loss promotes a switch from a luminal to a basal lineage, supporting the notion of lineage plasticity in breast cancer and that this contributes to endocrine resistance. These findings add to the increasing recognition of therapeutic resistance induced by lineage switching of cancer cells and subsequent loss of dependency on lineage-dependent drug targets, as has been observed in prostate cancer cells with dual RBl and TP53 loss32. We hypothesize that subsequent studies will elucidate the role of lineage commitment in the therapeutic response to cancer therapies and the critical role for alterations in epigenetic regulators in disrupting this mechanism and inducing therapeutic resistance.
Methods
Cell lines.
MCF7 and BT474 cells were obtained from ATCC, were cultured in DMEM/F-12 (Corning) and supplemented with 10% FCS, 50 U ml−1 penicillin and 50 ng ml−1 streptomycin. MDA-MB-415, MDA-MB-361, HCC70 and BT-549 cells were obtained from ATCC, cultured in RPMI 1640 medium (Corning) and supplemented with 10% FCS, 50 U ml−1 penicillin and 50 ng ml−1 streptomycin under normal oxygen conditions (5% CO2, 37 °C). 293T cells were obtained from ATCC (CRL-3216) and were cultured in DMEM (Corning) supplemented with 10% FCS. All cells were cultured under normal oxygen conditions (5% CO2, 37 °C).
Lentivirus transduction of cells with Cas9, sgRNA, shRNA and complementary DNA (cDNA).
For Cas9 infection, target cells were infected with CAS9–2A-Blast (Cellecta) lentivirus containing polybrene (8 μg ml−1) for 24 h. For sgRNA transduction, individual sgRNAs targeting the ARID1A gene were designed using Benchling (http://www.benchling.com). Nontargeting sgRNA (sgNT; SGCTL-NT-pRSG16) and sgCOPGFP (catalog no. SGCTL-COP-PRSG16) were ordered from Cellecta.
For shRNA transduction, individual shRNAs targeting the TEAD4 gene were obtained from Sigma’s Mission shRNA library (Sigma-Aldrich). Individual shRNA vectors are shown in Supplementary Table 7. For cDNA transduction, GATA3 cDNA was cloned into the pCDH-CMV-MCS-EF1-Puro vector (System Biosciences) and verified by Sanger sequencing. Details of the methodology for this section are provided in Supplementary Note.
Epigenome CRISPR-CAS9 sgRNA screen.
To obtain the customized sgRNA library, 12 sgRNAs were designed per gene after finalizing a list of 914 genes known to be regulators of the human epigenome. The sgRNA design strategy was largely based on the guideline49 and the sgRNA library was constructed into the pRSG16-U6-(sg)-UbiC-RFP-Puro backbone by Cellecta. To generate the lentivirus of the sgRNA library, 293T cells were seeded into six 15-cm dishes 16 h before transfection. For each dish, 3.5 μg pMD2.G envelope vector, 7 μg pCMV-dR8.2 packaging vector and 10.5 μg sgRNA library were added to 3 ml jetPRIME buffer (Polyplus-transfection) and 42 μl jetPRIME transfection reagent, incubated for 10 min and added to the cells. Medium was refreshed 6 h posttransfection and the supernatant of cells containing lentivirus was collected 48 h posttransfection. Lentivirus titration was determined by an RT-qPCR-based method according the manufacturer’s protocol (Lenti-X qRT-PCR Titration Kit; catalog no. 631235, Clontech).
Next, the lentivirus of the sgRNA library was added to 110 million MCF7-Cas9 cells at a multiplicity of infection of approximately 0.3 to reach 3,000× coverage of the library. Library-transduced cells were subjected to either DMSO or fulvestrant (100 nM) treatment for 2 weeks. Surviving cells were pooled and genomic DNA (gDNA) was extracted using the Gentra Puregene Blood Kit according to the manufacturer’s protocol (QIAGEN). At least 400 μg gDNA from each group to reach more than 3,000× coverage of the library was amplified by PCR and the sgRNA sequences were retrieved by sequencing the PCR products according to the manufacturer’s protocol (NGS Prep Kit for sgRNA Libraries in pRSG16/17 (KOHGW); catalog no. LNGS-120, Cellecta).
The reads of different sgRNAs were counted and the following criteria were used to select the top hits for further validation: at least 6 out of 12 sgRNAs targeting the same gene (top 3%, 341 sgRNAs per 110K) selectively enriched in the fulvestrant-treated groups compared with the untreated groups; additionally, each sgRNA must have had at least 500 reads in the DMSO-treated group (2,340 reads per sgRNA on average).
Ribonucleoprotein system-mediated gene KO.
For the ribonucleoprotein-mediated KO of ARID1A, sgRNAs were ordered as CRISPR RNAs together with negative control CRISPR RNAs, transactivating CRISPR RNA and Cas9 proteins from Integrated DNA Technologies. Ribonucleoproteins were assembled and nucleofected into cells according to the manufacturer’s protocol. Further details on the methods used are provided in the Supplementary Note.
Western blot and coimmunoprecipitation.
The western blot assay was performed as described previously50. Briefly, total proteins were separated by SDS-polyacrylamide gel electrophoresis on 4–12% Bis-Tris or 3–8% Tris-Acetate gradient gels (Invitrogen). Proteins were transferred electrophoretically to a nitrocellulose membrane (Bio-Rad Laboratories), which was blocked in 5% BSA with Tris-buffered saline and Tween 20 (Boston BioProducts). The primary antibodies used in this study were rabbit anti-vinculin (catalog no. 13901; Cell Signaling Technology); rabbit anti-β-actin (catalog no. 4970; Cell Signaling Technology); rabbit anti-AR (catalog no. SC-816; Santa Cruz Biotechnology); rabbit anti-BRG1 (catalog no. ab110641; Abcam); mouse anti-ARID1A (catalog no. SC-32761; Santa Cruz Biotechnology); rabbit anti-p63-α (catalog no. 13109; Cell Signaling Technology); rabbit anti-CD49F/integrin α6 (catalog no. 3750; Cell Signaling Technology); rabbit anti-GATA3 (catalog no. ab199428; Abcam); mouse anti- Ini1/SMARCB1 (catalog no. SC-166165; Santa Cruz Biotechnology); rabbit anti-SMARCE1/BAF57 (catalog no. 33360; Cell Signaling Technology); rabbit anti-ERα (catalog no. SC-543; Santa Cruz Biotechnology); and mouse anti-TEAD4 (catalog no. ab58310; Abcam).
Coimmunoprecipitation was performed as described previously50. MCF7 cells were lysed in NP40 buffer supplemented with protease and phosphatase inhibitors. Cell lysates were incubated with BRG-1 antibody (2 μg; catalog no. SC-17796; Santa Cruz Biotechnology) overnight following incubation of agarose beads for 2 h. The immunocomplexes were washed three times with NP40 and then western blot was performed as described earlier using the following antibodies: BAF155/SMARCC1 (catalog no. SC-10756; Santa Cruz Biotechnology); Ini1/SMARCB1; BAF57/SMARCE1 (catalog no. A300–810A; Bethyl Laboratories); ARID1B (catalog no. A301–046A; Bethyl Laboratories); and ARID1A.
Crystal violet and cell counting-based survival assay.
For the drug treatment experiment, 45,000 MCF7 cells with individual sgRNAs were seeded per well with fulvestrant, GDC-0927 or DMSO into 12-well plates for crystal violet assay or 700,000 MCF7 cells were seeded per dish for cell counting-based assays into 10-cm dishes. On day 12, the experiments were stopped for staining with 0.1% crystal violet or stopped for cell counting. Further details on the methods used are provided in the Supplementary Note.
Cell competition assay.
For the assay with the MDA-MB-415 cell line, cells were infected with ARID1A-sg1-red fluorescent protein (RFP), ARID1A-sg2-RFP, sgNT-green fluorescent protein (GFP) or sgCOPGFP-GFP lentivirus. On day 0, GFP+ and RFP+ cells were mixed at 1:1 ratio into 4 distinct groups; 100,000 mixed cells were seeded per well with 100 nM fulvestrant or DMSO into 6-well plates. On day 7, the cells in the DMSO groups were split at 1:6 and the cells in the fulvestrant treatment groups were refreshed with fulvestrant. On day 14, the cells from the different groups were subjected to flow cytometry analysis. The FlowJo software v.10.5.3 (BD) was used for the FACS data analysis. Similar methods were also performed with the MCF7 cell line infected with SMARCB1 sgRNAs-RFP, SMARCE1 sgRNAs-RFP, sgNT-RFP or sgNT-GFP lentivirus with the exception that 80,000 mixed cells were seeded per well; on day 6, the cells in the DMSO groups were split at 1:6, and the cells in the fulvestrant treatment groups were refreshed with fulvestrant; on day 9, cells were subjected to flow cytometry analysis.
Cell cycle distribution analyses by FACS.
Three sets of controls, sgARID1A-2 or sgARID1A-3 MCF7 cells in biological replicates were cultured: (1) cells were cultured in complete growth medium for 48 h; (2) cells were serum starved for 24 h to synchronize most cells at the G1 phase; (3) cells were serum starved for 24 h and stimulated with complete growth medium for 24 h. DNA content after propidium iodide staining was analyzed by flow cytometry.
In vivo tumor xenograft.
All mouse experiments were approved by the Memorial Sloan Kettering Cancer Center (MSKCC); 0.18 mg of 90-d release estrogen pellets were transplanted into 6-week-old female NSG mice 3 d before tumor cell transplantation. On day 0, 10 million ARID1A KO cells or ARID1A WT cells per mouse were orthotopically transplanted and tumor growth was monitored twice a week. Mice were randomized to the fulvestrant (3 mg per mouse per week) or untreated control groups when they reached a volume of about 60 mm3 (day 9) and treated with fulvestrant for 13 weeks. After fulvestrant discontinuation, tumor size continued to be measured twice a week across the entire experiment for 188 d. All relevant ethical regulations were complied with.
ATAC-seq and ATAC-seq analysis.
ATAC-seq was performed as described previously42,51 with the exception that 0.2% NP40 was used for cell lysis. Raw reads were trimmed with trimmomatic52 v.0.35, with the following parameters: TruSeq3-PE adapters, LEADING:3 TRAILING:3 SLIDINGWINDOW:4:15 MINLEN:36. Each sample was aligned to the hg38 genome using Bowtie 2 (ref.53) v.2.2.6, with the following parameters: -X2000 --local --mm --no-mixed --no-discordant. Duplicate reads were then removed with MarkDuplicates v.2.9.0 (REMOVE_ DUPLICATES = True). To account for Tn5 shift, all positive strand reads in each sample were shifted by +4 base pairs (bp) and all negative strand reads were shifted by −5 bp. Peak calling was first performed after pooling all samples using MACS2 (ref.54) v.2.1.0, with the following parameters: --nomodel --extsize 150 --shift −−75 --slocal 5000 --llocal 20000 -B --keep-dup all −p 0.05). Peak calling was then performed on individual samples (−p 0.01). Each group of replicate samples and the peaks called from the pooled samples were then used with the irreproducible discovery rate to identify reproducible peaks (irreproducible discovery rate < 0.05). After identification of reproducible peaks, an atlas of peaks was created by retaining the reproducible peaks present in at least one sample. Annotation of peaks to genic parts and genes was conducted as described previously52. The summarized overlaps function of GenomicRanges55 (v.1.36.0) was used to count reads across all peaks in the atlas. Differential peak analysis was conducted using the generalized linear model function of DESeq2 (ref.56 (v.1.18.0)).
For Fig. 2b, DESeq2 was used to find the differential peaks between ARID1A KO versus WT while controlling for the effect of fulvestrant treatment by fitting a two factor generalized linear model as follows: all three distinct sgRNAs against ARID1A were treated as replicates to find only peaks where the difference was consistent among replicates; the results were then filtered for significantly differential peaks for the effect of ARID1A KO (genotype) after accounting for treatment, requiring an absolute log2 fold change > 0.5 and adjusted P < 0.05; the results were plotted with pheatmap v.1.0.12 (scale = “row”, clustering. metho d = “ward.D”).
ATAC-seq transcription factor motif analysis.
All peaks in the atlas were first scanned with Find Individual Motif Occurrences (FIMO) v.4.11.4 to find motif occurrences26. The CIS-BP database was filtered as described elsewhere57 and used as the source of transcription factor motifs. The result was converted into a binary matrix (all peak in the atlas × all queried transcription factors) where only transcription factors expressed with normalized read counts >50 in MCF7 WT or ARIDlA KO RNA-seq samples were used. This matrix (x), along with the log2 fold change from the differential peak analysis between ARIDlA KO versus WT samples (y), was used in the following ridge regression framework to predict which transcription factor motifs were differentially accessible.
Fivefold cross-validation was used to optimize lambda using Glmnet58 v.2.0–18 (family = “gaussian”). To calculate the significance of the regression coefficient for each transcription factor, the ridge package v.2.4 was used to train a ridge regression model on all data using the optimized lambda. Multiple hypothesis correction was done using the Benjamini-Hochberg (FDR) method in R v.3.6.0. The results were then filtered using an FDR < 0.01 and the resulting coefficient vector was plotted. The coefficients are learned ridge regression coefficients and the absolute number does not have a direct interpretation; rather, the coefficients are simply used to rank the hits. Higher absolute coefficients correspond to greater change in chromatin accessibility on ARIDlA KO.
For Extended Data Fig. 3k, differentially accessible peaks were first defined using single-factor DESeq2 generalized linear modeling. Then, the log2 fold changes for each comparison were calculated separately. These two lists of log2 fold changes were used to train two separate ridge regression models to find the coefficients for each transcription factor in different conditions. Correlation between both coefficients was calculated using Pearson correlation.
RNA, cDNA and RT-qPCR.
RNA was isolated using the QIAGEN RNeasy Kit. cDNA was prepared using the Bio-Rad cDNA synthesis kit. cDNA was amplified by real-time RT-qPCR using the SYBR Select Master Mix (Applied Biosystems) in the ViiA 7 Real-Time PCR system (Thermo Fisher Scientific). The reactions were carried out in triplicate. The mRNA expression primers are shown in Supplementary Table 7.
RNA-seq analysis.
FASTQC v.0.11.4 was first used to ensure sequencing quality was uniform across samples. Raw reads were aligned using STAR59 v.2.5.0b, using default parameters to the hg38 genome. Read counting was performed using htseq-count60 v.0.9.1 (parameters: --stranded = no -t exon). Differential expression was conducted using DESeq2 (ref.56) v.1.18.0. The heatmap of differential genes was created using pheatmap v.1.0.10 (parameters: scale = “row”) and variance- stabilizing-transformed counts from DESeq2. Pre-ranked GSEA v.2.2.1 was used to perform gene set enrichment analysis using log2 fold change for ranking. The estrogen deprivation RNA-seq analyses are shown in the Supplementary Note.
ChIP-seq and ChlP-qPCR.
ChIP-seq of ERα (catalog no. SC-543; Santa Cruz Biotechnology), H3K27ac (catalog no. ab4729; Abcam), GRHL1 (catalog no. NBP1–81321; Novus Biologicals) and FOXA1 (catalog no. ab23738; Abcam) antibodies, and ChIP-qPCR of TEAD4, cFos (catalog no. 2250; Cell Signaling Technology), JUND (catalog no. 61403; Active Motif), GATA3 (catalog no. SC-268; Santa Cruz Biotechnology) antibodies was performed as described previously61. Briefly, cell samples were cross-linked with 1% formaldehyde for 10 min and quenched by glycine to a 125 nM final concentration. The fixed cells were lysed in SDS buffer and the chromatin was sheared by Covaris sonication. The sheared chromatin was incubated with the aforementioned antibodies and protein G Dynabeads (Thermo Fisher). The samples underwent de-cross-linking, and RNase and proteinase K treatment. The primers for ChIP-qPCR are shown in Supplementary Table 7. Fold enrichment was defined based on percentage input of gene of interest over percentage input of actin as a control. For ChIP-seq, DNA fragments were eluted using Agencourt AMPure XP beads, the library was prepared and samples were subjected to high-throughput sequencing using the HiSeq 2000 Sequencing System (Illumina).
BAF155 and BRG1 ChIP-seq were performed as described by Nakayama et al.17. BAF155–2 (catalog no. SC-9746; Santa Cruz Biotechnology) and BRG1–2 (catalog no. ab110641; Abcam) ChIP-seq analyses were performed as described by Mathur et al.16 and are detailed in the Supplementary Note.
ChIP-seq analysis.
Reads were trimmed and aligned, and duplicates removed similar to the ATAC-seq analysis. Peak calling was performed using MACS2 (ref.54) (parameters: --keep-dup all -g hs -q 0.01). Read counting was performed using GenomicRanges55 and DESeq2 (ref.56) was used to get the scaling factors for normalization. bigWig tracks were generated using MACS2 and then scaled using rtracklayer v.1.40.6. IGV v.2.4.3 was used to visualize the bigWig tracks. The BRG1 and BAF155 common peaks were defined by first creating an atlas of peaks across both transcription factor ChIP-seq experiments and in both ARIDlA KO and WT samples. Then, a peak was annotated as common if it was found either in BRG1 WT and BAF155 WT or BRG1 KO and BAF155 KO samples. Motif analysis for common peaks in BRG1 and BAF155 was performed by first scanning each region for motif occurrences using FIMO26 and then visualized for enrichment using CentriMo62 v.4.11.4. The total number of peaks per ChIP-seq sample are shown in Supplementary Table 6.
Peak heatmaps.
deepTools63 v.3.1.3, along with size factor-scaled bigWig tracks, was used to generate heatmaps of peak profiles. First, computeMatrix was used to bin a ±2-kilobase (kb) region around the peak summit in 10 bp bins. Then, plotHeatmap was used to sort the genomic regions in descending order, based on the mean value per region, and then plot the peak profiles across samples.
The signal levels in these plots were also quantified using box plots after taking a row-wise mean across bins of signal per sample. To assess the significance of the difference in distributions shown in these box plots, we used a one-sided Mann-Whitney U-test. The test was performed using the ‘coin’ package v.1.3–0 in R. We also reported the effect size of each test using Rosenthal’s coefficient, which is defined as follows: , where Z is the standardized value of the U statistic, as calculated by the coin package, and N is the total number of observations. This test was used to quantify the differences in signal distributions shown in the box and ECDF plots in Figs. 2e, 3b, 4c, 5b,e,f and Extended Data Fig. 5b,f. The log2 fold change, which was calculated as log2 (mean KO/mean control), is also shown in these figures.
Peaks for each transcription factor in Fig. 4f were derived from FIMO analysis on BAF155/BRG1 peaks that are lost on ARIDlA KO. The peak set defined by each transcription factor motif was plotted using deepTools and the respective ChIP-seq samples from our own data or the ENCODE consortium (accession nos. are shown in the figure legend).
ATAC-seq and RNA-seq integration analyses.
Figure 3 b was generated by taking differentially accessible peaks as defined in Fig. 3a and defining the ‘No Change’ group as any peak that was not differentially accessible. These peaks were then mapped to their nearest gene. The differential expression (log2 fold change) of these nearest genes was then plotted as an empirical cumulative distribution function (ECDF) plot. The statistical significance and effect sizes for the difference between the distributions was calculated using the Mann-Whitney U-test described for the box plots.
Extended Data Fig. 6a was generated by first curating all peaks where FOXA1, GRHL1, JUND, FOS, GATA3 and TBX1 were predicted to bind using FIMO. The ‘No Binding Sites’ group was then defined as all peaks that did not contain any binding sites for these transcription factors. All peaks were then mapped to the nearest gene and their differential gene expression (log2 fold change) was plotted as an ECDF. The statistical significance and effect sizes for each distribution were calculated as outlined earlier.
‘Nested’ control study of patient selection and patient sample RNA-seq.
We studied the role of ARIDlA loss in modulating the expression of basal/luminal markers in a ‘nested’ case-control study of patients with ER+ breast cancer who have undergone targeted sequencing using MSK-IMPACT. We identified six ARIDlA mutant ER+ breast cancer samples that have either homozygous deletion or truncating mutations accompanied by loss of heterozygosity of the WT allele (biallelic loss of ARIDlA) from our institution, to be compared with six WT patient samples for ARIDlA. We obtained loss of heterozygosity information for the ARIDlA gene using FACETS64 v.0.3.9. The ARIDlA mutant samples were matched to ARIDlA WT tumors based on the following criteria: histological subtype; sample type (primary versus metastatic); prior treatment exposure; tumor stage; menopausal status; and age at diagnosis. Formalin-fixed paraffin-embedded (FFPE) slides from each tumor were reviewed and laser-microdissected by a certified pathologist to enrich for tumor cellularity greater than 70%, as described previously65. High-quality RNA was extracted to perform RNA-seq assays and analyzed as outlined earlier. Patients consented to MSKCC institutional review board (IRB) protocol no. 17–364. Patients were separately consented to MSKCC IRB protocol no. 12–245 for next-generation sequencing of their tumors (MSK-IMPACT) and for FFPE pathology staining. All relevant ethical regulations were complied with.
Survival analysis.
Survival analysis was performed as described previously22. A total of 2,752 breast tumor specimens from 2,475 patients underwent prospective genomic profiling between April 2014 and May 2019, with approximately half of them being metastatic. The characteristics of the patients are provided in Razavi et al.22 and in Supplementary Table 8. Details of the methods used are provided in the Supplementary Note.
Statistics and reproducibility.
To identify genes with mutations enriched in metastatic patients, metastatic MSK patient samples were compared to a cohort of primary breast cancers that combined both the TCGA cohort and MSK patients with sequenced primary samples as described previously22. Each gene had mutations present in at least five patients to be considered part of the analyses.
P values were based on Fisher’s exact test, which compared the number of primary samples with mutations in the given gene to those present in metastatic samples. The P values were corrected for multiple analyses using the Benjamini-Hochberg method. For the effect size, we used the Mann-Whitney 17-test with Rosenthal’s coefficient. Additional statistical analyses are detailed in the respective Methods section. All western blot experiments were repeated three times with similar results. All uncropped western blots are provided in the Source Data.
Reporting Summary.
Further information on research design is available in the Nature Research Reporting Summary linked to this article.
Data availability
Sequencing data have been deposited with the Gene Expression Omnibus under accession no. GSE124228. The epigenome CRISPR-CAS9 screen information can be found in Supplementary Table 2. Source data for Figs. 1 and 3 and Extended Data Figs. 2–6 are available online.
Extended Data
Extended Data Fig. 1 |. Enrichment of mutations of core subunits of the SWI/SNF complex in HR+ HER2- breast cancer.
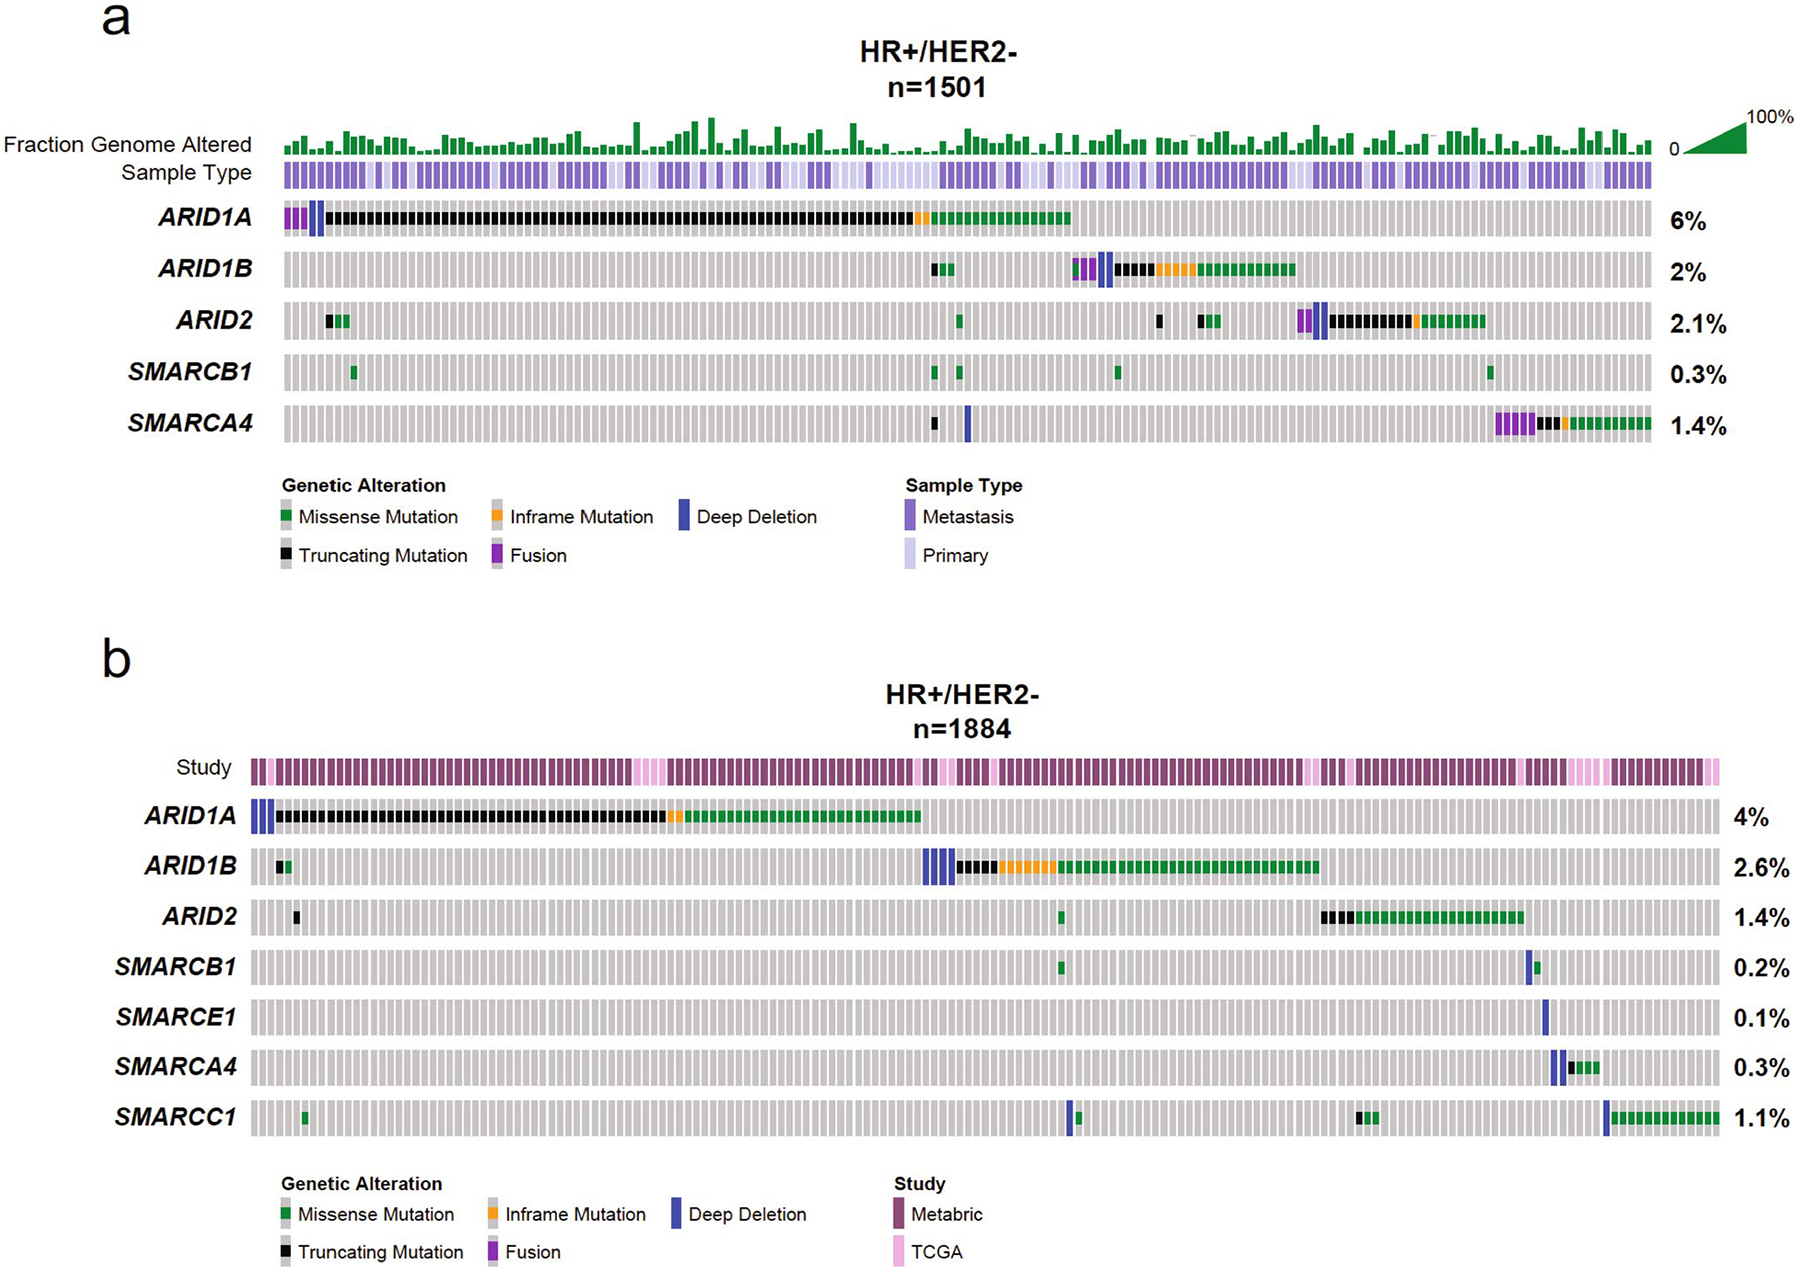
(a) Mutation enrichment based on IMPACT study. (b) Mutation enrichment based on TCGA and METABRIC studies.
Extended Data Fig. 2 |. Loss of SWI/SNF complex subunits mediate resistance to endocrine therapy.
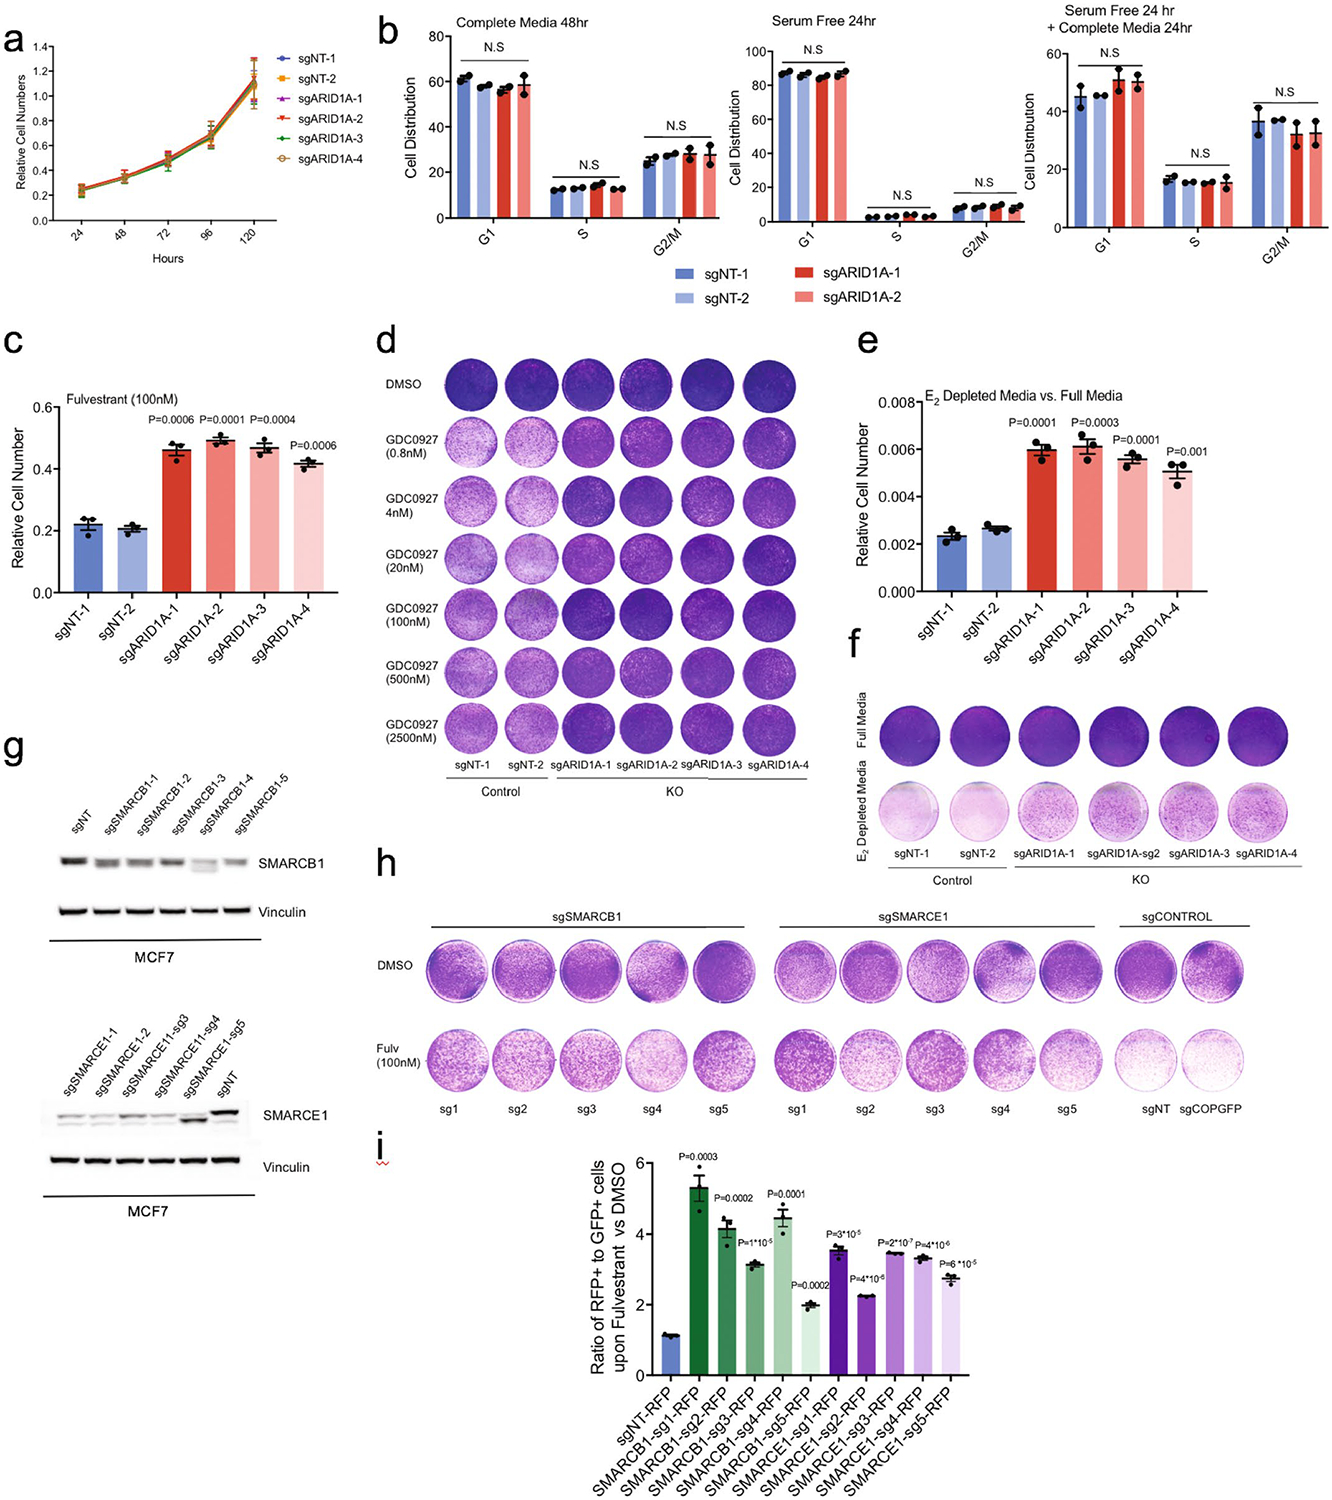
(a) In vitro proliferation of ARID1A knockout (KO) MCF7 cells as measured by cell quantification. (b) Cell cycle distributions as measured by FACS analyses of control and ARID1A KO MCF7 cells. Error bars=mean ±SEM, n=2 biologically independent samples, center values are means. P values were calculated using two-way ANOVA test; all P values > 0.2. N.S=non-significant. (c) Cell quantification of ARID1A KO vs. control cells upon fulvestrant treatment (100nM). (d) In vitro proliferation assay in ARID1A KO vs. control cells upon a dose response of the ER degrader GDC0927. The experiments were repeated thrice with similar results. (e) Cell quantification of ARID1A KO vs. control cells under estrogen (E2) depleted media vs. full media. (f) In vitro proliferation assay of ARID1A KO vs. control cells in estrogen depleted media and full media. The experiments were repeated thrice with similar results. (g) Cropped western blot of SMARCB1 or SMARCE1 KO (sg1-sg5) vs. control MCF7 cells. (h) In vitro proliferation assay in SMARCB1 or SMARCE1 KO vs. control MCF7 cells upon treatment with fulvestrant (100nM). The experiments were repeated three times with similar results. (i) The ratio of RFP+ SMARCB1 or SMARCE1 (sg1-sg5) knockout cells to GFP+ control cells (sgNT-GFP) upon DMSO or fulvestrant treatment (100nM) for 8 days as measured by flow cytometry. For (a), (c), (e), (i), error bars=mean ±SEM, n=3 biologically independent samples, center values are means. P values, Student’s two-sided t test.
Extended Data Fig. 3 |. ARID1A knockout leads to equal chromatin accessibility changes in DMSO or fulvestrant setting.
(a) Cropped western blot with indicated antibodies in MCF7 cells. (b) Pie chart of peak distributions to various genic parts. (c) ATAC-seq analysis revealed 59,000 peaks in total; 33% in intergenic regions, ~30% in promoter regions, and 35% in intron regions. Violin plot shows probability density of peaks across the samples. (d) Heatmap of differential peaks in control vs. ARID1A KO (knockout) upon DMSO or fulvestrant (fulv) treatment (absolute log2 fold change > 0.5, Benjamini-Hochberg adjusted P < 0.05). (e) ChIP-qPCR analyses of TEAD4 binding in control and ARID1A KO MCF7. Error bars=mean ±SEM, n=2 biologically independent samples, center values are means. P values, Student’s two-sided t test. (f) Cropped western blot of TEAD4 in control and ARID1A KO MCF7. (g) Crystal violet assay of TEAD4 knockdown cells in control and ARID1A KO upon DMSO or fulvestrant (100nM). (h) Cropped western blot of GATA3 overexpression in MCF7 (n=3). (i) In vitro proliferation of GATA3 overexpressed cells in control and ARID1A KO setting upon DMSO or fulvestrant treatment (100nM). The experiments were repeated thrice with similar results. (j) Cell quantification of GATA3 overexpressed cells in control and ARID1A KO setting upon DMSO or fulvestrant treatment (100nM). Error bars=mean ±SEM, n=3 biologically independent samples, center values are means. P values, Student’s two-sided t test. (k) Learned coefficients of transcription factors motifs that gain or lose enrichment in control vs. ARID1A KO in DMSO or fulvestrant (n=15 samples).
Extended Data Fig. 4 |. ARID1A loss mediates a basal-like gene expression.
(a) Volcano plot; x-axis is log2 fold change and y-axis represents -log10(P); n=18 samples, statistical by DESeq2. (b) mRNA levels of luminal and basal-like/stemness markers in control and ARID1A KO cells. Error bars=mean ±SEM, n=2 biologically independent samples, center values are means. *P value<0.05, ** P value<0.01, Student’s two-sided t test. (c) Cropped western blot of indicated antibodies. (d) mRNA levels of aforementioned markers in MCF7 upon addition of doxycycline (DOX) knockdown of ARID1A. Error bars=mean ±SEM, n=2 biologically independent samples, center values are means. *P value<0.05, ** P value<0.01, Student’s two-sided t test. Also shown are ARID1A and vinculin levels. (e and f) Cropped western blot with indicated antibodies in BT474 or MDA-MB-361 cells expressing sgNT and two sgRNAs against ARID1A. (g and h) Enrichment of basal-like signatures in BT474 (Charafe breast cancer luminal vs. basal down) or MDA-MB-361 (Huper breast basal vs. luminal up) upon ARID1A KO. (n=6 per cell type, nominal P values and FDR adjusted P values were calculated using GSEA package.) (i and j) Enrichment of basal-like and estrogen response signatures in MCF7 after SMARCB1 or SMARCE1 knockout; n=8 per gene knockout, nominal P values and FDR adjusted P values were calculated using GSEA package. (k) Enrichment of basal-like signatures in ARIDlA wild type vs. biallelic loss of ARIDlA of patient sample pairs (*, FDR < 0.25;). n=2 for each patient pair, nominal P values and FDR adjusted P values were calculated using GSEA package).
Extended Data Fig. 5 |. SWI/SNF binding to chromatin but not complex assembly is lost upon ARID1A loss.
(a) BAF155–2 and BRG1–2 at BAF155/BRG1 binding sites in control and ARID1A KO MCF7 cells (n=1). (b) Box plot representing mean signal across differential BAF155–2 or BRG1–2 after ARID1A KO at BAF155/BRG1 sites. (c) Cropped western blots of co-immunoprecipitation of BRG1 with subunits of the SWI/SNF complex in control and ARID1A KO MCF7. (d) Plot of the fold change between control and ARID1A KO of ATAC-seq sites vs. similar fold change of BAF155/BRG1 sites; n=14838 peaks, R and P values calculated using spearman correlation from ggpubr package in R. (e) BAF155–2 and BRG1–2 at differential accessible sites in control and ARID1A KO MCF7. (f) Box plot representing mean signal across differential BAF155–2 or BRG1–2 after ARID1A KO at lost accessible sites. (g) ChIP-qPCR analysis of ER, FOXA1, and GATA3 in shared loci in control and ARID1A KO cells. (h) ChIP-qPCR analysis of FOS, JUN, and IgG control. (i) ChIP-seq tracks of BRG1 and BAF155 in control and ARID1A KO cells (n=1). For (g) and (h), error bars=mean ±SEM, n=3 biologically independent samples, center values are means. P values, Student’s two-sided t test. For the box plots P-values, Mann-Whitney U test (Wilcoxon rank-sum test, two-sided) and effect size (rosenthal’s coefficient) are shown. The log2FC which is calculated as log2 (mean KO / mean Control) is also indicated (n=6). Box shows 25th, median and 75th percentiles with whiskers extending to ± 1.5 * IQR.
Extended Data Fig. 6 |. ARID1A regulates the expression of nuclear hormone receptors in breast cancer.
(a) ECDF plot of log2 fold changes in gene expression between ARID1A knockout and control for genes nearest to the TSS-distal SWI/SNF binding sites at GRHL1, FOXA1, FOS, JUN, GATA3, and ER motifs loci. P values were measured by the Mann-Whitney U test (Wilcoxon rank-sum test, two-sided) and effect size (rosenthal’s coefficients. The log2FC (fold change) values which are calculated as log2 (mean KO / mean Control) are also indicated (n=9). (b) Expression of ER canonical targets in control and ARID1A knockout MCF7 cells. Error bars=mean ±SEM, n=3 biologically independent samples, center values are means. P values, Student’s two-sided t test. (c) Cropped western blot of AR+ TNBC breast cancer cells BT549 and HCC70 with the indicated antibodies. (d) and (e) Cropped western blot with the indicated antibodies of control and ARID1A knockout BT549 or HCC70. (f) and (g) GSEA of androgen response in BT549 and HCC70 after ARID1A knockout; n=8 for each cell line, nominal P values and FDR adjusted P values were calculated using GSEA package.
Supplementary Material
Acknowledgements
We thank the Center for Epigenetics Research at MSKCC for help with the ATAC-seq and ChIP-seq assays, and E. de Stanchina and the Antitumor Assessment Core Facility for help with xenografts establishment. We also thank the Baselga and Scaltriti laboratory members for helpful advice and discussions. We thank A. Del from the Department of Pathology at MSKCC for the procurement of the FFPE slides. This work has been supported by National Institutes of Health grant nos. P30 CA008748 and RO1CA190642-01A1, the Breast Cancer Research Foundation grant no. BCRF-17-013. E.T. and M. Scaltriti are supported by a kind gift from B. Smith. E.L. is supported by grant no. NCI K00CA212478. This work was also supported by grants from Stand Up to Cancer (Cancer Drug Combination Convergence Team) grant no. SU2C 2015-004, the V Foundation grant no. D2015-036 and the National Science Foundation grant no. PHY-1545853 (G.X. and M. Scaltriti). This work was also funded by a U54 award grant no. CA209975-01 to C.S.L. E.C. is a recipient of an MSK Society Scholar Prize.
Footnotes
Competing interests
M.Scaltriti has received research funds from Puma Biotechnology, Daiichi Sankyo, Immunomedics, TargImmune Therapeutics and Menarini Ricerche, is a cofounder of Medendi Medical Travel and is on the advisory board of Menarini Ricerche. C.K. is a scientific founder, fiduciary Board of Directors member, Scientific Advisory Board member, shareholder and consultant for Foghorn Therapeutics. R.L.L. is on the supervisory board of QIAGEN and is a scientific advisor to Loxo Oncology, Imago, C4 Therapeutics and Isoplexis, each including an equity interest. He receives research support from and consulted for Celgene and Roche, has received research support from Prelude Therapeutics and has consulted for Incyte, Novartis, MorphoSys and Janssen. He has received honoraria from Eli Lilly and Amgen for invited lectures and from Gilead Sciences for grant reviews. J.B. is an employee and shareholder of AstraZeneca, Board of Directors member of Foghorn Therapeutics and is a past board member of Varian Medical Systems, Bristol-Myers Squibb, Grail, Aura Biosciences and Infinity Pharmaceuticals. He has performed consulting and/or advisory work for Grail, PMV Pharma, ApoGen Biotechnologies, Juno, Eli Lilly, Seragon Pharmaceuticals, Novartis and Northern Biologics. He has stock or other ownership interests in PMV Pharma, Grail, Juno, Varian Medical Systems, Foghorn Therapeutics, Aura Biosciences, Infinity Pharmaceuticals and ApoGen Biotechnologies, as well as Tango Therapeutics and Venthera, of which he is a cofounder. He has previously received honoraria or travel expenses from Roche, Novartis and Eli Lilly. P.R. has received consultation fees from Novartis and institutional research funds from Grail and Illumina. J.S.R. is a consultant of Goldman Sachs and Repare Therapeutics, a member of the Scientific Advisory Board of VolitionRx and Paige (Artificial Intelligence) and an ad hoc member of the Scientific Advisory Board of Ventana Medical Systems, Roche, Genentech, Novartis and InviCRO, outside of the scope of the submitted work. E.T. has received honoraria from AstraZeneca for invited lectures. No potential conflicts of interests were disclosed by the other authors.
Extended data is available for this paper at https://doi.org/10.1038/s41588-019-0554-0.
Supplementary information is available for this paper at https://doi.org/10.1038/s41588-019-0554-0.
Reprints and permissions information is available at www.nature.com/reprints
Publisher’s note Springer Nature remains neutral with regard to jurisdictional claims in published maps and institutional affiliations.
Online content
Any methods, additional references, Nature Research reporting summaries, source data, extended data, supplementary information, acknowledgements, peer review information; details of author contributions and competing interests; and statements of data and code availability are available at https://doi.org/10.1038/s41588-019-0554-0.
References
- 1.Perou CM et al. Molecular portraits of human breast tumours. Nature 406, 747–752 (2000). [DOI] [PubMed] [Google Scholar]
- 2.Sorlie T et al. Gene expression patterns of breast carcinomas distinguish tumor subclasses with clinical implications. Proc. Natl Acad. Sci. USA 98, 10869–10874 (2001). [DOI] [PMC free article] [PubMed] [Google Scholar]
- 3.Koboldt DC et al. Comprehensive molecular portraits of human breast tumours. Nature 490, 61–70 (2012). [DOI] [PMC free article] [PubMed] [Google Scholar]
- 4.Stephens PJ et al. The landscape of cancer genes and mutational processes in breast cancer. Nature 486, 400–404 (2012). [DOI] [PMC free article] [PubMed] [Google Scholar]
- 5.Ciriello G et al. Comprehensive molecular portraits of invasive lobular breast cancer. Cell 163, 506–519 (2015). [DOI] [PMC free article] [PubMed] [Google Scholar]
- 6.Banerji S et al. Sequence analysis of mutations and translocations across breast cancer subtypes. Nature 486, 405–409 (2012). [DOI] [PMC free article] [PubMed] [Google Scholar]
- 7.Shah SP et al. The clonal and mutational evolution spectrum of primary triple-negative breast cancers. Nature 486, 395–399 (2012). [DOI] [PMC free article] [PubMed] [Google Scholar]
- 8.Ellis MJ et al. Whole-genome analysis informs breast cancer response to aromatase inhibition. Nature 486, 353–360 (2012). [DOI] [PMC free article] [PubMed] [Google Scholar]
- 9.Nik-Zainal S et al. Landscape of somatic mutations in 560 breast cancer whole-genome sequences. Nature 534, 47–54 (2016). [DOI] [PMC free article] [PubMed] [Google Scholar]
- 10.Pereira B et al. The somatic mutation profiles of 2,433 breast cancers refines their genomic and transcriptomic landscapes. Nat. Commun 7, 11479 (2016). [DOI] [PMC free article] [PubMed] [Google Scholar]
- 11.Green KA & Carroll JS Oestrogen-receptor-mediated transcription and the influence of co-factors and chromatin state. Nat. Rev. Cancer 7, 713–722 (2007). [DOI] [PubMed] [Google Scholar]
- 12.Schiavon G et al. Analysis of ESRl mutation in circulating tumor DNA demonstrates evolution during therapy for metastatic breast cancer. Sci. Transl. Med 7, 313ra182 (2015). [DOI] [PMC free article] [PubMed] [Google Scholar]
- 13.Toy W et al. ESRl ligand-binding domain mutations in hormone-resistant breast cancer. Nat. Genet 45, 1439–1445 (2013). [DOI] [PMC free article] [PubMed] [Google Scholar]
- 14.Kadoch C et al. Proteomic and bioinformatic analysis of mammalian SWI/SNF complexes identifies extensive roles in human malignancy. Nat. Genet 45, 592–601 (2013). [DOI] [PMC free article] [PubMed] [Google Scholar]
- 15.Garraway LA & Lander ES Lessons from the cancer genome. Cell 153, 17–37 (2013). [DOI] [PubMed] [Google Scholar]
- 16.Mathur R et al. ARID1A loss impairs enhancer-mediated gene regulation and drives colon cancer in mice. Nat. Genet 49, 296–302 (2017). [DOI] [PMC free article] [PubMed] [Google Scholar]
- 17.Nakayama RT et al. SMARCB1 is required for widespread BAF complex-mediated activation of enhancers and bivalent promoters. Nat. Genet 49, 1613–1623 (2017). [DOI] [PMC free article] [PubMed] [Google Scholar]
- 18.Wang X et al. SMARCB1-mediated SWI/SNF complex function is essential for enhancer regulation. Nat. Genet 49, 289–295 (2017). [DOI] [PMC free article] [PubMed] [Google Scholar]
- 19.Kelso TWR et al. Chromatin accessibility underlies synthetic lethality of SWI/SNF subunits in ARID1A-mutant cancers. eLife 6, e30506 (2017). [DOI] [PMC free article] [PubMed] [Google Scholar]
- 20.Bossen C et al. The chromatin remodeler Brg1 activates enhancer repertoires to establish B cell identity and modulate cell growth. Nat. Immunol 16, 775–784 (2015). [DOI] [PMC free article] [PubMed] [Google Scholar]
- 21.Mashtalir N et al. Modular organization and assembly of SWI/SNF family chromatin remodeling complexes. Cell 175, 1272–1288.e20 (2018). [DOI] [PMC free article] [PubMed] [Google Scholar]
- 22.Razavi P et al. The genomic landscape of endocrine-resistant advanced breast cancers. Cancer Cell 34, 427–438.e6 (2018). [DOI] [PMC free article] [PubMed] [Google Scholar]
- 23.Cheng DT et al. Memorial Sloan Kettering-integrated mutation profiling of actionable cancer targets (MSK-IMPACT): a hybridization capture-based next-generation sequencing clinical assay for solid tumor molecular oncology. J. Mol. Diagn 17, 251–264 (2015). [DOI] [PMC free article] [PubMed] [Google Scholar]
- 24.Pan J et al. Interrogation of mammalian protein complex structure, function, and membership using genome-scale fitness screens. Cell Syst. 6, 555–568.e7 (2018). [DOI] [PMC free article] [PubMed] [Google Scholar]
- 25.Sandoval GJ et al. Binding of TMPRSS2-ERG to BAF chromatin remodeling complexes mediates prostate oncogenesis. Mol. Cell 71, 554–566. e7 (2018). [DOI] [PMC free article] [PubMed] [Google Scholar]
- 26.Grant CE, Bailey TL & Noble WS FIMO: scanning for occurrences of a given motif. Bioinformatics 27, 1017–1018 (2011). [DOI] [PMC free article] [PubMed] [Google Scholar]
- 27.Hurtado A, Holmes KA, Ross-Innes CS, Schmidt D & Carroll JS FOXA1 is a key determinant of estrogen receptor function and endocrine response. Nat. Genet 43, 27–33 (2011). [DOI] [PMC free article] [PubMed] [Google Scholar]
- 28.Bernardo GM et al. FOXA1 is an essential determinant of ERa expression and mammary ductal morphogenesis. Development 137, 2045–2054 (2010). [DOI] [PMC free article] [PubMed] [Google Scholar]
- 29.Theodorou V, Stark R, Menon S & Carroll JS GATA3 acts upstream of FOXA1 in mediating ESR1 binding by shaping enhancer accessibility. Genome Res. 23, 12–22 (2013). [DOI] [PMC free article] [PubMed] [Google Scholar]
- 30.Asselin-Labat ML et al. Gata-3 is an essential regulator of mammary-gland morphogenesis and luminal-cell differentiation. Nat. Cell Biol 9, 201–209 (2007). [DOI] [PubMed] [Google Scholar]
- 31.Dravis C et al. Epigenetic and transcriptomic profiling of mammary gland development and tumor models disclose regulators of cell state plasticity. Cancer Cell 34, 466–482.e6 (2018). [DOI] [PMC free article] [PubMed] [Google Scholar]
- 32.Mu P et al. SOX2 promotes lineage plasticity and antiandrogen resistance in TP53- and RBl-deficient prostate cancer. Science 355, 84–88 (2017). [DOI] [PMC free article] [PubMed] [Google Scholar]
- 33.Britschgi A et al. The Hippo kinases LATS1 and 2 control human breast cell fate via crosstalk with ERα. Nature 541, 541–545 (2017). [DOI] [PMC free article] [PubMed] [Google Scholar]
- 34.Malta TM et al. Machine learning identifies stemness features associated with oncogenic dedifferentiation. Cell 173, 338–354.e15 (2018). [DOI] [PMC free article] [PubMed] [Google Scholar]
- 35.Wuidart A et al. Early lineage segregation of multipotent embryonic mammary gland progenitors. Nat. Cell Biol 20, 666–676 (2018). [DOI] [PMC free article] [PubMed] [Google Scholar]
- 36.Kadoch C et al. Dynamics of BAF-Polycomb complex opposition on heterochromatin in normal and oncogenic states. Nat. Genet 49, 213–222 (2017). [DOI] [PMC free article] [PubMed] [Google Scholar]
- 37.Miller EL et al. TOP2 synergizes with BAF chromatin remodeling for both resolution and formation of facultative heterochromatin. Nat. Struct. Mol. Biol 24, 344–352 (2017). [DOI] [PMC free article] [PubMed] [Google Scholar]
- 38.Sun X et al. Aridla has context-dependent oncogenic and tumor suppressor functions in liver cancer. Cancer Cell 32, 574–589.e6 (2017). [DOI] [PMC free article] [PubMed] [Google Scholar]
- 39.Vierbuchen T et al. AP-1 transcription factors and the BAF complex mediate signal-dependent enhancer selection. Mol. Cell 68, 1067–1082.e12 (2017). [DOI] [PMC free article] [PubMed] [Google Scholar]
- 40.Zaret KS & Carroll JS Pioneer transcription factors: establishing competence for gene expression. Genes Dev. 25, 2227–2241 (2011). [DOI] [PMC free article] [PubMed] [Google Scholar]
- 41.Lupien M et al. FoxA1 translates epigenetic signatures into enhancer-driven lineage-specific transcription. Cell 132, 958–970 (2008). [DOI] [PMC free article] [PubMed] [Google Scholar]
- 42.Toska E et al. PI3K pathway regulates ER-dependent transcription in breast cancer through the epigenetic regulator KMT2D. Science 355, 1324–1330 (2017). [DOI] [PMC free article] [PubMed] [Google Scholar]
- 43.Kuukasjarvi T, Kononen J, Helin H, Holli K & Isola J Loss of estrogen receptor in recurrent breast cancer is associated with poor response to endocrine therapy. J. Clin. Oncol 14, 2584–2589 (1996). [DOI] [PubMed] [Google Scholar]
- 44.Musgrove EA & Sutherland RL Biological determinants of endocrine resistance in breast cancer. Nat. Rev. Cancer 9, 631–643 (2009). [DOI] [PubMed] [Google Scholar]
- 45.Lindstrom LS et al. Clinically used breast cancer markers such as estrogen receptor, progesterone receptor, and human epidermal growth factor receptor 2 are unstable throughout tumor progression. J. Clin. Oncol 30, 2601–2608 (2012). [DOI] [PubMed] [Google Scholar]
- 46.Dieci MV et al. Discordance in receptor status between primary and recurrent breast cancer has a prognostic impact: a single-institution analysis. Ann. Oncol 24, 101–108 (2013). [DOI] [PubMed] [Google Scholar]
- 47.Caumanns JJ, Wisman GBA, Berns K, van der Zee AGJ & de Jong S ARID1A mutant ovarian clear cell carcinoma: a clear target for synthetic lethal strategies. Biochim. Biophys. Acta Rev. Cancer 1870, 176–184 (2018). [DOI] [PubMed] [Google Scholar]
- 48.Bitler BG et al. Synthetic lethality by targeting EZH2 methyltransferase activity in ARIDlA-mutated cancers. Nat. Med 21, 231–238 (2015). [DOI] [PMC free article] [PubMed] [Google Scholar]
- 49.Doench JG et al. Optimized sgRNA design to maximize activity and minimize off-target effects of CRISPR-Cas9. Nat. Biotechnol 34, 184–191 (2016). [DOI] [PMC free article] [PubMed] [Google Scholar]
- 50.Toska E et al. PI3K inhibition activates SGK1 via a feedback loop to promote chromatin-based regulation of ER-dependent gene expression. Cell Rep. 27, 294–306.e5 (2019). [DOI] [PMC free article] [PubMed] [Google Scholar]
- 51.Buenrostro JD, Giresi PG, Zaba LC, Chang HY & Greenleaf WJ Transposition of native chromatin for fast and sensitive epigenomic profiling of open chromatin, DNA-binding proteins and nucleosome position. Nat. Methods 10, 1213–1218 (2013). [DOI] [PMC free article] [PubMed] [Google Scholar]
- 52.Bolger AM, Lohse M & Usadel B Trimmomatic: a flexible trimmer for Illumina sequence data. Bioinformatics 30, 2114–2120 (2014). [DOI] [PMC free article] [PubMed] [Google Scholar]
- 53.Langmead B & Salzberg SL Fast gapped-read alignment with Bowtie 2. Nat. Methods 9, 357–359 (2012). [DOI] [PMC free article] [PubMed] [Google Scholar]
- 54.Feng J, Liu T, Qin B, Zhang Y & Liu XS Identifying ChIP-seq enrichment using MACS. Nat. Protoc 7, 1728–1740 (2012). [DOI] [PMC free article] [PubMed] [Google Scholar]
- 55.Lawrence M et al. Software for computing and annotating genomic ranges. PLoS Comput. Biol 9, e1003118 (2013). [DOI] [PMC free article] [PubMed] [Google Scholar]
- 56.Love MI, Huber W & Anders S Moderated estimation of fold change and dispersion for RNA-seq data with DESeq2. Genome Biol. 15, 550 (2014). [DOI] [PMC free article] [PubMed] [Google Scholar]
- 57.Philip M et al. Chromatin states define tumour-specific T cell dysfunction and reprogramming. Nature 545, 452–456 (2017). [DOI] [PMC free article] [PubMed] [Google Scholar]
- 58.Friedman J, Hastie T & Tibshirani R Regularization paths for generalized linear models via coordinate descent. J. Stat. Softw 33, 1–22 (2010). [PMC free article] [PubMed] [Google Scholar]
- 59.Dobin A et al. STAR: ultrafast universal RNA-seq aligner. Bioinformatics 29, 15–21 (2013). [DOI] [PMC free article] [PubMed] [Google Scholar]
- 60.Anders S, Pyl PT & Huber W HTSeq: a Python framework to work with high-throughput sequencing data. Bioinformatics 31, 166–169 (2015). [DOI] [PMC free article] [PubMed] [Google Scholar]
- 61.Chen CW et al. DOT1L inhibits SIRT1-mediated epigenetic silencing to maintain leukemic gene expression in MLL-rearranged leukemia. Nat. Med 21, 335–343 (2015). [DOI] [PMC free article] [PubMed] [Google Scholar]
- 62.Bailey TL & Machanick P Inferring direct DNA binding from ChIP-seq. Nucleic Acids Res. 40, e128 (2012). [DOI] [PMC free article] [PubMed] [Google Scholar]
- 63.Ramírez F, Dündar F, Diehl S, Gruning BA & Manke T deepTools: a flexible platform for exploring deep-sequencing data. Nucleic Acids Res. 42, W187–W191 (2014). [DOI] [PMC free article] [PubMed] [Google Scholar]
- 64.Shen R & Seshan VE FACETS: allele-specific copy number and clonal heterogeneity analysis tool for high-throughput DNA sequencing. Nucleic Acids Res. 44, e131 (2016). [DOI] [PMC free article] [PubMed] [Google Scholar]
- 65.Weinreb I et al. Hotspot activating PRKD1 somatic mutations in polymorphous low-grade adenocarcinomas of the salivary glands. Nat. Genet 46, 1166–1169 (2014). [DOI] [PMC free article] [PubMed] [Google Scholar]
Associated Data
This section collects any data citations, data availability statements, or supplementary materials included in this article.
Supplementary Materials
Data Availability Statement
Sequencing data have been deposited with the Gene Expression Omnibus under accession no. GSE124228. The epigenome CRISPR-CAS9 screen information can be found in Supplementary Table 2. Source data for Figs. 1 and 3 and Extended Data Figs. 2–6 are available online.