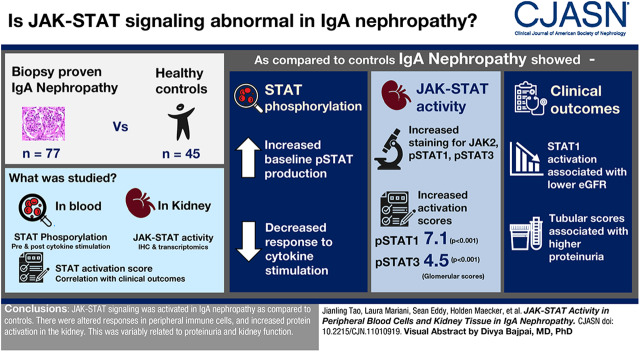
Visual Abstract
Keywords: IgA nephropathy, Cell Signaling, gene transcription, pathology, Glomerulonephritis, IGA, Glomerular Mesangium, Diabetic, Nephropathies, Glomerulosclerosis, Focal Segmental, Phosphorylation, Monocytes, Leukocytes, Mononuclear, Transcriptome, Kidney, Glomerulus, JAK2 protein, human, Janus Kinase 2, kidney, proteinuria, Biopsy
Abstract
Background and objectives
IgA nephropathy is the most common primary glomerular disease in the world. Marked by mesangial inflammation and proliferation, it generally leads to progressive kidney fibrosis. As the Janus kinase signal transducer and activator of transcription pathway has been implicated as an important mediator of diabetic kidney disease and FSGS, detailed investigation of this pathway in IgA nephropathy was undertaken to establish the basis for targeting this pathway across glomerular diseases.
Design, setting, participants, & measurements
Well characterized patients with IgA nephropathy and controls were studied, allowing us to compare 77 patients with biopsy-proven IgA nephropathy with 45 healthy subjects. STAT phosphorylation was assessed in peripheral blood monocytes (PBMCs) by phosphoflow before and after cytokine stimulation. Kidney Janus kinase signal transducer and activator of transcription activity was studied by immunofluorescence and by transcriptomic studies. An STAT1 activity score was established using downstream transcriptional targets of pSTAT1 and associated with disease and clinical outcomes.
Results
We found PBMCs to have upregulated pSTAT production at baseline in patients with IgA nephropathy with a limited reserve to respond to cytokine stimulation compared with controls. Increased staining in glomerular mesangium and endothelium was seen for Jak-2 and pSTAT1 and in the tubulointerstitial for JAK2, pSTAT1, and pSTAT3. Activation of the Janus kinase signal transducer and activator of transcription pathway was further supported by increased pSTAT1 and pSTAT3 scores in glomerular and tubulointerstitial sections of the kidney (glomerular activation Z scores: 7.1 and 4.5, respectively; P values: <0.001 and <0.001, respectively). Clinically, phosphoflow results associated with proteinuria and kidney function, and STAT1 activation associated with proteinuria but was not associated with progression.
Conclusions
Janus kinase signal transducer and activator of transcription signaling was activated in patients with IgA nephropathy compared with controls. There were altered responses in peripheral immune cells and increased message and activated proteins in the kidney. These changes variably related to proteinuria and kidney function.
Introduction
IgA nephropathy is the most common primary glomerular disease throughout the world. It is a leading cause of ESKD. It was first fully described by Berger and Hinglais in 1968 (1), and despite intensive study since, its pathophysiology remains incompletely understood, resulting in no specific therapy being available at this time (2).
Present understanding of IgA nephropathy revolves around a “multihit” hypothesis. Individuals are thought to be genetically predisposed as suggested by multiple genetic association studies in various populations (3). These individuals are then stressed, most likely by infection, resulting in prolonged responses of increased polymeric IgA production. This production is relatively restricted to IgA with galactose-deficient sialic acid chains in the hinge regions, which in turn, serve as antigen, leading to antiglycan antibodies. The immune complexes of all IgA antibody or mixed IgA-IgG complexes are able to bind to and deposit in the mesangium through receptor-like interactions, most notably with the transferrin receptor. What ensues from there, quite variably, is local inflammation and mesangial proliferation, in turn signaling injury and potential fibrosis in the mesangium, podocytes, and kidney tubular cells. Activation of complement and infiltration with mononuclear cells are thought to be malevolent processes, adding to the risk of disease progression (4,5).
We wished to further understand the mechanism of this kidney injury, focusing on signaling pathways by which the peripheral immune cells and native kidney cells might propagate inflammation and proliferation. We focused on the Janus kinase signal transducer and activator of transcription (JAK-STAT) pathway. JAK-STAT is a critical cellular pathway that responds to important extracellular signals, including cytokines and chemokines (6). Multiple lines of data from knockout transgenic animal models, kidney cell over expression studies, and human studies evaluating genetic profiles have demonstrated that JAK-STAT is broadly activated in diabetic kidney disease, autosomal dominant polycystic kidney disease, HIV-associated nephropathy, AKI, and even obstructive uropathy (7), where the JAK2-STAT3 pathway is predominantly involved. Therapeutic studies testing agents that inhibit the JAK-STAT pathway have already been launched in diabetic kidney disease and kidney transplantation (8,9). In primary glomerular disease, a study assessing PBMCs in three patients with worsening gross hematuria due to IgA nephropathy found a potentially important role of STAT1 in exacerbating the disease (10). Additionally, in vitro evidence suggests that inhibition of STAT signaling can reduce IgA1 autoantigen production in IgA nephropathy (11).
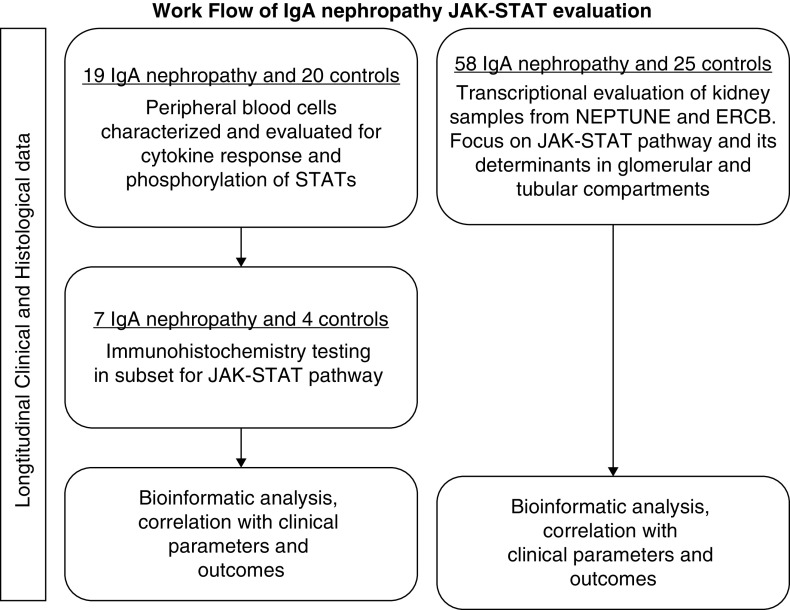
Because of the role that the JAK-STAT pathway plays in other glomerular diseases and the limited information implicating the pathway in IgA nephropathy, we sought to further evaluate the JAK-STAT pathway in the peripheral blood and kidneys of patients with IgA nephropathy. To investigate this, we evaluated peripheral blood cells, kidney tissue, and clinical courses in well defined patients with IgA nephropathy and healthy controls. The study scheme is depicted in Figure 1.
Figure 1.
Flow diagram of Janus kinase signal transducer and activator of transcription (JAK-STAT) IgA study. ERCB, European Renal cDNA Bank; NEPTUNE, Nephrotic Syndrome Study Network Consortium.
Materials and Methods
Patients
PBMCs were collected from 19 adult patients from the Stanford Kidney Clinic with biopsy-proven idiopathic IgA nephropathy (Figure 1) and 20 age- (43±15 years old) and sex-matched (10 men and 10 women) healthy controls. Patients were not on any active immunotherapy for at least 6 months prior to study. Their general characteristics are listed in Table 1. Patients were followed through their EMR reports. Kidney tissue from seven of these IgA patients (those with available unstained slides or sections) was studied by immunohistochemistry for JAK2, STAT3, pSTAT3, and pSTAT1. A separate group of 28 patients (Table 2) with biopsy-proven IgA nephropathy from the Nephrotic Syndrome Study Network Consortium (NEPTUNE) was also evaluated for clinical features and kidney transcriptomics. NEPTUNE, sponsored by the National Institutes of Health Rare Disease Clinical Research Network, is a multicenter, prospective cohort study enrolling patients with proteinuric glomerular disease and performing comprehensive clinical and molecular phenotyping (12). NEPTUNE patients have routine follow-up examination and laboratory evaluation every 3 months. Comparable healthy tissue was obtained from living transplant donors for comparison with NEPTUNE IgA patients (n=6). Additional IgA biopsy samples were also characterized and studied to validate findings from NEPTUNE (transcriptional group; patients from the European Renal cDNA Bank [ERCB]) (Figure 1, Table 3). Biopsy material from these cohorts was microdissected into glomerular and tubulointerstitial compartments prior to transcriptional profiling as previously described (12,13). Institutional review boards of Stanford University Medical Center and each of the participating centers in NEPTUNE and ERCB approved all of these studies.
Table 1.
Baseline characteristics of 19 adult patients with IgA nephropathy (PBMCs assayed by phosphoflow)
| Characteristic | At Sampling | At Last Clinical Visit |
|---|---|---|
| Women/men | 9/10 | |
| Age at biopsy (yr), mean ± SD | 35±11 | |
| Asian | 7 | |
| White | 8 | |
| Non-Hispanic/non-Latino | 2 | |
| Hispanic | 2 | |
| Sampling time postbiopsy (d), median (IQR) | 1568 (651–2352) | |
| Last visit after sampling (d), median (IQR) Oxford Scoring (MESTC) | 1283 (742–1745) | |
| M | 0.43±0.14 | |
| E | 0.17±0.34 | |
| S | 0.71±0.45 | |
| T | 0.29±0.45 | |
| C | 0.14±035 | |
| Serum creatinine, mg/dl, ± SD or median (IQR) | 1.6 (1–1.7) | 2.2±1.1 |
| Serum albumin, g/dl, mean ± SD | 3.7±0.3 | 3.7±0.21 |
| 24-h protein excretion, mg/d, median (IQR) | 1280 (351–1993) | 795 (459–1697) |
IQR, interquartile range; MESTC, Oxford scoring; M, mesangial hypercellularity; E, endocapillary proliferation; S, glomerular sclerosis; T, tubolointerstitial fibrosis; C, crescents.
Table 2.
Baseline characteristics of 28 patients with IgA nephropathy in the Nephrotic Syndrome Study Network Consortium with STAT score available (22 have glomerular score, 22 have tubulointerstitial score, and 16 have both scores)
| Characteristic | Value |
|---|---|
| Age, yr, mean (SD) | 42 (19) |
| Women, n (%) | 9 (32) |
| Black race, n (%) | 3 (11) |
| eGFR, ml/min per 1.73 m2, mean (SD) | 71 (31) |
| UPCR, mg/mg, median (IQR) | 1.96 (0.83–2.92) |
UPCR, urine protein to creatinine ratio; IQR, interquartile range.
Table 3.
Baseline characteristics of 30 patients with IgA nephropathy from the European Renal cDNA Bank with STAT score available (27 with glomerular score and 25 with tubulointerstitial score)
| Characteristic | Value |
|---|---|
| Age, yr, mean (SD) | 36.4 (14.3) |
| Women, n (%) | 10 (33) |
| Black race, n (%) | 0 (0) |
| eGFR, ml/min per 1.73 m2, mean (IQR) | 74.9 (7.59–157.25) |
| UPCR, mg/mg, median (IQR) | 2.3 (0.28–10.0) |
IQR, interquartile range; UPCR, urine protein to creatinine ratio.
Phosphoflow Assay
PBMCs were isolated using density gradient separation Ficoll-Paque Plus (Amersham Biosciences) and then cryopreserved. IgA nephropathy samples and control samples underwent similar processing and were batched together. For evaluation, cells were thawed, stored at room temperature for 1 hour, and counted before plating 0.5×10⁶ viable cells per 1 ml in a 96-well plate. Cells were then stimulated with 104 U/ml IFN-α, 50 ng/ml IFN-γ, 50 ng/ml IL-6, 50 ng/ml IL-7, 50 ng/ml IL-10, 50 ng/ml IL-2, or 50 ng/ml IL-21 prior to paraformaldehyde fixation and methanol permeabilization. Each well was barcoded using a combination of Pacific Orange and Alexa-750 dyes (Invitrogen, Carlsbad, CA), pooled in tubes, washed with FACS buffer (PBS supplemented with 2% FBS and 0.1% sodium azide), and stained with the following antibodies: BV421 to CD3, PerCP-Cy5.5 to CD4, PerCp-Cy5.5 to CD20, PE-Cy7 to CD33, BV510 to CD45RA, AlexaFluor 488 to pSTAT1, AlexaFluor 647 to pSTAT3, and PE to pSTAT5 (all from BD Biosciences, San Jose, CA). Following resuspension in FACS buffer, 100,000 cells per stimulation condition were collected using DIVA 6.0 software on an LSRII flow cytometer (BD Biosciences). Data acquisition was performed using FlowJo v 9.3, gating on live cells on the basis of forward versus side scatter profiles and then on singlets using forward scatter area versus height followed by cell subset–specific gating. Unstimulated cell populations were compared after log normalization. Following cytokine stimulation, fold change was calculated as any stimulant status/nonstimulant status. Fold change in any subset under any stimulant between control and IgA nephropathy was compared. The subset percentage of cells is shown in Supplemental Table 1. Phosphorylation of individual STAT1, -3, and -5 proteins in these cells from patients with IgA nephropathy (n=19) stimulated in vitro by IFN-α, IFN-γ, IL-6, IL-7, IL-10, IL-2, and IL-21 was compared with that of healthy controls (n=20) (Figure 2).
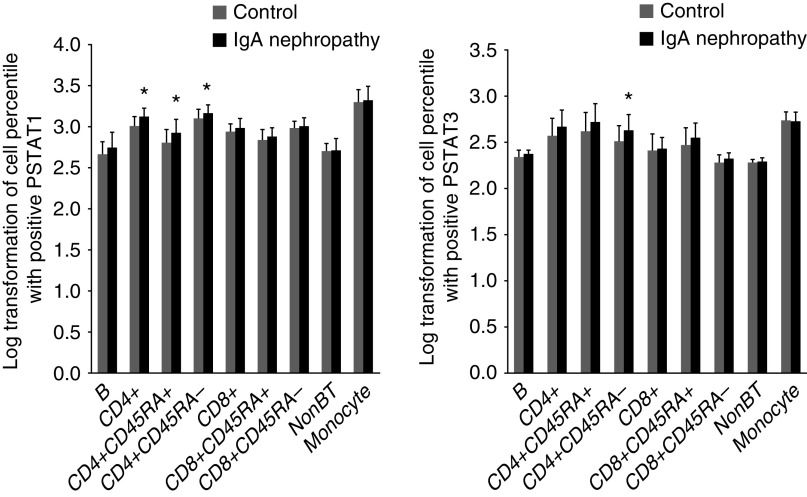
Figure 2.
Baseline log-transformed values of pSTAT1, and pSTAT3 in cell subsets of B lymphocytes, CD4+, CD4+CD45RA+, CD4+CD45RA−, CD8+, CD8+CD45RA+, CD8+CD45RA−, NK cells, and monocytes from patients with IgA nephropathy were compared with controls. *Compared with control by Wilcoxon analysis, P=0.05.
Immunohistochemistry Staining for CD3, JAK2, STAT3, pSTAT3, and pSTAT1
Starting with unstained paraffin fixed slides, antigen retrieval was done with citrate solution at pH 6.0. Normal serum was used to block the antigens for 30 minutes at room temperature. Primary antibodies—JAK2 (#3230; Cell Signaling), STAT3 (#9139; Cell Signaling), pSTAT3 (#9145; Cell Signaling), CD3 (DAKO CD3 Clone F7.28), and pSTAT1 (#8826; Cell Signaling)—were applied with a dilution of 1:200, 1:100, 1:2000, 1:200, and 1:200, respectively, for 60 minutes at room temperature. Second antibodies to rabbit Ig or mouse Ig (Vector Labs) were incubated for 30 minutes at room temperature. DAB was incubated for 3 minutes at room temperature to develop the staining. Hematoxylin was counterstained for 1 minute at room temperature.
RNA Preparation and Microarray Expression
Kidney tissues from biopsy samples were stored in RNAlater (ThermoFisher) and then manually microdissected into tubulointerstitial and glomerular fractions. In terms of glomerular injury, manual glomerular microdissection captures glomeruli with an open Bowman’s space. Therefore, across samples, our glomerular expression studies are enriched for the transcriptomes of intact glomeruli compared with globally sclerosed glomeruli. Affymetrix Human Genome U133 microarrays and Affymetrix Human Gene ST 2.1 Array platforms (ThermoFisher) were used to analyze further processed microdissected kidney biopsy specimens. Probe sets were annotated to Entrez Gene IDs using custom CDF version 19 generated from the University of Michigan nephropathy Brain Array group (14). Kidney tissue was processed as previously described (12,13). Expression data were quantile normalized and batch corrected using COMBAT (15). Differential gene expression across the transcriptome was compared between patients with IgA nephropathy and the controls using the SAM method (16). Differential expression of genes was defined with q value ≤0.05. CEL files are accessible in GEO (17) for the ERCB dataset (GSE10498 and GSE104948) and for the NEPTUNE cohort (GSE104066 and GSE133288). Differential expression analysis was performed using the SAM function in Multiple Experiment Viewer v4.9.
Functional Enrichment Analyses and STAT1-Dependent Signature Generation
Functional enrichment and upstream regulator analyses were performed in Ingenuity Pathways Analysis (Qiagen, Inc.). An STAT1-dependent signature was derived using STAT1 target genes identified from 1441 potential target genes from ChiP-Seq and limiting the search space to the 20 genes with the highest fold change after treatment of HeLa cells with IFN-γ (18). Of the 20 genes, only 17 were annotated on a test dataset and carried forward. The 17 gene set was then used to generate STAT1 signature scores across samples from the transcriptional data. The STAT1 scores were generated by creating Z scores for each of the 17 genes in the network and then using the average Z score of 17 genes as a transcriptional measure of STAT1 activation.
Statistical Analyses
Descriptive statistics, including mean and SD for normally distributed variables, median and interquartile range for skewed variables, and proportions for categorical variables, were used to characterize participant characteristics. Baseline and stimulated phosphoflow activities in patients and controls were compared with Wilcoxon rank-sum analysis. The relationship between JAK-STAT1 activation score and baseline eGFR and UPCR was evaluated by Spearman rank correlation coefficient (rho). Differences between curves were tested using the log-rank test. Separate Cox proportional hazards models were fit to estimate the hazard ratio for complete remission and the composite of 40% decline in eGFR from baseline or ESKD using JAK-STAT1 activation score as a continuous variable. Analyses were performed using both STATA, v12 and R.
Results
Phosphoflow Studies
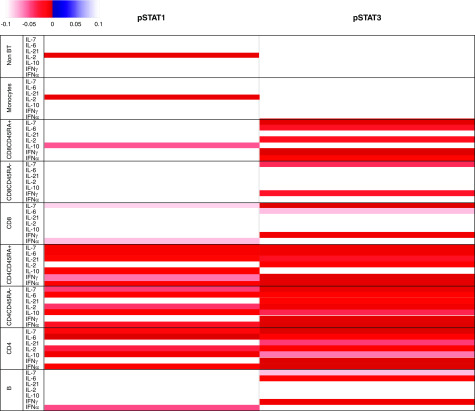
Nineteen adult patients with IgA nephropathy and 20 healthy, adult controls were evaluated. Baseline subsets of PBMCs were mostly similar but with fewer CD4+CD45+ lymphocytes and more CD4+CD45− lymphocytes in patients with IgA nephropathy, suggesting a greater memory cell response (Supplemental Table 1). Under baseline conditions, pSTAT1 was mildly but significantly greater in patients with IgA nephropathy in CD4+ T cells, both naïve and memory cells (CD45+ and CD45−). pSTAT3 was only significantly elevated at baseline in CD4+CD45− cells (Figure 2). However, following stimulation by multiple cytokines, there was evidence of a broad and quite significant response that demonstrated reduced ability to augment pSTAT1 and -3 in patients with IgA nephropathy compared with controls, suggesting an overall limitation in the pathway. CD4+ lymphocytes, including both the CD45RA+ and CD45RA− subsets, were most affected by this change (Figure 3). This decrease in the action to augment STAT phosphorylation in CD4 and CD45+ lymphocytes correlated with increased serum creatinine levels (Supplemental Figure 1). Higher levels of proteinuria also significantly and inversely correlated with cytokine-driven stimulation of phosphorylation of STAT1 or STAT3 in the majority of mononuclear cell subtypes as demonstrated by heat maps (Supplemental Figure 1).
Figure 3.
Change of pSTAT1 and pSTAT3 in B lymphocytes, T lymphocytes (CD4+, CD4+CD45RA+, CD4+CD45RA−, CD8+, CD8+CD45RA+, CD8+CD45RA−, NK cells), and monocytes stimulated by IFN-α, IFN-γ, IL-6, IL-7, IL-10, IL-2, and IL-21 was compared between IgA nephropathy and control. P values were determined by unpaired t test. P=0.10 was filtered and is shown in a heatmap format (left panel). Direction of increased or decreased STAT phosphorylation in comparison with controls is represented by blue (negatively correlated) or red (positively correlated).
Immunohistochemistry of Patients with IgA Nephropathy
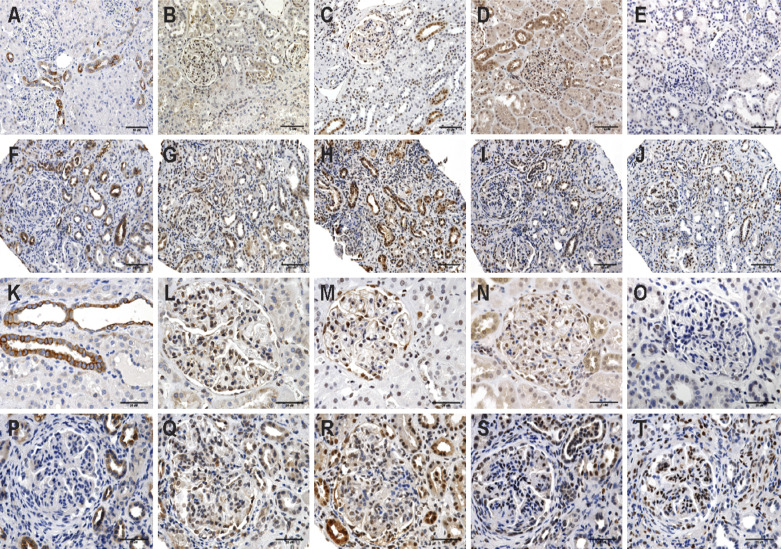
Unstained slides of seven patients with IgA nephropathy were analyzed for STAT3, JAK2, pSTAT1, and pSTAT3 and compared with staining in corresponding slides of healthy kidneys by an experienced nephropathologist. As depicted in Figure 4, Jak2 staining was somewhat decreased, but STAT1, STAT3, pSTAT1, and pSTAT3 demonstrated increased staining. Semiquantitative analysis additionally suggested greater staining for pSTAT1 and pSTAT3 in patients with IgA nephropathy in the glomerulus, tubules, and vessels of the kidney (Supplemental Figure 2). pSTAT3 staining appeared limited to glomerular endothelial cells and vascular and tubule cells, whereas pSTAT1 was evident more broadly in IgA nephropathy, including in podocytes, mesangial cells, and infiltrating lymphocytes.
Figure 4.
Representative images of immunohistochemistry stain of JAK1, JAK2, pSTAT1, STAT3, and pSTAT3 in control patients with kidney disease and patients with IgA nephropathy. (A) Control JAK1. (B) Control JAK2. (C) Control pSTAT1. (D) Control STAT3. (E) Control pSTAT3. (F) IgA nephropathy JAK1. (G) IgA nephropathy JAK2. (H) IgA nephropathy pSTAT1. (I) IgA nephropathy STAT3. (J) IgA nephropathy pSTAT3 (×200). (K) Control JAK1. (L) Control JAK2. (M) Control pSTAT1. (N) Control STAT3. (O) Control pSTAT3. (P) IgA nephropathy JAK1. (Q) IgA nephropathy JAK2. (R) IgA nephropathy pSTAT1. (S) IgA nephropathy STAT3. (T) IgA nephropathy pSTAT3 (×400). A 10-μm bar is depicted on each photomicrograph.
Transcriptomic Analyses
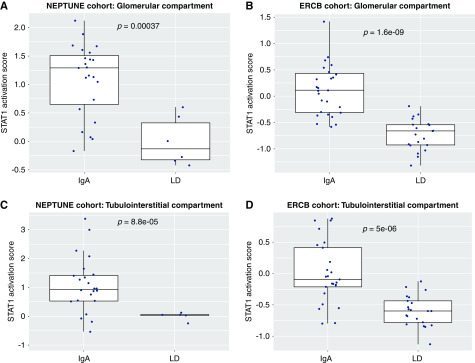
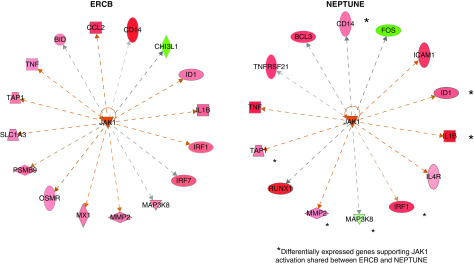
We compared glomerular (n=22) and tubulointerstitial (n=22) transcriptional patterns from 28 patients with IgA nephropathy from NEPTUNE with those from healthy kidney donor biopsies (n=6 for glomeruli and n=5 for tubulointerstitium). IPA pathway analysis of differentially expressed genes in the kidney demonstrated significant enrichment of the JAK-STAT signaling pathway in IgA nephropathy compared with healthy controls (P<0.001). Beyond the JAK-STAT pathway enrichment, upstream regulator quantification using IPA also predicted activation of the JAK-STAT signaling pathway nodes (interferon-γ [IFNG] and STAT1) within the glomerular sections (activation Z scores: 7.1 and 4.5, P values: <0.001 and <0.001) but not quite as strong in the tubulointerstitium (activation Z scores: 1.4 and 1.1, P values: <0.001 and <0.001). To evaluate JAK-STAT activation at the patient level, transcriptional analysis of JAK-STAT activation was completed. In the NEPTUNE cohort, the STAT1 activation score (determined by the composite score derived from 17 genes reportedly upregulated downstream of STAT1 activation) was increased in patients with IgA nephropathy compared with healthy living donor biopsies in both the glomerular and tubulointerstitial sections (Figure 5, A and C). These activation scores were similarly elevated compared with those seen in patients with other primary and secondary glomerular diseases both in NEPTUNE and in the ERCB cohorts, suggesting that this process may be generalizable in glomerular diseases (Supplemental Figure 3). Pathway analysis of the independent cohort of patients with IgA nephropathy from ERCB (Table 3) confirmed activation of JAK-STAT in both the glomerular and interstitial sections as demonstrated by upstream regulator analyses (glomerular activation scores for IFNG and JAK1: 9.2 [P<0.001] and 7.2 [P<0.001], interstitial scores: 5.7 [P<0.001] and 6.3 [P<0.001]). In addition, significant elevations in STAT1 activation scores in tissue transcriptomic data were seen in patients with IgA nephropathy compared with living donors in both glomerular (P<0.001) and tubulointerstitial samples (P<0.001) (Figure 5, B and D). Expression data of downstream targets associated with JAK1 activation showed common activation in glomeruli from participants in NEPTUNE and ERCB compared with healthy living donor controls (Figure 6) (activation Z scores: 2.8 and 3.3, P values: <0.001 and <0.001 in NEPTUNE and ERCB, respectively).
Figure 5.
Tertile boxes of pSTAT1 activation scores of patients with IgA nephropathy versus healthy living donor kidneys in glomerular sections from the Nephrotic Syndrome Study Network Consortium (NEPTUNE) and the European Renal cDNA Bank (ERCB). LD, healthy living kidney donors.
Figure 6.
Differentially expressed transcripts in IgA nephropathy were enriched in the Janus kinase signal transducer and activator of transcription pathway in the glomerular sections from the European Renal cDNA Bank (ERCB) and the Nephrotic Syndrome Study Network Consortium (NEPTUNE). Red colors show significantly increased transcripts. *Transcripts significantly increased in both ERCB and NEPTUNE cohorts compared with healthy living donor kidney.
Correlation of Clinical Outcomes with Transcriptomic Analyses
Higher patient STAT1 activation (S17 Z scores) trended with higher levels of baseline serum creatinine (lower eGFR), whereas higher levels of entry proteinuria were significantly associated with the STAT1 activation in the tubules (Supplemental Figure 4). Because we had long-term clinical data in NEPTUNE (average follow-up 35.5 [10–55] months), we wished to evaluate if the STAT1 signature score associated with further disease progression or remission of proteinuria. Because of low numbers of events, we could not statistically adjust this for baseline creatinine or proteinuria. There was a trend toward reduced rates of complete remission in the highest tertiles from both the glomerular and tubular compartments with hazard ratio, 0.68 (95% confidence interval, 0.41 to 1.14, P value =0.14) and hazard ratio, 0.73 (95% confidence interval, 0.45 to 1.18, P value =0.08), respectively (Table 4), but these did not reach significance.
Table 4.
Unadjusted survival models
| Outcome and Predictor | HR (95% CI) | P Value | Notes |
|---|---|---|---|
| Complete remission | |||
| Glomerular score | 0.52 (0.20 to 1.35) | 0.18 | Only 10 events |
| Tubular score | 0.50 (0.22 to 1.15) | 0.10 | Only 12 events |
| Composite 40% decline/ESKD | |||
| Glomerular score | 1.81 (0.39 to 8.36) | 0.45 | Only 7 events |
| Tubular score | 2.07 (0.90 to 4.80) | 0.09 | Only 6 events |
HR, hazard ratio; 95% CI, 95% confidence interval.
Discussion
Patients with biopsy-proven IgA nephropathy, marked by mild reductions in kidney function and elevated proteinuria, were evaluated for circulating and kidney-specific markers of the JAK-STAT signaling pathway. In peripheral blood, changes in baseline phosphorylation of STAT1 and -3 were significant, with mildly increased activity among PBMCs, especially CD4+ T lymphocytes, in IgA nephropathy compared with healthy controls. Cytokine stimulation demonstrated that these cells from patients with IgA nephropathy were limited in their ability to increase phosphorylation of STATs. This same phenomenon has been previously reported in systemic autoimmune diseases, such as rheumatoid arthritis and systemic lupus, suggesting that chronic inflammation may decrease the ability of mononuclear cells to respond to acute stimulation with cytokines (19–22). We have previously reported that other glomerular diseases also have altered responses to pSTAT stimulation, similar in some of the cell types and with some of the same cytokines, but other responses were distinct (23). This finding of decreased cytokine-responsive phosphorylation of STATs in mononuclear cells among our patients with IgA nephropathy was significantly associated with both increased proteinuria and decreased kidney function, possibly signaling clinical relevance.
Given these changes in the regulation of JAK-STAT in peripheral blood cells, we next looked into the kidney. Using immunohistochemistry, subjective scoring suggested greater staining of select components of the JAK-STAT pathway compared with what was seen in healthy kidney. Thus, staining demonstrated that JAK and STAT proteins, specifically JAK2, STAT3, pSTAT1, and pSTAT3, are indeed found in both normal and IgA nephropathy involved kidney in both the glomerulus and interstitial areas. Increased staining for STAT and pSTAT1 was suggested in patients with IgA nephropathy, diffusely for pSTAT1 but more limited to the vascular and tubular sections for STAT1 and pSTAT3.
In order to better describe JAK-STAT activity in IgA nephropathy, transcriptomic profiles of glomerular and tubulointerstitial sections of kidney from patients were compared with healthy kidneys. The analyses of these results suggest that many players in this signaling pathway are upregulated, resulting in increased mRNA levels for several of the established upstream activators and downstream targets of pSTAT1 and pSTAT3. Thus, the score (18,23) established from summing the expression of known downstream targets of STAT activation was significantly elevated in patients with IgA nephropathy compared with healthy kidney donors from the NEPTUNE cohort. This pattern was validated in the separate ERCB IgA nephropathy cohort. The association of this score in IgA nephropathy with increasing levels of proteinuria and a trend for worse longitudinal outcomes suggests that activation of STATs may be an important marker and mediator of kidney inflammation and eventual progression in IgA nephropathy.
JAK-STAT is a key family of intracellular proteins that are activated by cell receptors in response to binding by inflammatory cytokines and chemokines, ultimately determining nuclear transcription (24). This pathway is known to be actively involved in cancer and many inflammatory diseases. Animal models of diabetic kidney disease have demonstrated increased JAK-STAT activation in both the glomerulus and tubulointerstitium, and JAK inhibitors that reduce STAT activation have been associated with milder progression in these models (8). As mentioned above, a human study of JAK inhibitors in diabetic kidney disease demonstrated significant reductions in proteinuria (25). IgA nephropathy–specific changes in STAT signals have previously been suggested, correlating with worse disease (26).
There are clear limitations to our ability to fully evaluate and support our hypothesis. JAK-STAT function cannot be comprehensively assessed or analyzed using our available technologies (phosphoflow, immunohistochemistry, and transcriptomic analyses). As a result, we could not measure or localize all regulators of the JAK-STAT pathway. Perhaps this can be attempted in a future study using more mature techniques. Our immunostaining evaluation was also limited by small numbers and using semiquantitative methods rather than stereologic ones, perhaps allowing for overinterpretation. Finally, the number of patients available for data mining was limited, making associations with clinical outcomes more difficult.
Still, these results provide a rationale that abnormalities in STAT phosphorylation are likely to be important in the development and progression of IgA nephropathy. Indeed, our overall findings strongly support that JAK-STAT is altered in diverse kidney diseases, including diabetes and FSGS, but that individual changes altering overall JAK-STAT activity are likely to be unique to each disease.
Disclosures
Dr. S. Eddy reports receiving other funding from Thermo Fisher, Johnson and Johnson, Abbvie, and Gilead Sciences, Inc., outside the submitted work. Dr. M. Kretzler has a patent (PCT/EP2014/073413 “Biomarkers and methods for progression prediction for CKD”) issued and reports grants from the National Institutes of Health during the conduct of the study and grants from AstraZeneca, Gilead, NovoNordisc, Eli Lilly, Janssen, Merck, Elpidera, Certa, Goldfinch Bio, Angion, and Boehringer-Ingelheim, outside the submitted work. Dr. R.A. Lafayette reports personal fees from Mallinckrodt, Inc., Rigel, Inc., Roche, Inc., Aurinia, Retrophin, Inc., Relypsa, Inc., and Calliditas, Inc., outside the submitted work and grants from Mallinckrodt, Inc., Rigel, Inc., Roche, Inc., Aurinia, Retrophin, Inc., and Calliditas, Inc., outside the submitted work. Dr. L. Mariani reports personal fees from Reata Pharmaceuticals, outside the submitted work and grants from National Institutes of Health–National Institute of Diabetes, Digestive, and Kidney Diseases during the conduct of the study. All remaining authors have nothing to disclose.
Funding
This research was supported by the Nephrotic Syndrome Study Network Consortium (NEPTUNE), part of National Institutes of Health rare disease clinical research network grant U54 DK083912, supported through collaboration between the Office of Rare Diseases Research, National Center for Advancing Translational Sciences and the National Institute of Diabetes, Digestive, and Kidney Diseases, and grant P30 DK081943 through the Applied Systems Biology Core at the University of Michigan IgA nephropathy George M. O’Brien Kidney Translational Core Center. Additional funding and/or programmatic support was provided by the Else Kröner-Fresenius-Stiftung (European Renal cDNA Bank), NephCure Kidney International, and the Halpin Foundation through support for the NEPTUNE. This work was also supported by the John and Abby Sobrato Fund and the George and Angeliki Perlegos Fund.
Supplementary Material
Footnotes
Published online ahead of print. Publication date available at www.cjasn.org.
Supplemental Material
This article contains the following supplemental material online at http://cjasn.asnjournals.org/lookup/suppl/doi:10.2215/CJN.11010919/-/DCSupplemental.
Supplemental Figure 1. Correlation analysis between 24-hour urine protein excretion (milligrams) or serum creatinine (milligrams per deciliter) with pSTAT1 and pSTAT3 of B lymphocytes, CD4+, CD4+CD45RA+, CD4+CD45RA−, CD8+, CD8+CD45RA+, CD8+CD45RA−, NK cells, and monocytes stimulated by IFN-α, IFN-γ, IL-6, IL-7, IL-10, IL-2, and IL-21.
Supplemental Figure 2. Semiquantification of the JAK2, pSTAT1, STAT3, and pSTAT3 immunohistochemistry staining in patients with IgA nephropathy (n=7).
Supplemental Figure 3. Tertile boxes of pSTAT1 activation scores of subjects with glomerular disease versus healthy living donor kidneys in glomerular sections from the Nephrotic Syndrome Study Network Consortium and the European Renal cDNA Bank and in tubule-interstitial sections from the Nephrotic Syndrome Study Network Consortium and the European Renal cDNA Bank.
Supplemental Figure 4. Spearman correlation between STAT1 activation score in the glomerular sections and baseline proteinuria (rho=0.091, P=0.69, n=22) and eGFR from patients in the Nephrotic Syndrome Study Network Consortium (rho=−0.107, P=0.64, n=22).
Supplemental Table 1. Percentage of subsets of PBMCs in control patients and patients with IgA nephropathy.
References
- 1.Berger J, Hinglais N: [Intercapillary deposits of IgA-IgG]. J Urol Nephrol (Paris) 74: 694–695, 1968. [PubMed] [Google Scholar]
- 2.Lafayette RA, Kelepouris E: Immunoglobulin A nephropathy: Advances in understanding of pathogenesis and treatment. Am J Nephrol 47[Suppl 1]: 43–52, 2018. [DOI] [PubMed] [Google Scholar]
- 3.Suzuki H, Kiryluk K, Novak J, Moldoveanu Z, Herr AB, Renfrow MB, Wyatt RJ, Scolari F, Mestecky J, Gharavi AG, Julian BA: The pathophysiology of IgA nephropathy. J Am Soc Nephrol 22: 1795–1803, 2011. [DOI] [PMC free article] [PubMed] [Google Scholar]
- 4.Faria B, Henriques C, Matos AC, Daha MR, Pestana M, Seelen M: Combined C4d and CD3 immunostaining predicts immunoglobulin (Ig)A nephropathy progression. Clin Exp Immunol 179: 354–361, 2015. [DOI] [PMC free article] [PubMed] [Google Scholar]
- 5.Wyatt RJ, Julian BA: IgA nephropathy. N Engl J Med 368: 2402–2414, 2013. [DOI] [PubMed] [Google Scholar]
- 6.O’Shea JJ, Plenge R: JAK and STAT signaling molecules in immunoregulation and immune-mediated disease. Immunity 36: 542–550, 2012. [DOI] [PMC free article] [PubMed] [Google Scholar]
- 7.Brosius FC 3rd, He JC: JAK inhibition and progressive kidney disease. Curr Opin Nephrol Hypertens 24: 88–95, 2015. [DOI] [PMC free article] [PubMed] [Google Scholar]
- 8.Brosius FC, Tuttle KR, Kretzler M: JAK inhibition in the treatment of diabetic kidney disease. Diabetologia 59: 1624–1627, 2016. [DOI] [PMC free article] [PubMed] [Google Scholar]
- 9.Vincenti F, Silva HT, Busque S, O’Connell PJ, Russ G, Budde K, Yoshida A, Tortorici MA, Lamba M, Lawendy N, Wang W, Chan G: Evaluation of the effect of tofacitinib exposure on outcomes in kidney transplant patients. Am J Transplant 15: 1644–1653, 2015. [DOI] [PubMed] [Google Scholar]
- 10.Cox SN, Sallustio F, Serino G, Loverre A, Pesce F, Gigante M, Zaza G, Stifanelli PF, Ancona N, Schena FP: Activated innate immunity and the involvement of CX3CR1-fractalkine in promoting hematuria in patients with IgA nephropathy. Kidney Int 82: 548–560, 2012. [DOI] [PubMed] [Google Scholar]
- 11.Yamada K, Huang ZQ, Raska M, Reily C, Anderson JC, Suzuki H, Ueda H, Moldoveanu Z, Kiryluk K, Suzuki Y, Wyatt RJ, Tomino Y, Gharavi AG, Weinmann A, Julian BA, Willey CD, Novak J: Inhibition of STAT3 signaling reduces IgA1 autoantigen production in IgA nephropathy. Kidney Int Rep 2: 1194–1207, 2017. [DOI] [PMC free article] [PubMed] [Google Scholar]
- 12.Gadegbeku CA, Gipson DS, Holzman LB, Ojo AO, Song PX, Barisoni L, Sampson MG, Kopp JB, Lemley KV, Nelson PJ, Lienczewski CC, Adler SG, Appel GB, Cattran DC, Choi MJ, Contreras G, Dell KM, Fervenza FC, Gibson KL, Greenbaum LA, Hernandez JD, Hewitt SM, Hingorani SR, Hladunewich M, Hogan MC, Hogan SL, Kaskel FJ, Lieske JC, Meyers KE, Nachman PH, Nast CC, Neu AM, Reich HN, Sedor JR, Sethna CB, Trachtman H, Tuttle KR, Zhdanova O, Zilleruelo GE, Kretzler M: Design of the Nephrotic Syndrome Study Network (NEPTUNE) to evaluate primary glomerular nephropathy by a multidisciplinary approach. Kidney Int 83: 749–756, 2013. [DOI] [PMC free article] [PubMed] [Google Scholar]
- 13.Sampson MG, Robertson CC, Martini S, Mariani LH, Lemley KV, Gillies CE, Otto EA, Kopp JB, Randolph A, Vega-Warner V, Eichinger F, Nair V, Gipson DS, Cattran DC, Johnstone DB, O’Toole JF, Bagnasco SM, Song PX, Barisoni L, Troost JP, Kretzler M, Sedor JR; Nephrotic Syndrome Study Network : Integrative genomics identifies novel associations with APOL1 risk genotypes in black NEPTUNE subjects. J Am Soc Nephrol 27: 814–823, 2016. [DOI] [PMC free article] [PubMed] [Google Scholar]
- 14.Sandberg R, Larsson O: Improved precision and accuracy for microarrays using updated probe set definitions. BMC Bioinformatics 8: 48, 2007. [DOI] [PMC free article] [PubMed] [Google Scholar]
- 15.Chen C, Grennan K, Badner J, Zhang D, Gershon E, Jin L, Liu C: Removing batch effects in analysis of expression microarray data: An evaluation of six batch adjustment methods. PLoS One 6: e17238, 2011. [DOI] [PMC free article] [PubMed] [Google Scholar]
- 16.Rapaport F, Khanin R, Liang Y, Pirun M, Krek A, Zumbo P, Mason CE, Socci ND, Betel D: Comprehensive evaluation of differential gene expression analysis methods for RNA-seq data [published correction appears in Genome Biol 16: 261, 2015]. Genome Biol 14: R95, 2013. [DOI] [PMC free article] [PubMed] [Google Scholar]
- 17.Edgar R, Domrachev M, Lash AE: Gene expression omnibus: NCBI gene expression and hybridization array data repository. Nucleic Acids Res 30: 207–210, 2002. [DOI] [PMC free article] [PubMed] [Google Scholar]
- 18.Satoh J, Tabunoki H: A comprehensive profile of ChIP-seq-based STAT1 target genes suggests the complexity of STAT1-mediated gene regulatory mechanisms. Gene Regul Syst Bio 7: 41–56, 2013. [DOI] [PMC free article] [PubMed] [Google Scholar]
- 19.Popa C, Netea MG, Barrera P, Radstake TR, van Riel PL, Kullberg BJ, Van der Meer JW: Cytokine production of stimulated whole blood cultures in rheumatoid arthritis patients receiving short-term infliximab therapy. Cytokine 30: 72–77, 2005. [DOI] [PubMed] [Google Scholar]
- 20.Pavón EJ, García-Rodríguez S, Zumaquero E, Perandrés-López R, Rosal-Vela A, Lario A, Longobardo V, Carrascal M, Abián J, Callejas-Rubio JL, Ortego-Centeno N, Zubiaur M, Sancho J: Increased expression and phosphorylation of the two S100A9 isoforms in mononuclear cells from patients with systemic lupus erythematosus: A proteomic signature for circulating low-density granulocytes. J Proteomics 75: 1778–1791, 2012. [DOI] [PubMed] [Google Scholar]
- 21.Ramírez-Vélez G, Medina F, Ramírez-Montaño L, Zarazúa-Lozada A, Hernández R, Llorente L, Moreno J: Constitutive phosphorylation of interferon receptor A-associated signaling proteins in systemic lupus erythematosus. PLoS One 7: e41414, 2012. [DOI] [PMC free article] [PubMed] [Google Scholar]
- 22.Hale MB, Krutzik PO, Samra SS, Crane JM, Nolan GP: Stage dependent aberrant regulation of cytokine-STAT signaling in murine systemic lupus erythematosus. PLoS One 4: e6756, 2009. [DOI] [PMC free article] [PubMed] [Google Scholar]
- 23.Tao J, Mariani L, Eddy S, Maecker H, Kambham N, Mehta K, Hartman J, Wang W, Kretzler M, Lafayette RA: JAK-STAT signaling is activated in the kidney and peripheral blood cells of patients with focal segmental glomerulosclerosis. Kidney Int 94: 795–808, 2018. [DOI] [PMC free article] [PubMed] [Google Scholar]
- 24.O’Shea JJ, Schwartz DM, Villarino AV, Gadina M, McInnes IB, Laurence A: The JAK-STAT pathway: Impact on human disease and therapeutic intervention. Annu Rev Med 66: 311–328, 2015. [DOI] [PMC free article] [PubMed] [Google Scholar]
- 25.Tuttle KR, Adler SG, Brosius FC, Kretzler M, Mehta RL, Tumlin JA, Tanaka Y, Haneda M, Lu J, Silk ME, Cardillo TE, Duffin KL, Haas JV, Macias WL, Nunes FP, Janes JM: JAK1/JAK2 inhibition by baricitinib in diabetic kidney disease: results from a Phase 2 randomized controlled clinical trial. Nephrol Dial Transplant 33: 1950–1959, 2018 [DOI] [PMC free article] [PubMed] [Google Scholar]
- 26.Arakawa T, Masaki T, Hirai T, Doi S, Kuratsune M, Arihiro K, Kohno N, Yorioka N: Activation of signal transducer and activator of transcription 3 correlates with cell proliferation and renal injury in human glomerulonephritis. Nephrol Dial Transplant 23: 3418–3426, 2008. [DOI] [PubMed] [Google Scholar]
Associated Data
This section collects any data citations, data availability statements, or supplementary materials included in this article.


