

Abstract
It is challenging to quickly diagnose slowly progressing diseases. To prioritize multiple related diagnoses, we developed G-PROB (Genetic Probability tool) to calculate the probability of different diseases for a patient using genetic risk scores. We tested G-PROB for inflammatory arthritis-causing diseases (rheumatoid arthritis, systemic lupus erythematosus, spondyloarthropathy, psoriatic arthritis, and gout). After validating on simulated data, we tested G-PROB in three cohorts: 1211 patients identified by International Classification of Diseases (ICD) codes within the eMERGE database, 245 patients identified through ICD codes and medical record review within the Partners Biobank, and 243 patients first presenting with unexplained inflammatory arthritis and with final diagnoses by record review within the Partners Biobank. Calibration of G-probabilities with disease status was high, with regression coefficients from 0.90 to 1.08 (1.00 is ideal). G-probabilities discriminated true diagnoses across the three cohorts with pooled areas under the curve (95% CI) of 0.69 (0.67 to 0.71), 0.81 (0.76 to 0.84), and 0.84 (0.81 to 0.86), respectively. For all patients, at least one disease could be ruled out, and in 45% of patients, a likely diagnosis was identified with a 64% positive predictive value. In 35% of cases, the clinician’s initial diagnosis was incorrect. Initial clinical diagnosis explained 39% of the variance in final disease, which improved to 51% (P < 0.0001) after adding G-probabilities. Converting genotype information before a clinical visit into an interpretable probability value for five different inflammatory arthritides could potentially be used to improve the diagnostic efficiency of rheumatic diseases in clinical practice.
INTRODUCTION
The prevalence of patients with whole-genome genotyping data is readily increasing (1–3) as genome-wide genetic data are collected for biobanking efforts, routine care, and direct-to-consumer genotyping. Genotype data provide a patient-specific, time-independent risk profile that could be used to prioritize different diagnoses. In the case of complex rheumatic diseases, genetic data may not be particularly informative without patient signs or symptoms, as these diseases tend to be rare (4–11). However, genetic data available at an initial doctor visit could be used in ongoing clinical care in real time (12,13).
Many patients in rheumatology outpatient clinics present with synovitis or joint swelling as the first symptom of inflammatory arthritis. Although such patients are often misdiagnosed at their first visit, about 80% of patients with inflammatory arthritis are eventually diagnosed with rheumatoid arthritis (RA) (14, 15), systemic lupus erythematosus (SLE) (16), spondyloarthropathy (SpA) (17–19), psoriatic arthritis (PsA) (20), or gout (21). If the correct diagnosis for patients with inflammatory arthritis could be obtained more quickly, then therapies could be started sooner, thereby lessening the chance of disability and permanent damage (22–26) and avoiding use of inappropriate immunomodulatory therapies.
Many risk loci have been identified for rheumatic diseases (27–34), and genetic risk scores have been studied for both prediction of rheumatic disease progression (5–7) and for susceptibility (8–11). For instance, a previous study built a genetic model for gout susceptibility (28). Most other risk scores have had modest predictive value in determining case versus control status. Given the low prevalence of rheumatic diseases, most tests perform poorly on a population level since the pretest disease probability is low (35). In the outpatient setting, however, symptom-based selection substantially increases the pretest probability for disease, resulting in an increased posttest probability that may render probabilistic predictions more effective in the clinical setting. This is particularly the case for inflammatory arthritis, which is not present in healthy individuals. To our knowledge, the use of genetics to discriminate between multiple rheumatic diseases has not been investigated in a practical setting. Here, we explored whether genetic data can facilitate disease differentiation in patients with similar early disease stage symptoms of inflammatory arthritis at their first visit to an outpatient clinic.
RESULTS
Summary of methods
G-PROB (Genetic Probability tool) uses genetic information combined in a genetic risk score from multiple diseases to calculate a given patients’ conditional probabilities for each of multiple diseases, assuming that one of the diseases is present (Fig. 1). We call these probabilities G-probabilities. In this proof-of-principle study, we calculated the probabilities of RA, SLE, PsA, SpA, and gout for each patient using bias-adjusted odds ratios (ORs) from both singlenucleotide polymorphisms (SNPs) and human leukocyte antigen (HLA) variants of uncorrelated risk SNPs, as reported for European samples and sex-dependent population risk (27–34). We note that we reduced the effect of each SNP using an arbitrary shrinkage factor to correct for the common overestimation of published effect sizes (36). We tested G-PROB in multiple settings with different patient selection criteria (figs. S1 to S6 and tables S1 to S4).
Fig. 1. Schematic depiction of G-PROB and study design.
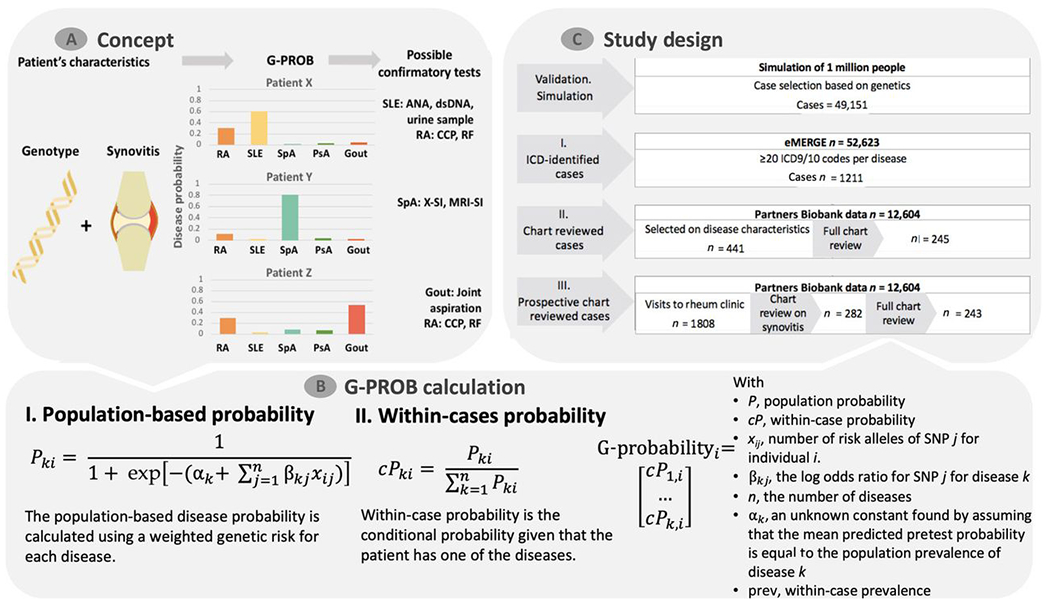
(A) For patients with symptoms (inflammatory arthritis, suggesting possible synovitis at clinical exam in this example), G-PROB assigns a genetic information-based probability that the patient has each of the possible diseases. The magnitude and difference between disease probabilities can guide clinicians to subsequent tests. dsDNA, double-stranded DNA; RF, rheumatoid factor; ANA, antinuclear antibody; X-SI, X-ray of sacroiliac joints; MRI-SI, MRI of sacroiliac joints. (B) The genetic probability calculation consists of two steps: First, the population-based probability is calculated using a weighted genetic risk score. Next, it obtains within-patient probabilities normalizing the population-based probabilities. The end product is a probability that each patient has for each disease. (C) The multiple testing and validation phases of this study are summarized by this flow chart.
Simulated data
We first tested whether simulated genetic information on its own offered the potential to discriminate between different diagnoses, assuming an individual has one of the inflammatory arthritides being considered. We simulated a population of 1 million individuals and assigned 49,151 cases with one of our five synovitis-causing diseases (fig. S1). We stochastically assigned individuals as having a disease or not, taking into account the differences in their underlying genetic risk. We assigned case status after assigning an individual population-based disease risk for each of the five diseases as a random binomial trial for each of the diseases. As we assumed a disease prevalence of 1% for each disease in the simulated population, each disease was equally represented in our case set. This resulted in a simulated population of cases solely defined by genetics and a random factor.
G-PROB is a multiclass classifier, calculating probabilities for several diseases. For each disease, we tested whether the probabilities matched the simulated disease status. If the G-probabilities perform well, then the patient’s true disease status should correspond to a high G-probability for that specific disease, whereas the G-probabilities for other diseases should be low. We will further describe probabilities that correspond to a patient’s real disease as disease matching and probabilities that correspond to one of the other diseases as non-disease matching.
Within the simulated cases, we observed that the distribution of the genetic probabilities matching the patients’ simulated diseases was clearly higher than the genetic probabilities for the other diseases (Fig. 2A and fig. S7). Next, we tested whether the magnitude of the probabilities calibrated well with the real disease. For this, we estimated the regression line between the probabilities and disease match (yes/no) using linear regression with the intercept constrained to zero, where the resulting β (regression coefficient) gave the exact calibration. The β was almost optimal in the simulated data (β = 1.01; Fig. 2B). Whether G-PROB is useful to prioritize patients depends partly on how often the probabilities are highly informative low or high values. In the simulated data, 32% of all probabilities were ≤0.05, making their corresponding diseases very unlikely. This cutoff corresponded to a negative predictive value (NPV) of 0.98 (Table 1). In contrast, 13% of the probabilities were ≥0.5, corresponding to a positive predictive value (PPV) of 0.70. Each patient had five disease probabilities assigned, and we were frequently able to rule in or rule out one of the five diseases. We observed that 90% of the patients had at least one of those probabilities ≤0.05 and 64% of patients had a diagnosis with at least one diagnosis probability ≥0.5.
Fig. 2. Discriminative ability of G-PROB and the concordance of predictions with observed disease occurrence.

The performance of G-PROB is measured by comparing the magnitude of its estimated probabilities with known disease status. All analyses consider at least five categories: RA, SLE, PsA, SpA, and gout. In setting III, “other” is added as a sixth category. (A) The distribution of probabilities estimated by G-PROB for the correct diagnosis (green) and incorrect diagnoses (orange). See fig. S10 for analyses on the individual disease level. (B) The concordance of G-probabilities with patients’ real disease status. Ideally, the higher the inferred G-probability is for a disease, the more likely that it is the actual diagnosis. Here, we estimated the regression line between the disease G-probabilities and disease match (yes/no) using linear regression, constraining the intercept to zero. A β (regression coefficient) of one indicates exact calibration. The solid line is the regression line. In the case of perfect test performance, the solid line would lie exactly on the identity line, represented by the dashed diagonal line. For visualization, we placed G-probabilities (x axis) into five equally sized bins and plotted the proportion of instances where predicted disease is the actual disease (y axis). (C) Receiver operating curve (ROC) describing the balance between sensitivity and the specificity and thereby the overall discriminative ability of G-probabilities. The area under the curve (AUC) summarizes the AUC of the pooled data for all diseases. See fig. S7 for the depiction on the individual disease level.
Table 1. Performance of G-probabilities in ruling out and pointing toward disease diagnoses.
(A) The NPV of G-probabilities at 0.05 and 0.2. We consider a G-probability <0.05 for a specific disease to indicate that disease is highly unlikely for that patient. (B) The PPV of G-probabilities at 0.2 and 0.5. A G-probability higher than 0.5 for a specific disease suggests that disease is more likely than not to be the diagnosis. As each patient has multiple G-probabilities (one for each disease), the table provides the percentage of probabilities below (0.05, 0.2) or above (0.2, 0.5) each cutoff, as well as the percentage of patients who have at least one disease with a probability below (0.05, 0.2) or above (0.2, 0.5) each cutoff. More extensive test characteristics are depicted in fig. S11. NPV, negative predictive value; PPV, positive predictive value; % of probs, the percentage of all probabilities; % of pts, the percentage of patients who had probabilities for at least one disease below or above the given cutoff.
| G-PROB performance | ||||||||||||
|---|---|---|---|---|---|---|---|---|---|---|---|---|
| (A) Ruling out diseases | (B) Pointing toward diseases | |||||||||||
| Cutoff | ≤0.05 | ≤0.2 | ≥0.2 | ≥0.5 | ||||||||
| % of pts | % of probs | NPV | % of pts | % of probs | NPV | % of pts | % of probs | PPV | % of pts | % of probs | PPV | |
| Simulation: Validation | 90% | 32% | 0.98 | 100% | 67% | 0.93 | 100% | 33% | 0.47 | 64% | 13% | 0.70 |
| Setting I | 51% | 13% | 0.94 | 100% | 59% | 0.87 | 100% | 41% | 0.31 | 24% | 5%, | 0.39 |
| Setting II | 49% | 11% | 0.96 | 100% | 61% | 0.93 | 100% | 39% | 0.40 | 25% | 5%, | 0.66 |
| Setting III prospective | 100% | 39% | 0.98 | 100% | 69% | 0.94 | 100% | 40% | 0.40 | 45% | 8% | 0.64 |
We next wished to determine whether G-PROB could correctly classify rheumatic disease status in the simulated data. To test this, we depicted receiver operating characteristic (ROC) curves and summarized the total performance with the area under the curve (AUC) for G-probabilities with disease match. The overall discriminatory capacity of the G-probabilities was highly accurate, with AUC of 0.86 [95% confidence interval (CI), 0.86 to 0.86] (Fig. 2C and table S5). The precision-recall curve is provided in the Supplementary Materials (fig. S8).
Setting I: Assigning patient diagnoses based on billing codes
The simulation showed that genetic information was substantially different for the five diseases and could have the potential to prioritize diagnoses. However, the simulations may differ from real patient data because of differences in reported effect sizes and unappreciated environmental factors. Therefore, we tested how well genetic information separated real patients using individual-level data from three biobank cohorts (settings) in which genetic data were linked to electronic medical records (EMRs).
Setting I comprises patients from eMERGE (Electronic Medical Records and Genomics), a network that has amassed clinical data and genome-wide genotyping data from 12 health care networks from throughout the United States (37). This consortium includes medical centers with biobank genetic information linked with EMR data, such as diagnosis [International Classification of Diseases and Related Health Problems (ICD) 9 and ICD10] billing codes. Among 83,717 subjects in eMERGE, we included 72,624 individuals who were self-described as white and excluded individuals enrolled in Partners Biobank (used in settings II and III), resulting in a total of 52,623 individuals in setting I. After testing the performance of the number of ICD codes for case identification with EMR-reviewed data as the gold standard (fig. S2 and table S1), we chose a cutoff of ≥20 ICD9/ICD10 codes for each disease to define the eventual true diagnoses for each patient. Applying this cutoff of ≥20 codes, we identified 1211 patients with one of five diseases (fig. S3 and table S2).
The G-probabilities in setting I were well calibrated with disease status, although with a slightly lower β (0.90) (Fig. 2B), reflecting the uncertainty of billing code-based diagnoses. We observed that 13% of the G-probabilities were ≤0.05, corresponding to an NPV of 0.94. Using this cutoff, we could identify and classify one or more of the five diseases as highly unlikely in 619 (51%) patients, two or more diseases in 135 (11%) patients, and three or more diseases in 10 (<1%) patients. For 24% of patients in this dataset, there was a single disease with ≥0.5 probability, corresponding to 5% of the total assigned probabilities and a PPV of 0.39. G-PROB showed a modest AUC discriminating between diseases [AUC, 0.69 (95% CI, 0.67 to 0.71); Fig. 2C].
Setting II: Assigning patient diagnoses based on medical records
Misclassification of gold standard diagnoses due to the use of ICD codes may have reduced the accuracy of results for setting I. Therefore, in setting II, we used a more precise method of patient selection: a complete manual review of patients’ medical records including data from the first to most recent visit. We used data from the Boston-based Partners HealthCare Biobank comprising >80,000 subjects (22). We obtained data on 12,604 self-described white patients with available genotype data. The medical charts of these patients were reviewed by a rheumatologist applying the clinical criteria of the American College of Rheumatology (ACR) or the European League Against Rheumatism (14–21) to define the final diagnosis (fig. S4 and table S3). We identified 245 patients with one of the five diseases of interest.
We observed greater correspondence between G-probabilities and disease match (β = 1.08) (Fig. 2B) in setting II than setting I. This likely reflects the more accurate gold standard patient diagnoses based on complete medical charts in setting II than the ICD-based selection in setting I. Here, 11% of all probabilities were ≤0.05, corresponding to an NPV of 0.96. At this cutoff, it was possible to deprioritize at least one disease for 119 (49%) patients, two or more diseases for 13 (5%) patients, and three or more diseases for 3 (1%) patients. Furthermore, 25% of the patients had a single disease with a G-probability ≥0.5 (Table 1), which represented 5% of all calculated probabilities. A G-probability ≥0.5 corresponded to a PPV of 0.66. We observed that the accuracy was closer to the accuracy in the simulation data with AUC of 0.81 (95% CI, 0.76 to 0.84) (Fig. 2C).
Sensitivity analyses
To ensure that one strongly genetically determined disease did not skew the results, we conducted several sensitivity analyses. When we calculated the AUC for each individual disease, G-PROB showed similar performance across classes (fig. S9). We ran G-PROB five times, excluding each of the disease, and observed similar AUC values (fig. S10). As our shrinkage factor of 0.5 was arbitrarily chosen, we tested the calibration of the G-probabilities with disease outcome, the log-likelihood, and entropy score (38) using different shrinkage factors for the ORs in the genetic risk score and found that the results did not substantially differ (fig. S11).
We grouped peripheral SpA (17) with axial SpA (18, 19) but separated PsA (20) as a different disease phenotype, as there is extensive data from genome-wide association studies on axial SpA and PsA (17–20). We tested whether the inclusion of peripheral SpA cases had influenced the result by rerunning analyses without those cases. The results were similar [β = 1.09 (95% CI, 1.01 to 1.18); AUC, 0.81 (95% CI, 0.78 to 0.84)].
Setting III: Selecting patients presenting with inflammatory arthritis at their first visit
As G-PROB was developed to discriminate patients presenting with similar symptoms, we tested this exact hypothesis in setting III by manually reviewing the records of all patients who received ICD codes from a rheumatology clinic. In contrast to setting II, we restricted this analysis to patients with documented but unexplained inflammatory arthritis at an initial encounter with a rheumatologist. From the 1808 Partners Biobank patients who visited a rheumatology outpatient clinic, 282 had inflammatory arthritis without a previous diagnosis. We note that settings II and III are not completely independent since they were obtained from the same patient resource and they share 107 individual patients. We excluded seven cases in which the patient did not fulfill any classification criteria, but the rheumatologist eventually diagnosed the patient with one of the five diseases; we could not determine for these patients whether the medical record lacked information or the patient was misclassified by the rheumatologist. Of the remaining patients, 79.4% were diagnosed with one of the diseases of interest (fig. S5 and table S4), a similar proportion as found in other studies (39, 40). We classified the remaining 20.6% as “other diseases” and included this as a sixth category in G-PROB, accounting for the fact that patients with inflammatory arthritis can have conditions in addition to the five most common diseases. In addition, for the G-PROB calculation, we used the diseases’ prevalence within the outpatient clinic. After these two adjustments, made possible by the quasi-prospective design, the G-probabilities reflected the most realistic disease risks. We excluded patients with RA without documented anti-cyclic citrullinated peptide (CCP) antibody status, resulting in 243 patients for analysis.
Again, G-probabilities corresponded well with real disease status (β = 0.99). Here, 39% of the G-probabilities were ≤0.05. At this threshold, we could deprioritize at least one disease in 100% of patients, at least two diseases in 203 patients (84%), at least three diseases in 98 patients (40%), and four diseases in 27 patients (11%), on the basis of genetic data alone. Furthermore, 45% of the patients had a single disease with G-probability ≥0.5, representing 8% of the calculated probabilities (PPV, 0.64). The ability of G-PROB to discriminate between different diseases was similarly high as in previous settings [AUC, 0.84 (95% CI, 0.81 to 0.86)] (Fig. 2, B and C). Possibly, the difference in prevalence for disease influenced the results in setting III. Subanalyses assigning uniform prevalence across diseases showed improved performance for the less prevalent diseases (fig. S7).
G-PROB’s performance compared to clinical knowledge
The pseudo-prospective patient identification enabled us to compare G-PROB’s performance with the diagnosis of the rheumatologist at a patient’s first visit. Compared with the final diagnosis after complete follow-up, we observed that 35% of the patients were misclassified by their rheumatologist at their first visit (Fig. 3A). The misclassification compared to eventual diagnosis was 35% for RA, 33% for SLE, 50% for SpA, 42% for PsA, 11% for gout, and 37% for other diseases. Of these initial misdiagnoses, 43% had a genetic probability ≤0.5, 29% had a genetic probability ≤0.2, and 9% had a genetic probability of ≤0.05. The difference of G-probabilities between the eventual diagnosis and the incorrect initial diagnosis favored the probability of the eventual diagnosis (Fig. 3B): For 65% of patients, the G-probability of the correct disease was higher than the G-probability of the initial diagnosis of the rheumatologist.
Fig. 3. Diagnostic value of adding G-probabilities to clinical information at first visit.
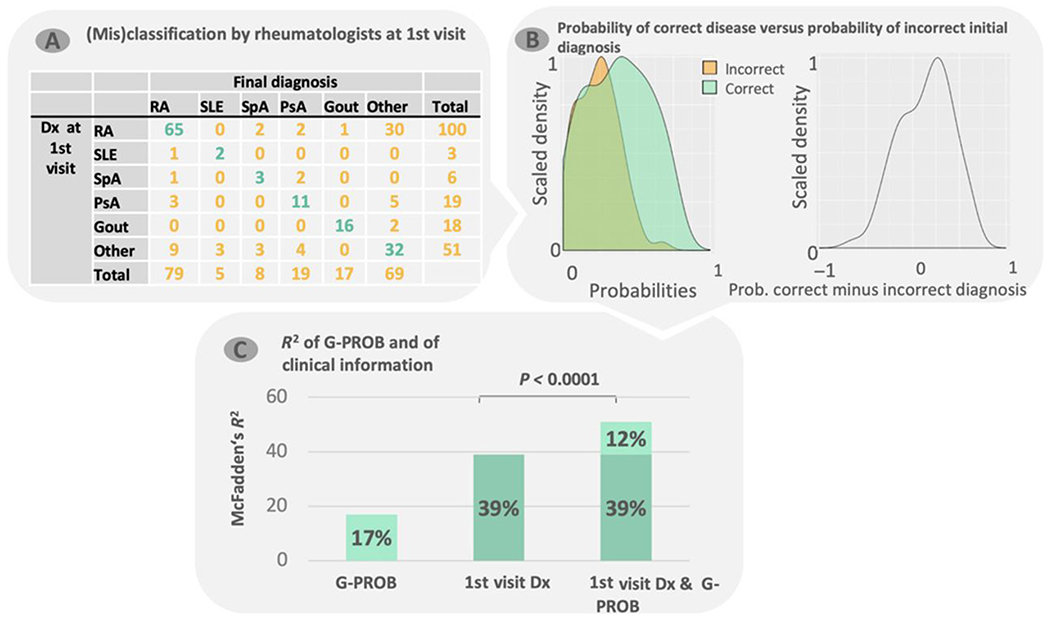
(A) For setting III, we collected the highest-ranked rheumatologist diagnosis at a patient’s first visit and matched this with the final diagnosis. Because rheumatologic diseases can be hard to classify at first visit, the final diagnosis can differ from the first. (B) The density of G-probabilities of both real (correct) diagnoses (green) and the incorrect initial (clinical) diagnosis from (A) (orange; left) and the difference between the two (right). (C) McFadden’s R2 for three multinomial logistic regression models: G-probabilities only, rheumatologist diagnosis at first visit only, and both first-visit diagnosis and G-probabilities. RA, rheumatoid arthritis; SLE, systemic lupus erythematosus; SpA, spondyloarthropathy; PsA, psoriatic arthritis; Dx, diagnosis.
In 53% of individuals, the disease with the highest G-probability corresponded to the final diagnosis. In 77% of individuals, the correct diagnosis was one of the two with the highest G-probabilities; a total of 87% of individuals had the correct diagnosis in the top three. The McFadden’s R2 (41) of the G-probabilities alone was 17 and 39% for the diagnosis at first visit. Adding G-probabilities to the clinical information significantly improved the model with an increase of 12 percentage points yielding an R2 of 51% (P < 0.00001) (Fig. 3C). We infer that the availability of G-PROB’s information would have improved the rheumatologist’s differential diagnosis.
Next, we explored whether serologic data could improve clinical insight when added to our model. Serologic data improved a model with clinical and genetic data by 22%. As several studies have described a strong association between genetics and serology (42–44), we were surprised to find that serologic testing improved the model’s accuracy in addition to the genetic information. Assuming a setting where serology is available at the first visit, G-PROB still significantly improved R2 by 12% (P < 0.0001; table S6).
DISCUSSION
The number of patients with DNA genotyped before their first visit to a clinic is rapidly expanding. We investigated whether genetic information can help clinicians initially prioritize likely diagnoses and deprioritize unlikely ones among patients presenting with inflammatory arthritis. We observed that in a rheumatology setting, genetic information adds value to the clinical information obtained at the initial encounter, even when serologic data are available. Together, preexisting genetic data could be considered part of a patient’s medical history given its potential to improve precision medicine in the modern outpatient clinic.
Our results demonstrate that genetic data can provide probabilistic information to discriminate between multiple diseases presenting with similar clinical signs and symptoms. We investigated inflammatory arthritis, a hallmark of many rheumatic diseases associated 80% of the time with the diseases that we focused on in our study: RA, SLE, SpA, PsA, and gout (14–21). Because of the evolution of symptoms over time, disease classification by a clinician at a first visit is challenging, evidenced by the 35% misclassification of patients by the rheumatologist at first visit. Our data strongly suggest that using increasingly available genetic information would reduce this misclassification rate.
In settings I and II, we selected patients and assigned diagnoses using criteria based on billing codes and medical record review. We were more stringent in setting III, where we selected patients who presented with inflammatory arthritis for the first time at a rheumatology clinic; this setting was particularly illuminating since physician diagnoses changed over time. If a patient had inflammatory arthritis at their first visit, we followed their disease course until the final diagnosis. This thorough selection ensured that the analysis represented the study hypothesis that genetic data can facilitate disease differentiation in patients with early symptoms. Although this setting had relatively low patient numbers and an extra level of complexity due to the addition of the category other diseases, G-PROB was able to differentiate disease categories in patients presenting with inflammatory arthritis similar to setting II.
Although clinicians have several tests to prioritize their differential diagnosis, complex diseases such as rheumatic disease take notoriously long to diagnose; a third of patients with arthritis are initially classified as undifferentiated even when all test results are available (45), and 48% of SLE patients have to wait >6 months to receive their diagnosis (46). We expect that in the future, an increasing number of patients will have genetic data available before their visits, making it possible for a clinician to request a G-PROB calculation while reviewing a patients’ medical history before their visit. When more information is known about a patient’s disease (for instance, at later visits), the value of G-PROB will inevitably decrease. We have not tested how much it decreases over time. Since we found that G-PROB substantially contributes to disease classification even when serologic data are present, we conclude that G-PROB can complement the arsenal of tests available to future clinicians.
We developed G-PROB to discriminate between multiple related diagnoses by estimating probabilities of different diseases based on patients’ genetic data. The advantage of providing probabilities instead of a binary diagnostic classification is that it synergizes with the probabilistic reasoning of clinicians and can easily be incorporated into a differential diagnosis. In instances where the genetic probability for a disease is sufficiently high or low, a clinician can prioritize diagnostic testing accordingly.
The importance of differentiating diseases in patients with similar presenting symptoms is relevant not only in rheumatology but also in many other clinical settings in which patients present with similar symptoms, for example, endocrinology (late-onset type 1 diabetes versus type 2 diabetes), pulmonology (chronic obstructive pulmonary disease versus asthma), and cardiology (subsets of heart failure). Although genetic risk factors are known for many of these diseases, they have yet to be translated into clinical practice. The G-PROB method can serve as a template to develop symptom-tailored, disease-differentiating tests.
We acknowledge several limitations of our study. In settings I and II, patients with less severe disease may have been excluded. It is likely that patients with less severe disease have less genetic risk and that including such patients would decrease the value of G-PROB. This limitation was overcome in setting III. Nonetheless, to study the value of G-PROB in addition to clinical information, a prospective study is required to compare diagnostic efficiency when G-probabilities are available versus not. Second, nongenetic information available at a first visit such as family history and age could further improve the performance of predictive tests such as G-PROB. Future studies could combine both genetic and nongenetic factors, aiming for a more precise prediction model. We restricted our study to genetic factors as we designed a proof-of-principle study of the value of genetics to differentiate diseases in patients with inflammatory arthritis. Third, we note that genetic data from genome-wide association studies of rheumatic diseases were primarily available from self-reported white individuals. Lack of diversity of genetic studies could potentially cripple the clinical applicability of G-PROB and other genetic risk score strategies (43). Last, we note that data may be lacking on key disease subtypes. We note that there is a rapid explosion of biobank data, where a wide range of phenotypic information for patients with different backgrounds is being obtained alongside genetic data. These studies, such as the U.K. Biobank (47), may offer more clear data on the differences and similarities in the genetics of different inflammatory arthritic conditions, such as axial and peripheral SpA.
MATERIALS AND METHODS
Study design
We developed a tool, G-PROB, that translates a patient’s genetic profile into a risk score ranging from 0 to 1 (called a G-probability) for each possible disease of interest. We tested this tool in the situation where a patient presents with inflammatory arthritis and there are five likely disease diagnoses: RA, PsA, SpA, SLE, and gout. Thus, the genetic profile of a patient is translated into five probabilities, one for each disease that together add up to one. We tested how well these probabilities corresponded to a patient’s real disease. For example, for a patient with RA, ideal performance by G-PROB would result in the patient’s G-probability for RA being high and the G-probabilities of the other diseases being much lower.
We tested G-PROB in four settings (n = 50,743): simulation, two retrospective data collections, and one pseudo-prospective data collection. In the two retrospective settings, patients were selected using information at any time of their disease, whereas in the latter, patients had to have unexplained inflammatory arthritis at their first visit. This is described in more detail below.
Simulated data
To validate G-PROB in an optimal setting, we simulated a population of 1 million samples using the population-based allele frequencies of uncorrelated risk SNPs as reported for European samples (48). First, we calculated the number of samples with different genotype using the reported minor allele frequency (MAF) of Europeans from Ensembl (49), ensuring an allele distribution as expected under Hardy-Weinberg equilibrium
We then randomly assigned an SNP genotype to each sample by sampling without replacement and repeated this for all non-HLA SNPs. For the HLA region, we randomly sampled complete profiles [from a reference panel (50)] to ensure that the strong linkage structure of the HLA region would be present in our simulated data.
Next, we calculated the population-based disease probability for each simulated patient (Eq. 3) for each of the five rheumatic diseases. Case status was assigned when a patient’s disease probability was higher than a randomly sampled number between 0 and 1 from a binominal distribution. Using this approach, we created a set of 49,151 patients having one of the five diseases (fig. S1). In this set of 49,151 patients, we calculated the within-patient risk for each disease (Eqs. 4 and 5).
Setting I: ICD-based patient selection
The eMERGE network (37) is a consortium of medical centers with EMR linked with genetic information and biobank data such as billing diagnosis codes (ICD). It includes 83,717 patients from 12 medical centers and is a National Institutes of Health-approved collaboration. We obtained consent from the network to use the imputed genotypes, self-reported ethnicity, and ICD9 and ICD10 data for this study. We selected patients with one of our five rheumatic diseases using relevant ICD codes.
Previous studies have demonstrated that one ICD code is highly unreliable to identify real cases (51,52). To find the optimal number of ICD codes for patient selection, we explored the ICD code performance in previously reviewed medical records for RA in the Partners Biobank (53). Here, one rheumatologist screened the medical records and assigned case status both by the ACR 2010 criteria (14) and her expert opinion. We observed adequate PPV for when patients had >20 ICD9 or ICD10 codes (fig. S2 and table S2) and thus applied this cutoff to the eMERGE data (fig. S3). Table S3 summarizes the patient characteristics of setting I.
Setting II: Patient selection through manual review of medical records
Partners HealthCare Biobank comprises >80,000 subjects from Boston-based hospital centers (Brigham and Women’s Hospital, Massachusetts General Hospital, Faulkner Hospital, Newton-Wellesley Hospital, McLean Hospital, North Shore Medical Center, and Spaulding Rehabilitation Network) recruited from about 1.5 million patients (53). Written consent was obtained from each patient before their data were included in the Biobank. We obtained approval from the Partners Institutional Review Board to use the genotypes of these patients and access their clinical records.
We preselected records with clinical features that are typical for rheumatologic diseases (fig. S4). The selected records were completely reviewed manually (fig. S6), and patients were identified by applying the disease classification criteria (14–21). Table S4 summarizes the patient characteristics of setting II.
Setting III: Pseudo-prospective patient collection
Setting III data of patients were collected from the same biobank as in setting II but with a different selection process. We identified patients in a pseudo-prospective manner by manually reviewing the records of all patients who received ICD codes from a rheumatology clinic on the presence of inflammatory arthritis at their first visit (n = 1808). Next, we performed a complete manual chart review on the patients with inflammatory arthritis (fig. S6). From the patients in setting II, 107 had unexplained untreated inflammatory arthritis at first visit and were therefore included in setting III. Patients that did not fulfill any of the criteria of our five diseases of interest were classified as other diseases. We also extracted the highest-ranked diagnosis made by the rheumatologist at the first visit. See fig. S5 and table S5 for detailed patient selection criteria.
G-PROB calculation
Genome-wide association studies have used logistic regression to identify disease susceptibility factors in patients by comparing them with healthy controls. The resulting ORs refer to a relative increase in population-based odds of getting that disease. Our genetic probability model, G-PROB, uses these logORs to create a weighted genetic risk score (54). G-PROB consists of two steps:
The genetic risk score of individual i for disease k is defined as
| (1) |
where xij is the number of risk alleles of SNP j present for individual i and βkj is the logOR for SNP j obtained from previous genome-wide association studies (27–34) for disease k.
To correct for possible overestimation of the effect sizes due to publication bias (36), we shrank the logORs of each genetic variant by multiplying them by 0.5. We refer to this as the shrinkage factor. The genetic risk score can be used to calculate for each subject a population level disease probability (Pki) of each patient i for each disease k, using the logistic regression formula
| (2) |
The genetic risk score of each disease is combined with an intercept that ensures that the mean probability is equal to the predefined disease prevalence. αk is an unknown constant, estimated by assuming that the mean predicted pretest probability is equal to the population prevalence of disease k, by minimizing the following estimation equation
| (3) |
where PopPrevk is the assumed prevalence for disease k in the general population.
The next step is to calculate the conditional probability of each of the diseases of interest k, given that the patient has one of the five diseases [Pr(Yk = 1| Σ(Yk = 1)]. These within-patient genetic probabilities (cPki) of each patient (i) for each disease (k) were obtained through normalization of the population risk
| (4) |
G-PROB gives each patient a probability (G-probabilities) for each of the five diseases of our interest. The final product of G-PROB per patient is as follows
| (5) |
To summarize, G-PROB assigns a disease probability for each disease of interest based on a weighted genetic risk scores for the diseases, taking into account predefined, sex-specific disease prevalences, assuming that a patient has one of the possible diseases. G-PROB can be used to discriminate between any set of diseases, provided that there is sufficient knowledge of the genetic risk.
Application of G-PROB to rheumatological diseases
Selecting the prevalences.
We considered the five most common inflammatory arthritis-causing diseases: RA, SLE, SpA, PsA, and gout. For the purely retrospective analyses (simulated data, settings I and II), we assumed a population prevalence of 1% for each disease. Sex is genetically determined. We incorporated sex by adjusting the prevalence of disease to the sex-specific prevalences. For example, the risk for RA is three times higher in women than in men. Assuming an overall prevalence of RA of 1% and a 1:1 ratio of women and men, the RA prevalence is 1.5% in women and 0.5% in men. Thus, Eq. 3 was minimized for men and women separately. We used F:M risk ratios of 3:1, 9:1, 0.3:1, 1:1, and 0.3:1 for RA, SLE, SpA, PsA, and gout, respectively (55).
Derivation of genetic risk scores for rheumatological diseases.
We took genetic risk variants that obtained genome-wide significance (P < 5 × 10⁻⁸) for one or more of the five diseases from ImmunoBase (48) or (when not available) from the most recent genome-wide study on people of European decent (27–34). For all diseases except for gout, we then calculated disease-specific ORs such that SNPs contributing to the susceptibility of several rheumatic conditions had different ORs for each disease. If an SNP was not associated with the other diseases, the OR for those diseases was 1.0. If there were two SNPs associated to the same disease in linkage with each other (r2 > 0.8), then we selected the SNP with the highest OR.
We calculated genetic risk scores for gout in a different manner. One group developed a prediction model for gout translating the genetic b’s for uric acid levels into risk groups and assigned an OR to each group (28). We used this risk group categorization (β values per uric acid increase) and the corresponding OR to calculate the genetic risk score for gout.
For HLA, we searched recent large studies that provide dependent estimates for the HLA variants for each disease. This ensured that the ORs used in our study were corrected for the strong linkage disequilibrium in this region. Because the HLA risk differs between CCP+ and CCP− RA, we created a separate genetic risk score for CCP+ and CCP− RA using their specific HLA ORs in the datasets where CCP status was available (simulated data, settings II and III). We combined CCP+ and CCP− patients into one population probability for RA for each patient. In settings where no CCP status was known, we used the HLA variants for CCP+ RA. The final G-PROB model consisted of 208 SNPs outside the HLA region and 42 HLA variants such as SNPs, haplotypes, and alleles. The number of variants for each disease ranged from zero HLA variants (gout) to 21 variants (CCP+ RA) and 18 non-HLA variants (PsA) until 93 variants (CCP+ RA). Data file S1 summarizes the included risk variant information.
Optimizing G-PROB in pseudo-prospective setting III.
In our pseudo-prospective analysis (setting III), we added other diseases to the five diseases as a sixth category. The ORs for the genetic risk scores of the other diseases group were all 1.0, as thus far, no data on the genetic risk profile of these patients are available. We also obtained the real outpatient clinic disease prevalences, which we incorporated into the G-PROB calculation (data file S2).
Statistical analysis
All analyses were performed in R version ≥3.2 (56). Our primary test was the overall performance of G-PROB combining all diseases. G-PROB gives each patient a probability for each disease of interest (so-called G-probability), assuming that only one of these diseases is a patient’s real disease. We test this for rheumatic disease, but basically, every set of diseases can be implemented in G-PROB given that they are mutually exclusive. For analyses on G-PROB’s performance, we grouped all probabilities of all patients into one vector and created a corresponding vector, indicating whether a particular probability corresponded with a patient’s real disease. For example, the binary disease match vector contained 20% instances where the probability of one disease matches a patient’s real disease match and 80% nonmatch. If G-probabilities correctly differentiated diseases, the real disease matching probabilities would be higher than the nonmatching probabilities.
We tested the performance of G-probabilities as follows. First, we examined how well G-probabilities were calibrated with disease outcome. We performed a linear regression model without intercept using probabilities as independent variable and disease match as dependent variable. The regression coefficient (β) describes how well the model was calibrated (ideally, β is one) (57). Next, we explored the ability of G-probabilities to correctly classify disease status, using the AUC-ROC of multiclass classifications (58). The ROC depicts the true-positive rate [sensitivity (y axis)] against the false-positive rate [1 – specificity (x axis)] for the probabilities as test variable and disease match as gold standard. Higher AUCs indicate better classification: For a random predictor, AUC = 0.5, and for a perfect predictor, AUC = 1. Given our two-vector data summary, our AUCs are so-called microAUCs, as described in the R package multiROC (59). We also calculated a macroAUC that are averages of the AUCs of each disease group. We obtained 95% CI by bootstrapping (100 resamplings) (table S5). We statistically compared the AUCs of different G-PROBs (for instance, in the sensitivity analyses where we constructed G-PROB with different diseases) using DeLong’s method within R package pROC (58).
To test whether our choice for a shrinkage factor influenced our results, we reran G-PROB with 10 different shrinkage factors between zero and one. For each shrinkage factor, we tested the calibration, the log-likelihood (a measure of how well a model fits the data, where the higher the log-likelihood, the better the model fits) and the entropy scores (a measure for the disorganization of values, where the lower the entropy, the more organized the values are)
| (6) |
To test G-probabilities performance in setting III, we assigned a final diagnosis to patients presenting to a rheumatologist with synovial inflammation using complete chart review using data across all available visits. We also noted the rheumatologist’s initial diagnosis at first visit; as the rheumatologist had access to clinical information (physical exam, history, laboratory tests, referral records, etc.) when they made their initial diagnosis, we considered this initial diagnosis to be a proxy for all clinical information.
We applied multinomial logistic regression with the six disease categories as the dependent variables and the diseases probabilities and the clinical information (initial clinical diagnoses) as independent variables. We calculated the McFadden’s pseudo-R2 (the logistic regression equivalent of the explained variance of linear regression analyses) (41) to compare how different models—(I) the G-PROB, (II) the clinical information, and (III) the combination of the clinical information with the G-PROB—predict
| (7) |
We assessed whether the addition of the G-probabilities to the clinical information significantly improved the model using a likelihood ratio test.
Genotyping and imputation
Setting I (eMERGE) samples were genotyped on 78 Illumina and Affymetrix array batches with different genome coverage (34). We imputed missing genotypes using the Michigan Imputation Server with the minimac3 imputation algorithm (51) and the HRCvl.1 reference panel (60). Before imputation, data were curated using PLINK version 1.9b3 (61), applying the following settings: maximum per SNP missing of <0.02, maximum per person missing of <0.02, MAF of >0.01, and Hardy-Weinberg disequilibrium P value of 0.00001.
For settings II and III, at time of the initiation of this study, 15,047 patients of the Partners Biobank were genotyped, 4930 were genotyped on the Illumina Multi-Ethnic Genotyping Array (MEGA) chip, and the remaining were genotyped on Expanded MEGA (MEGAEX) chip (62). To obtain all relevant SNPs for the genetic risk score, we imputed the missing genotypes on the Michigan imputation server with the minimac3 imputation algorithm and 1000 genome phase 3 version 5 as reference panel. Before imputation, data were curated using PLINK version 1.9b3 (61), applying the following settings: maximum per SNP missing of <0.02, maximum per-person missing of <0.02, MAF of >0.01, and Hardy-Weinberg disequilibrium P value (exact) of 0.00001. In all settings, we required each genetic variant to have an imputation quality ≧0.8. In case a variant of interest was not present in the postimputed postcurated data, we searched for a proxy that was in close linkage with the original variant (r2 > 0.8). The included SNPs are listed in data file S1.
For all settings, we imputed HLA regions using SNP2HLA (54) using the T1DCG version 1.0.3 reference panel (50). This tool imputes amino acid polymorphisms and SNPs in HLA within the major histocompatibility complex region on chromosome 6.
Supplementary Material
Data file S1. ORs of curated risk variants for RA, RAneg, SLE, PsA, SpA, and gout.
Data file S2. Disease prevalence used in G-PROB per setting.
Fig. S1. Flowchart of the simulation study.
Fig. S2. Test characteristics of different ICD9 cutoffs for identification of RA cases using reviewed medical record data as the gold standard.
Fig. S3. Flowchart of patient selection in setting I.
Fig. S4. Flowchart of patient selection in setting II.
Fig. S5. Flowchart of patient selection in setting III.
Fig. S6. Flowchart of the medical record review procedure.
Fig. S7. Density plots of G-probabilities per disease.
Fig. S8. Precision recall curves.
Fig. S9. Sensitivity analysis of the performance of G-PROB per disease.
Fig. S10. Sensitivity analysis of the influence of individual diseases on G-PROB’s performance.
Fig. S11 Sensitivity analysis comparing different shrinkage factors.
Fig. S12. Test characteristics for the probabilities at different cutoffs.
Table S1. ICD9 and ICD10 codes used to identify patients in setting I (eMERGE).
Table S2. Patient characteristics in setting I.
Table S3. Patient characteristics in setting II.
Table S4. Patient characteristics in setting III.
Table S5. Area under the receiver operating curve per disease.
Table S6. McFadden’s R2 from multinomial logistic regression testing how much of the variance in the final disease diagnosis was explained by clinical, genetic, or serologic information.
Acknowledgments
Funding: R.K. is supported by ReumaNederland 15-3-301 and Niels Stensen Fellowship. K.P.L. is supported by the Harold and DuVal Bowen Fund. K.S. is supported by the National Institute of Arthritis and Musculoskeletal and Skin Diseases (NIAMS) F31 AR070582. This work is also supported by the NIH K24AR066109, R01 AR057327, and R01 AR049880 (to K.H.C.); P30 AR072577 (to K.P.L.); U01 HG008685 and 1OT2OD026553 (to E.W.K.); and U01 HG009379 and R01AR063759 (to S.R.).
Footnotes
SUPPLEMENTARY MATERIALS
Competing interests: S.R. has recently served as a consultant for Merck, Pfizer, and AbbVie and is currently serving as a consultant for Gilead and Biogen Idec. S.l.C. has consulted to Danone and DSMB in the past.
Data and materials availability: All data associated with this study are present in the paper or the Supplementary Materials. Genetic variants, G-probabilities, and final diagnoses are accessible through dbGAP under accessions phs000944.v1.p1 and phs001584.v1.p1.
REFERENCES AND NOTES
- 1.Evans JP, Powell BC, Berg JS, Introducing “Genomics and Precision Health”. JAMA 317, 1904–1905 (2017).28492888 [Google Scholar]
- 2.23andME, www.23andme.com/. [Google Scholar]
- 3.Ancestry, www.ancestry.com. [Google Scholar]
- 4.Murphy R, Ellard S, Hattersley AT, Clinical implications of a molecular genetic classification of monogenic β-cell diabetes. Nat. Clin. Pract. Endocrinol. Metab 4, 200–213 (2008). [DOI] [PubMed] [Google Scholar]
- 5.Reid S, Alexsson A, Frodlund M, Sandling JK, Svenungsson E, Jönsen A, Bengtsson C, Gunnarsson I, Bengtsson AA, Rantapaa-Dahlqvist S, Eloranta M-L, Syvänen A-C, Sjöwall C, Rönnblom L, Leonard D, High genetic risk score is associated with increased organ damage in SLE. Arthritis Rheumatol. 69, 5205 (2017). [Google Scholar]
- 6.Taylor KE, Chung SA, Graham RR, Ortmann WA, Lee AT, Langefeld CD, Jacob CO, Kamboh MI, Alarcón-Riquelme ME, Tsao BP, Moser KL, Gaffney PM, Harley JB, Petri M, Manzi S, Gregersen PK, Behrens TW, Criswell LA, Risk alleles for systemic lupus erythematosus in a large case-control collection and associations with clinical subphenotypes. PLOS Genet. 7, e1001311 (2011). [DOI] [PMC free article] [PubMed] [Google Scholar]
- 7.Maehlen MT, Olsen IC, Andreassen BK, Viken MK, Jiang X, Alfredsson L, Källberg H, Brynedal B, Kurreeman F, Daha N, Toes R, Zhernakova A, Gutierrez-Achury J, de Bakker PI, Martin J, Teruel M, Gonzalez-Gay MA, Rodriguez-Rodriguez L, Balsa A, Uhlig T, Kvien TK, Lie BA, Genetic risk scores and number of autoantibodies in patients with rheumatoid arthritis. Ann. Rheum. Dis 74, 762–768 (2015). [DOI] [PubMed] [Google Scholar]
- 8.Yarwood A, Han B, Raychaudhuri S, Bowes J, Lunt M, Pappas DA, Kremer J, Greenberg JD, Plenge R; Rheumatoid Arthritis Consortium International(RACI), Worthington J, Barton A, Eyre S, A weighted genetic risk score using all known susceptibility variants to estimate rheumatoid arthritis risk. Ann. Rheum. Dis 74, 170–176 (2015). [DOI] [PMC free article] [PubMed] [Google Scholar]
- 9.Sparks JA, Chen CY, Jiang X, Askling J, Hiraki LT, Malspeis S, Klareskog L, Alfredsson L, Costenbader KH, Karlson EW, Improved performance of epidemiologic and genetic risk models for rheumatoid arthritis serologic phenotypes using family history. Ann. Rheum. Dis 74, 1522–1529 (2015). [DOI] [PMC free article] [PubMed] [Google Scholar]
- 10.Hoffmann TJ, Ehret GB, Nandakumar P, Ranatunga D, Schaefer C, Kwok PY, Iribarren C, Chakravarti A, Risch N, Genome-wide association analyses using electronic health records identify new loci influencing blood pressure variation. Nat. Genet 49, 54–64 (2017). [DOI] [PMC free article] [PubMed] [Google Scholar]
- 11.Chibnik LB, Keenan BT, Cui J, Liao KP, Costenbader KH, Plenge RM, Karlson EW, Genetic risk score predicting risk of rheumatoid arthritis phenotypes and age of symptom onset. PLOS ONE 6, e24380 (2011). [DOI] [PMC free article] [PubMed] [Google Scholar]
- 12.Gottesman O, Scott SA, Ellis SB, Overby CL, Ludtke A, Hulot JS, Hall J, Chatani K, Myers K, Kannry JL, Bottinger EP, The CLIPMERGE PGx Program: Clinical implementation of personalized medicine through electronic health records and genomics-pharmacogenomics. Clin. Pharmacol. Ther 94, 214–217 (2013). [DOI] [PMC free article] [PubMed] [Google Scholar]
- 13.Kuehn BM, Pilot programs seek to integrate genomic data into practice. JAMA 318, 410–412 (2017). [DOI] [PubMed] [Google Scholar]
- 14.Aletaha D, Neogi T, Silman AJ, Funovits J, Felson DT, Bingham CO 3rd, Birnbaum NS, Burmester GR, Bykerk VP, Cohen MD, Combe B, Costenbader KH, Dougados M, Emery P, Ferraccioli G, Hazes JM, Hobbs K, Huizinga TW, Kavanaugh A, Kay J, Kvien TK, Laing T, Mease P, Menard HA, Moreland LW, Naden RL, Pincus T, Smolen JS, Stanislawska-Biernat E, Symmons D, Tak PP, Upchurch KS, Vencovsky J, Wolfe F, Hawker G, 2010 rheumatoid arthritis classification criteria: an American College of Rheumatology/European League Against Rheumatism collaborative initiative. Ann. Rheum. Dis. 69, 1580–1588 (2010). [DOI] [PubMed] [Google Scholar]
- 15.Arnett FC, Edworthy SM, Bloch DA, Mcshane DJ, Fries JF, Cooper NS, Healey LA, Kaplan SR, Liang MH, Luthra HS, Medsger TA jr., Mitchell DM, Neustadt DH, Pinals RS, Schaller JG, Sharp JT, Wilder RL, Hunder GG, The American Rheumatism Association 1987 revised criteria for the classification of rheumatoid arthritis. Arthritis Rheum. 31,315–324 (1988). [DOI] [PubMed] [Google Scholar]
- 16.Petri M, Orbai AM, Alarcón GS, Gordon C, Merrill JT, Fortin PR, Bruce IN, Isenberg D, Wallace DJ, Nived O, Sturfelt G, Ramsey-Goldman R, Bae SC, Hanly JG, Sánchez-Guerrero J, Clarke A, Aranow C, Manzi S, Urowitz M, Gladman D, Kalunian K, Costner M, Werth VP, Zoma A, Bernatsky S, Ruiz-Irastorza G, Khamashta MA, Jacobsen S, Buyon JP, Maddison P, Dooley MA, van Vollenhoven RF, Ginzler E, Stoll T, Peschken C, Jorizzo JL, Callen JP, Lim SS, Fessler BJ, Inanc M, Kamen DL, Rahman A, Steinsson K, Franks AG jr., Sigler L, Hameed S, Fang H, Pham N, Brey R, Weisman MH, McGwin G jr., Magder LS, Derivation and validation of the Systemic Lupus International Collaborating Clinics classification criteria for systemic lupus erythematosus. Arthritis Rheum. 64, 2677–2686 (2012). [DOI] [PMC free article] [PubMed] [Google Scholar]
- 17.Rudwaleit M, van der Heijde D, Landewé R, Akkoc N, Brandt J, Chou CT, Dougados M, Huang F, Gu J, Kirazli Y, Van den Bosch F, Olivieri I, Roussou E, Scarpato S, Sørensen IJ, Valle-Oñate R, Weber U, Wei J, Sieper J, The Assessment of SpondyloArthritis international Society classification criteria for peripheral spondyloarthritis and for spondyloarthritis in general. Ann. Rheum. Dis 70, 25–31 (2011). [DOI] [PubMed] [Google Scholar]
- 18.Rudwaleit M, van der Heijde D, Landewé R, Listing J, Akkoc N, Brandt J, Braun J, Chou CT, Collantes-Estevez E, Dougados M, Huang F, Gu J, Khan MA, Kirazli Y, Maksymowych WP, Mielants H, Sørensen IJ, Ozgocmen S, Roussou E, Valle-Onate R, Weber U, Wei J, Sieper J, The development of assessment of SpondyloArthritis International Society classification criteria for axial spondyloarthritis (part II): Validation and final selection. Ann. Rheum. Dis 68, 777–783 (2009). [DOI] [PubMed] [Google Scholar]
- 19.van der Linden S, Valkenburg HA, Cats A, Evaluation of diagnostic criteria for ankylosing spondylitis. A proposal for modification of the New York criteria. Arthritis Rheum. 27, 361–368 (1984). [DOI] [PubMed] [Google Scholar]
- 20.Taylor W, Gladman D, Helliwell P, Marchesoni A, Mease P, Mielants H; CASPAR Study Group, Classification criteria for psoriatic arthritis: Development of new criteria from a large international study. Arthritis Rheum. 54, 2665–2673 (2006). [DOI] [PubMed] [Google Scholar]
- 21.Neogi T, Jansen TL, Dalbeth N, Fransen J, Schumacher HR, Berendsen D, Brown M, Choi H, Edwards NL, Janssens HJ, Lioté F, Naden RP, Nuki G, Ogdie A, Perez-Ruiz F, Saag K, Singh JA, Sundy JS, Tausche AK, Vazquez-Mellado J, Yarows SA, Taylor WJ, 2015 gout classification criteria: An american college of rheumatology/european league against rheumatism collaborative initiative. Arthritis Rheum. 67, 2557–2568 (2015). [DOI] [PMC free article] [PubMed] [Google Scholar]
- 22.Finckh A, Choi HK, Wolfe F, Progression of radiographic joint damage in different eras: Trends towards milder disease in rheumatoid arthritis are attributable to improved treatment. Ann. Rheum. Dis 65, 1192–1197 (2006). [DOI] [PMC free article] [PubMed] [Google Scholar]
- 23.Korpela M, Laasonen L, Hannonen P, Kautiainen H, Leirisalo-Repo M, Hakala M, Paimela L, Blåfield H, Puolakka K, Möttönen T; FIN-RACo Trial Group, Retardation of joint damage in patients with early rheumatoid arthritis by initial aggressive treatment with disease-modifying antirheumatic drugs: Five-year experience from the FIN-RACo study. Arthritis Rheum. 50, 2072–2081 (2004). [DOI] [PubMed] [Google Scholar]
- 24.Baumgartner SW, Fleischmann RM, Moreland LW, Schiff MH, Markenson J, Whitmore JB, Etanercept (Enbrel) in patients with rheumatoid arthritis with recent onset versus established disease: Improvement in disability. J. Rheumatol 31,1532–1537 (2004). [PubMed] [Google Scholar]
- 25.Finckh A, Liang MH, van Herckenrode CM, de Pablo P, Long-term impact of early treatment on radiographic progression in rheumatoid arthritis: A meta-analysis. Arthritis Rheum. 55, 864–872 (2006). [DOI] [PubMed] [Google Scholar]
- 26.van der Linden MP, le Cessie S, Raza K, van der Woude D, Knevel R, Huizinga TW, van AH der Helm-van Mil, Long-term impact of delay in assessment of patients with early arthritis. Arthritis Rheum. 62, 3537–3546 (2010). [DOI] [PubMed] [Google Scholar]
- 27.Bentham J, Morris DL, Graham DSC, Pinder CL, Tombleson P, Behrens TW, Martín J, Fairfax BP, Knight JC, Chen L, Replogle J, Syvänen AC, Rönnblom L, Graham RR, Wither JE, Rioux JD, Alarcón-Riquelme ME, Vyse TJ, Genetic association analyses implicate aberrant regulation of innate and adaptive immunity genes in the pathogenesis of systemic lupus erythematosus. Nat. Genet 47, 1457–1464 (2015). [DOI] [PMC free article] [PubMed] [Google Scholar]
- 28.Raychaudhuri S, Sandor C, Stahl EA, Freudenberg J, Lee HS, Jia X, Alfredsson L, Padyukov L, Klareskog L, Worthington J, Siminovitch KA, Bae SC, Plenge RM, Gregersen PK, de Bakker PI, Five amino acids in three HLA proteins explain most of the association between MHC and seropositive rheumatoid arthritis. Nat. Genet 44, 291–296 (2012). [DOI] [PMC free article] [PubMed] [Google Scholar]
- 29.Okada Y, Wu D, Trynka G, Raj T, Terao C, Ikari K, Kochi Y, Ohmura K, Suzuki A, Yoshida S, Graham RR, Manoharan A, Ortmann W, Bhangale T, Denny JC, Carroll RJ, Eyler AE, Greenberg JD, Kremer JM, Pappas DA, Jiang L, Yin J, Ye L, Su DF, Yang J, Xie G, Keystone E, Westra HJ, Esko T, Metspalu A, Zhou X, Gupta N, Mirel D, Stahl EA, Diogo D, Cui J, Liao K, Guo MH, Myouzen K, Kawaguchi T, Coenen MJ, van Riel PL, van de Laar MA, Guchelaar HJ, Huizinga TW, Dieudé P, Mariette X, Bridges SL jr., Zhernakova A, Toes RE, Tak PP, Miceli-Richard C, Bang SY, Lee HS, Martin J, Gonzalez-Gay MA, Rodriguez-Rodriguez L, Rantapää-Dahlqvist S, Arlestig L, Choi HK, Kamatani Y, Galan P, Lathrop M; RACI consortium; GARNET consortium, Eyre S, Bowes J, Barton A, de Vries N, Moreland LW, Criswell LA, Karlson EW, Taniguchi A, Yamada R, Kubo M, Liu JS, Bae SC, Worthington J, Padyukov L, Klareskog L, Gregersen PK, Raychaudhuri S, Stranger BE, De Jager PL, Franke L, Visscher PM, Brown MA, Yamanaka H, Mimori T, Takahashi A, Xu H, Behrens TW, Siminovitch KA, Momohara S, Matsuda F, Yamamoto K, Plenge RM, Genetics of rheumatoid arthritis contributes to biology and drug discovery. Nature 506, 376–381 (2014). [DOI] [PMC free article] [PubMed] [Google Scholar]
- 30.Stuart PE, Nair RP, Tsoi LC, Tejasvi T, Das S, Kang HM, Ellinghaus E, Chandran V, Callis-Duffin K, Ike R, Li Y, Wen X, Enerbäck C, Gudjonsson JE, Kõks S, Kingo K, Esko T, Mrowietz U, Reis A, Wichmann HE, Gieger C, Hoffmann P, Nöthen MM, Winkelmann J, Kunz M, Moreta EG, Mease PJ, Ritchlin CT, Bowcock AM, Krueger GG, Lim HW, Weidinger S, Weichenthal M, Voorhees JJ, Rahman P, Gregersen PK, Franke A, Gladman DD, Abecasis GR, Elder JT, Genome-wide association analysis of psoriatic arthritis and cutaneous psoriasis reveals differences in their genetic architecture. Am. J. Hum. Genet 97, 816–836 (2015). [DOI] [PMC free article] [PubMed] [Google Scholar]
- 31.Köttgen A, Albrecht E, Teumer A, Vitart V, Krumsiek J, Hundertmark C, Pistis G, Ruggiero D, O’Seaghdha CM, Haller T, Yang Q, Tanaka T, Johnson AD, Kutalik Z, Smith AV, Shi J, Struchalin M, Middelberg RP, Brown MJ, Gaffo AL, Pirastu N, Li G, Hayward C, Zemunik T, Huffman J, Yengo L, Zhao JH, Demirkan A, Feitosa MF, Liu X, Malerba G, Lopez LM, van der Harst P, Li X, Kleber ME, Hicks AA, Nolte IM, Johansson A, Murgia F, Wild SH, Bakker SJ, Peden JF, Dehghan A, Steri M, Tenesa A, Lagou V, Salo P, Mangino M, Rose LM, Lehtimäki T, Woodward OM, Okada Y, Tin A, Müller C, Oldmeadow C, Putku M, Czamara D, Kraft P, Frogheri L, Thun GA, Grotevendt A, Gislason GK, Harris TB, Launer LJ, McArdle P, Shuldiner AR, Boerwinkle E, Coresh J, Schmidt H, Schallert M, Martin NG, Montgomery GW, Kubo M, Nakamura Y, Tanaka T, Munroe PB, Samani NJ, Jacobs DR jr. , Liu K, D’Adamo P, Ulivi S, Rotter JI, Psaty BM, Vollenweider P, Waeber G, Campbell S, Devuyst O, Navarro P, Kolcic I, Hastie N, Balkau B, Froguel P, Esko T, Salumets A, Khaw KT, Langenberg C, Wareham NJ, Isaacs A, Kraja A, Zhang Q, Wild PS, Scott RJ, Holliday EG, Org E, Viigimaa M, Bandinelli S, Metter JE, Lupo A, Trabetti E, Sorice R, Doring A, Lattka E, Strauch K, Theis F, Waldenberger M, Wichmann HE, Davies G, Gow AJ, Bruinenberg M; LifeLines Cohort Study, Stolk RP, Kooner JS, Zhang W, Winkelmann BR, Boehm BO, Lucae S, Penninx BW, Smit JH, Curhan G, Mudgal P, Plenge RM, Portas L, Persico I, Kirin M, Wilson JF, Leach IM, van Gilst WH, Goel A, Ongen H, Hofman A, Rivadeneira F, Uitterlinden AG, Imboden M, von Eckardstein A, Cucca F, Nagaraja R, Piras MG, Nauck M, Schurmann C, Budde K, Ernst F, Farrington SM, Theodoratou E, Prokopenko I, Stumvoll M, Jula A, Perola M, Salomaa V, Shin SY, Spector TD, Sala C, Ridker PM, Kähönen M, Viikari J, Hengstenberg C, Nelson CP; CARDIoGRAM Consortium; DIAGRAM Consortium; ICBP Consortium; MAGIC Consortium, Meschia JF, Nalls MA, Sharma P, Singleton AB, Kamatani N, Zeller T, Burnier M, Attia J, Laan M, Klopp N, Hillege HL, Kloiber S, Choi H, Pirastu M, Tore S, Probst-Hensch NM, Völzke H, Gudnason V, Parsa A, Schmidt R, Whitfield JB, Fornage M, Gasparini P, Siscovick DS, Polašek O, Campbell H, Rudan I, Bouatia-Naji N, Metspalu A, Loos RJ, van Duijn CM, Borecki IB, Ferrucci L, Gambaro G, Deary IJ, Wolffenbuttel BH, Chambers JC, März W, Pramstaller PP, Snieder H, Gyllensten U, Wright AF, Navis G, Watkins H, Witteman JC, Sanna S, Schipf S, Dunlop MG, Tönjes A, Ripatti S, Soranzo N, Toniolo D, Chasman DI, Raitakari O, Kao WH, Ciullo M, Fox CS, Caulfield M, Bochud M, Gieger C, Genome-wide association analyses identify 18 new loci associated with serum urate concentrations. Nat. Genet 45, 145–154 (2013). [DOI] [PMC free article] [PubMed] [Google Scholar]
- 32.Cortes A, Pulit SL, Leo PJ, Pointon JJ, Robinson PC, Weisman MH, Ward M, Gensler LS, Zhou X, Garchon HJ, Chiocchia G, Nossent J, Lie BA, Førre Ø, Tuomilehto J, Laiho K, Bradbury LA, Elewaut D, Burgos-Vargas R, Stebbings S, Appleton L, Farrah C, Lau J, Haroon N, Mulero J, Blanco FJ, Gonzalez-Gay MA, Lopez-Larrea C, Bowness P, Gaffney K, Gaston H, Gladman DD, Rahman P, Maksymowych WP, Crusius JB, van der Horst-Bruinsma IE, Valle-Oñate R, Romero-Sánchez C, Hansen IM, Pimentel-Santos FM, Inman RD, Martin J, Breban M, Wordsworth BP, Reveille JD, Evans DM, de Bakker PI, Brown MA, Major histocompatibility complex associations of ankylosing spondylitis are complex and involve further epistasis with ERAP1. Nat. Commun 6, 7146 (2015). [DOI] [PMC free article] [PubMed] [Google Scholar]
- 33.Reveille JD, Sims AM, Danoy P, Evans DM, Leo P, Pointon JJ, Jin R, Zhou X, Bradbury LA, Appleton LH, Davis JC, Diekman L, Doan T, Dowling A, Duan R, Duncan EL, Farrar C, Hadler J, Harvey D, Karaderi T, Mogg R, Pomeroy E, Pryce K, Taylor J, Savage L, Deloukas P, Kumanduri V, Peltonen L, Ring SM, Whittaker P, Glazov E, Thomas GP, Maksymowych WP, Inman RD, Ward MM, Stone MA, Weisman MH, Wordsworth BP, Brown MA, Genome-wide association study of ankylosing spondylitis identifies non-MHC susceptibility loci. Nat. Genet 42, 123–127 (2010). [DOI] [PMC free article] [PubMed] [Google Scholar]
- 34.Knevel R, Huizinga TWJ, Kurreeman F, Genomic influences on susceptibility and severity of rheumatoid arthritis. Rheum. Dis. Clin. N. Am 43, 347–361 (2017). [DOI] [PubMed] [Google Scholar]
- 35.Agresti A, An Introduction to Categorical Data Analysis (John Wiley and Sons, 1996). [Google Scholar]
- 36.Ioannidis JP, Ntzani EE, Trikalinos TA, Contopoulos-Ioannidis DG, Replication validity of genetic association studies. Nat. Genet 29, 306–309 (2001). [DOI] [PubMed] [Google Scholar]
- 37.Stanaway IB, Hall TO, Rosenthal EA, Palmer M, Naranbhai V, Knevel R, Namjou-Khales B, Carroll RJ, Kiryluk K, Gordon AS, Linder J, Howell KM, Mapes BM, Lin FTJ, Joo YY, Hayes MG, Gharavi AG, Pendergrass SA, Ritchie MD, de Andrade M, Croteau-Chonka DC, Raychaudhuri S, Weiss ST, Lebo M, Amr SS, Carrell D, Larson EB, Chute CG, Rasmussen-Torvik LJ, Roy-Puckelwartz MJ, Sleiman P, Hakonarson H, Li R, Karlson EW, Peterson JF, Kullo IJ, Chisholm R, Denny JC, Jarvik G; eMERGE Network, Crosslin DR, The eMERGE genotype set of 83,717 subjects imputed to ~40 million variants genome wide and association with the herpes zoster medical record phenotype. Genet. Epidemiol 43, 63–81 (2019). [DOI] [PMC free article] [PubMed] [Google Scholar]
- 38.Shannon CE, A mathematical theory of communication. BellSyst. Tech. J 27, 379–423 (1948). [Google Scholar]
- 39.Zink A, Listing J, Klindworth C, Zeidler H; German Collaboratrive Arthritis Centres, The national database of the German Collaborative Arthritis Centres: I. Structure, aims, and patients. Ann. Rheum. Dis 60, 199–206 (2001). [DOI] [PMC free article] [PubMed] [Google Scholar]
- 40.Miedema HS, van der Linden SM, Rasker JJ, Valkenburg HA, National database of patients visiting rheumatologists in The Netherlands: The standard diagnosis register of rheumatic diseases. A report and preliminary analysis. Br. J. Rheumatol 37, 555–561 (1998). [DOI] [PubMed] [Google Scholar]
- 41.McFadden DL, Conditional logit analysis of qualitative choice behavior. Front. Econ 38, 105–142 (1974). [Google Scholar]
- 42.de Vries RR, Huizinga TW, Toes RE, Redefining the HLA and RA association: To be or not to be anti-CCP positive. J. Autoimmun 25 (Suppl), 21–25 (2005). [DOI] [PubMed] [Google Scholar]
- 43.Martin AR, Gignoux CR, Walters RK, Wojcik GL, Neale BM, Gravel S, Daly MJ, Bustamante CD, Kenny EE, Human demographic history impacts genetic risk prediction across diverse populations. Am. J. Hum. Genet 100, 635–649 (2017). [DOI] [PMC free article] [PubMed] [Google Scholar]
- 44.Han B, Diogo D, Eyre S, Kallberg H, Zhernakova A, Bowes J, Padyukov L, Okada Y, González-Gay MA, Rantapää-Dahlqvist S, Martin J, Huizinga TW, Plenge RM, Worthington J, Gregersen PK, Klareskog L, de Bakker PI, Raychaudhuri S, Fine mapping seronegative and seropositive rheumatoid arthritis to shared and distinct HLA alleles by adjusting for the effects of heterogeneity. Am. J. Hum. Genet 94, 522–532 (2014). [DOI] [PMC free article] [PubMed] [Google Scholar]
- 45.van der Helm-van Mil AH, le Cessie S, van Dongen H, Breedveld FC, Toes RE, Huizinga TW, A prediction rule for disease outcome in patients with recent-onset undifferentiated arthritis: How to guide individual treatment decisions. Arthritis Rheum. 56, 433–440 (2007). [DOI] [PubMed] [Google Scholar]
- 46.Gaynon L, Liu N, Trupin L, Li J, Aggarwal I, Katz P, Dall’Era M, Criswell LA, Lanata C, Murphy L, Yazdany J, Diagnostic delays and disparities in access to care in systemic lupus erythematosus. Arthritis Rheum. 70 (suppl. 10), (2018). [Google Scholar]
- 47.Bycroft C, Freeman C, Petkova D, Band G, Elliott LT, Sharp K, Motyer A, Vukcevic D, Delaneau O, O’Connell J, Cortes A, Welsh S, Young A, Effingham M, Vean GM, Leslie S, Allen N, Donnelly P, Marchini J, The UK Biobank resource with deep phenotyping and genomic data. Nature 562, 203–209 (2018). [DOI] [PMC free article] [PubMed] [Google Scholar]
- 48.ImmunoBase, www.immunobase.org. [Google Scholar]
- 49.Ensembl GRCh37, http://grch37.ensembl.org/index.html. [Google Scholar]
- 50.Jia X, Han B, Onengut-Gumuscu S, Chen W-M, Concannon PJ, Rich SS, Raychaudhuri S, de Bakker PI, Imputing amino acid polymorphisms in human leukocyte antigens. PLOS ONE 8, e64683 (2013). [DOI] [PMC free article] [PubMed] [Google Scholar]
- 51.Singh JA, Holmgren AR, Noorbaloochi S, Accuracy of Veterans Administration databases for a diagnosis of rheumatoid arthritis. Arthritis Rheum. 51,952–957 (2004). [DOI] [PubMed] [Google Scholar]
- 52.Liao KP, Cai T, Gainer V, Goryachev S, Zeng-treitler Q, Raychaudhuri S, Szolovits P, Churchill S, Murphy S, Kohane I, Karlson EW, Plenge RM, Electronic medical records for discovery research in rheumatoid arthritis. Arthritis Care Res. 62, 1120–1127 (2010). [DOI] [PMC free article] [PubMed] [Google Scholar]
- 53.Karlson EW, Boutin NT, Hoffnagle AG, Allen NL, Building the partners healthcare biobank at partners personalized medicine: Informed consent, return of research results, recruitment lessons and operational considerations. J. Pers. Med 6, E2 (2016). [DOI] [PMC free article] [PubMed] [Google Scholar]
- 54.Dudbridge F, Power and predictive accuracy of polygenic risk scores. PLOS Genet. 9, e1003348 (2013). [DOI] [PMC free article] [PubMed] [Google Scholar]
- 55.Medscape, www.medscape.com. [Google Scholar]
- 56.R Core Team R: A language and environment for statistical computing (R Foundation for Statistical Computing, 2015); http://www.R-project.org/. [Google Scholar]
- 57.Bates D, Mächler M, Bolker B, Walker S, Fitting linear mixed-effects models using lme4. J. Stat. Softw 67, 10.18637/jss.v067.i01 (2015). [DOI] [Google Scholar]
- 58.Robin X, Turck N, Hainard A, Tiberti N, Lisacek F, Sanchez J-C, Müller M, pROC: An open-source package for R and S+ to analyze and compare ROC curves. BMC Bioinformatics 12, 77 (2011). [DOI] [PMC free article] [PubMed] [Google Scholar]
- 59.Wei R, Wang J, multiROC: Calculating and visualizing ROC and PR curves across multi-class classifications (2018); https://cran.r-project.org/web/packages/multiROC/index.html [accessed 30 April 2019].
- 60.Das S, Forer L, Schonherr S, Sidore C, Locke AE, Kwong A, Vrieze SI, Chew EY, Levy S, Gue MM, Schlessinger D, Stambolian D, Loh P-R, Iacono WG, Swaroop A, Scott LJ, Cucca F, Kronenberg F, Boehnke M, Abecasis GR, Fuchsberger C, Next-generation genotype imputation service and methods. Nat. Genet 48, 1284–1287 (2016). [DOI] [PMC free article] [PubMed] [Google Scholar]
- 61.Purcell S, Neale B, Todd-Brown K, Thomas L, Ferreira MA, Bender D, Maller J, Sklar P, de Bakker PI, Daly MJ, Sham PC, PLINK: A tool set for whole-genome association and population-based linkage analyses. Am. J. Hum. Genet 81,559–575 (2007). [DOI] [PMC free article] [PubMed] [Google Scholar]
- 62.Infinium: Expanded multi-ethnic genotyping array (MEGAEX), https://www.illumina.com/content/dam/illumina-marketing/documents/products/datasheets/mega-ex-data-sheet-370-2015-004.pdf. [Google Scholar]
Associated Data
This section collects any data citations, data availability statements, or supplementary materials included in this article.
Supplementary Materials
Data file S1. ORs of curated risk variants for RA, RAneg, SLE, PsA, SpA, and gout.
Data file S2. Disease prevalence used in G-PROB per setting.
Fig. S1. Flowchart of the simulation study.
Fig. S2. Test characteristics of different ICD9 cutoffs for identification of RA cases using reviewed medical record data as the gold standard.
Fig. S3. Flowchart of patient selection in setting I.
Fig. S4. Flowchart of patient selection in setting II.
Fig. S5. Flowchart of patient selection in setting III.
Fig. S6. Flowchart of the medical record review procedure.
Fig. S7. Density plots of G-probabilities per disease.
Fig. S8. Precision recall curves.
Fig. S9. Sensitivity analysis of the performance of G-PROB per disease.
Fig. S10. Sensitivity analysis of the influence of individual diseases on G-PROB’s performance.
Fig. S11 Sensitivity analysis comparing different shrinkage factors.
Fig. S12. Test characteristics for the probabilities at different cutoffs.
Table S1. ICD9 and ICD10 codes used to identify patients in setting I (eMERGE).
Table S2. Patient characteristics in setting I.
Table S3. Patient characteristics in setting II.
Table S4. Patient characteristics in setting III.
Table S5. Area under the receiver operating curve per disease.
Table S6. McFadden’s R2 from multinomial logistic regression testing how much of the variance in the final disease diagnosis was explained by clinical, genetic, or serologic information.