The current trend in CNS disease biology is to attempt to understand the neural-cell–immune interaction to investigate the underlying mechanism of neuroinflammation, rather than focusing on peripheral immune activation. Most studies in MS are targeted toward understanding the involvement of CNS white matter. However, the importance of gray matter damage has become critical in understanding the long-term progressive neurological disorder. Our study highlights the importance of CD4+ T cells in safeguarding neurons against axonal blebbing and poliomyelitis from murine betacoronavirus-induced neuroinflammation. Current knowledge of the mechanisms that lead to gray matter damage in MS is limited, because the most widely used animal model, experimental autoimmune encephalomyelitis (EAE), does not present this aspect of the disease. Our results, therefore, add to the existing limited knowledge in the field. We also show that the microglia, though important for the initiation of neuroinflammation, cannot establish a protective host immune response without the help of CD4+ T cells.
KEYWORDS: CD4+ T cells, microglia, MHV infection, neuroinflammation, innate immune response, demyelination, host immunity, axonal blebbing, MHV, poliomyelitis, RSA59, m-CoV
ABSTRACT
Mouse hepatitis virus (MHV) is a murine betacoronavirus (m-CoV) that causes a wide range of diseases in mice and rats, including hepatitis, enteritis, respiratory diseases, and encephalomyelitis in the central nervous system (CNS). MHV infection in mice provides an efficient cause-effect experimental model to understand the mechanisms of direct virus-induced neural-cell damage leading to demyelination and axonal loss, which are pathological features of multiple sclerosis (MS), the most common disabling neurological disease in young adults. Infiltration of T lymphocytes, activation of microglia, and their interplay are the primary pathophysiological events leading to disruption of the myelin sheath in MS. However, there is emerging evidence supporting gray matter involvement and degeneration in MS. The investigation of T cell function in the pathogenesis of deep gray matter damage is necessary. Here, we employed RSA59 (an isogenic recombinant strain of MHV-A59)-induced experimental neuroinflammation model to compare the disease in CD4−/− mice with that in CD4+/+ mice at days 5, 10, 15, and 30 postinfection (p.i.). Viral titer estimation, nucleocapsid gene amplification, and viral antinucleocapsid staining confirmed enhanced replication of the virions in the absence of functional CD4+ T cells in the brain. Histopathological analyses showed elevated susceptibility of CD4−/− mice to axonal degeneration in the CNS, with augmented progression of acute poliomyelitis and dorsal root ganglionic inflammation rarely observed in CD4+/+ mice. Depletion of CD4+ T cells showed unique pathological bulbar vacuolation in the brain parenchyma of infected mice with persistent CD11b+ microglia/macrophages in the inflamed regions on day 30 p.i. In summary, the current study suggests that CD4+ T cells are critical for controlling acute-stage poliomyelitis (gray matter inflammation), chronic axonal degeneration, and inflammatory demyelination due to loss of protective antiviral host immunity.
IMPORTANCE The current trend in CNS disease biology is to attempt to understand the neural-cell–immune interaction to investigate the underlying mechanism of neuroinflammation, rather than focusing on peripheral immune activation. Most studies in MS are targeted toward understanding the involvement of CNS white matter. However, the importance of gray matter damage has become critical in understanding the long-term progressive neurological disorder. Our study highlights the importance of CD4+ T cells in safeguarding neurons against axonal blebbing and poliomyelitis from murine betacoronavirus-induced neuroinflammation. Current knowledge of the mechanisms that lead to gray matter damage in MS is limited, because the most widely used animal model, experimental autoimmune encephalomyelitis (EAE), does not present this aspect of the disease. Our results, therefore, add to the existing limited knowledge in the field. We also show that the microglia, though important for the initiation of neuroinflammation, cannot establish a protective host immune response without the help of CD4+ T cells.
INTRODUCTION
Neuroinflammation is the cardinal signature of several complex and multifaceted central nervous system (CNS) disorders. CNS inflammation is known to be initiated mainly by the brain’s resident innate immune cells, the microglia, which rapidly respond to an infectious agent or any perturbation in the CNS. Via the secretion of chemokines and cytokines, they direct the extravasation of several types of myeloid cells, including neutrophils, monocytes/macrophages, and dendritic cells, which in turn promote the entry and activation of adaptive immune responsive T cell populations in the CNS (1–4).
Regulation of T cells is central to understanding cellular and humoral immunity in neuroinflammation. So far, most studies have demonstrated the destructive pathogenic effects of encephalitogenic T cells in neurodegeneration. For example, multiple sclerosis (MS), the most common neurological disease of young adults, is characterized predominantly by self-reactive myelinolytic T cell-mediated autoimmune destruction of the myelin sheath (5–10). Likewise, in an experimental animal model of MS, experimental autoimmune encephalomyelitis (EAE), the disease mainly depends on the infiltration of pathogenic CD4+ T cells, which are primarily of Th1 and Th17 types (11–19). Studies have also shown a pathogenic role of myelin-specific CD8+ T cells in the inflammatory lesions in EAE mouse brains (20–22). A mouse hepatitis virus (MHV) (V5A13.1) model of induced neuroinflammation showed a significant reduction in the severity of inflammation and demyelination in CD4−/− mice at days 12 to 21 postinfection (p.i.) compared to both CD8−/− and wild-type mice (23). Adoptive transfer of CD4+ T cells and CD8+ T cell-enriched splenocytes differentially affected the states of inflammation and demyelination in MHV-JHM-infected RAG−/− mice, and induction of donor splenocytes with a depleted population of both CD4+ and CD8+ T cells in JHM-infected RAG−/− mice prevented demyelination (24). However, recent advances have shown that the prevalence of activated adaptive immune responses is not restricted to neuroinflammatory myelin degeneration, as seen in MS, but translates across classic neurodegenerative disorders, such as Alzheimer’s disease (AD), Parkinson’s disease (PD), and amyotrophic lateral sclerosis (ALS) (25–30).
With the shift in the paradigm of CNS immunology and the discovery of CNS meningeal lymphatic vessels, several studies also suggested that CD4+ T cells may provide protective immunity against cognitive and motor disabilities in neurodegenerative disorders (31, 32). Activated CD4+ T cells also help in limiting MHV-JHM replication within the CNS (33). Either CD4 or CD8 deletion in a Theiler’s murine encephalomyelitis (TMEV)-resistant C57BL/6 (B6) mouse strain made the mice susceptible to disease, with increased viral persistence and demyelination (34). The current research trend is thus targeted toward understanding the differential mechanisms that regulate the balance between neuroprotection and neurodestruction conferred by CD4+ T cells.
Several studies have demonstrated the accumulation of microglia/macrophages in the vicinity of reactive CD4+ T cells in CNS lesions during neurodegeneration (4, 30, 35–37). While ample literature supports CD4+ T cell interaction with CNS-resident microglia and/or infiltrating myeloid-specific monocytes/macrophages as the primary mechanism underlying white matter damage in the early relapsing-remitting stage of MS, one cannot overlook their function in immune-mediated gray matter atrophy.
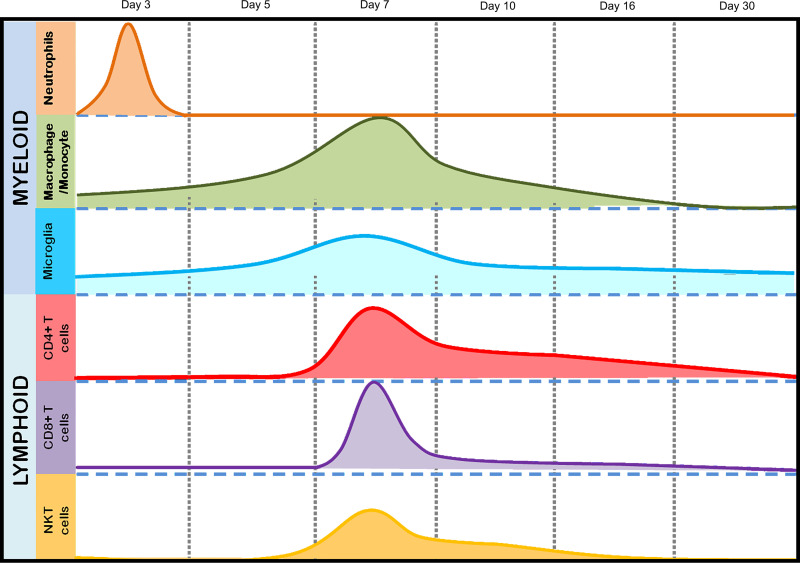
The current study focused on understanding the potential protective role of CD4+ T cells in microglial activation and their cooperative effect on both white and gray matter damage following infection with a neurotropic isogenic spike protein recombinant strain of the betacoronavirus MHV, RSA59. Intracranial infection of C57BL/6 mice with RSA59 results in a biphasic disease characterized by acute hepatitis and meningoencephalomyelitis, followed by chronic immune-mediated demyelination and concomitant axonal loss, which mimics specific pathologies of the human demyelinating (DM) disease MS (38–40). RSA59-induced acute neuroinflammation comprises mixed populations of astrocytes and inflammatory cells, mainly microglia/macrophages and a smaller population of T lymphocytes (40–44). As early as day 3 p.i., peripheral leukocytes start to infiltrate the CNS, beginning with the cells of the innate immune response, predominantly myeloid cells, such as neutrophils and monocytes/macrophages. Lymphoid cells, including CD4, CD8, and NK T cells, start to appear in the CNS at day 5 p.i., and their infiltration peaks at day 7 p.i., followed by the start of viral clearance (Fig. 1). While CD8+ T cells begin to disappear as early as day 10 p.i. and NK T cells are reduced in number, a significant number of CD4+ T cells are present in the inflamed brain even at day 16 p.i. (Fig. 1). While inflammation resolves and infectious virus particles clear from the brain, Iba1+ macrophages/microglia persist significantly within the demyelinating plaques in the spinal cord white matter and are known to cause direct myelin stripping (40). Recent Affymetrix microarray analysis of the spinal cords of RSA59-infected mice showed elevated expression of inflammatory mediators during the acute stage of infection. Interestingly, conventional T and B cell markers showed no or insignificant upregulation (45, 46). Expression of adaptive immune response genes showed prominent upregulation during the chronic phase (46). The most striking associations were observed between CD3, CD45, and major histocompatibility complex class II (MHC-II) expression, which promote communication between innate and adaptive immune systems via microglia-CD4+ T cell signaling.
FIG 1.
Temporal immune cell kinetics in the brains of RSA59-infected mice. The results from flow-cytometric analysis of the migration of inflammatory cells and CNS-resident cells from RSA59-infected mice are summarized in the schematic diagram. The diagram represents the differential infiltration of total myeloid (neutrophils, macrophages/monocytes, and microglia) and lymphoid (CD4, CD8, and NKT) cell populations at days 3, 5, 7, 10, 16, and 30 p.i. The peaks show the highest infiltration at the respective times postinfection. The scale is arbitrary.
The current study employed a CD4 knockout strain in the background of C57BL/6 (CD4−/−) mice. In comparison to wild-type C57BL/6 (CD4+/+) mice, infection of CD4−/− mice produces an exaggerated disease course in association with enhanced viral replication and prolonged viral persistence. Moreover, CD4−/− mice are more susceptible to chronic inflammation and axonal degeneration than CD4+/+ mice, and CD11b+ macrophages/microglia show persistent activation even during the chronic disease phase. Our results suggest a novel neuroprotective role of CD4+ T cells in the MHV-induced demyelinating model of MS, unlike the EAE model, where T cells have a predominantly pathogenic role.
RESULTS
Mice were inoculated with isogenic enhanced green fluorescent protein (EGFP)-expressing RSA59 as described in Materials and Methods. The experimental mice were monitored daily for the development of clinical signs and symptoms. The majority of CD4+/+ mice displayed low disease scores ranging from 0.5 to 1, indicated by ruffled fur and occasional presence of a hunchback phenotype, as observed previously (47). One hundred percent of the mice survived until day 30 p.i. Though not significantly different, CD4−/− mice showed a slightly higher disease score of 1.5 to 2, indicated by hind limb weakness in addition to the hunchback. The symptoms started appearing as early as day 3 to 5 p.i.; however, almost 90% of the mice survived until day 30 p.i. The scoring system is discussed in Materials and Methods.
The absence of functional CD4+ T cells does not alter acute-stage hepatitis and meningoencephalomyelitis but shows gray matter involvement in the form of poliomyelitis and dorsal root ganglion inflammation.
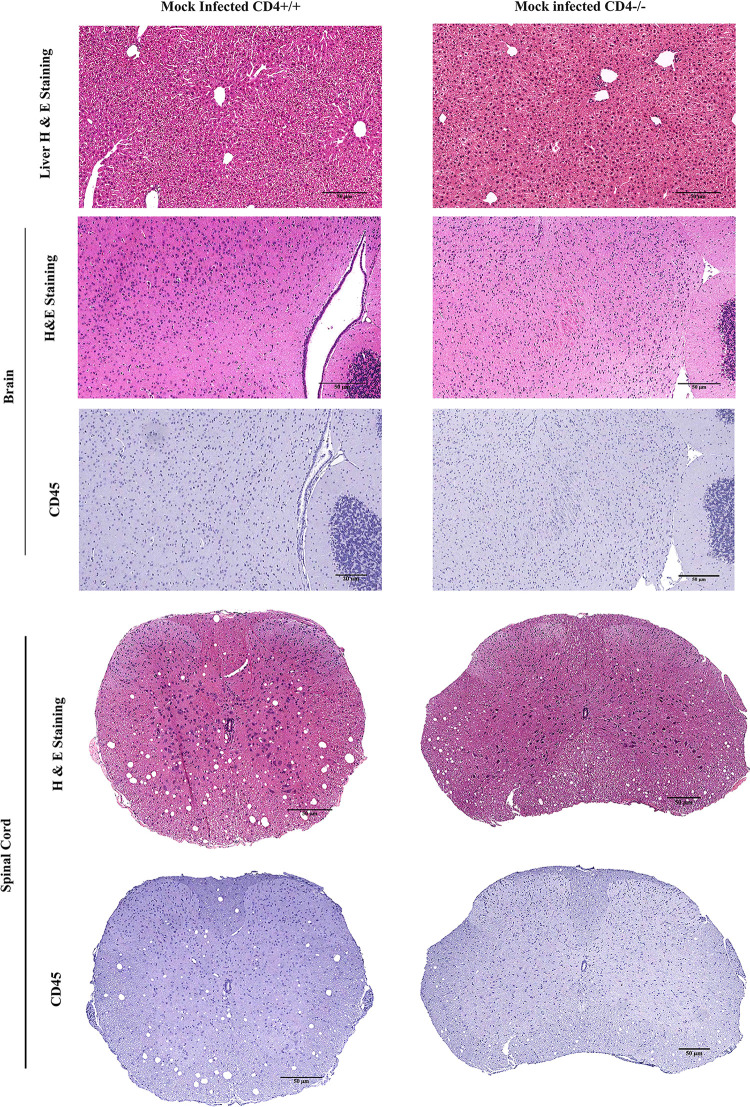
The current study initially investigated differences in phenotypic or pathological symptoms, as well as a basal level of inflammation at the tissue level between mock-infected (MI) CD4+/+ and CD4−/− mice. No significant differences were observed at the phenotypic level. Conventional light microscopy data analysis of hematoxylin and eosin (H&E)-stained sections from liver, brain, and spinal cord revealed that MI CD4+/+ and CD4−/− mice presented only a basal level of inflammation (if any) in the three tissue types (Fig. 2). Mock-infected CD4−/− mice did not show any differential phenotypic or histopathological features of interest for this study. All experiments were conducted using age-matched CD4+/+ and CD4−/− mice.
FIG 2.
Absence of CD4 causes no significant pathology in mock-infected mice. CD4+/+ and CD4−/− mice were infected with an uninfected cell lysate (PBS plus 0.075% BSA). Five-micrometer-thick liver, brain, and spinal cord sections were stained with H&E and CD45 for routine histopathological studies. No inflammation was observed in CD4+/+ and CD4−/− mouse tissues. The data represent 3 independent biological replicates. Scale bars, 50 μm.
To examine the degree of inflammation in CNS and non-CNS tissues, MI and infected CD4+/+ and CD4−/− mice were sacrificed at two time points, day 5 or 6 p.i. (the onset of peak neuroinflammation) and day 30 p.i. (the chronic phase of inflammation). Liver, brain, and spinal cord tissues were harvested, fixed in 4% paraformaldehyde (PFA), and embedded in paraffin.
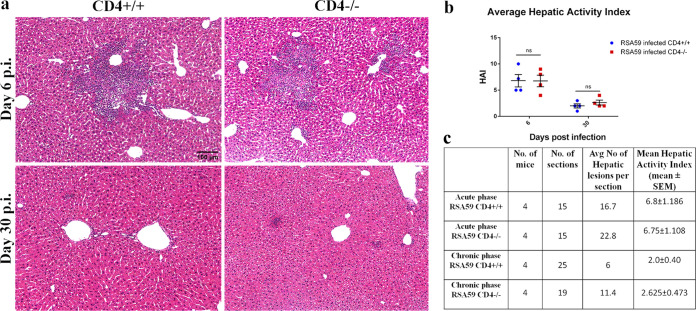
During the acute phase of infection, comparable multiple foci of moderate to severe necrotizing and nonnecrotizing hepatitis were observed in both CD4+/+ and CD4−/− mice (Fig. 3a). During the chronic phase, hepatitis nearly resolved, but the number of remnant hepatic lesions was greater in CD4−/− mice (Fig. 3b). The hepatic activity index (HAI) showed no significant difference at days 6 and 30 p.i. between CD4+/+ and CD4−/− mice (Fig. 3b).
FIG 3.
Absence of CD4 shows no significant alterations in RSA59-induced liver pathology. CD4+/+ and CD4−/− mice were infected with RSA59, and 5-μm-thick liver sections were stained with H&E for routine morphological studies. (a) CD4+/+ and CD4−/− mice showed similar features of necrotic/nonnecrotic hepatitis. (b) The hepatic activity index was calculated according to Ishak’s score, as described in Materials and Methods, and plotted. (c) The average numbers of hepatic lesions per section from each mouse were determined, and the combined results were tabulated. Liver sizes and cross-sectional areas were comparable in CD4+/+ and CD4−/− mice. The data are presented as means and SEM from 5 independent biological experiments. ns, not significant.
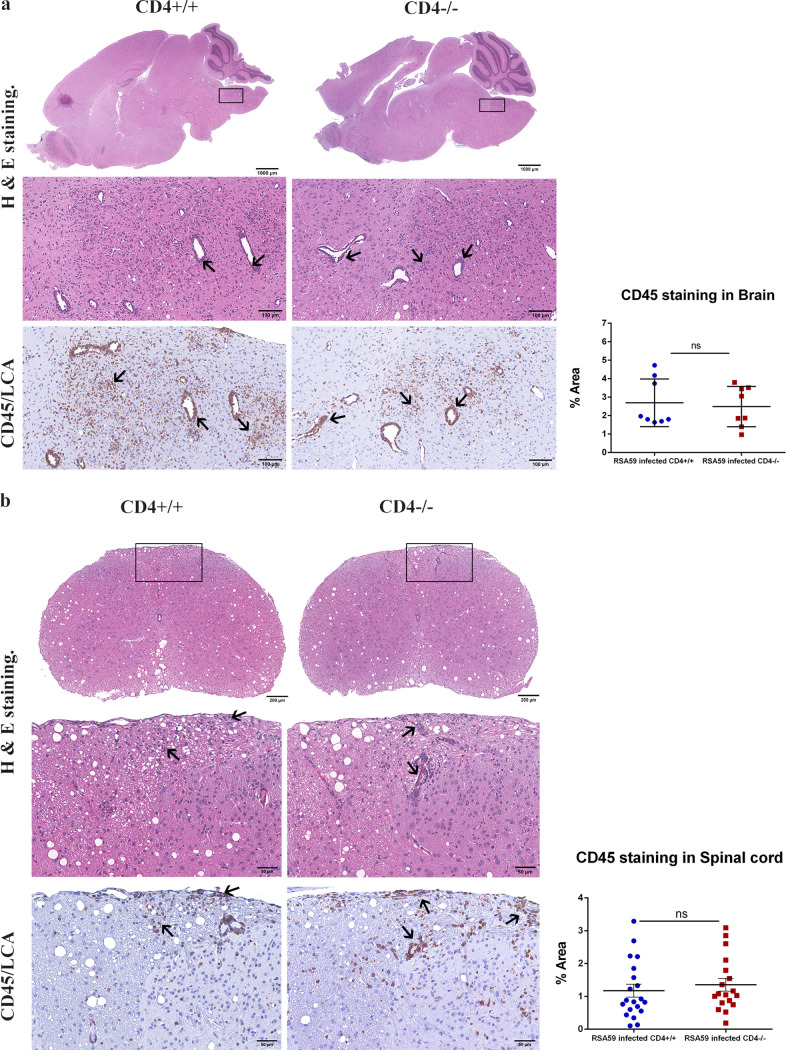
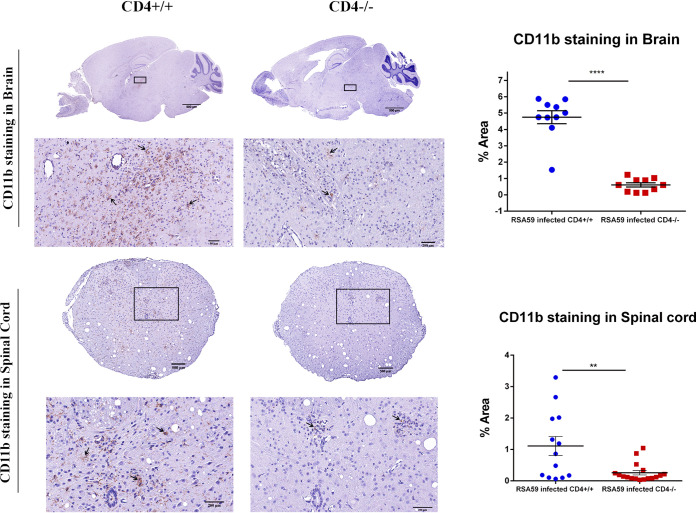
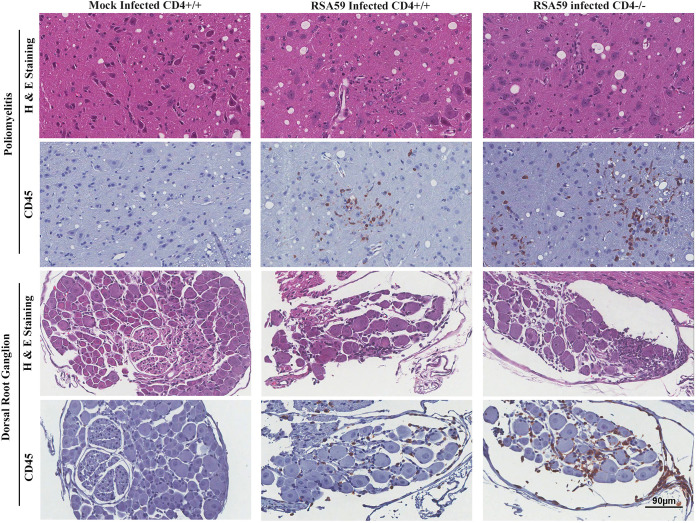
H&E-stained brain sections from RSA59-infected CD4+/+ and CD4−/− mice (Fig. 4a) demonstrated focal acute encephalitis, meningitis, intraparenchymal perivascular lymphocytic cuffing, and microglial nodule formation at the acute phase of infection. Corresponding serial brain sections immunohistochemically stained with anti-CD45 (leukocyte common antigen [LCA]) confirmed similar levels of inflammatory cells in the brain parenchyma of CD4+/+ (percent area, 2.691 ± 0.4561) and CD4−/− (2.485 ± 0.3849) mice (48). H&E staining of both CD4+/+ and CD4−/− infected spinal cords (Fig. 4b) showed myelitis. Quantification of the staining intensity suggested that corresponding regions were equally immunoreactive for CD45, indicating the comparable infiltration of mononuclear cells in CD4+/+ (1.176 ± 0.1958) and CD4−/− (1.355 ± 0.1947) mice. However, the consequent anti-CD11b (panmacrophage marker) immunohistochemistry revealed significantly fewer macrophages/microglia in the brains and spinal cords of CD4−/− mice (0.6067 ± 0.1260 [P < 0.0001] and 0.258 ± 0.07078 [P < 0.01], respectively) than in those of CD4+/+ mice (4.749 ± 0.3981 and 1.110 ± 0.3007, respectively) (Fig. 5). Moreover, apart from the white matter myelitis in both infected CD4+/+ and CD4−/− mice, CD4−/− mice showed evidence of acute poliomyelitis (gray matter inflammation) and dorsal root ganglionic inflammation, which were rarely observed in CD4+/+ mice at the acute phase of infection (Fig. 6). Average inflammation scores, based on H&E staining, are shown in Tables 1 and 2.
FIG 4.
Absence of CD4 demonstrates no significant changes in encephalomyelitis upon RSA59-induced acute infection. (a and b) (Left) At day 6 p.i., sections of brains (a) and spinal cords (b) from CD4+/+ mice and CD4−/− mice were stained with H&E and immunohistochemically for LCA. The boxed areas are shown at higher magnification below the corresponding brain midsagittal sections (a) or cross sections of spinal cord (b). The arrows in the zoomed sections mark characteristic perivascular cuffing and microglial nodule formation mediated by infiltrating inflammatory cells in the H&E-stained sections which correspond to immunoreactive leukocytes and microglia/macrophages in the CD45 immunohistochemically stained sections. (Right) Quantification of the intensity of staining plotted in scatter diagrams. Statistical analysis was performed using Student's t test and Welch correction. The data are presented as means and SEM from 5 independent biological experiments.
FIG 5.
Absence of CD4 resulted in a significant reduction of CD11b-positive microglia/macrophages in brains and spinal cords during RSA59-induced acute infection. (Left) At day 6 p.i., sections of brains and spinal cords from CD4+/+ mice and CD4−/− mice were immunohistochemically stained for CD11b (macrophage/microglia activation marker). The boxed areas are shown at higher magnification below the corresponding brain midsagittal sections (top) or cross sections of spinal cord (bottom). The arrows mark microglia/macrophages in the in the CD11b immunohistochemically stained sections. (Right) Quantification of the intensity of staining plotted in a scatter diagram. Statistical analysis was performed using Student's t test and Welch correction. **, P < 0.01; ****, P < 0.0001. The data are presented as means and SEM from 5 independent biological experiments.
FIG 6.
Absence of CD4 results in severe poliomyelitis and dorsal root ganglionic inflammation during acute RSA59 infection. Sections of CD4+/+ and CD4−/− mouse spinal cords were stained with H&E and immunohistochemically with anti-CD45. There was increased inflammation of the gray matter (poliomyelitis) and dorsal root ganglia in CD4−/− compared to CD4+/+ mice. Mock-infected mice showed no inflammation. n = 5.
TABLE 1.
| Mouse | No. of mice | No. of sections | % mice with inflammation | Mean inflammation score (±SEM) |
|---|---|---|---|---|
| Acute-phase RSA59 CD4+/+ | 4 | 8 | 100 | 1.8 ± 0.322 |
| Chronic-phase RSA59 CD4+/+ | 5 | 10 | 100 | 1.4 ± 0.163 |
| Acute-phase RSA59 CD4−/− | 4 | 8 | 100 | 2.0 ± 0.189 |
| Chronic-phase RSA59 CD4−/− | 4 | 10 | 100 | 2.5 ± 0.189 |
A significant difference between CD4+/+ and CD4−/− brains (P = 0.0004) was observed only at the chronic phase of infection.
TABLE 2.
Average inflammation scores in RSA59-infected CD4+/+ and CD4−/− mouse spinal cords (47)
| Mouse | No. of mice | No. of sections | % mice with inflammation | Mean score of inflammation (±SEM) |
|---|---|---|---|---|
| Acute-phase RSA59 CD4+/+ | 3a | 20 | 80 | 0.6 ± 0.112 |
| Chronic-phase RSA59 CD4+/+ | 5 | 30 | 100 | 0.76 ± 0.114 |
| Acute-phase RSA59 CD4−/− | 4 | 20 | 100 | 1.1 ± 0.143 |
| Chronic-phase RSA59 CD4−/− | 4 | 20 | 100 | 1.05 ± 0.05 |
One mouse was an outlier; it did not become infected.
The absence of CD4+ T cells impairs RSA59 clearance from the brain tissue.
To assess the role of CD4+ T cells in virus clearance, the viral titer, viral nucleocapsid gene amplification, in situ viral antigen distribution, and mRNA levels of antiviral proinflammatory cytokines/chemokines were evaluated.
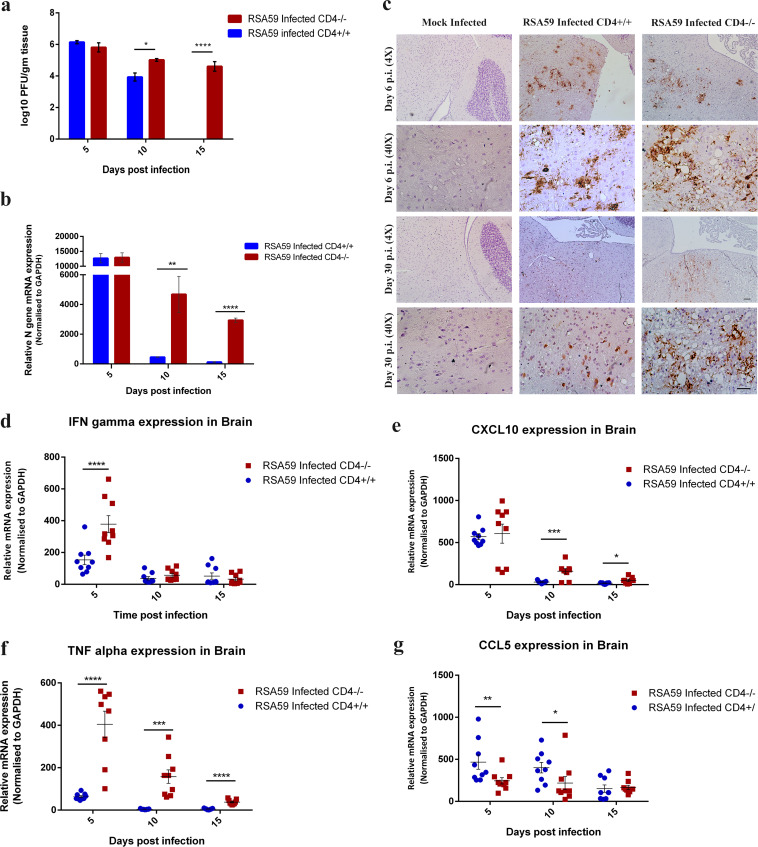
The RSA59 titer kinetics in the brains of CD4−/− and CD4+/+ mice were compared, and the values were expressed as log10 PFU per gram of tissue. In both mouse strains, the virus replicated efficiently in the brain at day 5 p.i. (105.8 PFU/g in CD4−/− versus 106.1 PFU/g in CD4+/+ mice). By day 10 p.i., CD4−/− mice averaged almost 1 log unit higher viral titers (105 PFU/g versus 103.9 PFU/g; P = 0.016) than CD4+/+ mice. On day 15 p.i., there were no detectable viral PFU in CD4+/+ mice; however, a significant number of infectious viral PFU were observed in CD4−/− mice (104.6 PFU/g; P = 0.0001) (Fig. 7a).
FIG 7.
Absence of CD4 results in reduced viral clearance and altered expression of antiviral effector genes. (a) Whole-brain lysates from CD4+/+ and CD4−/− mice at days 5, 10, and 15 p.i. were subjected to comparative viral plaque assays on confluent monolayers of L2 cells. Each time point represents the mean titer for three mice. (b) The relative abundances of transcripts corresponding to the viral N gene were compared using qRT-PCR in CD4+/+ and CD4−/− infected mouse brains at days 5, 10, and 15 p.i. (c) Anti-N immunohistochemistry revealed the differential in situ distributions of viral antigen in representative anatomical regions between brain stem and deep cerebellar white matter of mock-infected CD4+/+ and RSA59-infected CD4+/+ and CD4−/− mice at days 6 and 30 p.i. Scale bars, 100 μm (4×) and 50 μm (40×). (d to g) Relative gene expression of IFN-γ (d), CXCL10 (e), TNF-α (f), and CCL5 (g) at days 5, 10, and 15 p.i. was analyzed by qRT-PCR and compared between CD4+/+ and CD4−/− mice. The qRT-PCR results are expressed as mean fold change ± SEM. Statistical analysis of the data shown in panels a, b, d, e, f, and g was calculated using two-way ANOVA, and multiple comparisons were done by Holm-Sidak test; *, P < 0.05; **, P < 0.01; ***, P < 0.001; ****, P < 0.0001. The data represent the results from 3 independent biological experiments, with 3 technical replicates each.
To further confirm whether differences in viral replication might affect viral infection, quantitative real-time PCR (qRT-PCR) of the viral N (nucleocapsid) gene from brain tissues from MI and CD4+/+ and CD4−/− infected mice was performed. As shown in Fig. 7b, viral persistence was comparable in both CD4+/+ and CD4−/− mice (1.02- ± 0.176-fold) at day 5 p.i. At day 10 and day 15 p.i., the N gene transcript showed significant upregulation (10.230- ± 2.677-fold [P = 0.003] and 23.247- ± 5.204-fold [P < 0.0001], respectively), in CD4−/− compared to CD4+/+ mice.
To determine the spread of infectious viral particles in situ, immunohistochemical analysis of viral anti-nucleocapsid antigen was performed on sections of infected brains obtained from CD4+/+, CD4−/−, and MI mice at the acute and chronic phases of infection. In MI mice, viral antigen was observed neither at day 6 nor at day 30 p.i., as expected (Fig. 7c). Postintracranial inoculation, RSA59 replicated profusely in CD4+/+ mice and spread rapidly from the lateral geniculate nuclei to several regions of the brain, including the olfactory bulb, basal forebrain, cerebral cortex, anterior commissure, brain stem, and deep cerebellar white matter. By day 6 p.i., viral antigen became restricted to the midbrain, pons, and deep cerebellar white matter in the current study (data not shown). Similar viral anti-nucleocapsid antigen staining was observed in infected CD4−/− mice at day 6 p.i. Day 30 postinfected brains of CD4+/+ mice showed significantly reduced viral antigen staining, as expected, whereas a considerable number of cells remained positive for viral anti-nucleocapsid antigen in the CD4−/− mice (Fig. 7c).
Moreover, interferon gamma (IFN-γ) mRNA expression was significantly higher at day 5 p.i. in CD4−/− mice (2.45- ± 0.59-fold; P = 0.0020) (Fig. 7d) than in CD4+/+ mice, indicating higher viral replication in CD4−/− mice. Similarly, peripheral leukocyte chemoattractant IFN-γ-inducible CXCL10 (a C-X-C chemokine) mRNA expression remained significantly upregulated even at day 10 p.i. (5.102- ± 1.253-fold; P = 0.0008) and day 15 p.i. (2.965- ± 0.858-fold; P = 0.015) in the infected CD4−/− mice (Fig. 7e) compared to CD4+/+ mice. Also, antiviral tumor necrosis factor alpha (TNF-α) mRNA expression was observed to be significantly upregulated at all time points in CD4−/− mice, in comparison to CD4+/+ mice (6.372- ± 1.10-fold [P < 0.0001] at day 5, 37.949- ± 9.534-fold [P = 0.00018] at day 10, and 7.348- ± 1.675-fold [P < 0.0001] at day 15) (Fig. 7f). At the same time, CD4−/− mice displayed lower levels of RANTES (regulated upon activation, normal T cell expressed and presumably secreted) or CCL5 (a C-C chemokine) involved in trafficking of macrophages/monocytes into the CNS (P < 0.05) than CD4+/+ mice (Fig. 7g).
Viral-plaque assays and qRT-PCR of viral N gene and antiviral cytokine and chemokine expression (IFN-γ, TNF-α, and CXCL10) at days 5, 10, and 15 p.i. in conjunction with the viral anti-nucleocapsid antigen staining at day 30 p.i. confirmed prolonged persistence of RSA59 in the absence of functional CD4 in brain tissue.
The absence of CD4+ T cells exacerbates CNS inflammation and myelin loss at the chronic stage of inflammation.
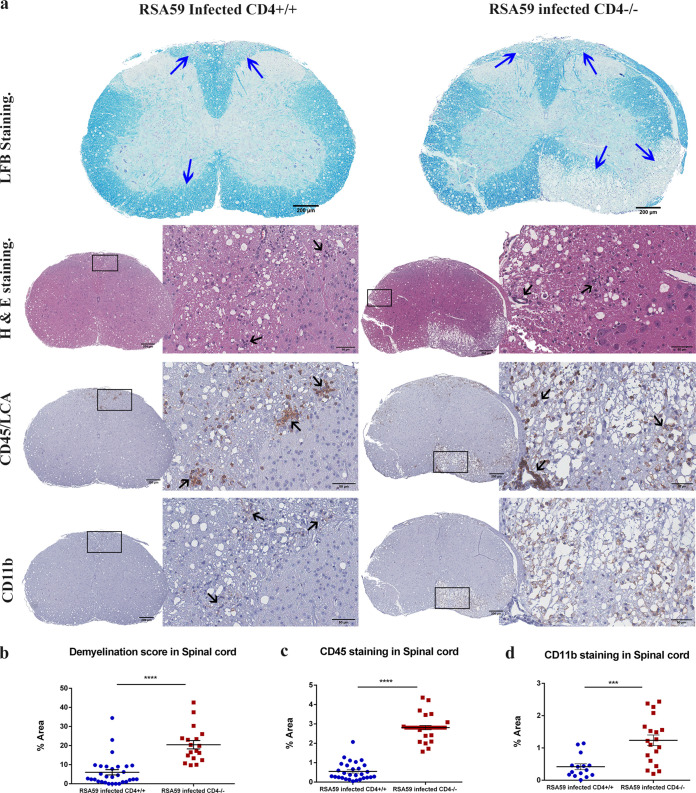
The role of functional CD4+ T cells in demyelination was next examined by histopathological analysis of day 30 postinfected spinal cords from CD4+/+ and CD4−/− mice. In CD4+/+ mice, inflammation was observed in the dorsal/posterior columns, anterior horn, and/or lateral descending tracts. H&E staining highlighted the inflammation in the ventrolateral white matter. In contrast, CD4−/− mice demonstrated vacuolar pathology with swollen axons throughout the white matter involving the ventral and lateral descending tracts upon H&E staining (Fig. 8a). Corresponding inflamed regions from serial sections also showed myelin loss by Luxol fast blue (LFB) staining in both CD4+/+ and CD4−/− mice. The degree of demyelination was significantly higher in the CD4−/− mice (20.45 ± 2.174; P < 0.0001) than in CD4+/+ mice (6.008 ± 1.375) (48) (Fig. 8b). CD45 immunoreactive inflammatory cells were present within the demyelinating plaques in both CD4+/+ and CD4−/− mice; however, the extent of inflammation was considerably greater in CD4−/− mice (2.812 ± 0.1122; P < 0.0001) than in CD4+/+ mice (0.5509 ± 0.08550) (Fig. 8c). Interestingly, in contrast to the acute phase of infection, CD4−/− mouse spinal cords showed highly significant CD11b microglia/macrophage expression (1.237 ± 0.1646; P < 0.001) in comparison to CD4+/+ mice (0.4175 ± 0.09144) (Fig. 8d).
FIG 8.
Absence of CD4 leads to severe chronic inflammatory demyelination and axonal loss. (a) Cross sections of CD4+/+ and CD4−/− mouse spinal cords were analyzed for the presence of inflammatory lesions by H&E, demyelination by LFB, and inflammatory cells by anti-CD45 and anti-CD11b (microglia/macrophages) immunohistochemistry. The boxed areas are shown at higher magnification at the right of the corresponding spinal cord cross sections. The arrows mark demyelinating plaques on the LFB-stained sections, infiltrating inflammatory cells in the H&E-stained sections, and immunoreactive leukocytes and microglia/macrophages in the CD45 and CD11b immunohistochemically stained sections. (b, c, and d) Levels of demyelination and inflammation plotted in a scatter diagram. Statistical significance was calculated by unpaired Student's t test and Welch correction. ***, P < 0.001; ****, P < 0.0001. The data represent the results from 4 or 5 independent biological experiments. The error bars represent SEM.
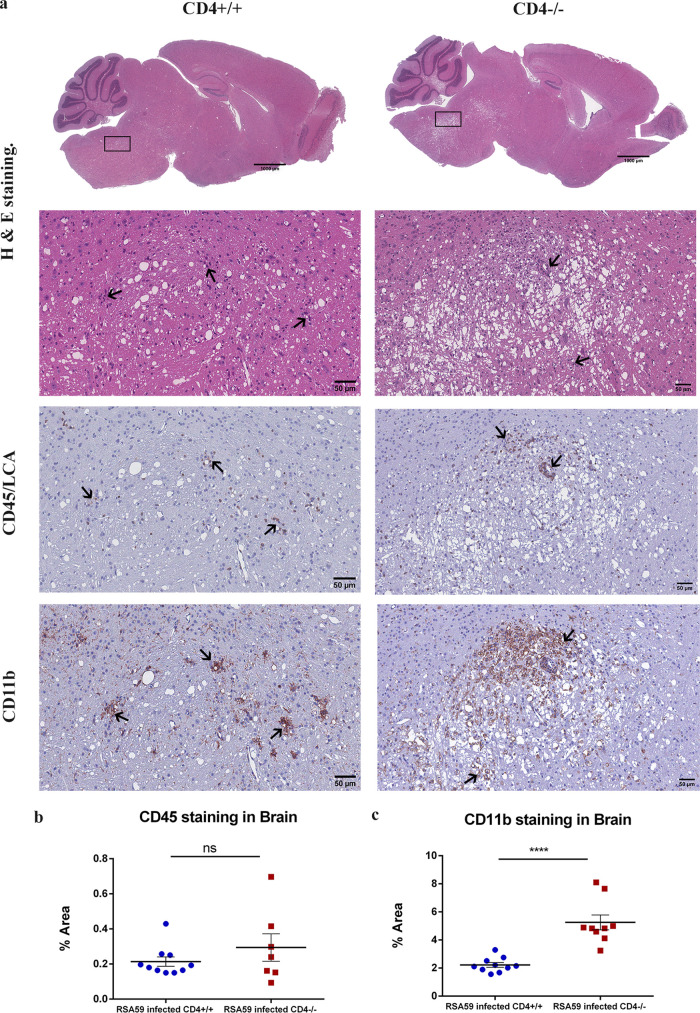
Quite strikingly, in contrast to the brains of CD4+/+ mice (Fig. 9a), CD4−/− mice exhibited extensive vacuolation in the brain stem and the deep cerebellar white matter tracts, which had not been observed in previous studies. No significant differences in CD45 staining were observed between the two groups (Fig. 9b). Large numbers of CD11b-positive microglia/macrophages were observed in the vicinity of the vacuolated regions in CD4−/− mice (5.251 ± 0.5298; P < 0.0001) compared to CD4+/+ mice (2.220 ± 0.1639) (Fig. 9c).
FIG 9.
Absence of CD4 causes abnormal bulbar (brainstem) vacuolation and neuronal loss in RSA59-infected brains at day 30 p.i. (a) Serial sagittal sections of brains from CD4+/+ and CD4−/− mice were analyzed for inflammation at day 30 p.i. by H&E staining and immunohistochemically by CD45 and CD11b staining. The boxed areas are shown at higher magnification below the corresponding brain midsagittal sections. The arrows mark infiltrating inflammatory cells in the H&E-stained sections and immunoreactive leukocytes and microglia/macrophages in the CD45 and CD11b immunohistochemically stained sections. (b and c) Quantification of inflammation was performed for CD45 (b) and CD11b (c) staining. The level of significance was calculated by unpaired Student's t test and Welch correction. ns, not significant; ****, (P < 0.0001). The error bars represent SEM. The data represent results from 4 or 5 independent biological experiments.
The absence of CD4+ T cells aggravates axonopathy.
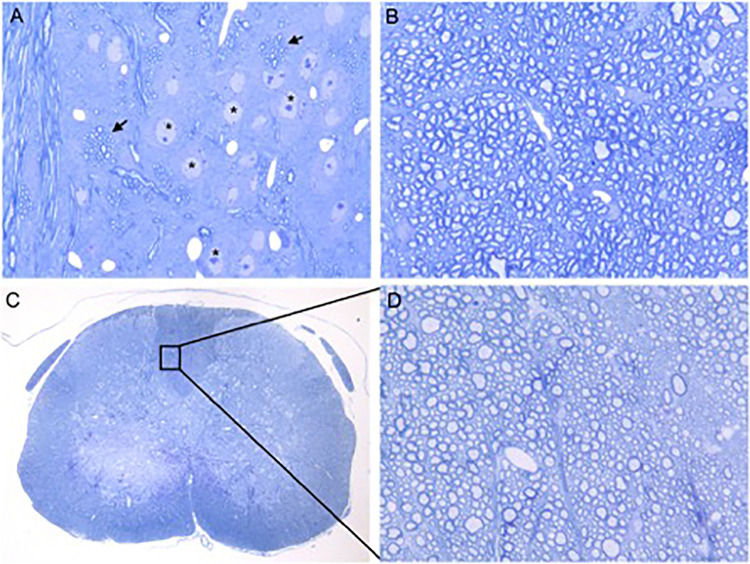
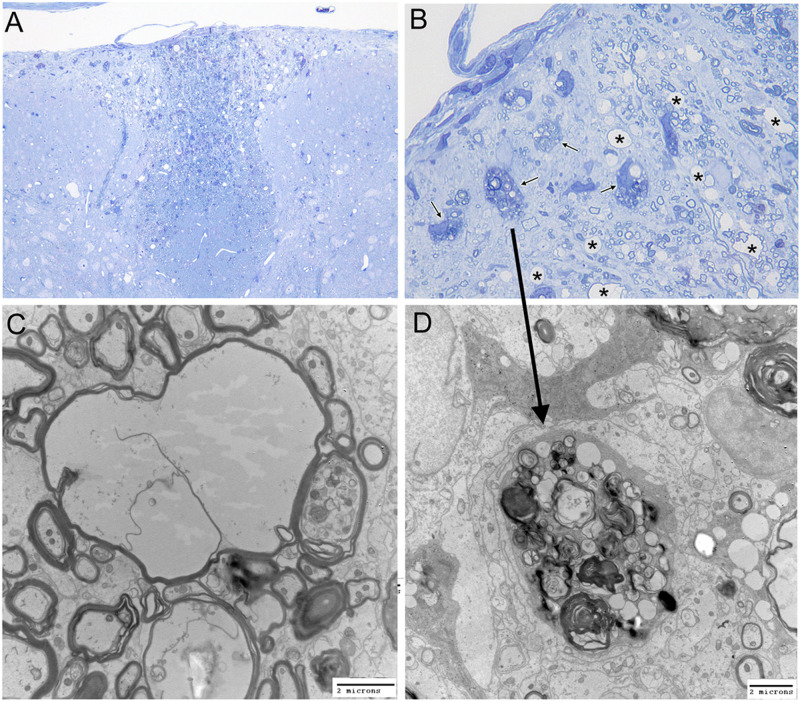
One-micrometer-thick sections of glutaraldehyde-fixed brains and spinal cords from RSA59-infected CD4−/− and CD4+/+ mice and MI CD4−/− mice were stained with toluidine blue. MI CD4−/− mice did not show any visible signs of inflammation (Fig. 10) or spinal cord damage. Infected CD4−/− mice exhibited vacuolation and axonal degeneration in the posterior columns (Fig. 11A and B). Electron microscopy (EM) of the vacuolated brainstem lesions in CD4−/− mice revealed that the vacuolation represented numerous swollen degenerating axons and a few inflammatory cells (lymphocytes and macrophages). There was no evidence of isolated demyelination (myelin loss with relative axonal preservation) (data not shown). Similarly, electron micrographs of the spinal cord white matter lesions (Fig. 11C and D) also showed axonal degeneration and a lack of demyelination. No inflammatory cells (lymphocytes and macrophages) were present within the areas of white matter damage (Fig. 11C).
FIG 10.
Absence of CD4 causes no alteration in axon-myelin coherence in the brain stems and spinal cords of mock-infected mice. Shown are toluidine blue-stained sections of glutaraldehyde-fixed, epoxy resin-embedded sections (500 nm thick) from mock-infected CD4−/− mouse brain stems (A and B) and spinal cords (C and D). (A) Gray and white matter of the brain stem. The arrows mark bundles of intact myelinated fibers. The asterisks mark the neuronal nuclei. Original magnification, ×400. (B) Brain stem white matter. Original magnification, ×1,000. (C) Spinal cord cross section. Original magnification, ×40. (D) Further magnification of posterior columns in the boxed area of panel C. Original magnification, ×1,000. White and gray matter in both the brain stem and spinal cord showed no evidence of inflammation, demyelination, or cellular injury.
FIG 11.
Absence of CD4 results in severe spinal cord axonal injury upon RSA59 infection at the chronic stage. (A and B) Toluidine blue-stained sections. Posterior columns (magnification, ×200 [A] and ×1,000 [B]) demonstrating clusters of degenerating axons. Arrows, degenerating axons; asterisks, swollen myelin sheaths. (C and D) Corresponding electron microscopy. (C) Swollen myelin sheaths with loss of axoplasm (magnification, ×7,500). (D) Cluster of degenerating axons with collapsed myelin sheaths (magnification, ×10,000). The arrow shows the corresponding area on the toluidine blue-stained section. Scale bars, 2 μm. The data represent the results from 3 independent biological experiments.
In the absence of CD4+ T cells, mice show differential expression of inflammatory cytokines.
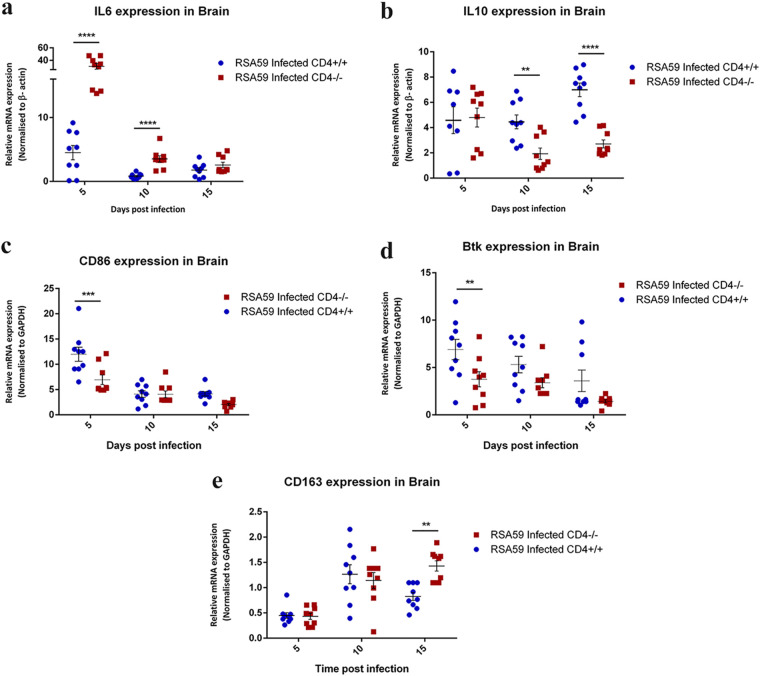
The inflammatory cells in the demyelinating lesions induced by RSA59 exhibited variable expression of pro- and anti-inflammatory cytokines. Expression of proinflammatory interleukin 6 (IL-6) and IL-12p40 and anti-inflammatory IL-10 was examined in RSA59-infected mouse brains. Quantitative-PCR results revealed that IL-6 expression was significantly higher in CD4−/− mice than in CD4+/+ mice at both day 5 p.i. (6.742- ± 1.955-fold; P < 0.0001) and day 10 p.i. (4.24- ± 0.912-fold; P < 0.0001) and subsequently declined at day 15 p.i. in both groups of mice (Fig. 12a). IL-10 expression patterns, as revealed by real-time PCR, showed similar expression in the RSA59-infected CD4+/+ and CD4−/− mice at day 5 p.i. However, at days 10 (2.579- ± 0.72-fold; P = 0.003) and 15 (2.58- ± 0.363-fold; P < 0.0001) p.i., CD4+/+ mice showed significantly elevated expression of IL-10 compared to infected CD4−/− mice (Fig. 12b). IL-12p40 mRNA expression demonstrated no major differences between CD4+/+ and CD4−/− mice following RSA59 infection (data not shown). Together, the expression patterns of IL-6 and IL-10 indicate a robust inflammatory environment in the brains of CD4−/− mice.
FIG 12.
qRT-PCR analysis of IL-6, IL-10, CD86, Btk, and CD163 revealed an inflammatory state in the brains of RSA59-infected CD4−/− mice. Quantitative-PCR analysis of IL-6 (a), IL-10 (b), CD86 (c), Btk (d), and CD163 (e) was performed in RSA59-infected CD4+/+ and CD4−/− mouse brains at days 5, 10, and 15. The data represent the results from 3 independent biological experiments, with 3 technical replicates each. Statistical analysis was performed by two-way ANOVA and the Holm-Sidak multiple-comparison test; **, P < 0.01; ***, P < 0.001; ****, P < 0.0001. The error bars represent SEM.
The absence of CD4+ T cells influences macrophage polarization.
Using the classical M1/M2 nomenclature of macrophage polarization, it was observed that mRNA expression of classical M1 macrophage (proinflammatory) markers, such as CD86 and Bruton’s tyrosine kinase (Btk), were significantly reduced in infected CD4−/− mice in comparison to CD4+/+ mice at day 5 p.i. (0.445- ± 0.128-fold [P < 0.001] and 0.545- ± 0.134-fold [P < 0.01] for CD86 and Btk, respectively) (Fig. 12c and d). However, as the course of disease progressed toward the chronic phase, microglia/macrophages in the infected CD4−/− mice showed an M2 phenotype (anti-inflammatory) in contrast to the CD4+/+ mice, as observed from the significant upregulation in the mRNA expression of the M2 macrophage marker CD163 at day 15 p.i. (2.018- ± 0.392-fold; P < 0.0001) (Fig. 12e).
DISCUSSION
The CNS is no longer considered an immune-privileged site (49). A significant number of peripheral CD4+ T cells patrol the cerebrospinal fluid (CSF) in order to detect the presence of potentially harmful pathogens (50–52). If these T cells do not encounter their cognate antigens, they take the lymphatic route to exit the CNS. However, they infiltrate the CNS parenchyma upon sensing any sign of neuroinflammation (52, 53). MHV infection in mice is an established archetype animal model used to understand the demyelination pathology in MS. In this study, we present a protective role of CD4+ T cells in virus-induced neuroinflammatory demyelination in contrast to the pathogenic role of CD4+ T cells in MS (54) and its autoimmune experimental model, EAE. Activated myelinolytic CD4+ T cells have been observed in the blood and CSF of MS patients (7). Additionally, MS lesions have been widely associated with the presence of both CD4+ and CD8+ T cells (55). These autoreactive T cells induce a Th-1 response, mainly targeted against proteolipid protein (PLP), and can worsen disease progression in patients (56–58). Considering their well-accepted pathogenic role in MS, classical immunotherapies are devised to silence the CD4+ T cell-mediated attack on myelin to repair the damage caused to the myelin sheath. Our study highlights the opposite, protective role of CD4+ T cells in a virus-induced etiology of demyelination in MS.
In this study, we present evidence to show that spatiotemporal infiltration of CD4+ T cells in the CNS and their dynamic equilibrium with the brain-resident microglia may influence the progression, severity, and amelioration of white and gray matter inflammation in a neurotropic virus model. The most widely used experimental model of MS, EAE, holds good only for understanding the mechanisms of white matter injury and does not recapitulate the aspects of gray matter damage.
The RSA59-induced demyelinating model is unique in that it involves both white and gray matter inflammation. The onset of disease is initiated via orchestration of innate immune genes in the acute phase to clear the virus and restore homeostasis and then gradually progresses via adaptive immunity during the chronic phase (45). RSA59-induced demyelination is dissimilar to other conventional demyelinating models that are explicitly driven by adaptive immune responses, with its array of specialized T cells (CD4+ and CD8+) and myelin antigen-specific antibodies (20, 59, 60). Dynamic host immune responses involving CD4+ helper T cells are needed for recovery from infections. While CD4+ T cells are helpers in the development of a complete adaptive immune response, they are also required for enhancing innate immune effector functions. To assess the role of CD4+ T cells in the innate and adaptive immune responses and their interactions with microglia/macrophages following RSA59 infection, the current study compared CD4−/− mice and wild-type mice. The results showed a critical role of CD4+ T cells in the pathogenesis of RSA59-induced neuroinflammation. We observed the following: (i) Absence of CD4+ T cells caused no change in acute encephalitis, but CD4−/− mice showed a significant reduction in CD11b-positive microglia/macrophages. (ii) Viral replication was higher and viral transcripts were persistent in CD4−/− mice, even at day 30 p.i. (iii) CD4−/− mice showed augmented susceptibility to chronic-phase encephalitis and demyelination. Furthermore, CD4−/− mice presented with poliomyelitis, bulbar (brainstem) vacuolation of the neuropil, and dorsal root ganglionic inflammation, findings rarely observed in CD4+/+ mice. (iv) A strikingly higher number of CD11b-positive microglia/macrophages were present in the CD4−/− mice at the chronic-infection phase. These microglia/macrophages were disseminated throughout the inflamed regions of white matter and in the areas of gray matter in both the brain and spinal cord at the chronic-infection phase. (v) Electron microscopy revealed axonal degeneration in the spinal cords of CD4−/− mice even in the absence of inflammation, suggesting that white matter degeneration occurs secondarily to neuronal injury without a direct attack of inflammatory cells upon spinal cord myelin sheaths.
Our results also revealed substantially higher mRNA expression levels of IFN-γ, TNF-α, and the IFN-inducible leukocyte chemoattractant CXCL10 in CD4−/− mice than in CD4+/+ mice, which is likely a response to recruit further peripheral lymphocytes into the CNS to combat the persistent viral load in CD4−/− mice. The increased and uncontrolled viral replication contributed to severe inflammation and neuronal cell body damage observed in the gray matter of the spinal cord and dorsal root ganglia of CD4−/− mice. Elevated mRNA levels of the proinflammatory cytokine IL-6 at days 5 and 10 p.i., along with a persistent viral load, signified a robust proinflammatory environment in the CNS of CD4−/− mice. Expression of the anti-inflammatory cytokine IL-10 remained almost constant throughout the study in CD4+/+ mice, while its expression in CD4−/− mice was consistently low, suggesting that CD4+ T cells serve as one of the key sources of IL-10 production.
Apart from this, it was interesting that the antiviral chemokine CCL5 or RANTES (a macrophage/monocyte chemoattractant) was downregulated in CD4−/− mice at days 5 and 10 p.i., perhaps as a result of which a significant reduction in CD11b-positive inflammatory cells was observed in brains and spinal cords at the acute phase of inflammation. Nevertheless, overall encephalitis levels at the acute phase, as shown by CD45 staining, were comparable in both CD4+/+ and CD4−/− mice, suggesting that the initial inflammation in the CNS is independent of CD4+ T cells. This finding also hints that the lower numbers of CD11b+ cells might be the result of dampened infiltration of monocytes/macrophages in the absence of functional CD4+ T cells and that the CD11b+ cells observed in the CNS might correspond to the brain-resident microglia.
The function and role of microglia as mediators of homeostasis in the CNS are well established (61). They not only act as custodians of CNS immunity, but also protect neurons during development and monitor synaptogenesis (62). However, under pathological conditions, microglia attain a signature proinflammatory state that is directed toward the clearance of toxic substances from the CNS (63, 64). M1 or classically activated microglia can also induce the activation of A1 astrocytes, which develop altered ability to promote neuroprotection (65). A2 astrocytes are activated by M2 microglia (alternatively activated) and help in CNS repair and protection (66). Examination of mRNA expression revealed higher expression of the proinflammatory M1 markers CD86 and Btk in the CNS of CD4+/+ mice during acute infection. CD163 mRNA transcripts increased in expression in the CD4+/+ mice at day 10 p.i. and then declined with the restoration of homeostasis, but CD4−/− mice showed a significant increase in the expression of CD163 mRNA even at day 15 p.i., suggesting that the CD11b+ microglia/macrophages present during the transition (from acute to chronic) phase in the CNS might be of the M2 phenotype (anti-inflammatory), attempting to combat prolonged viral persistence and restore homeostasis to prevent further tissue damage but failing to do so without the help of CD4+T cells. Though M2 microglia/macrophages are categorized as anti-inflammatory, they are also reported to have high phagocytic ability. Their activation and persistence, therefore, might promote direct myelin stripping, as previously reported (40), leading to significantly greater demyelination and axonal loss in CD4−/− mice.
An interesting question that remains to be answered is, if the infiltration of monocyte/macrophages is impeded in the first place, why is there higher expression of CD11b-positive cells in the CNS of CD4−/− mice during the chronic phase? To answer this, future experiments will be aimed at performing immunophenotyping of the inflammatory cells, using flow cytometry in CD4−/− mice, to explicitly decipher whether the cells present at the chronic phase are predominately peripherally recruited monocytes/macrophages or the activated resident phagocytic microglial cells of the CNS. So far, flow-cytometric analysis in CD4+/+ mice has shown the presence of a significant population of CD11bhi/CD45lo cells (microglia) at day 30 p.i. but very few or no CD11b-expressing CD45hi monocytes/macrophages in the CNS (data not shown). We therefore expect the CD11b+ cells found in the CNS at day 30 in the CD4−/− mice to be microglia and not peripherally recruited myeloid cells.
For this study, we opted for a mouse strain (B6.129S2-Cd4tm1Mak/J) in which the functionality of CD4+ T helper cells was disrupted. The development of CD8+ T cell and myeloid components was unaffected. Of the circulating T cells, 90% were CD8+, and their cytotoxic activity was within normal ranges (67). Despite the presence of functional CD8+ T cells, viral clearance was substantially delayed. Thus, our studies suggest a vast preponderance of CD4+ T cells over CD8+ T cells in maintaining homeostasis upon RSA59-induced neuroinflammation.
In conclusion, our results demonstrate that CD4+ T cells are necessary for eliminating viral particles, promoting microglial polarization toward anti-inflammation, and controlling chronic progressive axonal degeneration. The current study also highlights the importance of CD4+ T cells beyond the classic inflammatory lesions of the white matter tract. We have shown that gray matter inflammation in the form of poliomyelitis is significantly exacerbated in the absence of CD4+ T cells. Moreover, we show that the imprinting of the microglia/macrophage-mediated inflammatory innate immune response on the consequent protective adaptive immunity requires functional CD4+ T cells. This communication between microglia and T cells is a highly regulated, interdependent, and bidirectional process and is critical for the establishment of an effective immune response. Although innate antiviral immune responses by microglia are crucial in controlling the initial CNS viral dissemination, virus-specific T cells are essential to eliminate the virus and provide indispensable neuroprotection. Further studies will be conducted to understand the nexus between CNS-resident microglia/monocyte-derived macrophages with infiltrating activated T helper cells at the molecular level through the immune-coregulatory CD40-CD40 ligand (CD40L) pathway. This dyad is broadly recognized for its essential roles in immune regulation and homeostasis. Our studies will be focused on examining such interactions at the molecular level, using CD40- and CD40L-deficient mice, in the outcome of inflammatory demyelination. Most MS therapies are aimed at preventing damage to myelin by regulating the multiple components of the adaptive immune system, especially the T cell subsets (Th1, Th2, Th17, CD8+, NKT, and CD4+ CD25+ T regulatory cells) and B cells. Current therapies have only been able to reduce the rate of MS lesion formation and the number of lesions and are only partially efficacious (68). Understanding the role of T cells in a virus-induced model of MS is thus critical to designing more robust therapeutics. Together, these studies can help to expand our knowledge with the intent to use CD4-mediated immune therapy as a potential treatment for MS, depending on its etiology and the initiation of pathology.
MATERIALS AND METHODS
Virus, inoculation of mice, and experimental design.
A recombinant isogenic DM strain of MHV-A59, RSA59, was used to infect mice, as described previously (39). Four- to 5-week old MHV-free, CD4+/+ B6 mice (Jackson Laboratory) and CD4−/− (B6.129S2-Cd4tm1Mak/J) mice (Jackson Laboratory; stock no. 002663) were used for the study. The CD4−/− mice obtained from Jackson Laboratory were homozygous for the Cd4tm1Mak targeted mutation, had a significant blockade in CD4+ T cell development, and showed MHC-II-restricted T helper cell activity (67). The mice were inoculated intracranially with 25,000 PFU (50% of the 50% lethal dose [LD50]) of strain RSA59, as described previously. Likewise, mock-infected controls for CD4+/+ and CD4−/− mice were inoculated with an uninfected cell lysate (phosphate-buffered saline [PBS] plus 0.075% bovine serum albumin [BSA]) at an equivalent dilution. Mice were monitored daily postinfection for disease signs and symptoms. Clinical disease severity was graded using the following scale: 0, no disease symptoms; 1, ruffled fur; 1.5, hunched back with mild ataxia: 2, ataxia, balance problems, and hind limb weakness: 2.5, one leg completely paralyzed, motility issues but still able to move around with difficulty; 3, severe hunching/wasting/paralysis of both hind limbs and severely compromised mobility; 3.5, severe distress, complete paralysis, and moribund; 4, dead (47).
For EM, histopathological, and immunohistochemical analyses, mice were sacrificed at the acute-infection phase, i.e., on day 5 or 6 postinfection (four mice per group), and the chronic-infection phase, i.e., day 30 postinfection (five mice per group). For RNA and protein studies and viral titer estimation, animals were sacrificed (3 mice per group) on days 5, 10, and 15 postinfection.
Estimation of viral replication.
Mice were euthanized on days 5, 10, and 15 postinfection and perfused transcardially with 20 ml of sterile PBS. Brains were harvested for determination of viral titers and placed into 1 ml of isotonic saline containing 0.167% gelatin (gel saline). The brain tissues were weighed and kept frozen at −80°C until titers were determined. The tissues were subsequently homogenized, and viral titers were quantified by a standard plaque assay protocol on tight monolayers of L2 cells, as described previously with minor modifications (39).
Histopathology and immunohistochemical analysis.
Mice were sacrificed at day 6 and day 30 postinfection. Following transcardial perfusion with PBS and 4% paraformaldehyde, liver, brain, and spinal cord tissues were harvested and embedded in paraffin. Five-micrometer-thick sections of the embedded tissues were prepared and stained with hematoxylin and eosin for histopathologic analysis. LFB staining was performed to evaluate demyelination in the brain and spinal cord tissues, as described previously with minor modifications (40).
Immunohistochemical staining of brain and spinal cord tissue sections used the following primary antibodies: a 1:10,000 dilution of anti-CD11b (Abcam; catalog no. ab133357), a 1:200 dilution of anti-CD45 (LCA; BD Pharmingen; catalog no. 550539), and a 1:40 dilution of monoclonal antibody directed against the nucleocapsid protein (N) of MHV (monoclonal antibody clone 1-16-1; provided by Julian Leibowitz, Texas A&M University). Bound primary antibodies were detected by an avidin-biotin immunoperoxidase technique (Vector Laboratories) using 3,3-diaminobenzidine (DAB) as the substrate. Control slides from mock-infected mice were stained in parallel. All the slides were coded and read in a blinded manner by the same investigator, as described previously with minor modifications (40).
H&E-stained sections were assessed for inflammation in the following manner, as represented in Table 1: 0, none; 1, few inflammatory cells; 2, organization of perivascular infiltrates; and 3, increasing severity of perivascular cuffing and formation of microglial nodules (47).
Quantification of histopathological sections.
The numbers of hepatic lesions per section were determined and averaged for each mouse at each time point (both acute and chronic phases of inflammation). The functional scoring of the inflammatory lesions in the liver was characterized as the HAI. The degrees of activity were categorized as portal inflammation; interphase hepatitis (piecemeal necrosis); focal (spotty) necrosis, apoptosis, and focal inflammation; and confluent necrosis. Scores from 0 to 6 were allotted for each category based on the modified Knodell HAI, commonly referred to as the Ishak system (69).
Image analysis was performed using the basic densitometric thresholding application of Fiji (Image J, NIH Image, and Scion Image) as described previously (48). Briefly, image analysis for CD45 and CD11b stained sections was performed by capturing the images at the highest magnification (×4 for brain; ×10 for spinal cord) so that the entire section (i.e., the scan area) could be visualized within a single frame. The RGB image was deconvoluted into three different colors to separate and subtract the DAB-specific staining from the background H&E staining. The perimeter of each brain and spinal cord tissue was digitally outlined, and the area was calculated in square micrometers. A threshold value was fixed for each image to make sure that all antibody-marked cells were taken into consideration. The amounts of CD45 and CD11b staining were termed the percent area of staining.
To determine the area of demyelination, LFB-stained spinal cord cross sections from each mouse were chosen and analyzed using Fiji software (Image J version 1.52g). The total perimeter of the white matter regions in each cross section was marked and calculated by adding together the dorsal, ventral, and anterior white matter areas in each section. Also, the total area of the demyelinated regions was outlined and collated for each section separately. The percentage of spinal cord demyelination per section per mouse was calculated.
Gene expression: RNA isolation, reverse transcription, and quantitative PCR.
RNA was extracted from brain tissues (flash frozen) of RSA59-infected CD4+/+ and CD4−/− mice and mock-infected mice (3 from each group at days 5, 10, and 15 p.i.) using the TRIzol isolation protocol following transcardial perfusion with diethyl pyrocarbonate (DEPC)-treated PBS. The total RNA concentration was measured using a NanoDrop ND-100 spectrophotometer. One microgram of RNA was used to prepare cDNA using a high-capacity cDNA reverse transcription kit (Applied Biosystems). Quantitative real-time PCR analysis was performed using a DyNAmo Color Flash SYBR green qPCR kit (Thermo Scientific) in a Step One Plus real-time PCR system (Thermo Fisher Scientific) under the following conditions: initial denaturation at 95°C for 7 min, 40 cycles of 95°C for 10 s and 60°C for 30 s, and melting curve analysis at 60°C for 30 s. Reactions were performed in triplicate. Sequences for the primers used are given in Table 3. Relative quantitation was achieved using the comparative threshold (ΔΔCT) method. mRNA expression levels of target genes in RSA59-infected CD4+/+ and CD4−/− mice were normalized with those of β-actin and expressed as the relative fold change compared to their respective mock-infected controls.
TABLE 3.
Primers used in this study
| Gene | Primer sequence (5′-3′) |
|
|---|---|---|
| Forward | Reverse | |
| CD86 | GGCTCAAAACATAAGCCTGA | CCCATGTCCTTGATCTGAAC |
| CD163 | GAGACACACGGAGCCATCAA | TGGACAAACCTTTTACAACCAGG |
| IFN-γ | GTCTCTTCTTGGATATCTGGAGGAACT | GTAGTAATCAGGTGTGATTCAATGACGC |
| TNF-α | CTGTAGCCCACGTCGTAGC | TTGAGATCCATGCCGTTG |
| CCl5 | CCAATCTTGCAGTCGTGTTTGT | CATCTCCAAATAGTTGATGTATTCTTGAAC |
| CXCL10 | GACGGTCCGCTGCAACTG | CTTCCCTATGGCCCTCATTCT |
| Btk1 | ACAGCAGAACACATTGCTCA | GGGAACTCCTCAGGAAACAT |
| IL-12 p40 | GGAAGCACGGCAGCAGAATA | AACTTGAGGGAGAAGTAGGAATGG |
| IL-6 | AGTTGCCTTCTTGGGACTGA | TCCACGATTTCCCAGAGAAC |
| IL-10 | AGTGGAGCAGGTGAAGAGTG | TTCGGGAGAGGTACAAACG |
| Anti-N | AGGATAGAAGTCTGTTGGCTCA | GAGAGAAGTTAGCAAGGTCCTACG |
| GAPDHa | GCCCCTTCTGCCGATGC | CTTTCCAGAGGGGCCATCC |
| β-Actin | CTTCTACAATGAGCTGCGTGTG | GGTCTCAAACATGATCTGG |
GAPDH, glyceraldehyde-3-phosphate dehydrogenase.
Ultrastructural studies and electron microscopy to characterize the preservation of myelin and axons.
To characterize axonal blebbing, disruption of the myelin sheath, and axon-myelin coherence, ultrastructural studies were carried out on the brains, brainstems, and spinal cords of mice. Infected CD4−/− and CD4+/+ mice and mock-infected CD4−/− mice were anesthetized and sacrificed at day 28 p.i. The mice were perfused with 4% PFA. Brains and spinal cords were harvested and fixed overnight in 2% glutaraldehyde, postfixed with 1% osmium tetroxide, and dehydrated in a graded series of ethanol washes. For transmission electron microscopy (TEM), samples were flat embedded in Poly-Bed 812 epoxy resin (Polysciences) and sectioned (500 nm) from the lesional epicenter. Toluidine blue staining was performed for examination by light microscopy. Ultrathin TEM sections (600 Å) were trimmed from the representative foci of interest in toluidine blue-stained sections, mounted on 200-mesh copper grids, stained with uranyl acetate and bismuth subnitrite, and viewed under a JEOL JEM 1010 electron microscope (40).
Statistical analyses.
The viral titer was calculated as PFU based on the following formula: number of plaques times dilution factor per milliliter per gram of tissue. The virus titer was expressed as log10 PFU per gram of tissue. Quantitative RT-PCR data are presented as mean values ± standard errors of the mean (SEM). Values were subjected to two-way analysis of variance (ANOVA)/Student's t test analysis for calculating the significance of differences between the means. Also, multiple comparisons were achieved with the Tukey test and the Holm-Sidak test. All statistical analyses were done using GraphPad (La Jolla, CA) Prism 6. A P value of <0.05 was considered statistically significant.
Ethics approval.
All experimental procedures and animal care and use were strictly regulated and reviewed in accordance with good animal ethics approved by the Institutional Animal Care and Use Committee at the Indian Institute of Science Education and Research Kolkata (AUP no. IISERK/IAEC/AP/2017/15) and the University of Pennsylvania, Philadelphia, PA, USA (IACUC protocol no. 804701). Experiments were performed following the guidelines of the Committee for the Purpose of Control and Supervision of Experiments on Animals (CPCSEA), India, and the U.S. National Institutes of Health Office of Laboratory Animal Welfare Guide for the Care and Use of Laboratory Animals, 8th edition.
Availability of data and materials.
The data sets used and/or analyzed during the current study are available from the corresponding authors on request.
ACKNOWLEDGMENTS
This work was supported by a Department of Biotechnology, India, research grant (BT/PR 20922/MED/122/37/2016); a grant from the Animal Facility, University of Pennsylvania; a grant from the Histopathology Core, Thomas Jefferson University, Philadelphia, PA, USA; NIH grant EY015014; and grants from Research to Prevent Blindness and the F. M. Kirby Foundation. We thank the Ministry of Human Resource Development (MHRD), India; the Council of Scientific and Industrial Research (CSIR), India; and the University Grants Commission (UGC), India, for fellowships to D.C., F.S., A.B., and S.K.
We thank the IISER-Kolkata animal facility for providing necessary support.
Author contributions were as follows. D.C., F.S., and J.D.S. designed and planned all the experiments. D.C. and F.S. performed the experiments. D.C., F.S., and J.D.S. analyzed the data and wrote the manuscript. A.B., S.K., R.K., and K.D. helped with the standardization of RNA experiments in the knockout mice. L.C.K. blindly read the pathological samples. J.D.S., K.S.S., and L.C.K. participated in data analysis and data interpretation. L.C.K. and K.S.S. were involved in critical revisions of the manuscript. J.D.S. and K.S.S. jointly supervised and reviewed the work.
We declare that we have no competing interests.
REFERENCES
- 1.Glass CK, Saijo K, Winner B, Marchetto MC, Gage FH. 2010. Mechanisms underlying inflammation in neurodegeneration. Cell 140:918–934. doi: 10.1016/j.cell.2010.02.016. [DOI] [PMC free article] [PubMed] [Google Scholar]
- 2.Waisman A, Liblau RS, Becher B. 2015. Innate and adaptive immune responses in the CNS. Lancet Neurol 14:945–955. doi: 10.1016/S1474-4422(15)00141-6. [DOI] [PubMed] [Google Scholar]
- 3.Prinz M, Priller J. 2017. The role of peripheral immune cells in the CNS in steady state and disease. Nat Neurosci 20:136–144. doi: 10.1038/nn.4475. [DOI] [PubMed] [Google Scholar]
- 4.Schetters STT, Gomez-Nicola D, Garcia-Vallejo JJ, Van Kooyk Y. 2018. Neuroinflammation: microglia and T cells get ready to tango. Front Immunol 8:1905. doi: 10.3389/fimmu.2017.01905. [DOI] [PMC free article] [PubMed] [Google Scholar]
- 5.McFarlin DE, McFarland HF. 1982. Multiple sclerosis (second of two parts). N Engl J Med 307:1246–1251. doi: 10.1056/NEJM198211113072005. [DOI] [PubMed] [Google Scholar]
- 6.McFarlin DE, McFarland HF. 1982. Multiple Sclerosis. N Engl J Med 307:1183–1188. doi: 10.1056/NEJM198211043071905. [DOI] [PubMed] [Google Scholar]
- 7.Zhang J, Markovic-Plese S, Lacet B, Raus J, Weiner HL, Hafler DA. 1994. Increased frequency of interleukin 2-responsive T cells specific for myelin basic protein and proteolipid protein in peripheral blood and cerebrospinal fluid of patients with multiple sclerosis. J Exp Med 179:973–984. doi: 10.1084/jem.179.3.973. [DOI] [PMC free article] [PubMed] [Google Scholar]
- 8.Martin R, McFarland HF. 1995. Immunological aspects of experimental allergic encephalomyelitis and multiple sclerosis. Crit Rev Clin Lab Sci 32:121–182. doi: 10.3109/10408369509084683. [DOI] [PubMed] [Google Scholar]
- 9.Steinman L. 1996. Multiple sclerosis: a coordinated immunological attack against myelin in the central nervous system. Cell 85:299–302. doi: 10.1016/s0092-8674(00)81107-1. [DOI] [PubMed] [Google Scholar]
- 10.Sospedra M, Martin R. 2005. Immunology of multiple sclerosis. Annu Rev Immunol 23:683–747. doi: 10.1146/annurev.immunol.23.021704.115707. [DOI] [PubMed] [Google Scholar]
- 11.Kuchroo VK, Anderson AC, Waldner H, Munder M, Bettelli E, Nicholson LB. 2002. T cell response in experimental autoimmune encephalomyelitis (EAE): role of self and cross-reactive antigens in shaping, tuning, and regulating the autopathogenic T cell repertoire. Annu Rev Immunol 20:101–123. doi: 10.1146/annurev.immunol.20.081701.141316. [DOI] [PubMed] [Google Scholar]
- 12.Langrish CL, Chen Y, Blumenschein WM, Mattson J, Basham B, Sedgwick JD, McClanahan T, Kastelein RA, Cua DJ. 2005. IL-23 drives a pathogenic T cell population that induces autoimmune inflammation. J Exp Med 201:233–240. doi: 10.1084/jem.20041257. [DOI] [PMC free article] [PubMed] [Google Scholar]
- 13.Martin B, Hirota K, Cua DJ, Stockinger B, Veldhoen M. 2009. Interleukin-17-producing gammadelta T cells selectively expand in response to pathogen products and environmental signals. Immunity 31:321–330. doi: 10.1016/j.immuni.2009.06.020. [DOI] [PubMed] [Google Scholar]
- 14.Reboldi A, Coisne C, Baumjohann D, Benvenuto F, Bottinelli D, Lira S, Uccelli A, Lanzavecchia A, Engelhardt B, Sallusto F. 2009. C-C chemokine receptor 6-regulated entry of TH-17 cells into the CNS through the choroid plexus is required for the initiation of EAE. Nat Immunol 10:514–523. doi: 10.1038/ni.1716. [DOI] [PubMed] [Google Scholar]
- 15.Das Sarma J, Ciric B, Marek R, Sadhukhan S, Caruso ML, Shafagh J, Fitzgerald DC, Shindler KS, Rostami A. 2009. Functional interleukin-17 receptor A is expressed in central nervous system glia and upregulated in experimental autoimmune encephalomyelitis. J Neuroinflammation 6:14. doi: 10.1186/1742-2094-6-14. [DOI] [PMC free article] [PubMed] [Google Scholar]
- 16.Murphy ÁC, Lalor SJ, Lynch MA, Mills K. 2010. Infiltration of Th1 and Th17 cells and activation of microglia in the CNS during the course of experimental autoimmune encephalomyelitis. Brain Behav Immun 24:641–651. doi: 10.1016/j.bbi.2010.01.014. [DOI] [PubMed] [Google Scholar]
- 17.Li J, Zhao X, Hao H-W, Shaw MK, Tse HY. 2011. T cells that trigger acute experimental autoimmune encephalomyelitis also mediate subsequent disease relapses and predominantly produce IL-17. J Neuroimmunol 230:26–32. doi: 10.1016/j.jneuroim.2010.08.007. [DOI] [PMC free article] [PubMed] [Google Scholar]
- 18.Rostami A, Ciric B. 2013. Role of Th17 cells in the pathogenesis of CNS inflammatory demyelination. J Neurol Sci 333:76–87. doi: 10.1016/j.jns.2013.03.002. [DOI] [PMC free article] [PubMed] [Google Scholar]
- 19.Hirota K, Duarte JH, Veldhoen M, Hornsby E, Li Y, Cua DJ, Ahlfors H, Wilhelm C, Tolaini M, Menzel U, Garefalaki A, Potocnik AJ, Stockinger B. 2011. Fate mapping of IL-17-producing T cells in inflammatory responses. Nat Immunol 12:255–263. doi: 10.1038/ni.1993. [DOI] [PMC free article] [PubMed] [Google Scholar]
- 20.Huseby ES, Liggitt D, Brabb T, Schnabel B, Ohlén C, Goverman J. 2001. A pathogenic role for myelin-specific CD8(+) T cells in a model for multiple sclerosis. J Exp Med 194:669–676. doi: 10.1084/jem.194.5.669. [DOI] [PMC free article] [PubMed] [Google Scholar]
- 21.Sun D, Whitaker JN, Huang Z, Liu D, Coleclough C, Wekerle H, Raine CS. 2001. Myelin antigen-specific CD8+ T cells are encephalitogenic and produce severe disease in C57BL/6 mice. J Immunol 166:7579–7587. doi: 10.4049/jimmunol.166.12.7579. [DOI] [PubMed] [Google Scholar]
- 22.Wagner CA, Roqué PJ, Mileur TR, Liggitt D, Goverman JM. 2020. Myelin-specific CD8+ T cells exacerbate brain inflammation in CNS autoimmunity. J Clin Invest 130:203–213. doi: 10.1172/JCI132531. [DOI] [PMC free article] [PubMed] [Google Scholar]
- 23.Lane TE, Liu MT, Chen BP, Asensio VC, Samawi RM, Paoletti AD, Campbell IL, Kunkel SL, Fox HS, Buchmeier MJ. 2000. A central role for CD4(+) T cells and RANTES in virus-induced central nervous system inflammation and demyelination. J Virol 74:1415–1424. doi: 10.1128/JVI.74.3.1415-1424.2000. [DOI] [PMC free article] [PubMed] [Google Scholar]
- 24.Wu GF, Dandekar AA, Pewe L, Perlman S. 2000. CD4 and CD8 T cells have redundant but not identical roles in virus-induced demyelination. J Immunol 165:2278–2286. doi: 10.4049/jimmunol.165.4.2278. [DOI] [PubMed] [Google Scholar]
- 25.Gagliano SA, Pouget JG, Hardy J, Knight J, Barnes MR, Ryten M, Weale ME. 2016. Genomics implicates adaptive and innate immunity in Alzheimer’s and Parkinson’s diseases. Ann Clin Transl Neurol 3:924–933. doi: 10.1002/acn3.369. [DOI] [PMC free article] [PubMed] [Google Scholar]
- 26.González H, Pacheco R. 2014. T-cell-mediated regulation of neuroinflammation involved in neurodegenerative diseases. J Neuroinflammation 11:201. doi: 10.1186/s12974-014-0201-8. [DOI] [PMC free article] [PubMed] [Google Scholar]
- 27.Browne TC, McQuillan K, McManus RM, O’Reilly J-A, Mills KHG, Lynch MA. 2013. IFN-γ production by amyloid β-specific Th1 cells promotes microglial activation and increases plaque burden in a mouse model of Alzheimer’s disease. J Immunol 190:2241–2251. doi: 10.4049/jimmunol.1200947. [DOI] [PubMed] [Google Scholar]
- 28.Zhang J, Ke K-F, Liu Z, Qiu Y-H, Peng Y-P. 2013. Th17 cell-mediated neuroinflammation is involved in neurodegeneration of aβ1–42-induced Alzheimer’s disease model rats. PLoS One 8:e75786. doi: 10.1371/journal.pone.0075786. [DOI] [PMC free article] [PubMed] [Google Scholar]
- 29.Saresella M, Piancone F, Tortorella P, Marventano I, Gatti A, Caputo D, Lunetta C, Corbo M, Rovaris M, Clerici M. 2013. T helper-17 activation dominates the immunologic milieu of both amyotrophic lateral sclerosis and progressive multiple sclerosis. Clin Immunol 148:79–88. doi: 10.1016/j.clim.2013.04.010. [DOI] [PubMed] [Google Scholar]
- 30.Brochard V, Combadière B, Prigent A, Laouar Y, Perrin A, Beray-Berthat V, Bonduelle O, Alvarez-Fischer D, Callebert J, Launay J-M, Duyckaerts C, Flavell RA, Hirsch EC, Hunot S. 2009. Infiltration of CD4+ lymphocytes into the brain contributes to neurodegeneration in a mouse model of Parkinson disease. J Clin Invest 119:182–192. doi: 10.1172/JCI36470. [DOI] [PMC free article] [PubMed] [Google Scholar]
- 31.Beers DR, Henkel JS, Zhao W, Wang J, Appel SH. 2008. CD4+ T cells support glial neuroprotection, slow disease progression, and modify glial morphology in an animal model of inherited ALS. Proc Natl Acad Sci U S A 105:15558–15563. doi: 10.1073/pnas.0807419105. [DOI] [PMC free article] [PubMed] [Google Scholar]
- 32.Zheng C, Zhou X-W, Wang J-Z. 2016. The dual roles of cytokines in Alzheimer’s disease: update on interleukins, TNF-α, TGF-β and IFN-γ. Transl Neurodegener 5:7. doi: 10.1186/s40035-016-0054-4. [DOI] [PMC free article] [PubMed] [Google Scholar]
- 33.Stohlman SA, Hinton DR, Parra B, Atkinson R, Bergmann CC. 2008. CD4 T cells contribute to virus control and pathology following central nervous system infection with neurotropic mouse hepatitis virus. J Virol 82:2130–2139. doi: 10.1128/JVI.01762-07. [DOI] [PMC free article] [PubMed] [Google Scholar]
- 34.Murray PD, Pavelko KD, Leibowitz J, Lin X, Rodriguez M. 1998. CD4(+) and CD8(+) T cells make discrete contributions to demyelination and neurologic disease in a viral model of multiple sclerosis. J Virol 72:7320–7329. doi: 10.1128/JVI.72.9.7320-7329.1998. [DOI] [PMC free article] [PubMed] [Google Scholar]
- 35.Togo T, Akiyama H, Iseki E, Kondo H, Ikeda K, Kato M, Oda T, Tsuchiya K, Kosaka K. 2002. Occurrence of T cells in the brain of Alzheimer’s disease and other neurological diseases. J Neuroimmunol 124:83–92. doi: 10.1016/S0165-5728(01)00496-9. [DOI] [PubMed] [Google Scholar]
- 36.Strachan-Whaley M, Rivest S, Yong VW. 2014. Interactions between microglia and T cells in multiple sclerosis pathobiology. J Interferon Cytokine Res 34:615–622. doi: 10.1089/jir.2014.0019. [DOI] [PubMed] [Google Scholar]
- 37.Garber C, Soung A, Vollmer LL, Kanmogne M, Last A, Brown J, Klein RS. 2019. T cells promote microglia-mediated synaptic elimination and cognitive dysfunction during recovery from neuropathogenic flaviviruses. Nat Neurosci 22:1276–1288. doi: 10.1038/s41593-019-0427-y. [DOI] [PMC free article] [PubMed] [Google Scholar]
- 38.Lavi E, Gilden DH, Wroblewska Z, Rorke LB, Weiss SR. 1984. Experimental demyelination produced by the A59 strain of mouse hepatitis virus. Neurology 34:597–603. doi: 10.1212/WNL.34.5.597. [DOI] [PubMed] [Google Scholar]
- 39.Das Sarma J, Scheen E, Seo S-H, Koval M, Weiss SR. 2002. Enhanced green fluorescent protein expression may be used to monitor murine coronavirus spread in vitro and in the mouse central nervous system. J Neurovirol 8:381–391. doi: 10.1080/13550280260422686. [DOI] [PMC free article] [PubMed] [Google Scholar]
- 40.Das Sarma J, Kenyon LC, Hingley ST, Shindler KS. 2009. Mechanisms of primary axonal damage in a viral model of multiple sclerosis. J Neurosci 29:10272–10280. doi: 10.1523/JNEUROSCI.1975-09.2009. [DOI] [PMC free article] [PubMed] [Google Scholar]
- 41.Stohlman SA, Weiner LP. 1981. Chronic central nervous system demyelination in mice after JHM virus infection. Neurology 31:38–44. doi: 10.1212/WNL.31.1.38. [DOI] [PubMed] [Google Scholar]
- 42.Sutherland RM, Chua MM, Lavi E, Weiss SR, Paterson Y. 1997. CD4+ and CD8+ T cells are not major effectors of mouse hepatitis virus A59-induced demyelinating disease. J Neurovirol 3:225–228. doi: 10.3109/13550289709018297. [DOI] [PubMed] [Google Scholar]
- 43.Shindler KS, Kenyon LC, Dutt M, Hingley ST, Das Sarma J. 2008. Experimental optic neuritis induced by a demyelinating strain of mouse hepatitis virus. J Virol 82:8882–8886. doi: 10.1128/JVI.00920-08. [DOI] [PMC free article] [PubMed] [Google Scholar]
- 44.Houtman JJ, Fleming JO. 1996. Pathogenesis of mouse hepatitis virus-induced demyelination. J Neurovirol 2:361–376. doi: 10.3109/13550289609146902. [DOI] [PubMed] [Google Scholar]
- 45.Biswas K, Chatterjee D, Addya S, Khan RS, Kenyon LC, Choe A, Cohrs RJ, Shindler KS, Das Sarma J. 2016. Demyelinating strain of mouse hepatitis virus infection bridging innate and adaptive immune response in the induction of demyelination. Clin Immunol 170:9–19. doi: 10.1016/j.clim.2016.07.004. [DOI] [PMC free article] [PubMed] [Google Scholar]
- 46.Chatterjee D, Addya S, Khan RS, Kenyon LC, Choe A, Cohrs RJ, Shindler KS, Sarma JD. 2014. Mouse hepatitis virus infection upregulates genes involved in innate immune responses. PLoS One 9:e111351. doi: 10.1371/journal.pone.0111351. [DOI] [PMC free article] [PubMed] [Google Scholar]
- 47.Kishore A, Kanaujia A, Nag S, Rostami AM, Kenyon LC, Shindler KS, Das Sarma J. 2013. Different mechanisms of inflammation induced in virus and autoimmune-mediated models of multiple sclerosis in C57BL6 mice. Biomed Res Int 2013:589048. doi: 10.1155/2013/589048. [DOI] [PMC free article] [PubMed] [Google Scholar]
- 48.Singh M, Kishore A, Maity D, Sunanda P, Krishnarjuna B, Vappala S, Raghothama S, Kenyon LC, Pal D, Das Sarma J. 2019. A proline insertion-deletion in the spike glycoprotein fusion peptide of mouse hepatitis virus strongly alters neuropathology. J Biol Chem 294:8064–8087. doi: 10.1074/jbc.RA118.004418. [DOI] [PMC free article] [PubMed] [Google Scholar]
- 49.Zipp F, Aktas O. 2006. The brain as a target of inflammation: common pathways link inflammatory and neurodegenerative diseases. Trends Neurosci 29:518–527. doi: 10.1016/j.tins.2006.07.006. [DOI] [PubMed] [Google Scholar]
- 50.Aspelund A, Antila S, Proulx ST, Karlsen TV, Karaman S, Detmar M, Wiig H, Alitalo K. 2015. A dural lymphatic vascular system that drains brain interstitial fluid and macromolecules. J Exp Med 212:991–999. doi: 10.1084/jem.20142290. [DOI] [PMC free article] [PubMed] [Google Scholar]
- 51.Engelhardt B, Ransohoff RM. 2005. The ins and outs of T-lymphocyte trafficking to the CNS: anatomical sites and molecular mechanisms. Trends Immunol 26:485–495. doi: 10.1016/j.it.2005.07.004. [DOI] [PubMed] [Google Scholar]
- 52.Louveau A, Smirnov I, Keyes TJ, Eccles JD, Rouhani SJ, Peske JD, Derecki NC, Castle D, Mandell JW, Lee KS, Harris TH, Kipnis J. 2015. Structural and functional features of central nervous system lymphatic vessels. Nature 523:337–341. doi: 10.1038/nature14432. [DOI] [PMC free article] [PubMed] [Google Scholar]
- 53.Kivisäkk P, Mahad DJ, Callahan MK, Trebst C, Tucky B, Wei T, Wu L, Baekkevold ES, Lassmann H, Staugaitis SM, Campbell JJ, Ransohoff RM. 2003. Human cerebrospinal fluid central memory CD4+ T cells: evidence for trafficking through choroid plexus and meninges via P-selectin. Proc Natl Acad Sci U S A 100:8389–8394. doi: 10.1073/pnas.1433000100. [DOI] [PMC free article] [PubMed] [Google Scholar]
- 54.Zhang J, Weiner HL, Hafler DA. 1992. Autoreactive T cells in multiple sclerosis. Int Rev Immunol 9:183–201. doi: 10.3109/08830189209061790. [DOI] [PubMed] [Google Scholar]
- 55.Raine CS. 1994. The Dale E. McFarlin memorial lecture: the immunology of the multiple sclerosis lesion. Ann Neurol 36:S61–S72. doi: 10.1002/ana.410360716. [DOI] [PubMed] [Google Scholar]
- 56.Kaushansky N, Zhong M-C, Kerlero de Rosbo N, Hoeftberger R, Lassmann H, Ben-Nun A. 2006. Epitope specificity of autoreactive T and B cells associated with experimental autoimmune encephalomyelitis and optic neuritis induced by oligodendrocyte-specific protein in SJL/J mice. J Immunol 177:7364–7376. doi: 10.4049/jimmunol.177.10.7364. [DOI] [PubMed] [Google Scholar]
- 57.Kaushansky N, Altmann DM, David CS, Lassmann H, Ben-Nun A. 2012. DQB1*0602 rather than DRB1*1501 confers susceptibility to multiple sclerosis-like disease induced by proteolipid protein (PLP). J Neuroinflammation 9:29. doi: 10.1186/1742-2094-9-29. [DOI] [PMC free article] [PubMed] [Google Scholar]
- 58.Panitch H, Haley A, Hirsch R, Johnson K. 1987. Exacerbations of multiple sclerosis in patients treated with gamma interferon. Lancet 329:893–895. doi: 10.1016/S0140-6736(87)92863-7. [DOI] [PubMed] [Google Scholar]
- 59.Bernard CC. 1976. Experimental autoimmune encephalomyelitis in mice: genetic control of susceptibility. J Immunogenet 3:263–274. doi: 10.1111/j.1744-313X.1976.tb00583.x. [DOI] [PubMed] [Google Scholar]
- 60.Miller SD, Vanderlugt CL, Begolka WS, Pao W, Yauch RL, Neville KL, Katz-Levy Y, Carrizosa A, Kim BS. 1997. Persistent infection with Theiler’s virus leads to CNS autoimmunity via epitope spreading. Nat Med 3:1133–1136. doi: 10.1038/nm1097-1133. [DOI] [PubMed] [Google Scholar]
- 61.Shemer A, Erny D, Jung S, Prinz M. 2015. Microglia plasticity during health and disease: an immunological perspective. Trends Immunol 36:614–624. doi: 10.1016/j.it.2015.08.003. [DOI] [PubMed] [Google Scholar]
- 62.Squarzoni P, Thion M, Garel S. 2015. Neuronal and microglial regulators of cortical wiring: usual and novel guideposts. Front Neurosci 9:248. doi: 10.3389/fnins.2015.00248. [DOI] [PMC free article] [PubMed] [Google Scholar]
- 63.Prinz M, Priller J. 2014. Microglia and brain macrophages in the molecular age: from origin to neuropsychiatric disease. Nat Rev Neurosci 15:300–312. doi: 10.1038/nrn3722. [DOI] [PubMed] [Google Scholar]
- 64.Biber K, Möller T, Boddeke E, Prinz M. 2016. Central nervous system myeloid cells as drug targets: current status and translational challenges. Nat Rev Drug Discov 15:110–124. doi: 10.1038/nrd.2015.14. [DOI] [PubMed] [Google Scholar]
- 65.Liddelow SA, Guttenplan KA, Clarke LE, Bennett FC, Bohlen CJ, Schirmer L, Bennett ML, Münch AE, Chung W-S, Peterson TC, Wilton DK, Frouin A, Napier BA, Panicker N, Kumar M, Buckwalter MS, Rowitch DH, Dawson VL, Dawson TM, Stevens B, Barres BA. 2017. Neurotoxic reactive astrocytes are induced by activated microglia. Nature 541:481–487. doi: 10.1038/nature21029. [DOI] [PMC free article] [PubMed] [Google Scholar]
- 66.Anderson MA, Burda JE, Ren Y, Ao Y, O’Shea TM, Kawaguchi R, Coppola G, Khakh BS, Deming TJ, Sofroniew MV. 2016. Astrocyte scar formation aids CNS axon regeneration. Nature 532:195–200. doi: 10.1038/nature17623. [DOI] [PMC free article] [PubMed] [Google Scholar]
- 67.Rahemtulla A, Fung-Leung WP, Schilham MW, Kündig TM, Sambhara SR, Narendran A, Arabian A, Wakeham A, Paige CJ, Zinkernagel RM, Miller RG, Mak TM. 1991. Normal development and function of CD8+ cells but markedly decreased helper cell activity in mice lacking CD4. Nature 353:180–184. doi: 10.1038/353180a0. [DOI] [PubMed] [Google Scholar]
- 68.Podbielska M, Banik NL, Kurowska E, Hogan EL. 2013. Myelin recovery in multiple sclerosis: the challenge of remyelination. Brain Sci 3:1282–1324. doi: 10.3390/brainsci3031282. [DOI] [PMC free article] [PubMed] [Google Scholar]
- 69.Goodman ZD. 2007. Grading and staging systems for inflammation and fibrosis in chronic liver diseases. J Hepatol 47:598–607. doi: 10.1016/j.jhep.2007.07.006. [DOI] [PubMed] [Google Scholar]
Associated Data
This section collects any data citations, data availability statements, or supplementary materials included in this article.
Data Availability Statement
The data sets used and/or analyzed during the current study are available from the corresponding authors on request.


