

Abstract
Objectives.
To compare risk discrimination for the prediction of coronary heart disease (CHD) and cardiovascular disease (CVD) deaths of the Pooled Cohort Equations (PCE), the Multi-Ethnic Study of Atherosclerosis (MESA) Risk Score (with/without coronary artery calcium [CAC]), and of simple addition of CAC to the PCE.
Background.
The PCE predict 10-year risk of atherosclerotic CVD events and MESA Risk Score predicts risk of CHD. Their comparative performance for the prediction of fatal events is poorly understood.
Methods.
We evaluated 53,487 patients ages 45–79 years from the CAC Consortium, a retrospective cohort study of asymptomatic individuals referred for clinical CAC scoring. Risk discrimination was measured using C-statistics.
Results.
Mean age was 57 years, 35% were women, 39% had CAC=0. There were 421 CHD and 775 CVD deaths over a mean 12-year follow-up. In the overall study population, discrimination with the MESA Risk Score with CAC and the PCE was almost identical for both outcomes (C-statistics 0.80 and 0.79 for CHD death, 0.77 and 0.78 for CVD death, respectively). Addition of CAC to the PCE improved risk discrimination, yielding the largest C-statistics. The MESA Risk Score with CAC and the PCE plus CAC showed the best discrimination among the 45% patients with 5-20% estimated risk. Secondary analyses by estimated CVD risk strata showed modestly improved risk discrimination with CAC also among low and high estimated risk groups.
Conclusions.
Our findings support the current guideline recommendation to use, among available risk scores, the PCE for initial risk assessment; as well as to use CAC for further risk assessment in a broad borderline/intermediate risk group. Also, in select individuals at low or high estimated risk, CAC also modestly improves discrimination. Studies in unselected populations are needed to better understand the potential value of tools combining the PCE and CAC for optimal risk assessment.
Keywords: cardiovascular disease, coronary artery calcium, mortality, risk, score
Graphical Abstract
Introduction
Cardiovascular disease (CVD) risk assessment plays a central role in current international clinical practice guidelines for the allocation of pharmacotherapy in the primary prevention of atherosclerotic CVD (ASCVD). Specifically, guidelines for the appropriate use of statins (1–3), aspirin (2–4), and anti-hypertensive therapy for stage 1 hypertension (5) are explicitly risk-based, and future recommendations for the allocation of other treatments are expected to incorporate risk estimations into physician-patient discussions and decision-making algorithms (6,7). Allocating therapies to patients at the highest risk helps maximize net benefit, both by increasing the yield of treatment in those most likely to benefit as well as by reducing potential harm in low risk patients who are less likely to achieve significant absolute risk reduction.
In 2013, the American College of Cardiology and the American Heart Association (ACC/AHA) released an updated 10-year ASCVD Risk Estimator (the Pooled Cohort Equations [PCE]), inclusive of CHD events and stroke (8). The PCE were also recommended for initial ASCVD risk assessment in the recent 2018 and 2019 guideline updates (1, 4). In parallel, in 2015 researchers from the Multi-Ethnic Study of Atherosclerosis (MESA) published a novel score for the 10-year prediction of CHD events which combined the information provided by traditional risk factors and the coronary artery calcium (CAC) score (9).
CAC has been shown to be the single best predictor of CHD and CVD events (10–12). Currently, ACC/AHA guidelines for the management of cholesterol and for the primary prevention of ASCVD both recommend consideration of CAC for further risk assessment among individuals at intermediate risk in whom risk management is uncertain after using the PCE (1, 4).
To date, no study has rigorously compared risk discrimination across currently available prediction scores and risk assessment strategies. The aim of the present study was thus to assess the predictive ability of three currently available risk scores (the PCE, and the MESA Risk Score with and without CAC) for the prediction of fatal CHD and CVD events, as well as of a simple combination of PCE plus CAC, within the CAC Consortium (13), a very large, multi-center study of patients undergoing clinical CAC scoring for CVD risk stratification, with long-term follow-up for CHD and CVD mortality.
Methods
Study Design
The CAC Consortium is a multi-center, retrospective, real-world cohort study aimed at evaluating the associations between CAC and long-term, cause-specific mortality. Full details of the cohort and study methods have been previously described (13). In brief, the CAC Consortium included 66,636 men and women ≥18 years of age with no major cardiovascular symptoms (e.g., angina) and without known established CVD, undergoing clinical CAC scoring for CVD risk assessment purposes in one of four US centers with longstanding experience in CAC scoring: Cedars-Sinai Medical Center, Los Angeles, CA (years 1998–2010); PrevaHealth Wellness Diagnostic Center, Columbus, OH (years 1999–2003); Harbor-UCLA Medical Center, Torrance, CA (years 1991–2008); and Minneapolis Heart Institute, Minneapolis, MN (years 1999–2005).
Comparisons between the CAC Consortium population and NHANES 2001–2002 data, the MESA population, and the Framingham Offspring/3rd Generation population have been published elsewhere (13). Written informed consent for participation in research was collected at the four study centers at the time of CAC scanning. Institutional review board approval for coordinating center activities including death ascertainment and death certificate collection was obtained at the Johns Hopkins Hospital.
Study Population
For the present analysis, all patients included in the CAC Consortium meeting the age criteria of the relevant scores simultaneously were included in the study. Specifically, the PCE were originally targeted at individuals ages 40–79 (8), while the MESA Risk Score was designed for patients ages 45–84 years (9). On this basis, all CAC Consortium participants ages 45–79 years were included in the present analysis.
Two clinically relevant study sub-populations were also pre-specified: 1) individuals at borderline/intermediate estimated risk, defined as a 10-year estimated ASCVD risk ranging 5–20% (1, 4), and 2) individuals ages 45 to 64 years, where a majority of CAC scans are performed in clinical practice in the US (13) (Figure 1).
Figure 1. Flow of the population included in the study.
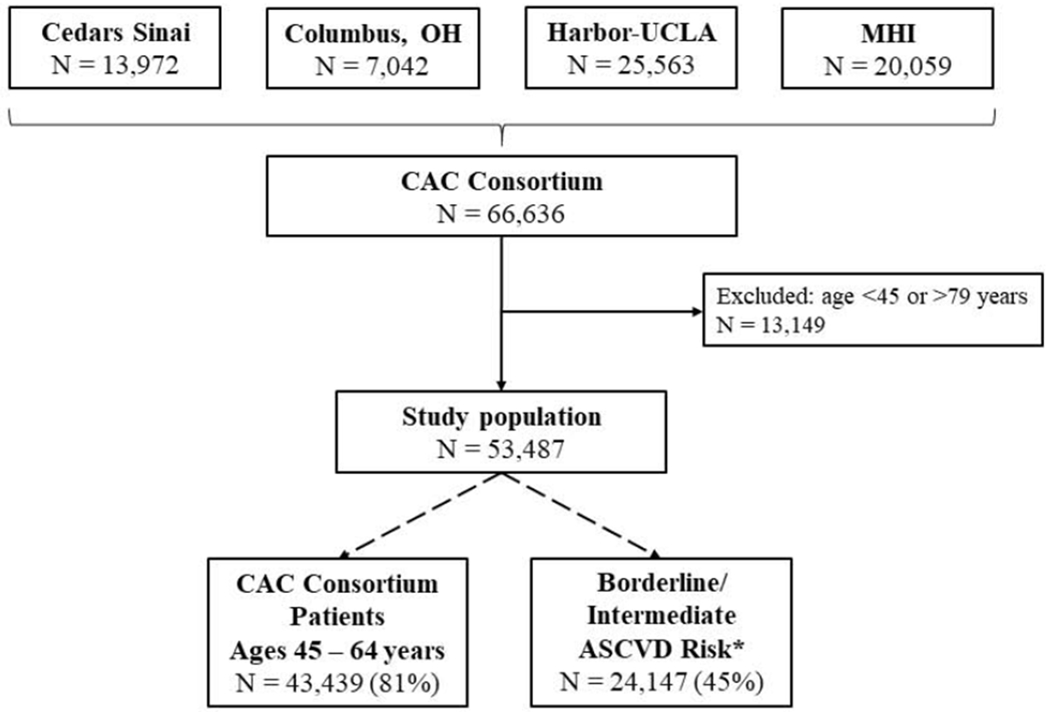
CAC Consortium participants included in the present analysis. *Defined as a 5–20% 10-year estimated ASCVD risk using the PCE.
*Defined as a 5 – 20% 10-year estimated ASCVD risk using the PCE
ASCVD = atherosclerotic cardiovascular disease; CAC = coronary artery calcium; MHI = Minneapolis Heart Institute; OH = Ohio; UCLA = University of California, Los Angeles; PCE = Pooled Cohort Equations
Baseline Evaluation
Baseline data for the CAC Consortium were gathered between 1991 and 2010 (13). All centers contributed detailed patient information including demographics, CVD risk factors, and CAC scores to a centralized coordinating center. We used information on the following risk factors: age, sex, systolic blood pressure (SBP), hypertension, current smoking, diabetes, total and high-density lipoprotein cholesterol concentration, use of anti-hypertensive therapy, race/ethnicity (which was available in 65% of the study population), any family history of CHD, and use of lipid-lowering therapies (which was available in 26,337 participants, and was assumed to be none otherwise).
CAC Assessment
Details on the CAC assessment and scoring methods used in the CAC Consortium have been reported elsewhere (13). In summary, protocols were consistent across centers, ensuring comparability and facilitating data pooling. Non-contrast cardiac-gated computed tomography scans were performed locally using either electron beam tomography (93% of scans) or multidetector computed tomography (7%). Scans were interpreted locally by experienced readers, and CAC was scored at all sites using the Agatston method (14).
Risk Score Calculation
The PCE include separate equations for White and African-American individuals (8). As recommended in ACC/AHA guidelines, equations for non-Hispanic Whites were applied to the 8.3% of CAC Consortium patients of other, non-White, non-African American race/ethnicities (8). The MESA Risk Score was also calculated for all patients, using the equations with CAC information (“MESA with CAC”) as well as the equations in which CAC data was not included (“MESA without CAC”) (9).
Because in some patients from the CAC Consortium information for specific risk factors was available as binary rather than as continuous data (hypertension yes/no rather than SBP; hyperlipidemia yes/no rather than total and high density lipoprotein cholesterol levels), we used a pre-specified, published imputation algorithm to generate continuous values to be used by the scores (13). These methods have been shown to produce nearly identical mean and median PCE values, with an overall correlation coefficient of 0.952 between scores calculated with original continuous and calculated continuous risk factor data, respectively (13). For both the PCE and the MESA Risk Score, their respective equations for non-Hispanic Whites were used in the 35% participants with missing data on race/ethnicity.
Event Definition and Ascertainment
The outcomes of the present study were CHD death and CVD death (defined as death from CHD, stroke, heart failure, and other cardiovascular causes) assessed over a mean of 12 years. In the CAC Consortium, mortality was assessed via linkage of patient records with the Social Security Administration Death Master File using a previously validated algorithm (15). Cause of death was obtained from the National Death Index, and categorized into common causes of death using International Classification of Diseases, 9th and 10th revisions’ codes, as previously described (13).
A detailed comparison of death rates in the CAC Consortium with the U.S. Census and MESA has been previously published (13). Internal validation studies against known deaths identified via the electronic medical record revealed >90% specificity for identifying known deaths, with an estimated sensitivity of 72-90% (13).
Statistical Analyses
Baseline characteristics of the study population were described overall, as well as for the two pre-specified relevant subgroups. For each, the frequency of traditional CVD risk factors was calculated, along with the mean and median CAC score, and the mean 10-year risk estimation provided by each of the scores.
We evaluated the predictive ability of four risk assessment approaches: three currently available risk scores (the PCE alone, the MESA Risk Score without CAC, and the MESA Risk Score with CAC), as well as of the simple combination of the PCE plus CAC (1, 4). Because these scores were originally created to predict different endpoint definitions, for the present analysis using death events we compared the risk scores in terms of risk discrimination, which is their ability to numerically separate events from non-events, rather than calibration. Risk discrimination was calculated using Harrell’s C-statistic (16), which is analogous to the area under the receiver-operator characteristic curve but takes into account censoring during follow-up.
All analyses were performed for both CHD death and CVD death in the overall study population, as well as in the subgroups described above. Also, to better understand the comparative discrimination of the scores, in secondary analyses C-statistics were also calculated after stratifying patients into risk groups defined per 5% ASCVD risk increments defined using the PCE (8).
Sensitivity analyses were also pursued, excluding 1) patients on baseline lipid-lowering therapy (26% of sample), and 2) participants with missing data on race/ethnicity. All analyses were conducted using Stata software, Version 15 (17). A two tailed p-value of 0.05 was set as the threshold for statistical significance.
Results
Study Population and Baseline Characteristics
The study population comprised 53,487 patients ages 45–79 years (Figure 1). Of these, the majority (N=43,439, 81%) were aged 45–64 years. Using the PCE, 25,054 patients (46.8%) had an estimated <5% 10-year risk, 24,147 (45.2%) had 5–20% risk, and 4,286 (8.0%) had >20% risk.
Mean age was 57.2 years, 35% were women, and 90% of White ethnicity (Table 1). Median CAC score was 10 Agatston Units (interquartile range 0 – 132), and approximately 39% had CAC=0. Individuals ages 45 – 64 years had a lower burden of traditional risk factors than the overall population (except for current smoking), a lower burden of CAC, and their mean estimated CHD and CVD risks were also lower. On the other hand, patients at borderline/intermediate ASCVD risk were older, had a higher burden of traditional risk factors, CAC, and higher mean estimated risks than the overall study population.
Table 1.
Baseline characteristics of the study population, CAC Consortium ages 45 to 79 years.
| Overall Study Population (N=53,487) | Pre-specified relevant subgroups |
||
|---|---|---|---|
| Patients Ages 45 to 64 years (N=43,439) | Borderline/Intermediate ASCVD risk* (N=24,147) | ||
| Age, years | 57.2 (8.0) | 54.2 (5.3) | 60.2 (6.5) |
| Women | 18,801 (35.2) | 14,733 (33.9) | 5,440 (22.5) |
| Race/ethnicity | |||
| Non-Hispanic White | 31,334 (89.7) | 25,169 (89.6) | 14,045 (88.8) |
| African-American | 775 (2.2) | 601 (2.2) | 499 (3.2) |
| Asian | 1,241 (3.6) | 991 (3.6) | 513 (3.3) |
| Hispanic | 1,018 (2.9) | 841 (3.0) | 477 (3.0) |
| Other | 583 (1.8) | 481 (1.7) | 275 (1.7) |
| Hypertension | 17,874 (33.4) | 13,147 (30.3) | 10,009 (41.5) |
| Use of antihypertensive therapy | 2,504 (24.5) | 1,586 (19.9) | 1,315 (30.1) |
| Dyslipidemia | 29,768 (55.7) | 23,674 (54.5) | 15,742 (65.2) |
| Use of lipid-lowering therapies (N=26,337) | 6,716 (25.5) | 5,102 (23.4) | 3,163 (28.1) |
| Diabetes | 3,969 (7.4) | 2,839 (6.5) | 2,055 (8.5) |
| Family History of CHD (any) | 24,150 (45.2) | 19,969 (46.0) | 10,441 (43.2) |
| Current smoking | 4,989 (9.3) | 4,241 (9.8) | 3,399 (14.1) |
| CAC Score | |||
| Mean, AU | 185.5 (499) | 126.9 (379.2) | 239.4 (529.8) |
| Median, AU | 10 (0 – 132) | 3.1 (0 – 79) | 41 (0 – 232) |
| CAC = 0 | 20,803 (38.9) | 19,073 (43.9) | 6,176 (25.6) |
| CAC 1 –100 | 17,526 (32.8) | 14,591 (33.6) | 8,756 (36.3) |
| CAC 100 – 400 | 8,459 (15.8) | 6,009 (13.8) | 5,130 (21.2) |
| CAC > 400 | 6,699 (12.5) | 3,766 (8.7) | 4,085 (16.9) |
| Estimated 10-Year Risk, % | |||
| PCE (ASCVD) | 8.1 (7.8) | 5.6 (4.5) | 10.0 (3.9) |
| MESA Without CAC (CHD) | 5.8 (4.3) | 4.9 (3.1) | 6.9 (2.8) |
| MESA With CAC (CHD) | 6.9 (6.8) | 5.7 (5.6) | 8.5 (6.2) |
Defined as a 5 – 20% 10-year estimated ASCVD risk using the PCE
Data presented as number (%), mean (standard deviation) or median (interquartile range)
Percentages may not add 100% due to rounding
Abbreviations: ASCVD = atherosclerotic cardiovascular disease events; AU = Agatston Units; CAC = coronary artery calcium; CHD = coronary heart disease; MESA = Multi-Ethnic Study of Atherosclerosis; N = number; PCE = Pooled Cohort Equations
Death Events During Follow-Up
After a mean follow-up of 12 years, there were 421 CHD deaths (0.79%) and 775 CVD deaths (1.5 %). Death rates varied by sex, with 330 CHD deaths (0.95 %) and 557 CVD deaths (1.6 %) recorded among men and 91 CHD deaths (0.48%) and 218 CVD deaths (1.2 %) among women.
Risk Discrimination: Comparison of Currently Available Risk Scores
In the overall study population, the MESA Risk Score with CAC and the PCE showed the best discriminative ability for both study outcomes among currently available risk scores (PCE, MESA Risk Score with and without CAC), with very similar C-statistics (0.80 and 0.79, respectively, for CHD death; and 0.77 and 0.78, respectively, for CVD death). On the other hand, MESA without CAC showed the worst performance of the three scores (Table 2).
Table 2.
Discriminative ability for the prediction of CHD death and CVD death events, overall and in clinically relevant subgroups.
| C-Statistic |
||
|---|---|---|
| CHD Death | CVD Death | |
| Overall study population | ||
| PCE | 0.79 (0.77, 0.81) | 0.78 (0.77, 0.80) |
| MESA without CAC | 0.76 (0.74, 0.78) | 0.74 (0.72, 0.76) |
| MESA with CAC | 0.80 (0.78, 0.82) | 0.77 (0.76, 0.79) |
| PCE + CAC | 0.82 (0.80, 0.84) | 0.80 (0.79, 0.82) |
| Intermediate ASCVD risk (5-20%)* | ||
| PCE | 0.66 (0.62, 0.69) | 0.63 (0.60, 0.66) |
| MESA without CAC | 0.58 (0.54, 0.62) | 0.54 (0.51, 0.57) |
| MESA with CAC | 0.71 (0.67, 0.74) | 0.65 (0.62, 0.68) |
| PCE + CAC | 0.70 (0.67, 0.74) | 0.67 (0.64, 0.69) |
| Ages 45 – 64 years | ||
| PCE | 0.72 (0.68, 0.75) | 0.71 (0.69, 0.74) |
| MESA without CAC | 0.69 (0.66, 0.73) | 0.67 (0.64, 0.70) |
| MESA with CAC | 0.77 (0.74, 0.81) | 0.74 (0.72, 0.77) |
| PCE + CAC | 0.76 (0.73, 0.80) | 0.75 (0.73, 0.78) |
Defined as a 5 – 20% 10-year estimated ASCVD risk using the PCE
Abbreviations: ASCVD = atherosclerotic cardiovascular disease events; CAC = coronary artery calcium; CHD = coronary heart disease; CVD = cardiovascular disease; MESA = Multi-Ethnic Study of Atherosclerosis; PCE = Pooled Cohort Equations
Among individuals at borderline/intermediate ASCVD risk, the MESA Risk Score with CAC consistently showed the best risk discrimination for both study endpoints among currently available risk scores, the largest being that for CHD death (C-statistic of 0.71, representing a +0.05 improvement compared to the PCE). The same trend was true among individuals 45 to 64 years of age (C-statistic for CHD death of 0.74, representing a +0.03 improvement compared to the PCE).
Risk Discrimination: Comparison of Risk Assessment Strategies
In the overall study population, risk assessment strategies incorporating CAC information (PCE plus CAC, and MESA Risk Score with CAC) showed better discriminative ability than their equivalents without CAC (PCE alone, and MESA Risk Score without CAC). Specifically, compared to the PCE alone, addition of CAC information improved the C-statistic by +0.03 for the prediction of CHD deaths, and by +0.02 for CVD deaths. Improvements in the C-statistic with addition of CAC information were larger in the subgroups of individuals at borderline/intermediate ASCVD risk and those aged 45 to 64 years. Overall, the best performance across all scores and strategies was observed for the PCE plus CAC, with overall C-statistics of 0.82 for CHD death (95% confidence interval [95% CI] 0.80, 0.84) and 0.80 (95% CI 0.79, 0.82) for CVD death (Table 2).
Sensitivity Analyses
Similar results were observed after excluding patients on baseline lipid-lowering therapy (Table S1). The same was true after excluding participants with missing data on race/ethnicity (Table S2). For all risk scores and subgroups, discrimination for CHD death was better than for CVD death.
Secondary Analyses: Risk Discrimination by 5% ASCVD Risk Strata
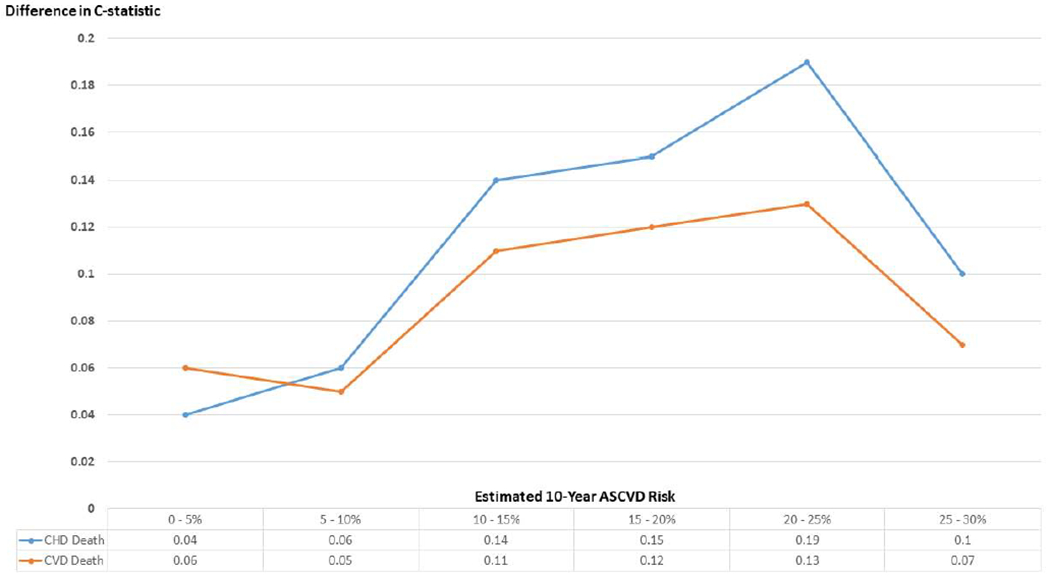
Figures 2 and 3 display the results of secondary analyses describing the C-statistics for CHD death and CVD death by estimated ASCVD risk strata. For both endpoints, the MESA Risk Score with CAC and the PCE plus CAC consistently showed the best discriminative ability for all estimated ASCVD risk strata within the 0–30% range. The largest improvements in the C-statistic between each of these strategies and the PCE (without CAC) were observed in the 10–25% estimated risk range, although modest improvements were also observed in lower and higher risk strata (Figure 4).
Figure 2. Discriminative ability for the prediction of CHD death events, by 5%-ASCVD risk strata.
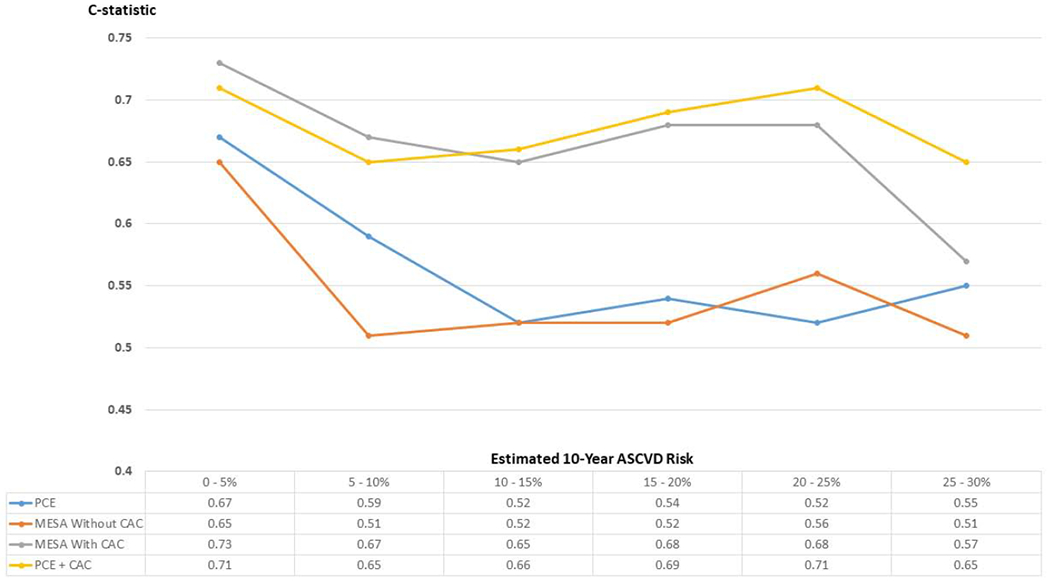
Results are presented using the C-statistic.
ASCVD = atherosclerotic cardiovascular disease events; CAC = coronary artery calcium; CHD = coronary heart disease; MESA = Multi-Ethnic Study of Atherosclerosis; PCE = Pooled Cohort Equations
Figure 3. Discriminative ability for the prediction of CVD death events, by 5%-ASCVD risk strata.
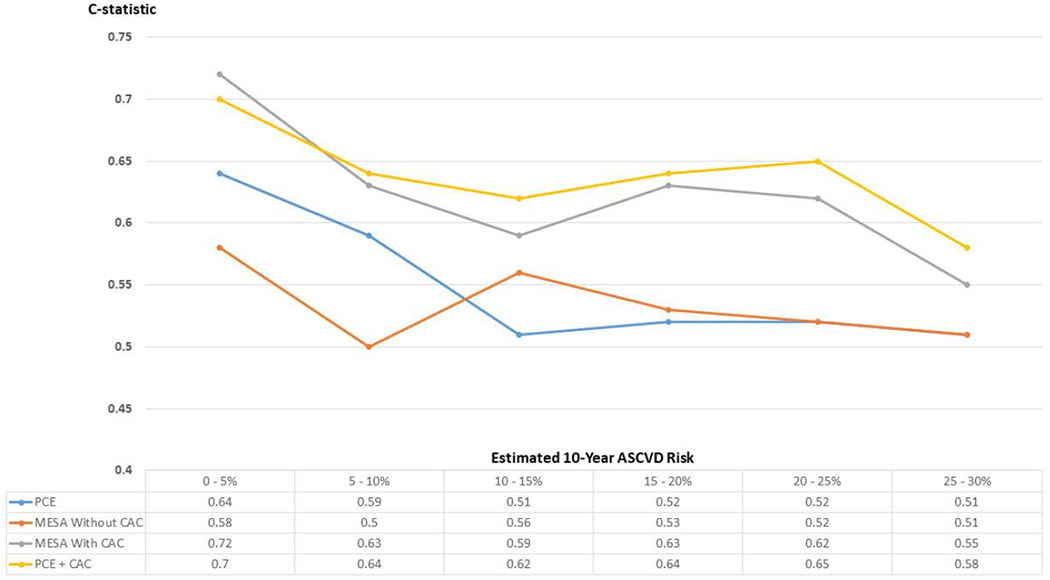
Results are presented using the C-statistic.
ASCVD = atherosclerotic cardiovascular disease events; CAC = coronary artery calcium; CVD = cardiovascular disease; MESA = Multi-Ethnic Study of Atherosclerosis; PCE = Pooled Cohort Equations
Figure 4. Improvement in the C-statistics for CHD death events and for CVD death events comparing the MESA Risk Score with CAC and the PCE (Panel A), and comparing the PCE plus CAC and the PCE alone (Panel B).
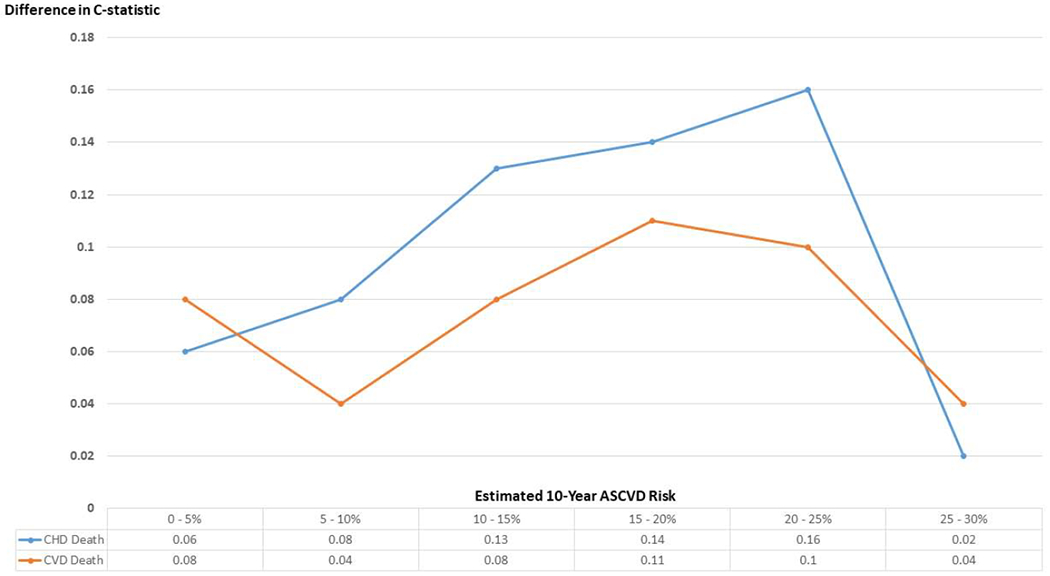
Results are presented as difference in the C-statistic.
ASCVD = atherosclerotic cardiovascular disease events; CAC = coronary artery calcium; CHD = coronary heart disease; CVD = cardiovascular disease; MESA = Multi-Ethnic Study of Atherosclerosis; PCE = Pooled Cohort Equations
Discussion
In a large cohort of asymptomatic individuals referred for clinical CAC scoring, among key currently available risk scoring systems the MESA Risk Score with CAC showed similar discriminative ability for the prediction of CHD and CVD death compared to the PCE in the overall study population (age range 45–79 years, across the entire spectrum of baseline estimated ASCVD risk). However, in the subgroup of individuals in whom current ACC/AHA guidelines recommend CAC scoring for further ASCVD risk assessment, i.e., individuals with a 5–20% 10-year estimated ASCVD risk, the MESA Risk Score with CAC showed a better discrimination than the PCE for both outcomes. The same was true among adults ages 45–64, the age subgroup currently most likely to undergo CAC scoring in the US. Simple addition of CAC to the PCE also improved risk discrimination, not only in these subgroups but also in the overall study population, yielding the best performance. Although the largest improvements with CAC-based risk assessment approaches were observed in the 10–25% estimated ASCVD risk range, modest improvements were also observed in lower and higher risk strata.
To our knowledge, this is the first comprehensive analysis to compare key currently available risk scores and potential risk assessment strategies in a large, contemporary, real-world primary prevention population. Accurate risk prediction remains the cornerstone of therapy choice in primary prevention, and our results have important implications for risk assessment paradigms in routine clinical practice. First, our study lends additional support to recommendations included in current ACC/AHA guidelines (1, 4) for the initial use of the PCE as the preferred among currently existing scores, identifying very low and very high ASCVD risk cases. Also, our findings in the 45% patients in the borderline/intermediate risk stratum are consistent with prior reports indicating that CAC is most useful in this group (18–21), and provide further support to the current guideline recommendation for consideration of CAC scoring for improved risk assessment in borderline/intermediate risk individuals.
Second, our results make an argument for an expanded use of CAC also in select individuals at low and high estimated risk, as CAC may improve risk discrimination in those groups as well. This is consistent with the findings from prior studies (22). It is important to note, however, that the analysis in the intermediate risk subgroup and the secondary analyses by ASCVD risk strata should be interpreted cautiously, and from the perspective of clinical risk prediction. Specifically, because in those analyses the PCE were used to define the risk strata, CAC-based scores added incrementally more to risk prediction, resulting in larger differences in the C-statistic as compared to those observed in the overall analysis spanning adults of the entire spectrum of ASCVD risk. Still, these analyses are highly informative, as they resemble the use of CAC in routine clinical practice, which is typically pursued in patients deemed to benefit from the test and usually happens after clinical risk estimation (1–4).
Third, our results also make a case for the development of novel risk assessment scores combining clinical risk predictors (such as those included in the PCE) and CAC for the prediction of ASCVD events. Moreover, our findings in the overall CAC Consortium cohort suggest that such a score could have a role in the optimized risk assessment of broad populations. It must be noted, however, that the CAC Consortium is a clinical referral cohort, i.e., is comprised by real-world patients referred to CAC scoring by physicians who expected CAC to be particularly informative in those patients. Consequently, studies in unselected populations will help better understand whether ASCVD scores including CAC information could have a value for initial, optimal risk assessment.
In our study, the MESA Risk Score with CAC was markedly superior to the MESA Score without CAC. This suggests that CAC plays the predominant role in improving risk discrimination, rather than other added factors such as family history of CHD. In prior analyses in MESA, which used a similar definition of family history to that used in the CAC Consortium, CAC improved risk assessment in both individuals with and without any family history (23). Importantly, although the ACC/AHA guidelines include family history of premature (rather than any) CVD among the risk-enhancing features to be considered after initial risk assessment (1, 4), prior data suggest that any family history and premature family history perform similarly for the prediction of incident events (24). Our results together with prior analyses (11, 12, 23–25) suggest that CAC provides additional prognostic information even after consideration of a patient’s family history, as in the MESA Risk Score with CAC.
We also observed that the MESA Risk Score with CAC improved the prediction of CHD mortality more than that of CVD mortality compared to the PCE. This is not surprising, as CAC is known to be a better predictor of CHD events than of CVD events, and the MESA Risk Score is designed to predict CHD (9) – while the PCE predict ASCVD (8). Similarly, addition of CAC to the PCE resulted in a slightly larger improvement in the prediction of CHD deaths as compared to CVD deaths.
Study Strengths
Our study has several strengths, owing to the strengths of the CAC Consortium (13). These include the very large sample size, which maximized statistical power and allowed conducting detailed, clinically relevant subgroup analyses; the inclusion of individuals from several sites, which increases external validity; and inclusion of a wide range of age and baseline estimated risks.
Study Limitations
Our study also has some limitations. First, imputation techniques had to be used for some SBP and cholesterol levels for risk calculations. However, we have previously shown that imputed data based on diagnoses and treatment of hypertension and dyslipidemia produces highly similar risk score results (13). In addition, this limitation would be expected to impact all scores to a similar extent (as each of the risk scores uses these values), and our prior analyses suggest that the effects of this on the comparative analysis should be small.
Second, information on prior statin use was available in a limited number of participants. Nevertheless, this would be expected to be small in a clinical referral population undergoing CAC scoring for risk assessment. Presence of some statin users in the CAC Consortium population would be expected to favor the MESA Risk Score, which is the only one capturing statin use. However, the results of the sensitivity analysis excluding participants known to be statin users at baseline yielded consistent results with those from the main analysis.
Third, information on pharmacological/invasive treatments of patients after CAC scoring, which may impact the natural history of CHD and CVD, was not available. Nevertheless, this limitation would be expected to impact all scores to a similar extent. Fourth, we evaluated cause-specific mortality as the study outcome, while the risk scores were designed to predict varying definitions of CHD and CVD (both non-fatal and fatal). Nonetheless, mortality is the ultimate “hard” outcome, as its use eliminates the potential biases derived from adjudication of softer CHD and CVD endpoints and may represent an optimal outcome for performing direct comparisons across scores.
Fifth, the proportion of women and of non-White participants was relatively low, which could potentially limit generalizability. However, CAC has shown to be similarly predictive in both men and women as well as across the racial/ethnic groups included in MESA (26). Finally, due to limitations inherent to vital status ascertainment in the US, mortality in the CAC Consortium may be underestimated by up to 15-30% (13). Nonetheless, while this would affect an analysis of risk score calibration (observed vs. predicted event rates), it should not differentially affect analyses of risk score discrimination.
Conclusions
Our study in a very large clinical cohort of primary prevention patients undergoing CAC assessment for risk stratification suggests that the PCE should be, among currently available scores, the risk score of choice for initial risk assessment, as recommended in current ACC/AHA guidelines. In patients at 5 to 20% estimated 10-year ASCVD risk, CAC (combined with PCE estimations should this tool be developed, as part of the MESA Risk Score, or alone) improves the prediction of both CHD death and CVD death, and should be considered as a key tool for further, improved risk assessment. In addition, in select individuals at low or high estimated risk, CAC also modestly improves risk discrimination. Ongoing studies in unselected populations are needed to better understand the potential value of novel tools combining the PCE and CAC for optimal risk assessment in even broader populations.
Supplementary Material
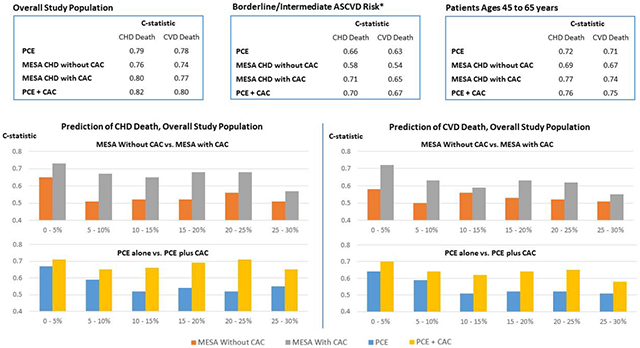
Central Illustration. Discriminative ability of the PCE, the MESA Risk Score (with and without CAC), and of the PCE plus CAC, for the prediction of CHD death and CVD death events in the CAC Consortium.
Results are presented using the C-statistic. On the upper panels, results for all CAC Consortium participants included (overall), for participants at borderline/intermediate estimated ASCVD risk, and for participants ages 45 to 65 years at baseline. On the lower panels, results are presented for all CAC Consortium participants by estimated 10-year ASCVD risk strata.
ASCVD = atherosclerotic cardiovascular disease events; CAC = coronary artery calcium; CHD = coronary heart disease; CVD = cardiovascular disease; MESA = Multi-Ethnic Study of Atherosclerosis; PCE = Pooled Cohort Equations
PERSPECTIVES.
Clinical Competencies
Because the MESA Risk Score with CAC did not improve global risk prediction in the broad population ages 45–79 years (Medical Knowledge), our results lend support to the 2018 and 2019 ACC/AHA guideline recommendation for the initial use of the PCE as the preferred first-line risk score to identify very low and very high risk cases, followed by use of CAC testing in those at borderline to intermediate risk (Patient Care and Procedural Skills). In addition, our results suggest that CAC may also improve risk prediction amongst select low and high risk patients.
Translational Outlook
Studies in unselected populations are needed to better understand whether CAC scoring could be expanded to even broader populations for initial, optimal risk assessment as part of novel ASCVD risk assessment scores.
Acknowledgments
Funding Sources: Dr. Michael J. Blaha has received support from NIH award L30 HL110027 for this project.
Abbreviations:
- ACC/AHA
American College of Cardiology/American Heart Association
- ASCVD
atherosclerotic cardiovascular disease events
- CAC
coronary artery calcium
- CHD
coronary heart disease
- CI
confidence interval
- CVD
cardiovascular disease
- MESA
Multi-Ethnic Study of Atherosclerosis
- SBP
systolic blood pressure
Footnotes
Publisher's Disclaimer: This is a PDF file of an unedited manuscript that has been accepted for publication. As a service to our customers we are providing this early version of the manuscript. The manuscript will undergo copyediting, typesetting, and review of the resulting proof before it is published in its final form. Please note that during the production process errors may be discovered which could affect the content, and all legal disclaimers that apply to the journal pertain.
Declaration of Conflicts of Interest: The authors declare that they have no conflicts of interest relevant to the content of this manuscript.
References
- 1.Grundy SM, Stone NJ, Bailey AL, et al. 2018 AHA/ACC/AACVPR/AAPA/ABC/ACPM/ADA/AGS/APhA/ASPC/NLA/PCNA Guideline on the Management of Blood Cholesterol: A Report of the American College of Cardiology/American Heart Association Task Force on Clinical Practice Guidelines. Circulation. 2019;139:e1082–e1143. [DOI] [PMC free article] [PubMed] [Google Scholar]
- 2.Piepoli MF, Hoes AW, Agewall S, et al. 2016 European Guidelines on cardiovascular disease prevention in clinical practice: The Sixth Joint Task Force of the European Society of Cardiology and Other Societies on Cardiovascular Disease Prevention in Clinical Practice (constituted by representatives of 10 societies and by invited experts) Developed with the special contribution of the European Association for Cardiovascular Prevention & Rehabilitation (EACPR). Eur Heart J. 2016;37:2315–2381. [DOI] [PMC free article] [PubMed] [Google Scholar]
- 3.Anderson TJ, Grégoire J, Pearson GJ, et al. 2016 Canadian Cardiovascular Society Guidelines for the Management of Dyslipidemia for the Prevention of Cardiovascular Disease in the Adult. Can J Cardiol. 2016;32:1263–1282. [DOI] [PubMed] [Google Scholar]
- 4.Arnett DK, Blumenthal RS, Albert MA, et al. 2019 ACC/AHA Guideline on the Primary Prevention of Cardiovascular Disease: A Report of the American College of Cardiology/American Heart Association Task Force on Clinical Practice Guidelines. J Am Coll Cardiol. 2019;74:e177–e232. [DOI] [PMC free article] [PubMed] [Google Scholar]
- 5.Whelton PK, Carey RM, Aronow WS, et al. 2017 ACC/AHA/AAPA/ABC/ACPM/AGS/APhA/ASH/ASPC/NMA/PCNA Guideline for the Prevention, Detection, Evaluation, and Management of High Blood Pressure in Adults: A Report of the American College of Cardiology/American Heart Association Task Force on Clinical Practice Guidelines. Circulation. 2018;138(17):e484–e594. [DOI] [PubMed] [Google Scholar]
- 6.McEvoy JW, Martin SS, Dardari ZA, et al. Coronary Artery Calcium to Guide a Personalized Risk-Based Approach to Initiation and Intensification of Antihypertensive Therapy. Circulation. 2017;135:153–165. [DOI] [PMC free article] [PubMed] [Google Scholar]
- 7.Arps K, Rifai MA, Blaha MJ, et al. Usefulness of Coronary Artery Calcium to Identify Adults of Sufficiently High Risk for Atherothrombotic Cardiovascular Events to Consider Low-Dose Rivaroxaban Thromboprophylaxis (from MESA). Am J Cardiol. 2019. July 24 pii: S0002-9149(19)30813-6. doi: 10.1016/j.amjcard.2019.07.016. [Epub ahead of print] [DOI] [PMC free article] [PubMed] [Google Scholar]
- 8.Goff DC Jr, Lloyd-Jones DM, Bennett G, et al. 2013 ACC/AHA guideline on the assessment of cardiovascular risk: a report of the American College of Cardiology/American Heart Association Task Force on Practice Guidelines. J Am Coll Cardiol. 2014;63:2935–2959. [DOI] [PMC free article] [PubMed] [Google Scholar]
- 9.McClelland RL, Jorgensen NW, Budoff M, et al. 10-Year Coronary Heart Disease Risk Prediction Using Coronary Artery Calcium and Traditional Risk Factors: Derivation in the MESA (Multi-Ethnic Study of Atherosclerosis) With Validation in the HNR (Heinz Nixdorf Recall) Study and the DHS (Dallas Heart Study). J Am Coll Cardiol. 2015;66:1643–53. [DOI] [PMC free article] [PubMed] [Google Scholar]
- 10.Möhlenkamp S, Lehmann N, Moebus S, et al. ; Heinz Nixdorf Recall Study Investigators. Quantification of coronary atherosclerosis and inflammation to predict coronary events and all-cause mortality. J Am Coll Cardiol. 2011;57:1455–64. [DOI] [PubMed] [Google Scholar]
- 11.Yeboah J, Young R, McClelland RL, et al. Utility of Nontraditional Risk Markers in Atherosclerotic Cardiovascular Disease Risk Assessment. J Am Coll Cardiol. 2016;67:139–147. [DOI] [PMC free article] [PubMed] [Google Scholar]
- 12.Kavousi M, Elias-Smale S, Rutten JH, et al. Evaluation of newer risk markers for coronary heart disease risk classification: a cohort study. Ann Intern Med. 2012;156:438–44. [DOI] [PubMed] [Google Scholar]
- 13.Blaha MJ, Whelton SP, Al Rifai M, et al. Rationale and design of the coronary artery calcium consortium: A multicenter cohort study. J Cardiovasc Comput Tomogr. 2017;11:54–61. [DOI] [PMC free article] [PubMed] [Google Scholar]
- 14.Agatston AS, Janowitz WR, Hildner FJ, Zusmer NR, Viamonte M Jr, Detrano R. Quantification ofcoronary artery calcium using ultrafast computed tomography. J Am Coll Cardiol. 1990;15:827–32. [DOI] [PubMed] [Google Scholar]
- 15.Al-Mallah MH, Keteyian SJ, Brawner CA, Whelton S, Blaha MJ. Rationale and design of the Henry Ford Exercise Testing Project (the FIT project). Clin Cardiol. 2014;37:456–61. [DOI] [PMC free article] [PubMed] [Google Scholar]
- 16.Harrell FE Jr, Lee KL, Mark DB. Multivariable prognostic models: issues in developing models, evaluating assumptions and adequacy, and measuring and reducing errors. Stat Med. 1996; 15:361–87. [DOI] [PubMed] [Google Scholar]
- 17.StataCorp. 2017. Stata Statistical Software: Release 15. College Station, TX: StataCorp LLC. [Google Scholar]
- 18.Greenland P, LaBree L, Azen SP, Doherty TM, Detrano RC. Coronary artery calcium score combined with Framingham score for risk prediction in asymptomatic individuals. JAMA. 2004;291:210–5. [DOI] [PubMed] [Google Scholar]
- 19.Nasir K, Bittencourt MS, Blaha MJ, et al. Implications of Coronary Artery Calcium Testing Among Statin Candidates According to American College of Cardiology/American Heart Association Cholesterol Management Guidelines: MESA (Multi-Ethnic Study of Atherosclerosis). J Am Coll Cardiol. 2015;66:1657–68. [DOI] [PubMed] [Google Scholar]
- 20.Bittencourt MS, Blankstein R, Blaha MJ, et al. Implications of coronary artery calcium testing on risk stratification for lipid-lowering therapy according to the 2016 European Society of Cardiology recommendations: The MESA study. Eur J Prev Cardiol. 2018;25:1887–1898. [DOI] [PubMed] [Google Scholar]
- 21.Blaha MJ, Blumenthal RS, Budoff MJ, Nasir K. Understanding the utility of zero coronary calcium as a prognostic test: a Bayesian approach. Circ Cardiovasc Qual Outcomes. 2011;4:253–6. [DOI] [PubMed] [Google Scholar]
- 22.Dudum R, Dzaye O, Mirbolouk M, et al. Coronary artery calcium scoring in low risk patients with family history of coronary heart disease: Validation of the SCCT guideline approach in the coronary artery calcium consortium. J Cardiovasc Comput Tomogr. 2019;13:21–25. [DOI] [PMC free article] [PubMed] [Google Scholar]
- 23.Patel J, Al Rifai M, Blaha MJ, et al. Coronary Artery Calcium Improves Risk Assessment in Adults With a Family History of Premature Coronary Heart Disease: Results From Multiethnic Study of Atherosclerosis. Circ Cardiovasc Imaging. 2015;8:e003186. [DOI] [PMC free article] [PubMed] [Google Scholar]
- 24.Patel J, Al Rifai M, Scheuner MT, et al. Basic vs More Complex Definitions of Family History in the Prediction of Coronary Heart Disease: The Multi-Ethnic Study of Atherosclerosis. Mayo Clin Proc. 2018;93:1213–1223. [DOI] [PMC free article] [PubMed] [Google Scholar]
- 25.Blaha MJ, Cainzos-Achirica M, Greenland P, et al. Role of Coronary Artery Calcium Score of Zero and Other Negative Risk Markers for Cardiovascular Disease: The Multi-Ethnic Study of Atherosclerosis (MESA). Circulation. 2016;133:849–58. [DOI] [PMC free article] [PubMed] [Google Scholar]
- 26.Detrano R, Guerci AD, Carr JJ, et al. Coronary calcium as a predictor of coronary events in four racial or ethnic groups. N Engl J Med. 2008;358:1336–45. [DOI] [PubMed] [Google Scholar]
Associated Data
This section collects any data citations, data availability statements, or supplementary materials included in this article.