Abstract
Tissue stem cells are the cell of origin for many malignancies. Metabolites regulate the balance between self-renewal and differentiation, but whether endogenous metabolic pathways or nutrient availability predispose stem cells to transformation remains unknown. Here, we address this question in epidermal stem cells (EpdSCs), a cell of origin for squamous cell carcinoma (SCC). We find that oncogenic EpdSCs are serine auxotrophs whose growth and self-renewal requires abundant exogenous serine. When extracellular serine is limiting, EpdSCs activate de novo serine synthesis, which in turn stimulates αKG-dependent dioxygenases that remove the repressive histone modification H3K27me3 and activate differentiation programs. Accordingly, serine starvation or enforced α-ketoglutarate production antagonizes SCC growth. Conversely, blocking serine synthesis or repressing α-ketoglutarate driven demethylation facilitates malignant progression. Together, these findings reveal that extracellular serine is a critical determinant of EpdSC fate and provide insight into how nutrient availability is integrated with stem cell fate decisions during tumor initiation.
INTRODUCTION
Stem cells (SCs) maintain tissue homeostasis by balancing self-renewal and differentiation1. With age, SCs can acquire cancer-associated mutations and clonally expand in the context of a grossly normal tissue2–6. How SCs contend with pre-malignant oncogenic mutations, and the mechanisms that ultimately drive a subset of progenitors to initiate neoplasms, remain largely unknown. The answers become increasingly important given evidence that SCs, but not terminally differentiated cells, are a major root of malignancy7–10, and that driving SC differentiation is a potent tumor suppressive mechanism11–14. Thus, identifying factors that regulate oncogenic SC fate is critical to delineating the mechanisms that drive tumor initiation.
The innermost (basal) layer of mammalian epidermis houses an abundant reservoir of SCs responsible for maintaining the skin barrier. Acquisition of oncogenic mutations predisposes epidermal stem cells (EpdSCs) to initiate benign tumors, which progress to squamous cell carcinomas (SCCs), among the most common cancers worldwide1. As such, the epidermis is an excellent model to understand the mechanisms regulating pre-malignant SC behavior.
During SCC pre-malignancy, epigenetic and/or genetic mechanisms lead to induction of the transcription factor SOX2, which is necessary for tumor initiation and progression15–17. Ectopic activation of SOX2 in EpdSCs induces a stress response involving global protein synthesis repression and selective translation of oncogenic transcripts16,18. Since protein synthesis is intimately tied to amino acid availability19, this prompts the intriguing but unexplored hypothesis that SCs may adapt to oncogenic stress by altering their metabolism.
Increasing evidence suggests that metabolites can regulate SC proliferation, self-renewal and differentiation20–24. Additionally, metabolic reprogramming supports bioenergetic and anabolic reactions that are necessary for proliferation23, rendering tumor progression sensitive to nutrient availability25–27. However, it remains unknown whether oncogenic lesions rewire endogenous metabolic programs in SCs, and if so, how this contributes to tumor initiation. Here, we assessed the consequences of oncogenic stress to EpdSC metabolism and discovered that metabolic reprogramming suppresses differentiation programs that otherwise antagonize tumorigenesis. Our results hold promise for therapeutic avenues targeting oncogenic SCs.
RESULTS
Pre-malignant SC growth is dependent upon extracellular serine.
Sustained SOX2 expression in EpdSCs induced pre-tumorigenic lesions marked by hyperproliferation, expansion of K14+ progenitors, and induction of the tumor stem cell (tSC) marker CD44 (Extended Data Fig. 1a). To explore the metabolism of pre-malignant EpdSCs prior to the onset of hyperproliferation, we crossed R26-LSL-Sox2-IRES-eGFPfl/fl and Krt14-Cre+/wt mice to generate littermate wild-type (WT) and SOX2+ animals, where Sox2 was induced developmentally in K14+ epidermal progenitors16,28 (Fig. 1a). At postnatal day 4 (P4) and in primary culture, SOX2+ and WT EpdSCs proliferated comparably (Fig. 1a,b), enabling us to identify metabolic changes associated with pre-malignancy independently of hyperproliferation.
Fig. 1. Pre-malignant epidermal stem cells are serine auxotrophs.
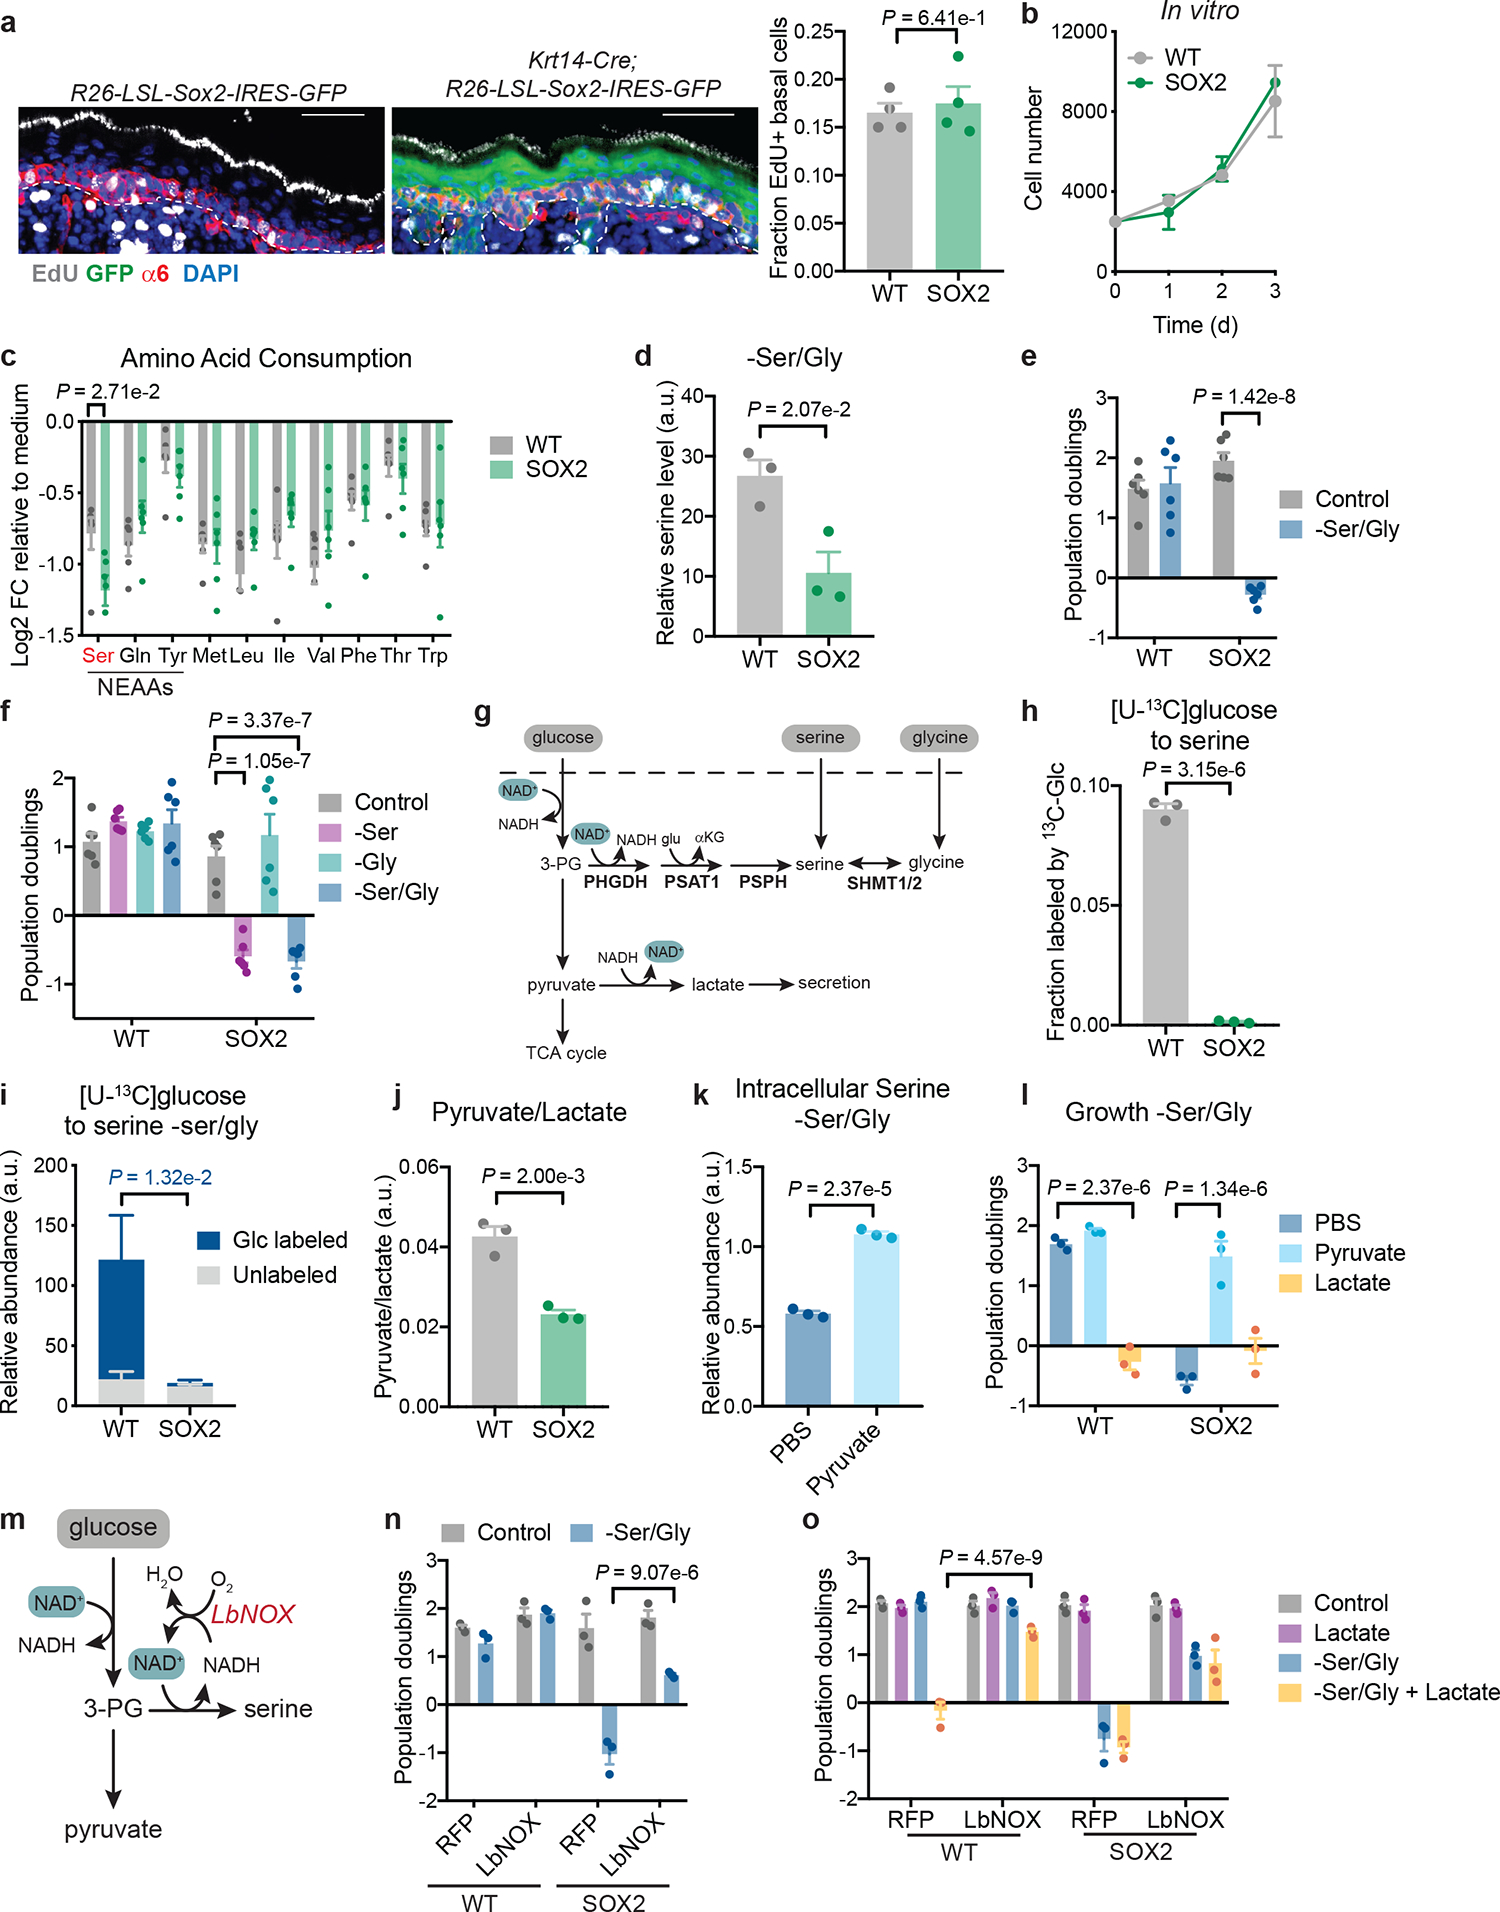
a, EdU incorporation into integrin-α6+ EpdSCs in P4 WT (R26-LSL-Sox2-IRES-eGFP) and SOX2+ (K14-Cre+/wt;R26-LSL-Sox2-IRES-eGFP) mice (n=4 mice per genotype). Data are mean ±SD. b, Growth of independently derived WT-1,2,3 and SOX2+−1,2,3 EpdSC cultures (n=3 independent experiments). Data are mean ±SD. c, Gas chromatography-mass spectrometry (GC-MS) of conditioned medium relative to control medium (n=6 biologically independent samples). Data are mean ±SEM. NEAA indicates non-essential amino acids that are consumed. d, Intracellular serine pools following 16 h of Ser/Gly starvation (n=3 biologically independent samples). Data are mean ±SEM. e, Proliferation of WT-1,2,3,4,5,6 and SOX2+−1,2,3,4,5,6 lines during 48 h of growth in indicated medium (n=6 independent experiments). Data are mean ±SEM. f, Population doublings of WT-1,2,3,4,5,6 and SOX2+−1,2,3,4,5,6 lines during 48 h of growth in indicated medium (n=6 independent experiments). Data are mean ±SEM. g, Schematic of intracellular serine sources. h-i, Labeling of serine from [U-13C]glucose in complete medium (n=3 biologically independent samples) (h) or in Ser/Gly-free medium (n=3 independent experiments) (i). Data are mean ±SD. j, GC-MS of the intracellular pyruvate/lactate ratio (n=3 biologically independent samples). Data are mean ±SEM. k, GC-MS of intracellular serine pools of SOX2 cells –Ser/Gly with or without 2 mM pyruvate (n=3 biologically independent samples). Data are mean ±SEM. l, Population doublings of EpdSCs cultured for 48 h in Ser/Gly-free medium with addition of PBS, 2 mM lactate or 2 mM pyruvate (n=3 biologically independent samples). Data are mean ±SEM. m, Schematic of LbNOX mechanism of action. n, Population doublings of EpdSCs expressing either RFP control or LbNOX during 48 h of Ser/Gly starvation (n=3 biologically independent samples). Data are mean ±SEM. o, Population doublings of EpdSCs expressing either RFP or LbNOX during 48 h of culture in indicated medium (n=3 biologically independent samples). Data are mean ±SEM. Scale bar = 50 μm. Statistical significance was determined using unpaired two-tailed student’s t-test for panels a, c d, h, j and k; two-way ANOVA with Sidak’s multiple comparison test in panels e and i, and two-way ANOVA with Tukey’s multiple comparison test in panel f, l, n, and o. Numerical data are provided in Statistics Source Data Fig. 1.
Like SCC-SCs, SOX2+ EpdSCs decrease protein synthesis relative to WT EpdSCs16,18. Since amino acids provide the majority of cellular biomass29, we asked whether pre-malignant EpdSCs have altered amino acid requirements. Gas chromatography-mass spectrometry (GC-MS) of medium from primary cultures revealed that essential amino acids were consumed at similar rates between WT and SOX2+ EpdSCs (Fig. 1c). Of the non-essential amino acids, only glutamine, tyrosine and serine were appreciably consumed, consistent with reports in cancer cells29. Of these, only serine was differentially consumed (Fig. 1c and Extended Data Fig. 1b).
Unexpectedly, despite reduced translation16, SOX2+ cells consumed more serine than WT cells. Glycine, which can be interconverted with serine by serine hydroxymethyltransferases (SHMT1/2), was not appreciably consumed (Extended Data Fig. 1b). These results suggested that SOX2+ progenitors deviated from WT EpdSCs in serine metabolism. Culturing EpdSCs with uniformly 13C-labeled serine confirmed that SOX2+ cells derived a larger portion of intracellular serine from extracellular sources (Extended Data Fig. 1c).
We next analyzed the consequences of withdrawing extracellular serine from the culture medium. To minimize possible confounding effects arising from converting glycine to serine under starvation conditions, we also removed glycine. When deprived of exogenous serine and glycine (Ser/Gly), SOX2+ cells did not maintain intracellular serine pools as well as WT EpdSCs and their proliferation halted (Fig. 1d,e). By contrast, WT EpdSCs proliferated normally. Ser/Gly dependence was independent of the oncogene used to induce pre-malignancy, as HRasG12V-expressing EpdSCs also required exogenous Ser/Gly to proliferate (Extended Data Fig. 1d). These data indicate that oncogenic EpdSCs rely upon exogenous Ser/Gly to sustain proliferation.
The proliferative block of pre-malignant EpdSCs upon Ser/Gly deprivation was surprising, given that both can be synthesized de novo30. To determine whether synthesis of one or both amino acids was defective in SOX2+ cells, we depleted each individually. Consistent with minimal net consumption of glycine (Extended Data Fig. 1b), glycine deprivation did not affect proliferation. By contrast, serine starvation alone inhibited SOX2+ proliferation comparably to combined Ser/Gly deprivation (Fig. 1f). Thus, pre-malignant EpdSCs are functional serine auxotrophs that rely upon obtaining serine from extracellular sources to proliferate. To avoid potential confounding effects of serine deprivation alone, we starved cells of both Ser/Gly in subsequent experiments.
In addition to extracellular consumption, cells can derive serine either from SHMT1/2, or from the serine synthesis pathway (SSP), wherein glucose-derived 3-phosphoglycerate (3PG) is converted to serine through the sequential enzymes phosphoglycerate dehydrogenase (PHGDH), phosphoserine transaminase (PSAT1) and phosphoserine phosphatase (PSPH) (Fig. 1g). SOX2+ and WT cells exhibited comparable SHMT1/2 expression and Ser/Gly interconversion (Extended Data Fig. 1e,f, Supplementary Table 1). Similarly, SOX2+ cells exhibited no defect in SSP enzyme expression upon Ser/Gly deprivation. However, labeling with [U-13C]glucose revealed reduced glucose-derived serine synthesis in SOX2+ EpdSCs (Fig. 1h). Upon Ser/Gly starvation, WT cells derived the majority of their intracellular serine from glucose, while SOX2+ cells failed to do so (Fig. 1i). Thus, pre-malignant EpdSCs suppress glucose-dependent serine synthesis.
Limited cytosolic NAD+ regeneration drives serine auxotrophy
We next assessed why SOX2+ cells did not employ the SSP. Downstream of the serine precursor 3PG, the glycolytic end-product pyruvate can either be shunted to lactate or enter mitochondria to fuel the tricarboxylic acid (TCA) cycle (Fig. 1g). Pyruvate enters the TCA cycle either through pyruvate dehydrogenase (PDH) or pyruvate carboxylase (PC) to fuel citrate production (Extended Data Fig. 2a).
Isotope tracing revealed that SOX2+ cells increased glucose-derived citrate synthesis through both PDH and PC (Extended Data Fig. 2b), indicating that pre-malignant EpdSCs were not generally defective in glucose metabolism. SOX2+ cells demonstrated increased expression of pyruvate carboxylase (Pcx) and pyruvate dehydrogenase E1β (Pdhb) transcripts, suggesting a coordinated program favoring mitochondrial pyruvate consumption (Extended Data Fig. 2c). We therefore asked whether increasing mitochondrial pyruvate metabolism conferred serine auxotrophy. Increasing pyruvate oxidation in WT EpdSCs with dichloroacetate (DCA)31 induced serine auxotrophy (Extended Data Fig. 2d). Conversely, blocking mitochondrial pyruvate import using UK-509932 conferred resistance to serine starvation (Extended Data Fig. 2e). These results suggest that elevated mitochondrial pyruvate utilization can induce dependence on exogenous serine.
Once imported into mitochondria, pyruvate is no longer a substrate for cytosolic lactate dehydrogenase, which reduces pyruvate to lactate to regenerate oxidized NAD+ required for glycolysis (Extended Data Fig. 2a). As NAD+ is also a cofactor for the rate-limiting SSP enzyme PHGDH33 (Fig. 1g and Extended Data Fig. 2a), we hypothesized that enhanced mitochondrial pyruvate metabolism of SOX2+ cells limits cytosolic NAD+ regeneration, thereby impairing the SSP. Consistent with this hypothesis, α-ketobutyrate (AKB), an alternative LDH substrate that enables NAD+ regeneration34 (Extended Data Fig. 2f) rescued serine auxotrophy in both SOX2+ and DCA-exposed WT cells (Extended Data Fig. 2g,h). Furthermore, the pyruvate/lactate ratio, which varies in concert specifically with the cytosolic NAD+/NADH ratio35,36, was lower in SOX2+ cells compared to WT cells (Fig. 1j). Supplementing pyruvate to increase the NAD+/NADH ratio34,37 rescued serine auxotrophy and supported increased lactate secretion in SOX2+ cells (Fig. 1k,l, Extended Data Fig. 2j,k). Conversely, lowering the NAD+/NADH ratio with lactate supplementation induced auxotrophy in WT EpdSCs (Fig. 1l).
Genetic interventions to manipulate the NAD+/NADH ratio produced similar results. Expression of LbNOX, a bacterial NADH oxidase35, increased the whole-cell NAD+/NADH ratio, increased [U-13C]glucose labeling of serine, and rescued serine auxotrophy of both SOX2+ cells and lactate-treated WT cells (Fig. 1m–o; Extended Data Fig. 2l–n). Collectively, these findings indicate that cytosolic NAD+ regeneration controls serine biosynthesis in EpdSCs.
Serine restriction induces differentiation of wild-type EpdSCs
Our findings thus far demonstrate that serine auxotrophy distinguishes pre-malignant EpdSCs from their normal counterparts. To understand how serine availability affects EpdSC function in vivo, we assessed the effects of dietary Ser/Gly withdrawal25,26 on EpdSC growth and differentiation, which must be balanced to maintain homeostasis. We placed pregnant mice on a Ser/Gly-free diet (Extended Data Fig. 3a) and analyzed littermate WT and SOX2+ animals at P0. The diet neither induced apoptosis in either genotype, nor affected WT EpdSC proliferation; in contrast, Ser/Gly restriction impaired SOX2+ EpdSC proliferation (Fig. 2a and Extended Data Fig. 3b). This effect was likely cell autonomous, as culturing EpdSCs with low levels of Ser/Gly to mimic dietary restriction specifically slowed growth of SOX2+ EpdSCs (Extended Data Fig. 3c). Reduced proliferation of SOX2+ EpdSCs in low Ser/Gly conditions was accompanied by a failure to induce the SSP and sustain intracellular serine pools (Extended Data Fig. 3d,e). Similar to our in vitro findings, SOX2+ EpdSC proliferation in vivo was rescued by enhancing NAD+ regeneration via LbNOX (Extended Data Fig. 3f,g).
Fig. 2. Restricting extracellular serine and glycine induces epidermal differentiation.
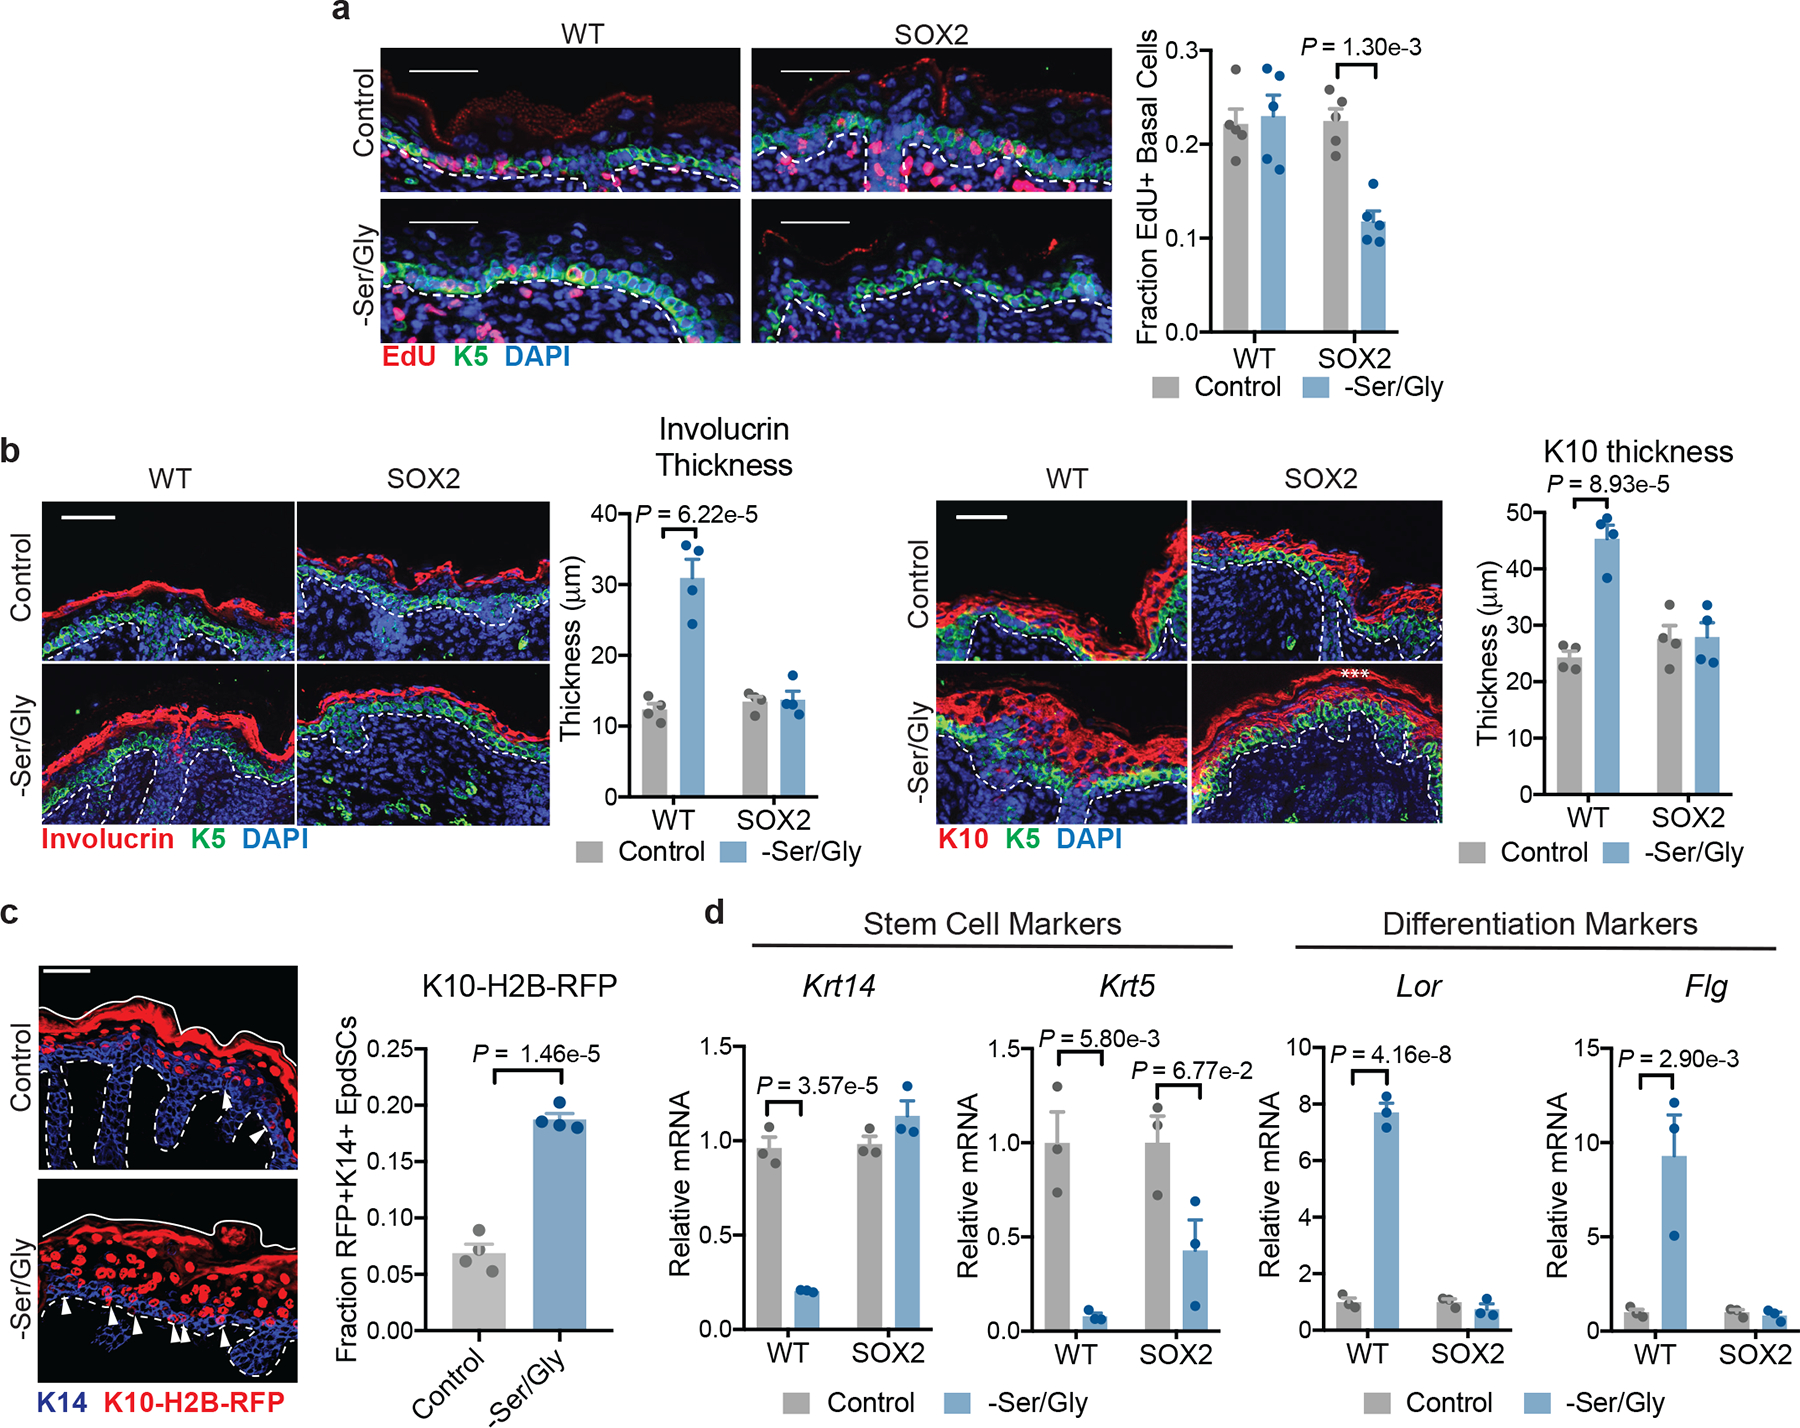
a, Imaging (left) and quantification (right) of EdU incorporation into K5+ EpdSCs in P0 WT and SOX2+ mice where mothers were maintained on control or Ser/Gly-free diet (n=5 mice per condition). Data are mean ±SEM. b, Immunofluorescence of the differentiated cell markers Involucrin (left) and K10 (right) in P0 mice on control or Ser/Gly-free diet (n=4 mice per condition). Data are mean ±SEM. Asterisk represents autofluorescence. c, Immunofluorescence (left) and quantification (right) of the differentiation reporter Krt10-H2B-mRFP in EpdSCs of P0 WT mice on control or Ser/Gly-free diet (n=4 mice per condition). Data are mean ±SEM. d, qPCR for the stem cell markers Krt5 and Krt14 (left) and differentiated cell markers Lor and Flg (right) following 24 h of Ser/Gly starvation (n=3 independent experiments). Data are mean ±SEM. Scale bar = 50 μm. Statistical significance was determined using a two-way ANOVA with Tukey’s multiple comparison test for panels a, b and d, and an unpaired two-tailed student’s t-test for panel c. Numerical data are provided in Statistics Source Data Fig. 2.
Notably, despite maintaining proliferation (Fig. 2a), WT epidermis on a Ser/Gly-free diet displayed marked thickening of the differentiating layers, typified by expression of Involucrin and Keratin-10 (K10) (Fig. 2b). Thickening was accompanied by an increase in EpdSCs dividing perpendicularly to the basement membrane (Extended Data Fig. 3h), which stimulates epidermal differentiation38. To directly assess whether extracellular Ser/Gly starvation prompted EpdSCs to differentiate prematurely, we utilized a transgenic reporter mouse wherein the Krt10 promoter drives H2B-mRFP, thereby marking induction of a terminal differentiation program39. Strikingly, Ser/Gly restriction significantly increased the proportion of prematurely-differentiated Krt10-H2B-mRFP+ EpdSCs (Fig. 2c). By contrast, SOX2+ EpdSCs maintained planar cell divisions and showed no increase in differentiation (Fig. 2b, Extended Data Fig. 3h).
To determine whether the effect of Ser/Gly depletion on differentiation was cell-autonomous, we measured SC (Krt14 and Krt5) and differentiation (Lor and Flg) gene expression in vitro. Consistent with our in vivo results, Ser/Gly depletion repressed Krt14/K5 and increased Lor/Flg expression specifically in WT EpdSCs (Fig. 2d). Partial Ser/Gly restriction and serine starvation alone yielded similar results (Extended Data Fig. 3i–k). Collectively, these data suggest that Ser/Gly availability regulates the balance between EpdSC growth and differentiation, and that oncogenic EpdSCs are resistant to Ser/Gly deprivation-induced differentiation.
De novo serine synthesis in EpdSCs promotes α-ketoglutarate-dependent differentiation
A priori, differentiation could be due to either serine depletion per se or induction of the SSP via one of its byproducts, NADH or α-ketoglutarate (αKG) (Fig. 3a). To uncouple these possibilities, we knocked down Phgdh, the first SSP enzyme. Phgdh suppression blocked precocious differentiation induced by serine restriction, suggesting that SSP flux, rather than serine depletion, drives epidermal differentiation (Fig. 3b, Extended Data Fig. 4a–d).
Fig. 3. Serine synthesis drives α-ketoglutarate-dependent differentiation.
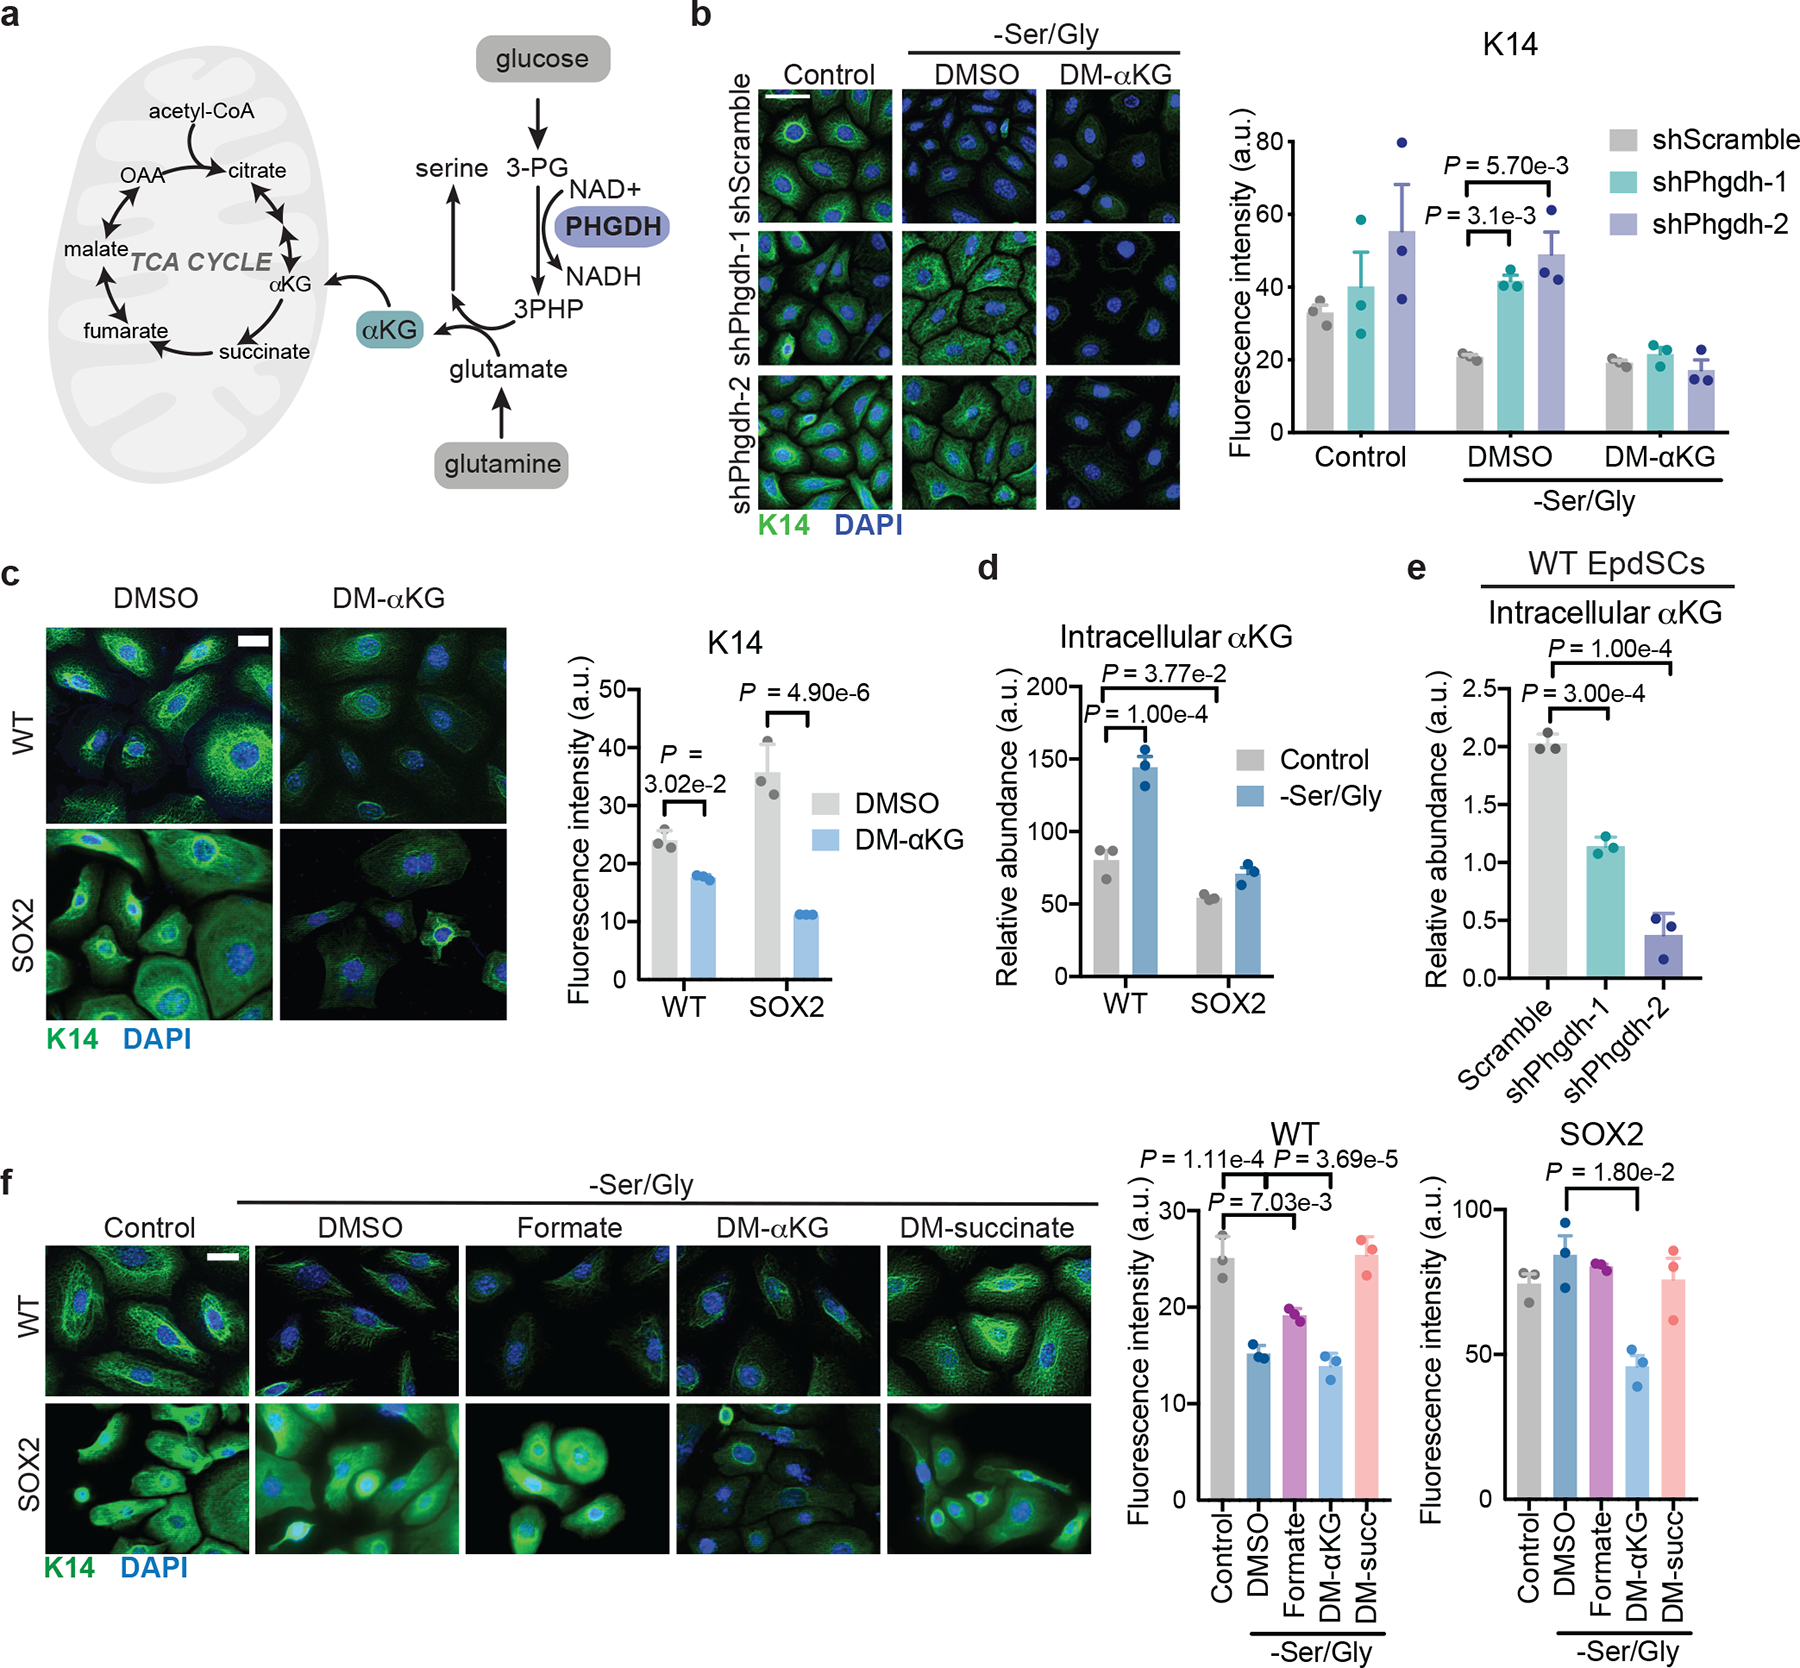
a, Schematic of serine synthesis and its byproducts. b, Immunofluorescence of K14 in WT shScramble or shPhgdh EpdSCs upon Ser/Gly starvation with DMSO or 4 mM DM-αKG (n=3 independent experiments). Data are mean ±SEM. Scale bar = 50 μm. c, Immunofluorescence of K14 in cells cultured with 4 mM DM-αKG in complete medium (n=3 independent experiments). Scale bar = 5 μm. Data are mean ±SEM. d-e, Intracellular αKG pools of WT and SOX2+ cells (d) or WT cells expressing the indicated hairpins (e) following 16 h of Ser/Gly starvation (n=3 biologically independent samples). Data are mean ±SEM. f, Immunofluorescence and quantification of K14 in cells cultured with DMSO, 1 mM formate, 4 mM DM-αKG, or 4 mM DM-succinate for 24 h (n=3 independent experiments). Data are mean ±SEM. Scale bar = 5 μm. Statistical significance was determined using a two-way ANOVA with Dunnett’s multiple comparison tests for panel b, with Sidak’s multiple comparison test for panel c, and with Tukey’s multiple comparison test for panel d. An ordinary one-way ANOVA with Dunnett’s multiple comparison test was used for panel e, and with Tukey’s multiple comparison test for panel f. Numerical data are provided in Statistics Source Data Fig. 3.
We next asked which byproduct of the SSP promoted precocious differentiation. NADH seemed unlikely, as interventions that favor NADH oxidation (either AKB or UK5099), promoted, rather than inhibited, differentiation (Extended Data Fig. 4e–f). By contrast, exogenous cell-permeable αKG was sufficient to induce differentiation in both WT and SOX2+ EpdSCs (Fig. 3c). Moreover, αKG restored differentiation in Phgdh-deficient WT EpdSCs, underscoring its ability to trigger the consequences of SSP activation (Fig. 3b, Extended Data Fig. 4d).
Indeed, Ser/Gly starvation of WT EpdSCs led to accumulation of αKG and downstream TCA cycle metabolites (Fig. 3d and Extended Data Fig. 5a). Importantly, Phgdh silencing blunted αKG accumulation following Ser/Gly restriction (Fig. 3e, Extended Data Fig. 5c). Many reactions can generate αKG from glutamine40. Based on calculations of serine and glutamine uptake in WT EpdSCs, we estimated that approximately 10% of consumed glutamine is used to sustain serine synthesis during Ser/Gly deprivation (Extended Data Fig. 6b, Supplementary Tables 2,3).
Interestingly, αKG also affected SOX2+ EpdSCs (Fig. 3c), indicating that they are not generally defective for differentiation. SOX2+ EpdSCs exhibited reduced levels of αKG and failed to induce TCA cycle intermediates upon Ser/Gly deprivation (Fig. 3d, Extended Data Fig. 5a,d), consistent with impaired SSP activity. Therefore, we asked whether rescuing αKG levels in these cells could restore differentiation. Indeed, αKG reversed the differentiation block of Ser/Gly-starved SOX2+ EpdSCs (Fig. 3f, Extended Data Fig. 5d). The ability of αKG to restore differentiation was not merely due to its role as an anaplerotic substrate for the TCA cycle downstream of the SSP41, since cell-permeable succinate did not induce differentiation (Fig. 3f, Extended Data Fig. 5d).
In addition to serving as a substrate for the TCA cycle, αKG is also a co-substrate for a large family of dioxygenases that consume αKG and produce succinate as part of their reaction cycle42. Succinate, a competitive inhibitor of these enzymes42, was sufficient to block differentiation induced by Ser/Gly deprivation (Fig. 3f, Extended Data Fig. 5d). Therefore, we hypothesized that Ser/Gly deprivation induced differentiation by activating αKG-dependent dioxygenases. Metabolic regulation of αKG-dependent dioxygenases, including the Jumonji-domain family of histone demethylases, has been implicated in chromatin regulation and cell fate decisions23,42. In the skin, trimethylation of histone 3 lysine 27 (H3K27me3) represses terminal differentiation gene expression. Accordingly, EpdSC differentiation is accelerated by conditional loss of Ezh2, an H3K27 methyltransferase, and inhibited by loss of the αKG-dependent H3K27me3 demethylase JMJD343,44.
Culturing EpdSCs with cell-permeable αKG revealed that H3K27me3 levels are sensitive to intracellular αKG levels (Fig. 4a). We therefore posited that serine biosynthesis might favor αKG-dependent H3K27me3 demethylation, and hence differentiation. Indeed when WT EpdSCs were starved for Ser/Gly or serine alone, H3K27me3 levels decreased (Fig. 4b, Extended Data Fig. 5e–g Supplementary Table 4). H3K27me3 loss was Phgdh-dependent, and αKG reversed the effects of Phgdh silencing (Fig. 4c,d).
Fig. 4. Serine synthesis drives αKG-dependent H3K27me3 loss.
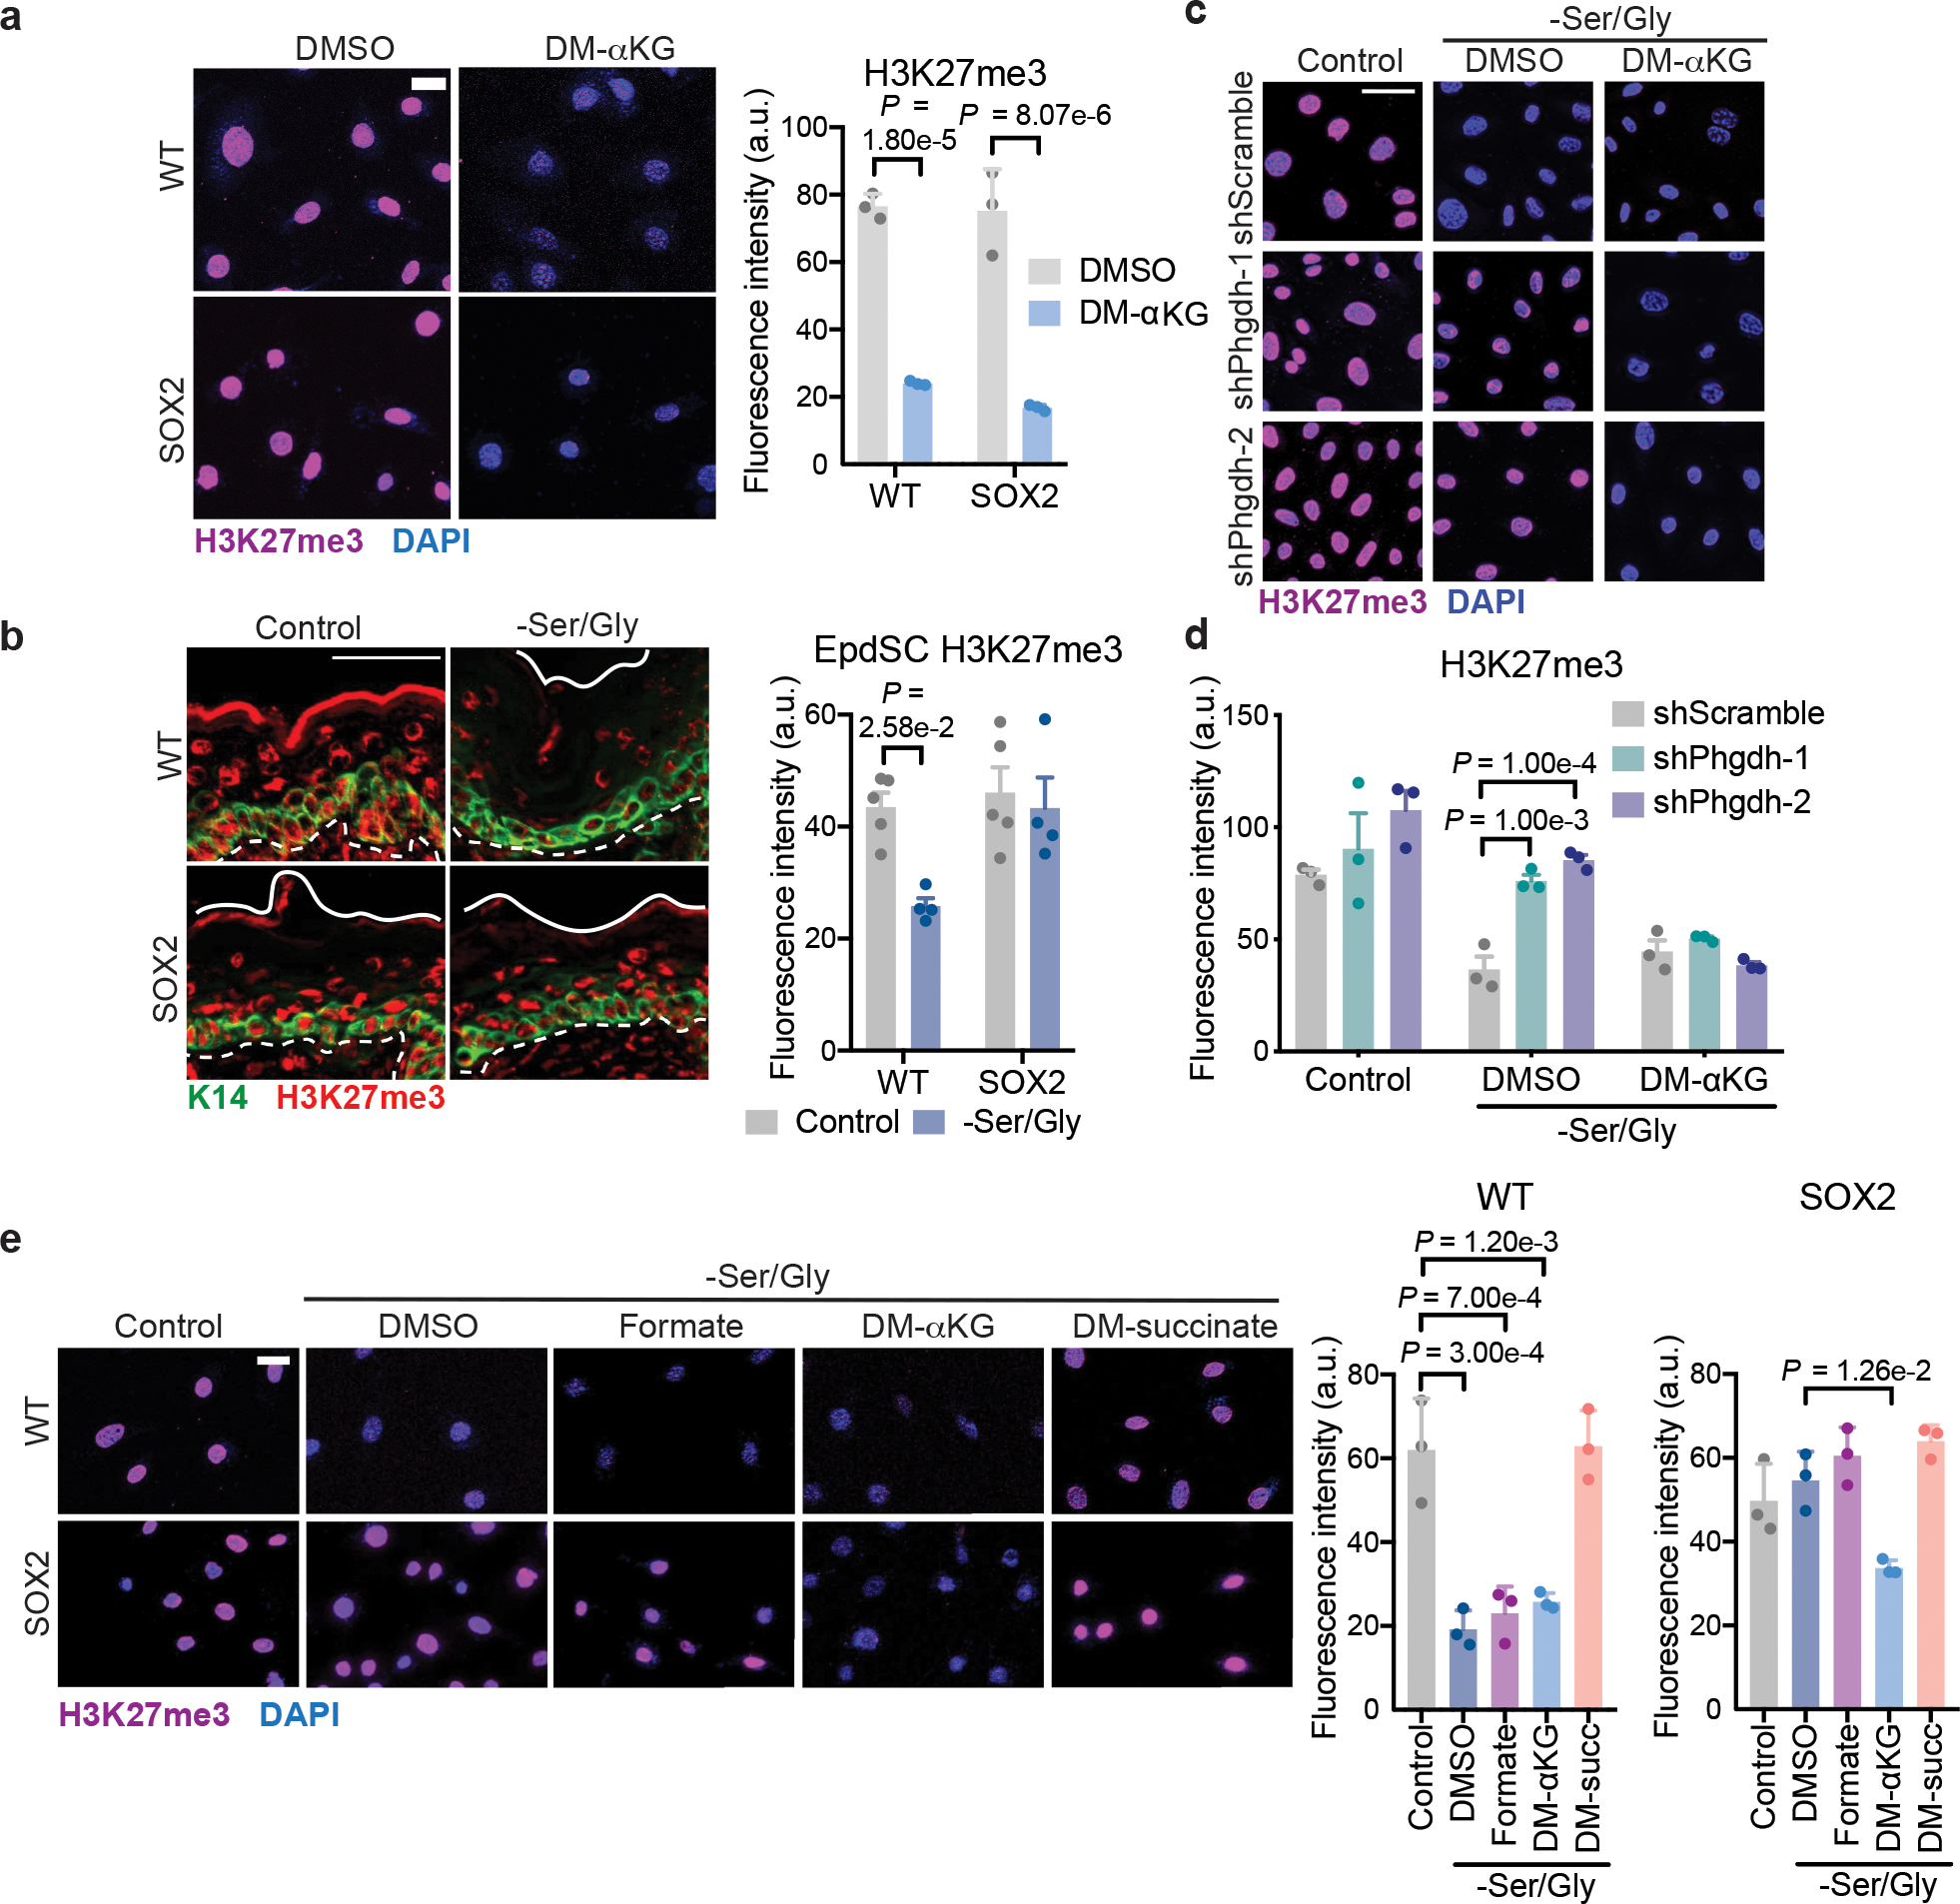
a, Immunofluorescence and quantification of bulk H3K27me3 in cells cultured with DMSO or 4 mM DM-αKG for 24 h (n=3 independent experiments). Scale bar = 5 μm. Data are mean ±SEM. b, Immunofluorescence and quantification of bulk H3K27me3 in K14+ EpdSCs in P0 mice on control or Ser/Gly-free diet (n=5 control, 4 –Ser/Gly mice). Scale bar = 50 μm. Data are mean ±SEM. c-d, Immunofluorescence (c) and quantification (d) of H3K27me3 in WT shScramble or shPhgdh cells with our without 4 mM DM-αKG (n=3 independent experiments). Scale bar = 50 μm. Data are mean ±SEM. e, Immunofluorescence and quantification of bulk H3K27me3 in cells cultured with vehicle, 1 mM formate, 4 mM DM-αKG, or 4 mM DM-succinate for 24 h (n=3 independent experiments). Scale bar = 5 μm. Data are mean ±SEM. Statistical significance was determined using two-way ANOVA with Sidak’s multiple comparison test for panels a and b and Dunnett’s multiple comparison test for panel d. An ordinary one-wav ANOVA with Tukey’s multiple comparisons test was used in panel e. Numerical data are provided in Statistics Source Data Fig. 4.
To directly test the role of H3K27me3 in differentiation induced by Ser/Gly starvation, we utilized inhibitors against JMJD3 (GSK-J4) and EZH2 (GSK-343) to block H3K27me3 demethlyation or methylation, respectively. GSK-J4 prevented H3K27me3 loss and differentiation induced by Ser/Gly starvation in WT EpdSCs. Conversely, GSK-343 suppressed H3K27me3 in both WT and SOX2+ EpdSCs and promoted differentiation (Extended Data Fig. 6a–c).
Ser/Gly starvation can exert pleiotropic cellular effects, including depletion of one-carbon units that contribute to methylation reactions45 and increased oxidative stress that can drive epidermal differentiation46,26. However, one-carbon units did not appear to be limiting, since supplying exogenous formate did not rescue H3K27me3 or differentiation (Fig. 3f, Fig. 4e, Extended Data Fig. 5d). Likewise, while antioxidants blocked differentiation, consistent with known roles of ROS in differentiation46, they neither affected H3K27me3 nor protected against differentiation upon EZH2 inhibition (Extended Data Fig. 6a–f). In contrast, cell-permeable αKG promoted H3K27me3 demethylation and differentiation in SOX2+ cells, and cell-permeable succinate suppressed differentiation and H3K27me3 loss in WT EpdSCs (Fig. 3f, Fig. 4e, Extended Data Fig. 5d). Signaling pathways including p53 and mTORC1 are known to respond to Ser/Gly starvation and regulate differentiation in various contexts26,47–49. In WT EpdSCs, however, Ser/Gly starvation affected neither p53 nor mTORC1 signaling (Extended Data Fig. 6g–j). In SOX2+ EpdSCs, Ser/Gly starvation induced modest expression of cell cycle arrest genes, consistent with impaired proliferation (Extended Data Fig. 6h).
Taken together, our data suggest that endogenous serine synthesis poises EpdSCs to differentiate by facilitating H3K27me3 demethylation, although additional αKG-dependent dioxygenases may contribute to epidermal differentiation. Moreover, SSP suppression enables pre-malignant EpdSCs to escape differentiation and enforce self-renewal.
Ser/Gly starvation impairs tumor initiation and growth
The finding that Ser/Gly starvation induced differentiation led us to posit that Ser/Gly deprivation might impair tumor initiation. To investigate this possibility, we placed mice on a Ser/Gly-free diet prior to administration of a classical chemical carcinogenesis protocol that leads to initiation of EpdSC-derived benign papillomas and malignant SCCs50 (Fig. 5a). Compared to a control diet, Ser/Gly starvation significantly impaired tumor initiation and reduced tumor burden (Fig. 5b). Similar results were obtained upon orthotopic injection of established SCCs into immunocompromised (Nude) mice (Fig. 5c).
Fig. 5. Serine and glycine starvation suppresses tumor initiation and stem cell maintenance.
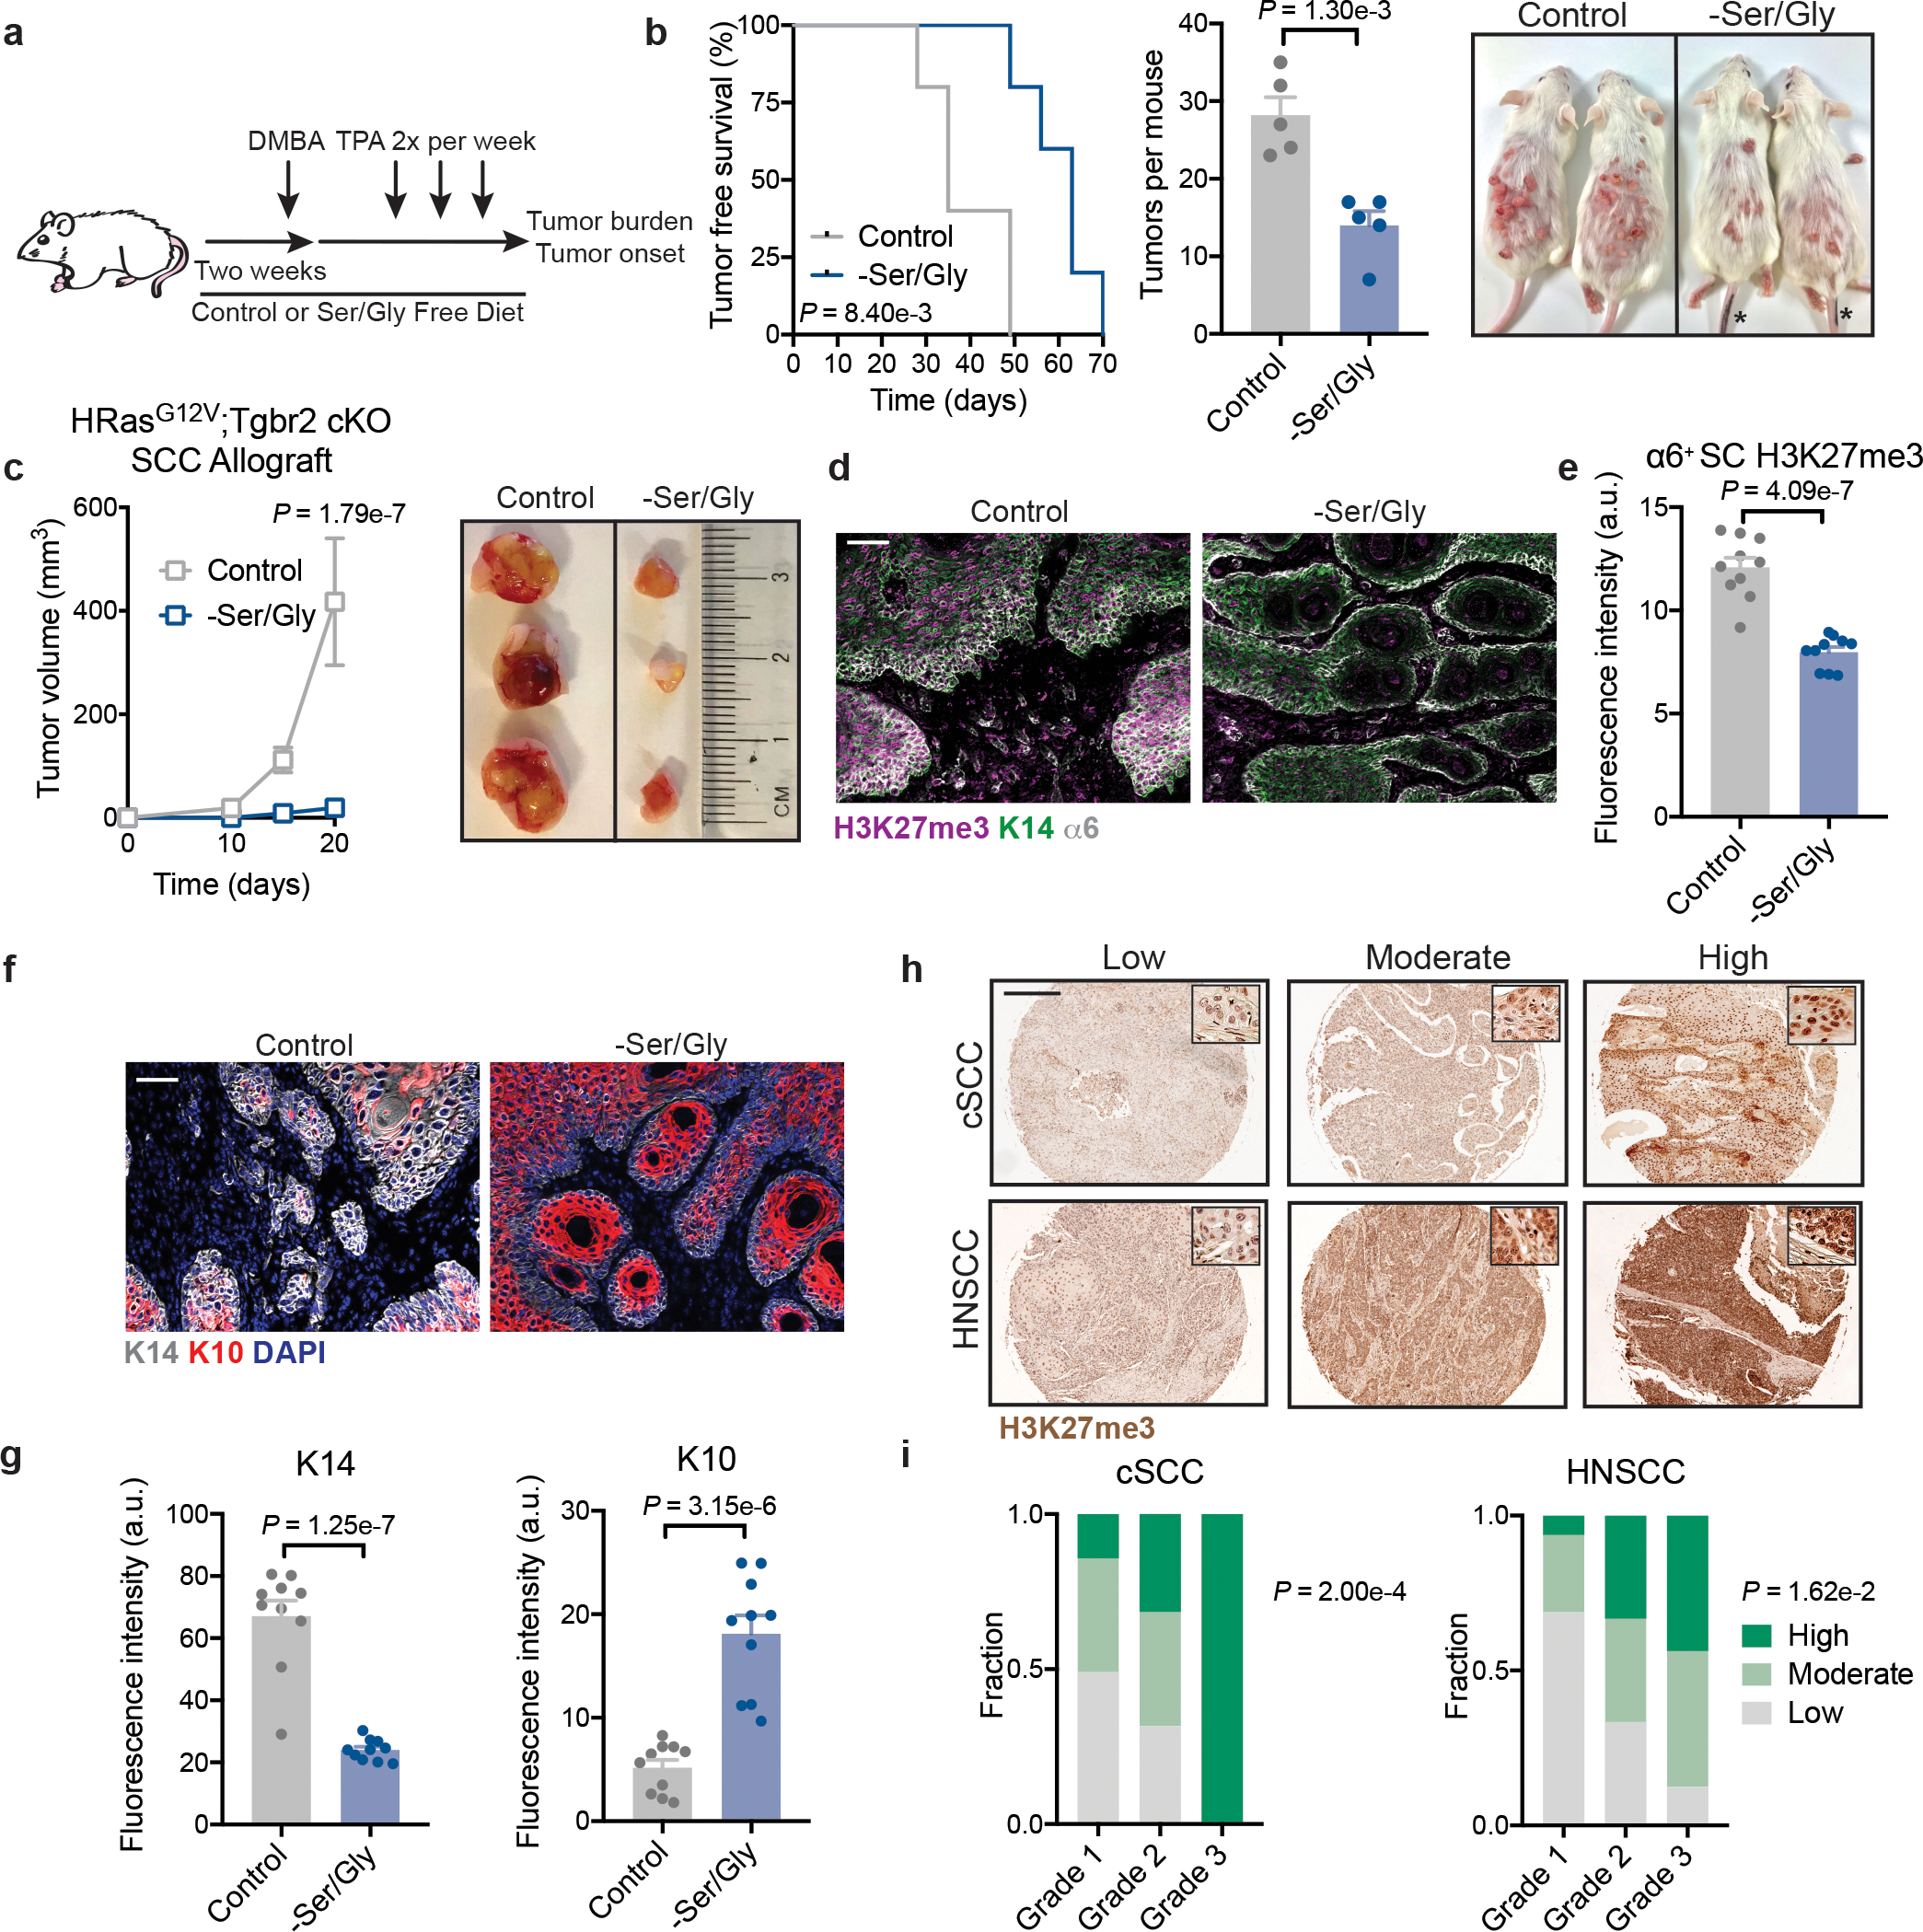
a, Schematic of DMBA/TPA tumor initiation study. b, Tumor free survival (left), tumor burden fourteen weeks after protocol initiation (middle), and representative mice 14 weeks after protocol initiation (right) of DMBA/TPA treated animals on control or Ser/Gly-free diet (n=5 mice per condition). Data are mean ±SEM. Asterisk are marker identification of tails. c, Tumor growth (left) and representative tumors (right) of SCC lines orthotopically grafted into Nude mice on control or Ser/Gly-free diet (n=8 tumors per condition). Data are mean ±SEM. d-e, Representative immunofluorescence (d) and quantification (e) of bulk H3K27me3 in DMBA/TPA derived tumors. (n=10 tumors per condition). Data are mean ±SEM. f-g, Representative immunofluorescence (f) and quantification (g) of stem cell (K14) and differentiation (K10) markers in DMBA/TPA derived (n=10 tumors per condition). Data are mean ±SEM. h-i, Representative immunohistochemistry (h) and scoring (i) for H3K27me3 levels in human cutaneous and head and neck SCCs (cSCC and HNSCC, respectively). See methods for detailed description of scoring method. For cSCCs n=49 grade 1, 19 grade 2, 6 grade 3. For HNSCCs, n=16 grade 1, 33 grade 2, 16 grade 3. Scale bar = 200 μm. Inset shows 20x image from core demonstrating nuclear staining in tumor cells. Scale bar = 50 μm unless otherwise noted. Statistical significance was determined using a log-rank (Mantel Cox) test for survival analysis in panel b, unpaired two-tailed student’s t-test for tumor burden in panel b, unpaired two-tailed student’s t-test for panels e and g, a two-way ANOVA with Sidak’s multiple comparison test in panel c, and a Chi-Square test in panel i. Numerical data are provided in Statistics Source Data Fig. 5.
Tumor growth under dietary Ser/Gly starvation requires enhanced SSP activity25,51. Based upon our data, we hypothesized that SSP activation might also represent a liability for SCCs by driving differentiation. Indeed, tumors that formed under the selective pressure of Ser/Gly restriction exhibited reduced H3K27me3 and enhanced differentiation relative to controls (Fig. 5d–g, Extended Data Fig. 7a). Pharmacologically inhibiting αKG-dependent H3K27me3 demethylases52 prevented starvation-induced differentiation (Extended Data Fig. 7b). Histologically, Ser/Gly starvation induced signs of terminal differentiation, including keratin pearls (Extended Data Fig. 7c). SCC differentiation was independent of mTORC1 activity (Extended Data Fig. 7d–f). By contrast, LbNOX expression, which favors serine synthesis, was sufficient to induce H3K27me3 loss and differentiation even on a control diet (Extended Data Fig. 7g,h). Consistently, LbNOX suppressed tumor growth (Extended Data Fig. 7i).
Ser/Gly starvation also induced differentiation, H3K27me3 loss, and growth suppression in xenografts of human A431 and SCC9 lines (Extended Data Fig. 8a–f). Notably, both lines harbor p53 mutations53,54, demonstrating that serine starvation-induced differentiation does not require wild-type p53. To further test whether Ser/Gly starvation was associated with chromatin dysregulation, we took advantage of SCC9 lines engineered to express reporters driven by super-enhancers of tSC identity genes Klf5 and miR21 (Extended Data Fig. 8g)55. Reporter expression was reduced by Ser/Gly starvation, consistent with broad chromatin dysregulation (Extended Data Fig. 8g). Finally, analysis of 139 different human SCCs revealed that H3K27me3 levels correlated with SCC grade (Fig. 5h,i, Extended Data Fig. 8h). Thus, our findings identify a strong link between Ser/Gly availability, H3K27me3 demethylation and tSC fate.
Glucose-derived serine synthesis suppresses tumorigenesis and stemness
To determine whether the anti-tumor effects of Ser/Gly starvation are due to Ser/Gly starvation or SSP activation, we silenced Phgdh in SCCs (Extended Data Fig. 9a,b). In vivo, Phgdh silencing prevented H3K27me3 loss upon Ser/Gly starvation (Fig. 6a). Consistent with driving differentiation, Ser/Gly starvation induced tSC depletion, as reflected by loss of cells expressing the tSC markers CD44 and SOX2. Silencing Phgdh expanded the tSC pool and prevented tSC loss upon dietary Ser/Gly starvation (Fig. 6b, Extended Data Fig. 9d–e). Critically, SCC differentiation required an intact serine synthesis pathway, since Phgdh silencing blocked diet-induced differentiation (Fig. 6c, Extended Data Fig. 9c,f–i).
Fig. 6. Glucose-derived serine synthesis drives SCC differentiation.
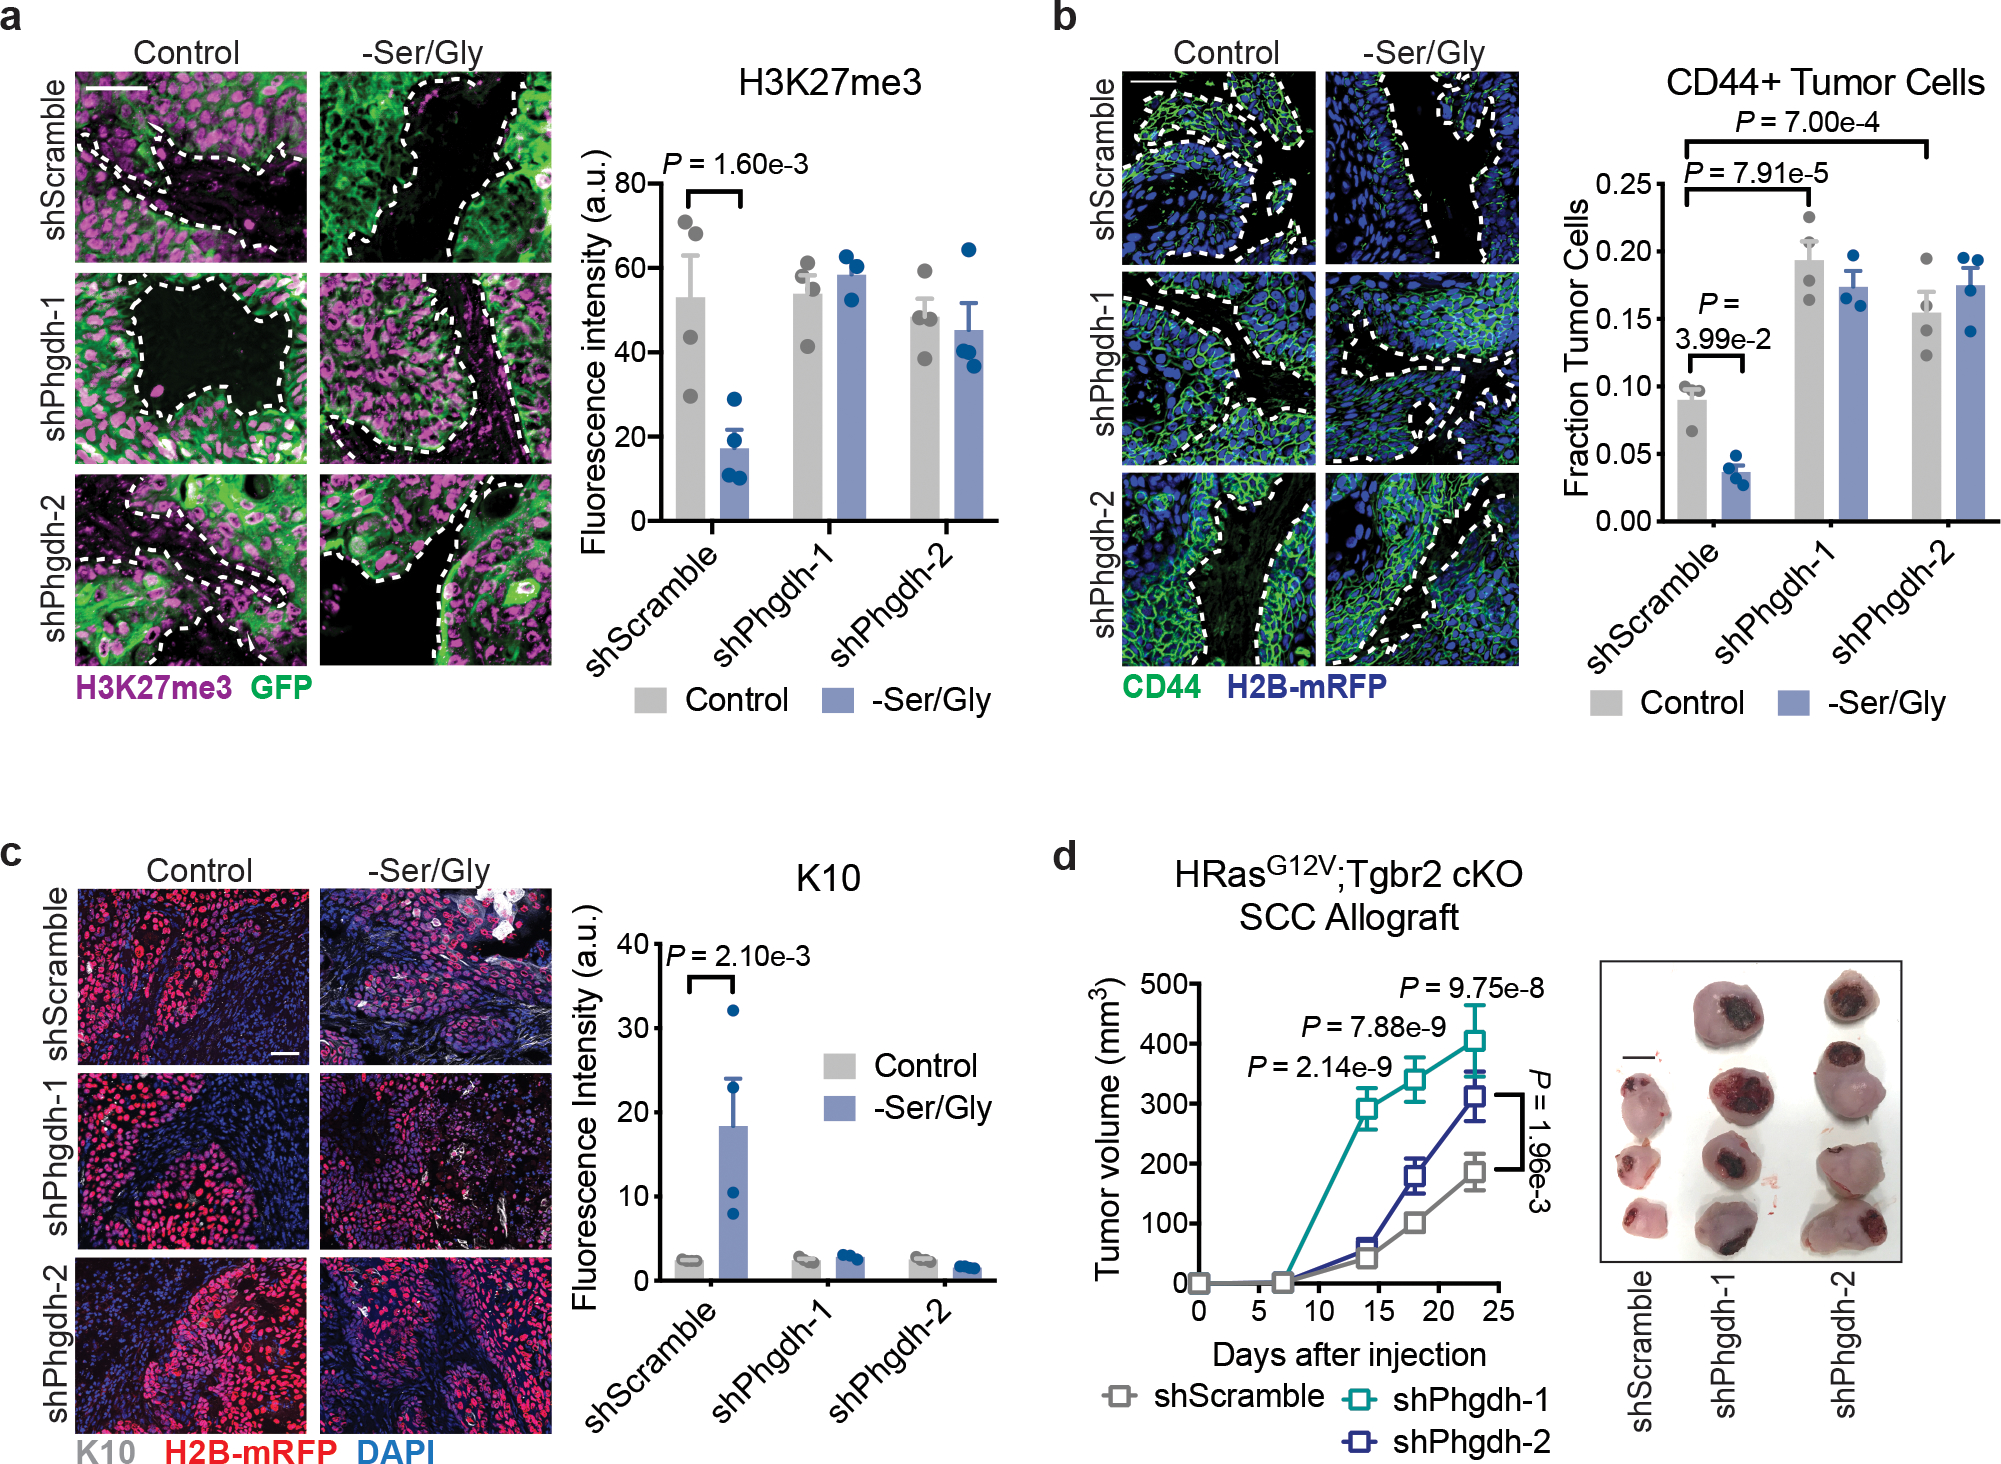
a. Immunofluorescence and quantification of H3K27me3 (n=3 tumors for shPhgdh –Ser/Gly, all others n=4 tumors). Data are mean ±SEM. b, Immunofluorescence analysis and quantification of the stem cell marker CD44 (n=3 tumors for shPhgdh –Ser/Gly, all others n=4 tumors). Data are mean ±SEM. c, Immunofluorescence and quantification of the differentiated cell markers Keratin-10 in shScramble or shPhgdh SCC lines orthotopically grafted into Nude mice on control or Ser/Gly-free diet (n=3 tumors for shPhgdh –Ser/Gly, all others n=4 tumors). Data are mean ±SEM. d, Growth (left) and representative tumors (right) of shScramble or shPhgdh SCC lines orthotopically grafted into Nude mice (n=8 tumors per condition). Scale bar = 5 mm. Data are mean ±SEM. Scale bar = 50 μm unless otherwise noted. Statistical significance was determined using a two-way ANOVA with Tukey’s multiple comparison test for panels a, b and c, and Sidak’s multiple comparison test for panel d. Numerical data are provided in Statistics Source Data Fig. 6.
These findings suggested that, in contrast to previous reports on melanoma and breast cancer41,56, cell-autonomous SSP activation acts as a tumor suppressor in SCCs by driving SC depletion. Consistent with tSC expansion, shPhgdh SCCs grew more rapidly than shScramble SCCs under normal growth conditions in vivo (Fig. 6d). Importantly, we could abrogate this advantage by putting shPhgdh SCCs on a Ser/Gly-free diet (Extended Data Fig. 9j–l). Phgdh ablation using CRISPR-Cas9 likewise enhanced tumor growth (Extended Data Fig. 9n–p). Together, these results underscore the advantage that SCC-SCs gain by silencing endogenous serine biosynthesis so long as exogenous serine is present to fulfill anabolic demands.
αKG drives tumor suppression and differentiation in SCCs
Our data suggest that by inducing the SSP, the consequential production of αKG can bias tSCs to differentiation and thereby suppress tumorigenesis. To directly test this model, we manipulated intracellular αKG and succinate by engineering SCC cells to silence either oxoglutarate dehydrogenase (Ogdh) which consumes αKG, or succinate dehydrogenase A (Sdha), which consumes succinate (Fig. 7a, Extended Data Fig. 10 a,b)47. As expected, intracellular αKG was increased in shOgdh lines while succinate was increased upon Sdha silencing (Fig. 7b).
Fig. 7. αKG drives SCC differentiation.
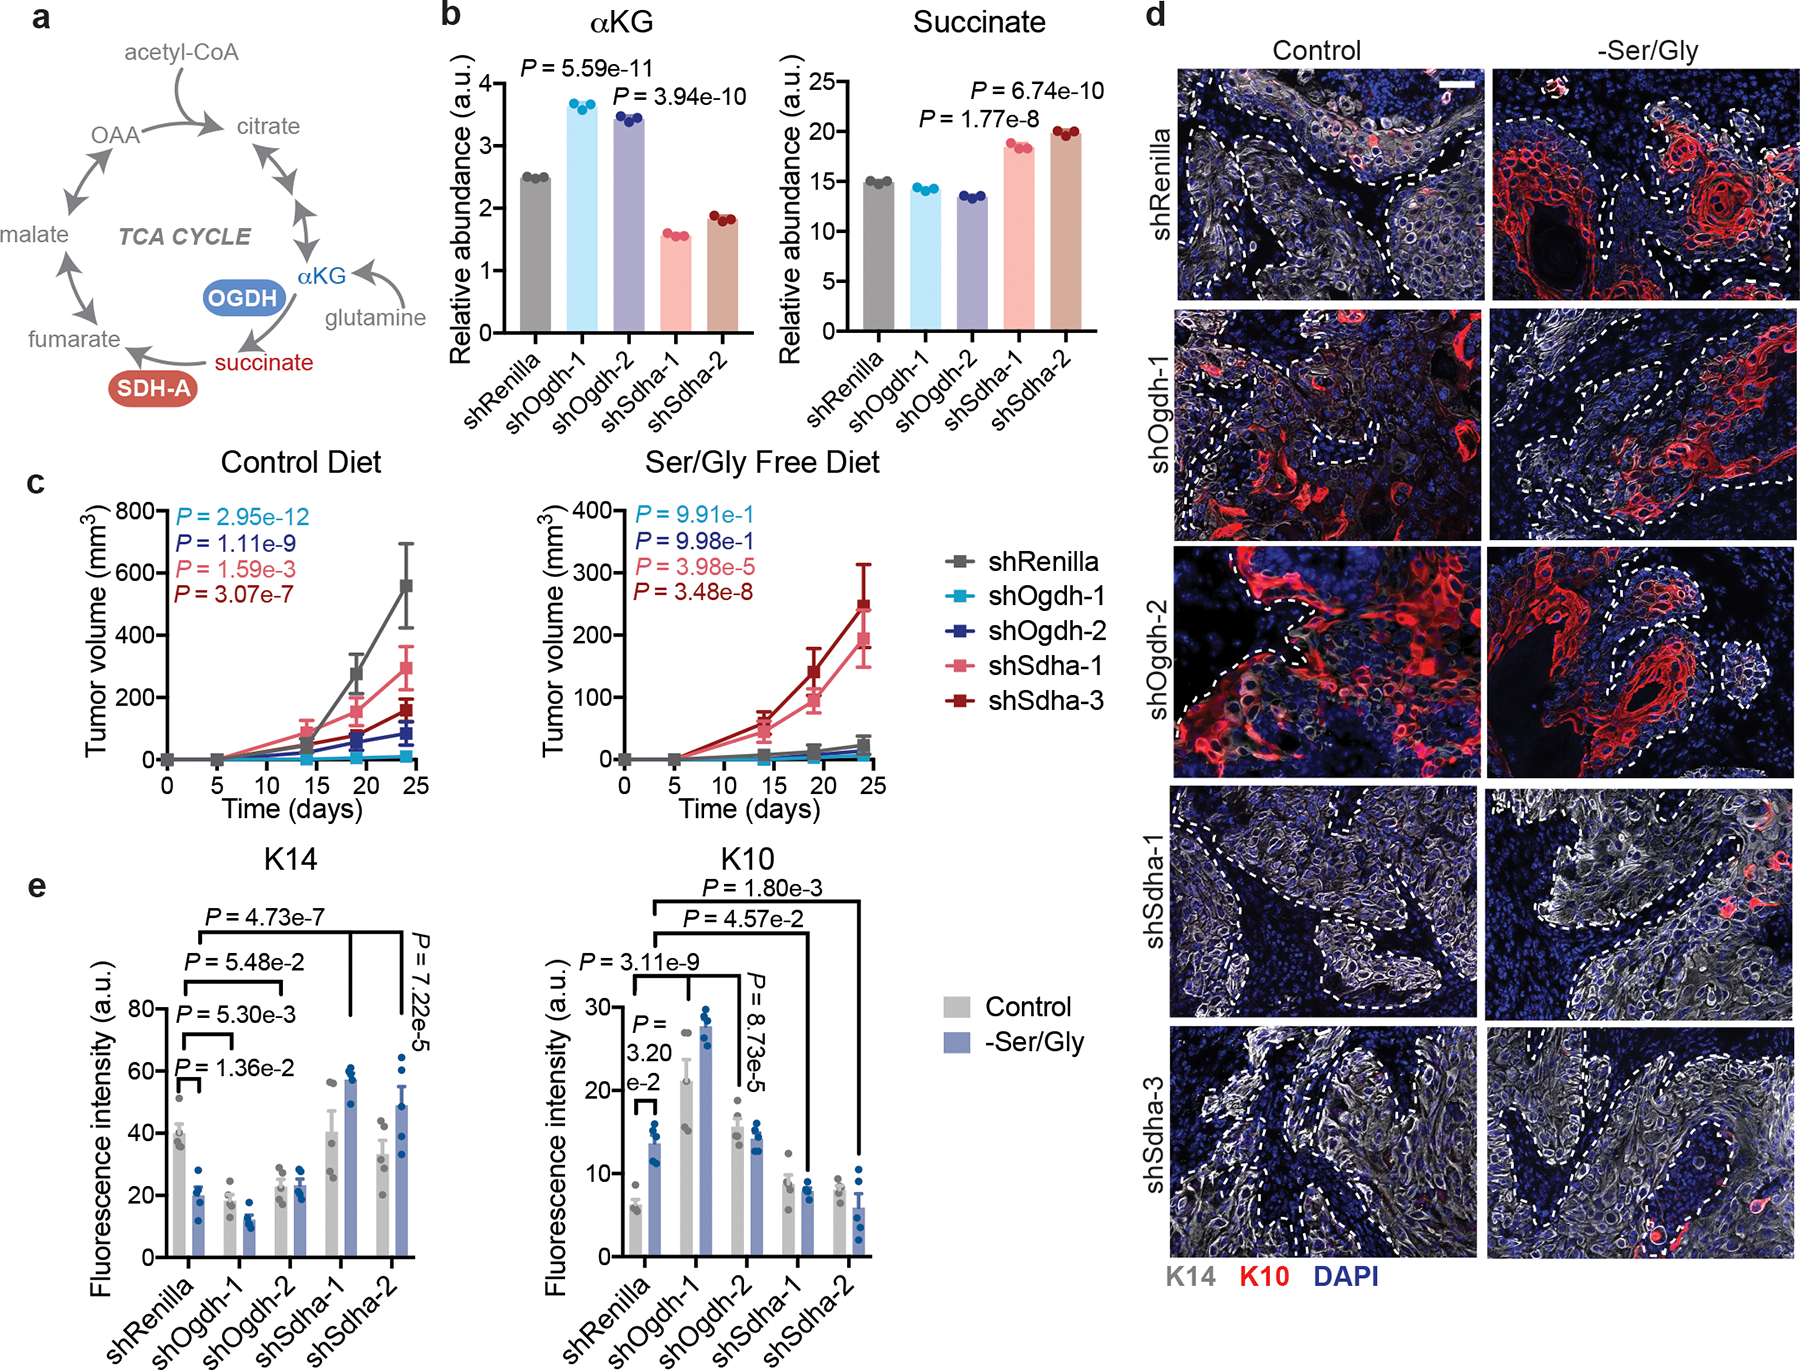
a, Schematic of TCA cycle highlighting OGDH and SDHA reactions. b, Representative GC-MS of intracellular αKG and succinate levels in mouse HRasG12V;Tgfbr2cKO SCC cells (n=3 biologically independent samples). Data are mean ±SEM. P-values are comparison to shRenilla values. c, Growth of shRenilla, shSdha, and shOgdh SCCs orthotopically grafted into Nude mice maintained on control (left) or Ser/Gly-free (right) diets (n=12 tumors). Data are mean ±SEM. P-values represent comparison to shRenilla tumor volume at end point. d-e, Representative immunofluorescence (d) and quantification (e) of stem cell (K14) and differentiation (K10) markers in shRenilla, shSdha, and shOgdh SCCs (n=5 tumors per condition). Data are mean ±SEM. Scale bar = 50 μm. Statistical significance was determined using a two way ANOVA with Tukey’s multiple comparison test in panels c and e, and an ordinary one-way ANOVA with Sidak’s multiple comparison test in panel a. Numerical data are provided in Statistics Source Data Fig. 7.
While each hairpin reduced tumor growth on a normal diet, they had opposing effects upon Ser/Gly restriction (Fig. 7c). OGDH loss hampered SCC growth and was sufficient to drive H3K27me3 loss and tumor differentiation, as assessed by histology and K14/K10 staining, even on a normal diet (Fig. 7 d,e, Extended Data Fig. 10c,d). This was not due to TCA cycle disruption, as SDHA loss failed to induce differentiation in control mice (Fig. 7d,e). Rather, SDHA silencing prevented both H3K27me3 loss and differentiation upon Ser/Gly restriction (Fig. 7d,e, Extended Data Fig. 10c,d). As a result, shSdha tumors sustained growth in the absence of dietary Ser/Gly (Fig. 7c–e). Collectively, these findings are consistent with Ser/Gly starvation inducing activation of αKG-dependent dioxygenases that promote tumor suppressive differentiation programs.
Discussion
In this study we discovered that environmental serine availability profoundly affects tumor initiation and SC fate. Pre-malignant EpdSCs that are destined to initiate tumors suppress de novo serine synthesis by increasing mitochondrial pyruvate consumption, resulting in endogenous serine auxotrophy. In WT EpdSCs, SSP activation facilitates αKG accumulation, which favors H3K27me3 demethylation and promotes terminal differentiation. The SSP also regulates SCC differentiation. In the presence of abundant serine, SSP inhibition triggered expansion of tSCs and promoted tumor growth. Conversely, enforcing serine synthesis using a Ser/Gly-free diet impaired tumor initiation in mice. Diet-mediated tumor suppression could be reversed by inhibiting αKG-dependent dioxygenases, underscoring αKG-dependent differentiation as a major route of tumor suppression. These findings are likely to have relevance to humans, since xenografts were sensitive to Ser/Gly starvation and H3K27me3 levels correlated positively with tumor grade in human SCCs. These results shed light on how SCs integrate nutrient availability with chromatin dynamics in vivo.
Recent evidence supports our finding that NAD+ regeneration is limiting for serine biosynthesis33. Previous studies revealed that environmental or genetic manipulations that impose mitochondrial redox imbalances subsequently impair amino acid biosynthesis33,34,37. Here, we find that endogenous changes in central carbon metabolism, such as those found in SOX2+ EpdSCs, similarly impair cytosolic NAD+ regeneration and amino acid biosynthesis. Collectively, these findings suggest that compartment-specific redox metabolism is likely to be an important regulator of cell fate decisions and nutrient stress responses. Although we cannot rule out the possibility that other mechanisms may restrict serine synthesis in pre-malignant EpdSCs, our data support a critical role for cytosolic NAD+ regeneration in regulating serine auxotrophy and EpdSC behavior.
Emerging evidence suggests that extracellular Ser/Gly restriction impairs tumor growth by imposing redox stress25,26 and limiting one-carbon units that support proliferation57. Our data extend the tumor suppressive effects of Ser/Gly deprivation to tumor initiation, while providing an additional mechanism by which Ser/Gly restriction can antagonize tumorigenesis. The degree to which Ser/Gly restriction affects endogenous serine synthesis, αKG production, and differentiation programs in other cell types is an important area for future investigation.
Intriguingly, certain cancers harbor recurrent mutations in metabolic enzymes that poison αKG-dependent dioxygenases to suppress differentiation58–61. Our data illustrate that even in the absence of such mutations, tSCs rewire intrinsic metabolic pathways to antagonize αKG-dependent chromatin remodeling. While we cannot exclude regulation of other αKG-dependent dioxygenases, we find that environmental Ser/Gly availability contributes to H3K27me3 demethylation, an established mediator of epidermal differentiation.
In conjunction with recent data that mutational status47, nutrient availability62–64 and other metabolic pathways65 can suppress αKG-dependent dioxygenases, our work supports the notion that αKG may act generally as a metabolic tumor suppressor. The pathways that contribute to αKG pools may vary in a cell-type and context-specific manner41,64,65. It is intriguing to consider that while the TCA cycle produces αKG in mitochondria, the SSP generates αKG in the nucleo-cytosolic compartment, where it can act directly as a co-substrate for αKG-dependent dioxygenases. More broadly, our findings expose a way in which SCs balance metabolic demands for growth with those of regulating cell identity.
Consistent with recent work25,51, we find that the SSP is critical for growth when extracellular serine is limiting. However, when extracellular serine is abundant, we find that the SSP is tumor suppressive. By contrast, certain established cancers including breast cancer and melanoma rely on SSP flux to maintain proliferation even in the presence of abundant extracellular serine41,56. Intriguingly, some of these tumors have evolved mechanisms such as EZH2 overexpression66 to suppress differentiation. Thus, plentiful exogenous serine may generally support tumor initiation and growth both by repressing differentiation and supporting proliferation.
A key question from our work is how SCs are able to initiate a tumor in the face of serine auxotrophy. Both normal and malignant SCs reside in proximity to the vasculature, and the perivascular niche is critical for maintaining tSC self-renewal67,68. It is therefore tempting to speculate that this niche also represents a rich nutrient source that enables tumorigenic SCs to rely on extracellular serine and suppress differentiation. Dietary Ser/Gly restriction disrupts SC maintenance, thereby establishing serine availability as a key regulator of cell fate during tumor initiation and growth. Our findings raise the possibility that targeting serine uptake may be a promising therapeutic avenue to eliminate oncogenic stem cells.
Methods
Cell culture.
Primary EpdSCs from WT and SOX2+ mice, HRasG12V transduced EpdSCs, and SCC lines were grown under standard tissue culture conditions, 37 °C and 7.5% CO2. Cells were cultured in E-low calcium (50 μM Ca2+) medium (E-low) made in house from DMEM/F12 medium supplemented with 15% chelated FBS, 5 μg/mL insulin, 5 μg/mL transferrin, 2 nM triiodothyroxine, 40 μg/mL hydrocortisone and 10 nM cholera toxin. For all experiments, cells were switched from E-low growth medium to E-low lacking pyruvate, aspartate, glutamate, and glutamine reconstituted with 4 mM glutamine, 25 mM glucose, 15% chelated dialyzed FBS (GeminiBio), and ±0.32 mM Ser/Gly (experimental E-low medium). A431 SCCs were grown in DMEM supplemented with 10% FBS and 1 mM sodium pyruvate. SCC9 SCCs were grown in E-low medium supplemented to 1.5 mM Ca2+. A mix of male and female cells were used for all studies. Independently derived littermate lines were used for comparisons. Unless noted in legends, WT-1 and SOX2–1 lines were used.
Mice.
All animal experiments were performed in the AAALAC-accredited Comparative Bioscience Center at the Rockefeller University. Experiments were in accordance with NIH guidelines for Animal Care and Use, approved and overseen by The Rockefeller University’s Institutional Animal Care and Use Committee. Rosa26-CAG-loxP-stop-loxP-Sox2-IRES-eGFP mice were donated by J. Que and maintained in a B6/svev129 mixed background. Krt14-cre(tg), Krt14-creER(tg), and Krt10-H2B-mRFP(tg) mice were maintained in a CD-1-ICR background. For analysis of WT and SOX2+ mice, a mix of males and females were used. Krt14-CreER;R26-LSL-Sox2-IRES-GFP mice were treated with 5 100 μL doses of 2% w/v tamoxifen (Sigma) beginning at P50. For tumor allografts, 6–8 week old female Nude (Nu/Nu) mice were used. For DMBA/TPA experiments, P60 female FvB mice were used.
Primary culture derivation.
P0 mice were euthanized by decapitation, backskin was dissected off and incubated in a 1:1 mix of dispase and PBS overnight at 4 °C. Epidermis was removed from the dermis and incubated in a 1:1 mix of 0.25% trypsin/EDTA and versene for 10 min at room temperature. The epidermal fraction was mechanically dissociated to a single cell suspension, filtered through a 40 μm filter and cultured in E-low medium.
Growth curves.
5000 WT, SOX2+ or HT-SCC cells were plated in triplicate into a black 96 well plate (Nunc). The next day (day 0), one plate was fixed with 4% PFA for 10 min. Remaining cells were treated with indicated medium/reagent, and at indicated times were subsequently fixed, stained with DAPI, and counted using a BioTek Cytation5. For chemical treatments, cells were pre-treated for 4 h prior to switching to control or serine/glycine (Ser/Gly)-free experimental E-low medium. For partial Ser/Gly starvation experiments, cells were cultured in medium with 17.065 mg/L serine and 12.19 mg/L glycine. Population doublings were calculated as the log2 fold change in cell number relative to day 0.
In vitro drug treatments.
Drugs were added at the following concentrations: α-ketobutyrate 1 mM, dichloroacetate 5 mM, UK-5099 500 nM, pyruvate 2 mM, lactate 2 mM, formate 1 mM, dimethyl-α-ketoglutarate 4 mM, 4 mM, eGSH 1 mM, Trolox 500 nM, GSK-J4 10 μM, GSK-343 10 μM, Nutlin-3a 10 μM.
Nutrient uptake.
150,000 WT or 300,000 SOX2+ cells were seeded into 6 well plates (Corning). The following day, medium was aspirated and replaced with 1 mL of experimental E-low medium containing Ser/Gly. At the same time, 1 mL of medium was added to a control 6 well plate lacking cells. 24 h later, media was collected and spun at max speed at 4 °C for 20 min. 50 μL of the supernatant was added to 1 mL of ice-cold 80% methanol supplemented with 2 μM deuterated 2-hydroxyglutarate (D-2-hydroxyglutaric-2,3,3,4,4-d5 acid (d5–2HG)) as an internal standard and analyzed by mass spectrometry. Glutamine consumption, glutamate secretion and lactate secretion were measured using a YSI 2950 series biochemistry analyzer (YSI Life Sciences). Metabolite consumption and secretion was determined relative to fresh medium and the values were normalized to the average protein content in each condition where indicated.
Serine standard curve.
Serine (0–20 nmol) was dissolved in 50 μL of water and mixed with ice-cold 80% methanol supplemented with d5–2HG. After overnight incubation at −20°C, the serine standards were dried in an evaporator (Genevac EZ-2 Elite), derivatized as described in GC-MS metabolite profiling and analyzed using an Agilent 7890A GC coupled to Agilent 5975C mass selective detector. A standard curve was obtained by plotting d5–2HG-normalized serine peak area against the amount serine. The linear regression equation was calculated by the least squares method using Microsoft Excel. Serine standard curve values are provided in Supplementary Table 2.
Estimation of serine synthesis.
To quantify the amount of serine consumption, the MS peaks representing serine were extracted and integrated using MassHunter software, normalized to the internal standard (d5–2HG) peak area and quantified against the serine standard curve. The calculated values were normalized to the average protein content of all wells in each condition (μmol serine/mg protein). Serine biosynthetic demand in the absence of exogenous Ser/Gly was estimated using a serine standard curve to calculate serine uptake (from Fig. 1c) in the presence of Ser/Gly and serine secretion in the absence of Ser/Gly, while intracellular glutamine availability was estimated using a YSI analyzer as glutamine consumption minus glutamate secretion. Since serine synthesis produces a mole of αKG per mole of serine, the fraction of intracellular glutamine used to meet serine biosynthetic demand approximates the fraction of glutamine used to produce αKG via this pathway. See Supplementary Tables 2 and 3 for more information.
GC-MS metabolite profiling.
For all metabolite experiments, 150,000 WT or 300,000 SOX2+ cells were seeded in 6-well plates under standard culture conditions and changed into the corresponding experimental E-low media the next day. For isotope tracing experiments, cells were cultured for 4 h in indicated experimental E-low medium reconstituted with uniformly labeled 13C-serine, glycine, glucose or glutamine (Cambridge Isotope Labs) following 16 hours of culture in experimental E-low medium with or without Ser/Gly. For serum, blood was collected from the retro-orbital sinus and allowed to clot on ice for 30 min. Samples were then spun at 1,000 g for 10 min and supernatant (serum) was collected. Metabolites were extracted with 1 mL of ice-cold 80% methanol supplemented with d5–2HG.
After overnight incubation at −80°C, cell lysates were centrifuged at 21,000 g for 20 min and protein-free supernatants were dried in an evaporator (Genevac EZ-2 Elite). Metabolites were resuspended in 50 μL of 40 mg/mL methoxyamine hydrochloride (Sigma) in pyridine (ThermoFisher) by incubation at 30°C for 2 h and further derivatized by addition of 80 μL of MSTFA (ThermoFisher) and 70 μL ethyl acetate (Sigma). After 30 min incubation at 37°C, samples were analyzed using an Agilent 7890A GC coupled to Agilent 5975C mass selective detector. The GC was run in splitless mode using constant helium gas flow at 1 mL/min. A microliter of derivatized sample was injected onto an HP-5MS column and the GC oven temperature ramped from 60°C to 290°C over 25 min.
GC-MS analysis.
Peaks representing metabolites of interest were extracted and integrated using MassHunter software (Agilent Technologies) and verified relative to known spectra for each metabolite. The following ions were used for quantification of metabolite levels: d5–2HG m/z 354; alanine, m/z 218; αKG, m/z 304; asparagine, m/z 231; aspartate, m/z 334; citrate, m/z 465; cysteine, m/z 322; fumarate, m/z 245; glutamate, m/z 363; glutamine, m/z 362; glycine, m/z 276; isoleucine, m/z 260; leucine, m/z 260; malate, m/z 335; methionine, m/z 250; phenylalanine, m/z 294; proline, m/z 216; serine m/z 306; succinate, m/z 247; threonine, m/z 320; tryptophan, m/z 405; tyrosine, m/z 382; and valine, m/z 246; pyruvate, m/z 115; lactate m/z 219. All values were normalized to both the internal standard peak area and the protein content of triplicate samples. Enrichment of 13C was determined by quantifying the abundance of the following ions: citrate, m/z 465–482; glycine, m/z 276–286; and serine, m/z 306–317. Correction for naturally occurring isotopes was performed using IsoCor software69.
NAD+/NADH ratio quantification.
The NAD+/NADH ratio was quantified using an enzymatic colorimetric Abcam kit according to manufacturer’s instructions. Briefly, cells were lysed with 450 μL NADH/NAD extraction buffer and then spun for 5 min at 4°C at maximum speed. Supernatant was filtered through a 10 kDa spin column (BioVision) and 200 μL was used for total NAD+ and NADH quantification. The remaining extract was heated at 60°C for 30 min to decompose NAD+. 50 μL of sample was mixed with 100 μL of reaction mixture and incubated for 5 min at room temperature. 10 μL of developing solution was added and the reaction was incubated for 1 h at room temperature. Absorbance was measured at 450 nm using a BioTek Cytation 5 plate reader and NAD+ and NADH amounts were calculated using a standard curve of purified NADH. The NAD+/NADH ratio was calculated as (NAD(H)total - NADH)/NADH.
Immunofluorescence and image analysis.
For immunofluorescence, skin samples were pre-fixed in 4% PFA for 1 h at 4°C and then incubated with 30% w/v sucrose overnight, embedded in Optimal Cutting Temperature (OCT) compound (Tissue Tek), and sectioned at a thickness of 12 μm. For in vitro immunofluorescence, cells were seeded into fibronectin coated glass chamber-slides (Millipore), and fixed for 10 min in 4% PFA at room temperature. Samples were blocked at room temperature in Gelatin Block (2% fish gelatin, 5% normal donkey serum, 1% bovine serum albumin, 0.3% Triton, in PBS). Samples were incubated with primary antibody overnight at 4°C, washed in PBS, and exposed to secondary antibody for 1 h at room temperature. Samples were mounted in ProLong Gold with DAPI (Life Tech) prior to imaging. The following primary antibodies and dilutions were used: GFP (chicken, 1:2000, Abcam), GFP (goat, 1:1000 VWR), K5 (guinea pig, 1:500, E. Fuchs), K10 (rabbit, 1:1000, Covance), RFP (rat, 1:1000, Chromotek), RFP (goat, 1:500, MYBioSource), K14 (rabbit, 1:1000, E. Fuchs), K14 (chicken, 1:1000, Covance), Involucrin (rabbit, 1:1000, Covance), SOX2 (rabbit, 1:300, Abcam), cleaved caspase 3 (rabbit, 1:200, Cell Signaling), integrin-α6 (rat, 1:2000, eBioscience), H3K27me3 (rabbit, 1:500, Millipore), FLAG M2 (mouse, 1:1000, Sigma), survivin (rabbit, 1:1000, Cell Signaling), CD44 (rat, 1:200, BD Bioscience), Ki-67 (rabbit, 1:200, Cell Signaling), phospho-S6 ribosomal protein (Ser235/236) (rabbit, 1:200, Cell Signaling). Secondary antibodies were conjugated to Alexa Fluor™ 488, RRX, or 647 (1:1000, Life Technologies A-11006). Phalloidin conjugated to Alexa Fluor™ 564 or 647 (165 nM working concentration, ThermoFisher) were used and stained simultaneously with secondary antibodies. Images were captured on a Zeiss Axioplan2 using a Plan-Apochromat 20x/0.8 air objective or 40x/0.8 oil immersion objective. Images were processed using ImageJ and Adobe Photoshop CS5. See Reporting Summary for antibody catalog numbers.
To quantify fluorescence in SCCs of progenitor and differentiated cell markers, tumor cells were masked on GFP (for K14, K10 and involucrin) or DAPI/H2B-mRFP (for H3K27me3) and pixel intensity was analyzed within the mask on the marker of interest. In the absence of a mask for cells of interest, fluorescence was quantified manually through ROI selection. To quantify mitotic spindle axis, a straight line was drawn between the middle of two daughter nuclei marked by survivin, and the angle between this line and the basement membrane, as stained by keratin-14, was quantified. Mitotic angles < 30° were classified as planar, and angles >30° were classified as nonplanar.
Immunohistochemistry.
All human samples were derived from commercially purchased, de-identified paraffin embedded tissue arrays (Biomax SK802b, HN803e). Arrays were baked at 60°C for 30 min and then deparaffinized by washing 2×10 times in Citrus Clearing Solvent (ThermoFisher) followed by 2×10 washes in 100% ethanol (EtOH), 1×10 wash in 95% EtOH, and 1×10 wash in 70% EtOH. Antigen retrieval was then performed in pH 6.0 Citrate (Vector Laboratories) by heating slides to 125°C for 30 s and 90°C for 10 s in a pressure cooker. Slides were stained according to VECTASTAIN® Elite® ABC Universal PLUS Kit manufacturer instructions (Vector Laboratories). Briefly, slides were permeabilized for 5 min in 0.1% TBS-T, blocked in BLOXALL peroxidase block for 10 min and horse serum for 20 min. Arrays were incubated in primary antibody (H3K27me3 rabbit, 1:500, Millipore) overnight at 4°C. The next day, slides were incubated with secondary antibody (Horse anti-mouse/rabbit IgG, biotinylated) for 30 min at room temperature. Slides were incubated in VECTASTAIN Elite ABC Reagent for 30 min at room temperature, and then in a 1:1 mixture of ImPACT® DAB EqV Reagent 1 (Chromogen) and Reagent 2 (Diluent) for 2 min. After development, slides were incubated in hematoxylin (Sigma) for 1 min, washed 3x in water, washed 1x in acid alcohol (1% HCl in 95% EtOH), washed 3x in water, washed 1x in Bluing Reagent (Fisher), washed 1x in water, and then dehydrated by washing 10× 70% EtOH, 10× 95% EtOH, 2×10 100% EtOH, 2×10 Citrus Clearing Solvent. Slides were mounted with Cytoseal 60 (ThermoFisher). Images were captured using a BioTek Cytation 5 using a 4x or 20x air objective. See Reporting Summary for antibody catalog numbers.
To score arrays for H3K27me3 intensity, investigators were blinded to tumor stage, lineage and anatomic location. Within a tissue core, lymphocytes were used as an internal control for high H3K27me3 staining. Staining intensity within tumor cells was scored “high” if intensity was at least ~70% as intense as lymphocytes, “moderate” if intensity was ~30–70% as intense as lymphocytes, or “weak” if staining was <30% as intense as lymphocytes. After scoring, investigators were unblinded to bin scoring results based on histopathological grade. Images were processed in ImageJ and Photoshop.
Hematoxylin & eosin.
Slides were washed in water, incubated in hematoxylin for 2 min, washed in water 3x, washed once in acid alcohol, washed twice in water, washed once in Bluing reagent, and washed once in water. Slides were subsequently dehydrated with 10 washes each in subsequent 80%, 95% and 100% EtOH, followed by eosin staining for 1 minute, 2 × 20x washes in 100% EtOH and 2 × 20x washes in Citrus Clearing Solvent. Slides were mounted with Cytoseal 60 and imaged on a Zeiss Axioplan2 using a Plan-Apochromat 20x/0.8 air objective. Images were processed in ImageJ and Photoshop.
Western Blot.
Triplicate wells were lysed in chilled RIPA buffer containing cOmplete protease inhibitors and PhoSTOP phosphatase inhibitors (Roche). Protein was quantified using a Pearce BCA protein quantification kit. 15 μg of protein was loaded for SDS-PAGE and standard western blotting procedures. For histone extraction, 1 × 10⁶ cells were suspended in Laemmli buffer and sonicated 15X, 30 s on/off. β-mercaptoethanol and bromophenol blue were added, samples were boiled, and 6 μL was loaded for standard western blotting procedures. Membranes were blocked in LiCOR blocking buffer. Membranes were incubated in primary antibody overnight in blocking buffer with 0.2% Tween-20 at 4°C, and incubated in secondary antibody diluted in blocking buffer with 0.2% Tween-20 and 0.01% SDS for 1 h at room temperature. The following primary antibodies and dilutions were used: PHGDH (rabbit, 1:2000, Sigma), PSAT1 (mouse, 1:500, Sigma) PSPH (rabbit, 1:500, Sigma), SHMT1 (rabbit, 1:1000, Cell Signaling), SHMT2 (rabbit, 1:1000, Cell Signaling), OGDH (rabbit, 1:1000, ProteinTech), SDH-A (mouse, 1:1000, abcam), H3K27me3 (rabbit, 1:1000, Millipore), α-tubulin (mouse, 1:10000, Sigma), total H3 (mouse, 1:10000, abcam), β-actin (rabbit, 1:1000, Cell Signaling), phospho-p70 S6 Kinase (Thr389) (rabbit, 1:1000, Cell Signaling), p70 S6 Kinase (rabbit, 1:1000, Cell Signaling), p53 (rabbit, 1:500, Leica Biosystems). The following LiCOR secondary antibodies were used, all at 1:10000: IRDye 800CW donkey anti-mouse IgG, IRDye 800CW donkey anti-rabbit IgG, IRDye 680 LT donkey anti-mouse IgG, IRDye 680LT donkey anti-rabbit IgG. Membranes were imaged via fluorescence on an Odyssey CLx Imager and processed using Adobe Photoshop CS5. See Reporting Summary for antibody catalog numbers.
qRT-PCR.
Triplicate wells were lysed in 200 μL TRIzol. RNA was extracted using a Zymo Direct-zol RNA miniprep kit, and 100 ng of RNA was used for cDNA synthesis with a SuperScript VILO cDNA synthesis kit (ThermoFisher). cDNA was diluted 1:5 for qPCR. cDNAs were mixed with indicated gene-specific primers listed in Supplementary Table 7 and SYBR green PCR Master Mix (Sigma), and qRT-PCR was performed on an Applied Biosystems 7900HT Fast Real-Time PCR system. Values were normalized to expression of β-actin. Primer sequences are provided in Supplementary Table 7.
EdU incorporation.
Mice were treated with 0.02 CC of 5 mg/mL EdU for 1 hour prior to sacrifice. EdU staining was performed following incubation of slides with secondary antibody. AF-647 azide, copper sulfate and EdU additive buffer and reaction buffers (Life Technology) were added to slides. Slides were incubated for 20 min at room temperature, washed and mounted for imaging.
Tumor allograft, xenograft and growth curves.
200,000 mouse (HRasG12V;Tgbr2 cKO) or human (SCC9, or A431) SCC cells diluted 1:1 in growth factor-reduced, phenol red-free Matrigel (Corning) were injected intradermally into the backs of Nude mice. For shSdha and shOgdh experiments, mice were treated with 100 mg/L doxycycline and 2% w/v sucrose in drinking water starting 5 days after grafting. For GSK-J4 treatment, mice were treated daily for five days intraperitoneally with 10 mg/kg GSK-J4, beginning 5 days after grafting. For rapamycin treatment, mice were treated daily for five days intraperitoneally with 4 mg/kg rapamycin, beginning 5 days after grafting. Tumors were measured at indicated time points. Tumor size was measured using a digital caliper, and volume was calculated using the formula (π(length × width)2)/6.
Serine/glycine free diet.
Purified control amino acid diet (5CC7) and diet lacking serine and glycine (5BJX) (WF Fisher and Sons) were formulated as previously described25,26. Mice were maintained on diets for at least two weeks prior to initiating experiments. Pregnant females were placed on diet on the day of plug.
DMBA/TPA two step chemical carcinogenesis protocol.
P60 female WT FvB mice were placed on control or serine/glycine free diet. Two weeks later, mice were treated topically with a single 100 μL dose of 400 nmol DMBA (Sigma) diluted in acetone. Beginning the following week, mice were treated 2x/week topically with 100 μL of 20 nmol TPA (Sigma) diluted in ethanol and monitored for tumors.
CRISPR/Cas9 editing of SCC cells.
Guide RNA (gRNA) targeting the second and fourth exons of Phgdh were designed using GuideScan software70. Synthetic gRNAs, negative control gRNA, Atto550-trRNA, and recombinant Cas9 were purchased from IDTdna. gRNA:trRNA:Cas9 complexes were assembled and transfected into SCC cells following manufacturers protocol (IDTdna.com: Cationic lipid delivery of CRISPR ribonucleoprotein complexes into mammalian cells) using RNAiMAX (ThermoFisher) reagent as the transfection reagent. 48 h post transfection single GFP+/Atto550+/DAPI- cells were sorted into 96 well plates and allowed to grow into clonal cell lines. To screen cells for Phgdh knockout, genomic DNA was isolated from each clone. Short PCR amplicons including the gRNA target region were generated, barcoded, sequenced in a multiplex fashion on an Illumina MiSeq Nano using a modified version of the 16S metagenomics sequencing library preparation protocol from illumima. Knockout was confirmed by western blot. sgRNA sequences are provided in Supplementary Table 6.
shRNA mediated knockdown and viral infection.
Following Phgdh hairpin screening via transient transfection, efficient hairpins were subcloned into pLKO-H2B-mRFP1 vectors. shOgdh and shSdha hairpins were packaged into LT3-GEPIR doxycycline inducible vectors47 (donated by S. Lowe) and validated following culture of cells in 1 μg/mL doxycycline hyclate (Sigma) for 24 h. For LbNOX expression, LbNOX-Flag (Addgene #75285) was amplified and subcloned with an N-terminal P2A site into pLKO-H2B-mRFP1. Vectors were packaged into lentivirus using calcium chloride transfection of 293TN cells (Invitrogen) with packaging plasmids pMD2.G and pPAX2 (Addgene #12259 and #12260, respectively). Viral supernatant was collected 46 h after transfection and filtered through a 0.45 μm filter. Cells were then transduced and two days later were purified using fluorescence associated cell sorting (FACS) based on mRFP1 expression. For shRenilla, shOgdh, and shSdha lines, infected cells were selected using 1 μg/mL puromycin for 24 h. shRNA sequences are provided in Supplementary Table 5.
Statistics and Reproducibility
Statistical analyses were performed using Prism 7 and 8 (Graphpad) software. All in vitro experiments shown were repeated at least twice in triplicate with similar results, and representative data are shown unless otherwise indicated. All in vivo experiments were repeated in at least three biological replicates with similar results. Unpaired two-tailed Student’s t-tests were used to ascertain statistical significance between two groups. One-way ANOVA was used to assess statistical significance between three or more groups with one experimental parameter, while two-way ANOVA was used to assess statistical significance between groups with two experimental parameters. See Fig. legends for more information on statistical tests. Mice were randomly allocated to control or experimental conditions. Experimenters were not blinded to conditions during data collection or analysis, except for scoring of H3K27me3 staining by IHC, where investigators were blinded to tumor histological grade.
Data availability.
Source data for Figs. 1–7 and Extended Data Figs. 1–10 are provided with the paper. All data supporting the findings are available upon reasonable request. All materials are available upon completion of a material transfers agreement. Comments and requests for materials and data should be addressed to E.F. (fuchslb@rockefeller.edu) and L.W.S.F. (finleyl@mskcc.org).
Extended Data
Extended Data Fig. 1. Pre-malignant EpdSCs are serine auxotrophs.
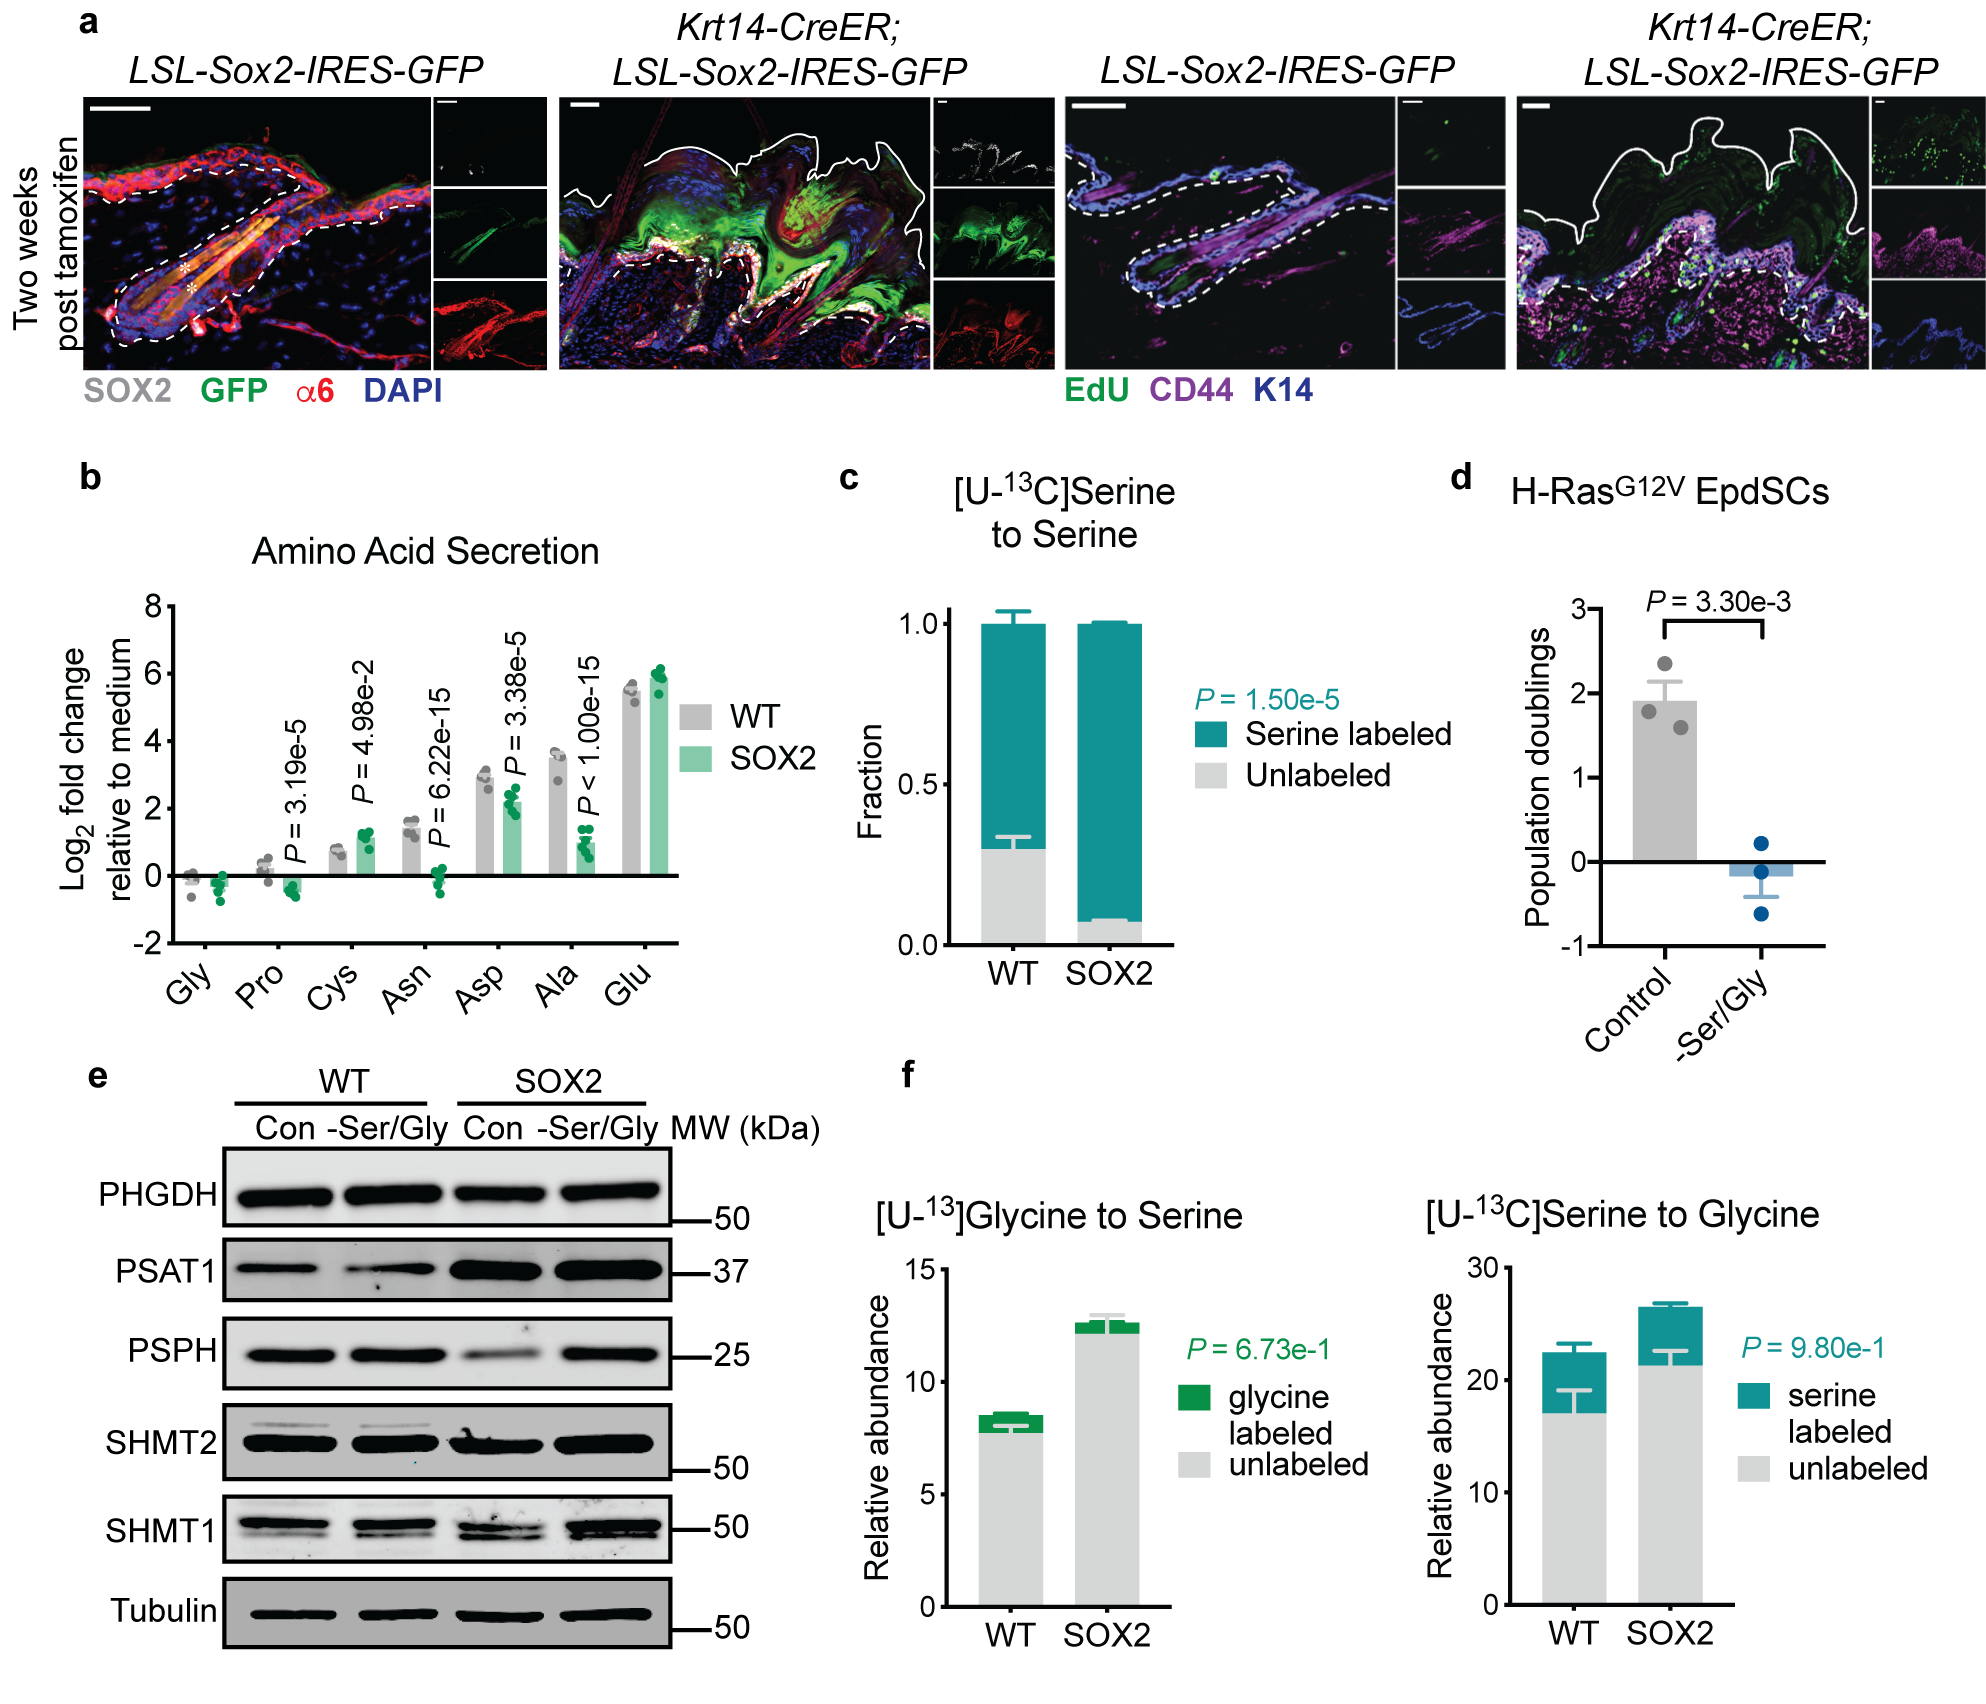
a. Representative immunofluorescence of progenitor markers α6 and K14 and tumor SC markers CD44 and SOX2 in K14-CreER;SOX2+ pre-tumorigenic lesions in second telogen mice two weeks after tamoxifen administration. Three mice per genotype were analyzed with similar results. Scale bars = 50 μm. b, Relative levels of amino acids from conditioned medium relative to unconditioned medium measured by GC-MS (n=6 biologically independent samples). Data are mean ±SEM. c, Fractional labeling of intracellular serine from [U-13C]serine (n=3 biologically independent samples). Data are mean ±SD. d, Population doublings of H-RasG12V-expressing pre-malignant keratinocytes following 48 h of Ser/Gly starvation (n=3 biologically independent samples). Data are mean ±SD. e, Immunoblot of serine synthesis enzymes in WT and SOX2+ cells following 24 h of culture in control or Ser/Gly-free medium. See Supplementary Table 1 for quantification of immunoblot from triplicate independent experiments. f, Labeling of intracellular serine from [U-13C]glycine (left) and intracellular glycine from [U-13C]serine (right) (n=3 biologically independent samples). Data are mean ±SD. Statistical significance was determined using a two-way ANOVA with Sidak’s multiple comparison test for panels b, c, and f, and an unpaired two-tailed student’s t-test for panel d. Scanned images of unprocessed blots are shown in Source Data Extended Fig. 1. Numerical data are provided in Statistics Source Data Extended Fig. 1.
Extended Data Fig. 2. NAD+ regeneration regulates serine auxotrophy.
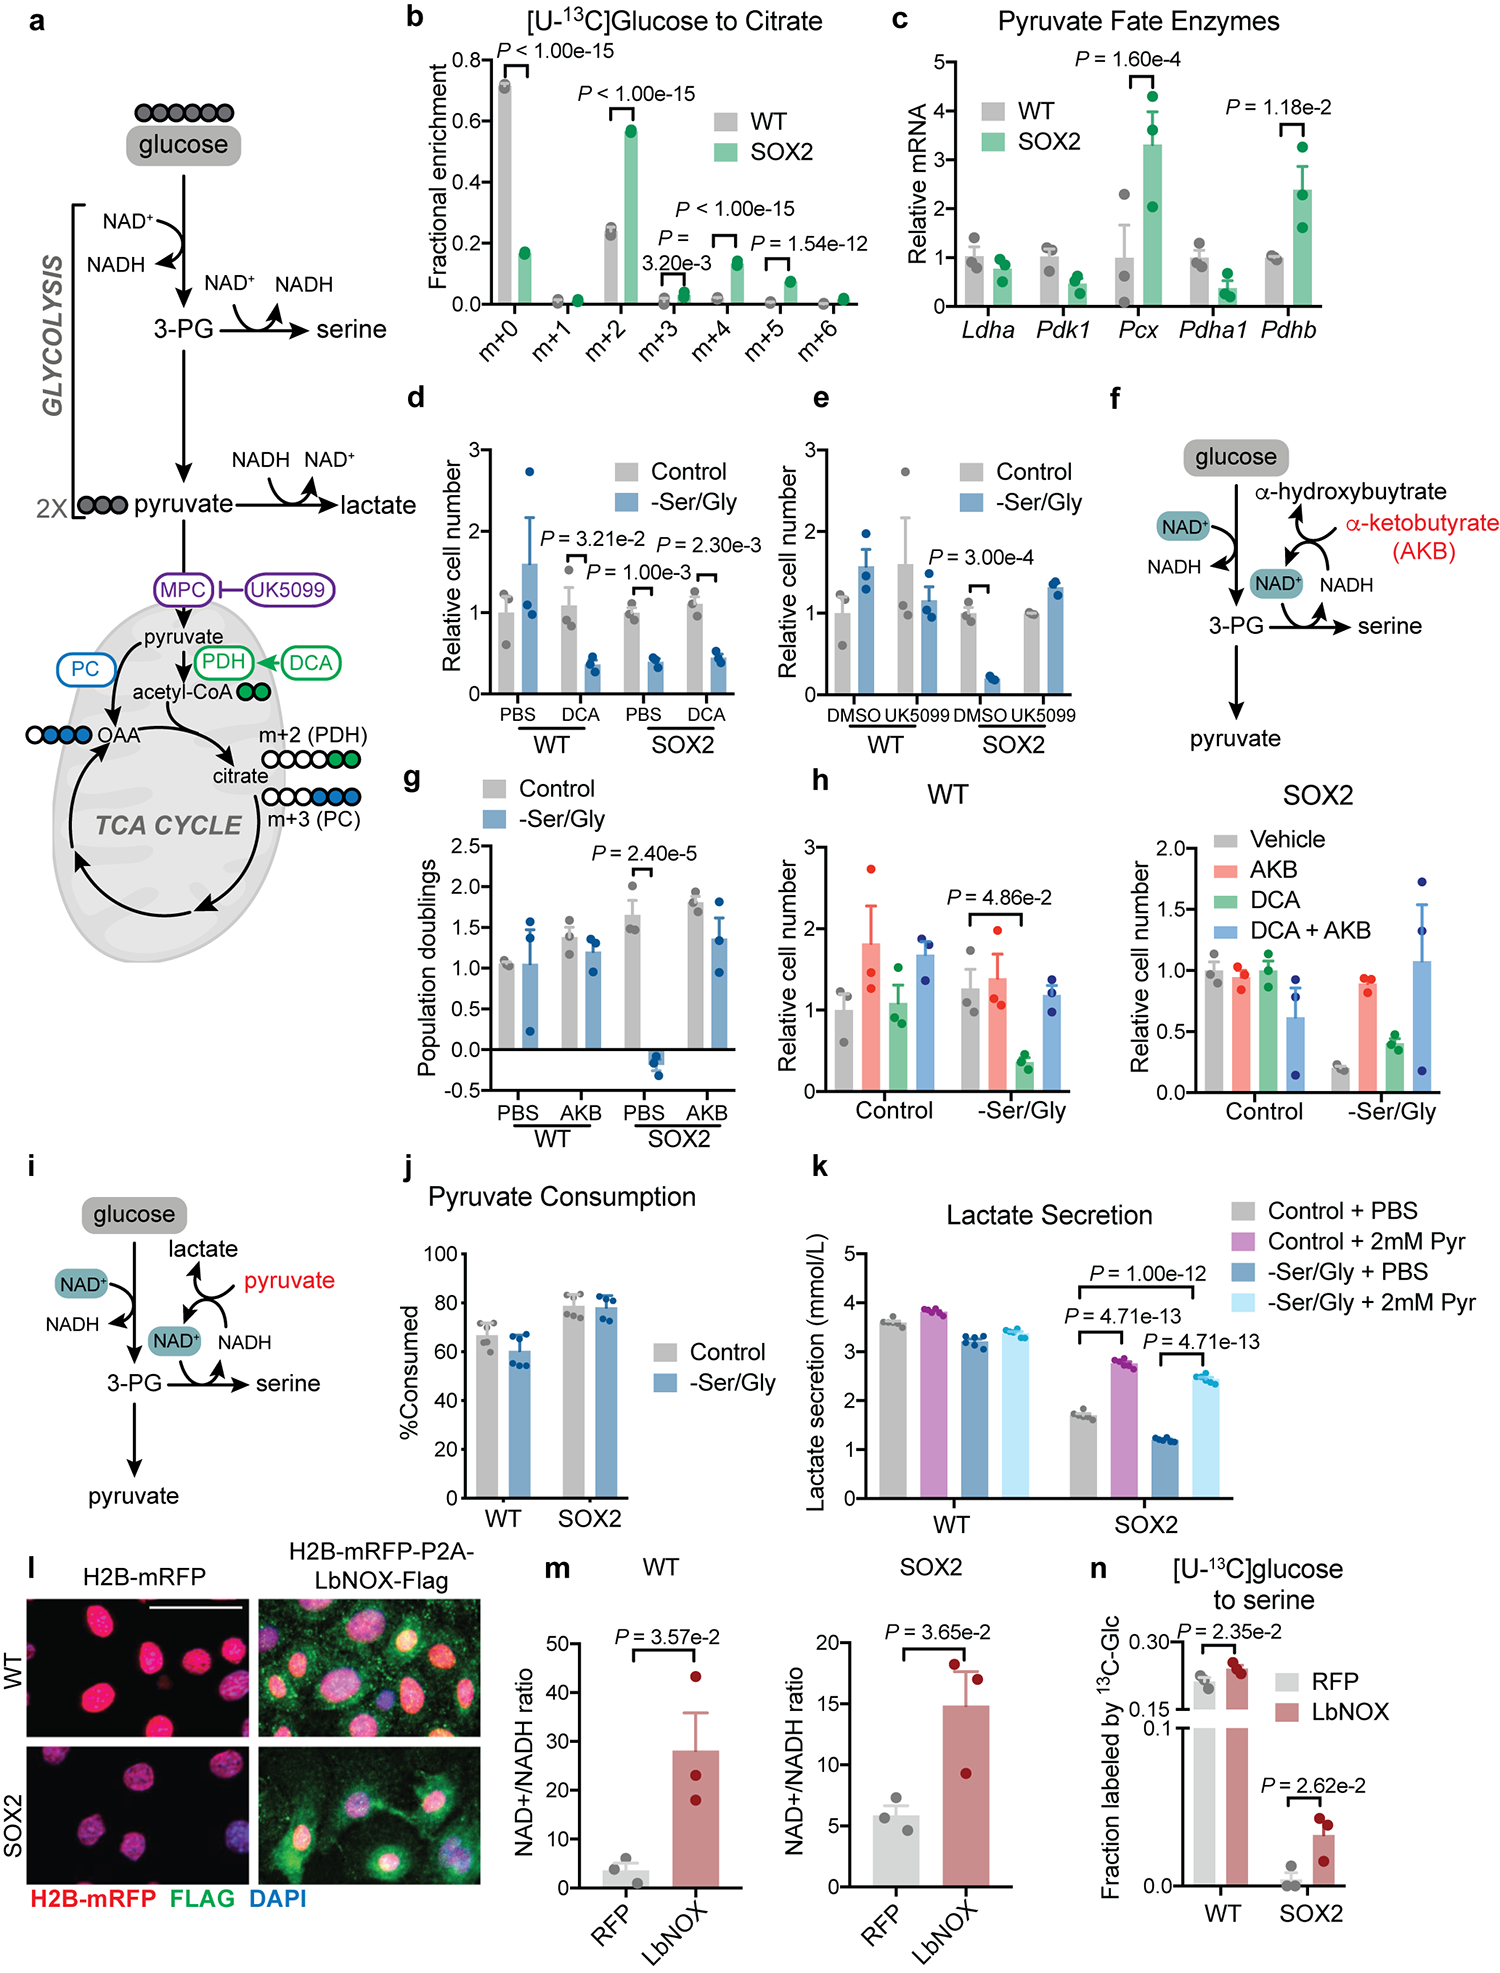
a, Schematic of glucose metabolism via glycolysis and the TCA cycle, including associated inhibitors. b, Isotopologues of citrate formed from [U-13C]glucose (n=3 biologically independent samples). Data are mean ±SD. M+0 represents the fraction of citrate not labeled by glucose-derived carbons. Heavier isotopologues are formed when glucose is used to generate citrate through either PDH (M+2) or PC (M+3). Higher weight isotopologues are derived from successive turns around the TCA cycle. c, RT-qPCR for pyruvate metabolism genes (n=3 independent experiments). Data are mean ±SEM. d-e, Relative cell number with dichloroacetate (DCA) (n=3 biologically independent samples) (d) or UK-5099 (n=3 biologically independent samples) (e). Data are mean ±SD. f, Mechanism of action of α-ketobutyrate (AKB). g, Proliferation with AKB (n=3 biologically independent samples). Data are mean ±SD. h, Relative cell number with indicated compounds (n=3). Data are mean ±SEM. i, Schematic of pyruvate mechanism of action. j, Percentage of pyruvate consumed after 24 h (n=5 for SOX2+ –Ser/Gly, otherwise n=6 biologically independent samples). Data are mean ±SEM. k, 24 hr lactate secretion into medium (n=6 biologically independent samples). Data are mean ±SEM. l, Representative immunofluorescence of transduced EpdSCs, performed in triplicate independent experiments with similar results. m, Quantification of the whole cell NAD+/NADH ratio (n=3 biologically independent samples). Data are mean ±SEM. n, [U-13C]glucose labeling of serine following 16 h of Ser/Gly starvation (n=3 biologically independent samples). Data are mean ±SEM. Scale bars = 10 μm. Statistical significance was determined using an unpaired two-tailed student’s t-test for panels m, an unpaired two-tailed student’s t-test using the Holm-Sidak method for multiple comparisons in panels d, e and n, a two-way ANOVA with Sidak’s multiple comparison test for panels b, c, g and k, and Dunnett’s multiple comparison test for panel h. Numerical data are provided in Statistics Source Data Extended Fig. 2.
Extended Data Fig. 3. Effects of serine starvation on epidermal growth and differentiation.
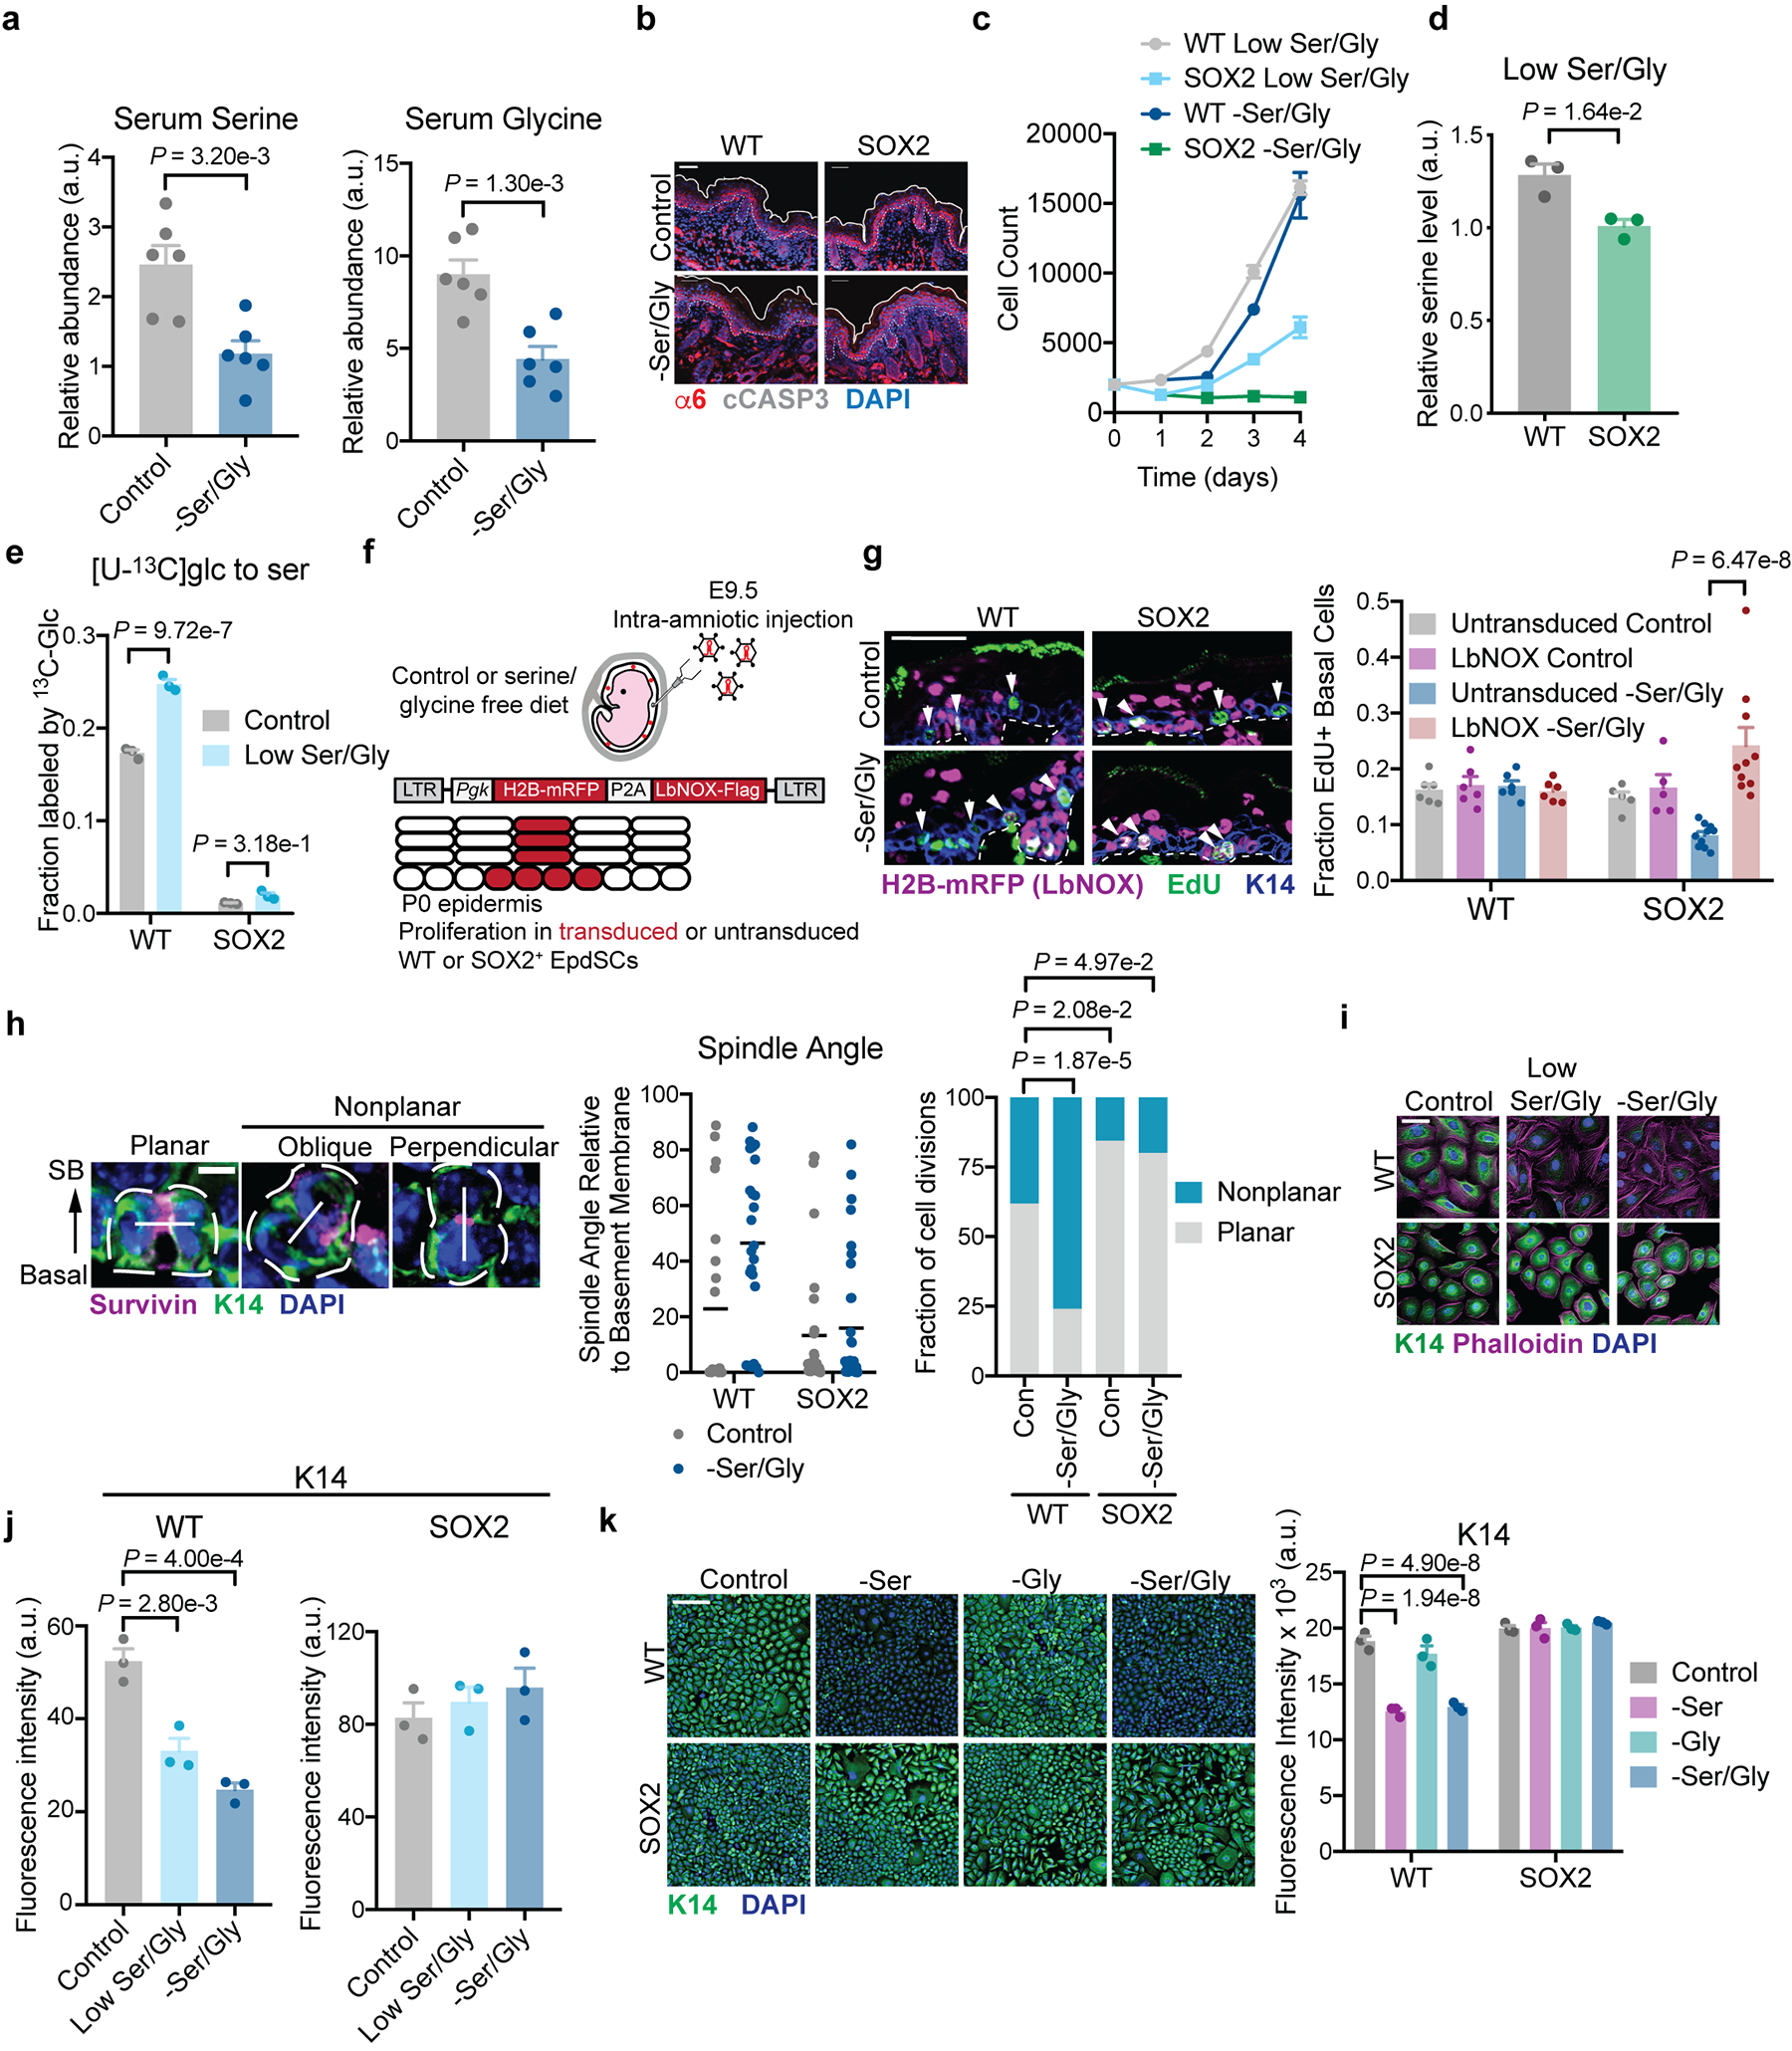
a, Serum serine and glycine in female mice maintained on indicated chow for 2 weeks (n=6 mice per condition). Data are mean ±SD. b, Representative immunofluorescence of cleaved caspase 3 in P0 WT and SOX2+ mice. Analysis was performed on 3 mice/condition with similar results. c, Growth curve in indicated media (n=3 biologically independent samples). d-e, Intracellular serine pools (d) and 4-hr fractional labeling from glucose (e) following 24 h of low Ser/Gly culture (n=3 biologically independent samples). f, Schematic of in vivo LbNOX expression experiment. g, Proliferation in P0 mice on control or Ser/Gly-free diet (n=6 WT control, 5 WT –Ser/Gly, 6 SOX2+ control, 10 SOX2+ –Ser/Gly mice). h, Immunofluorescence of cell division classes based on Survivin staining (left), quantification of spindle angle relative to the basement membrane in P0 WT and SOX2+ SCs on control or Ser/Gly-free diet (middle, data are mean), and binning of spindle axes in WT control (n=21 mitoses), WT –Ser/Gly (n=25 mitoses), SOX2+ control (n=32 mitoses) and SOX2+ -Ser/Gly (n=35 mitoses) (right). Mitoses were counted across three animals per condition. Scale bar = 5 μm. SB = suprabasal. i-j, Immunofluorescence (i) and quantification (j) of K14 in indicated media (n=3 independent experiments). Scale bar = 50 μm k, Immunofluorescence of K14 in indicated media (n=3 independent experiments). Scale bar = 50 μm. Unless indicated all data are mean ±SEM. Statistical analysis was performed by an unpaired two-tailed student’s t-test for panels a and d, a two-way ANOVA with Sidak’s multiple comparison test for panels e and g and Tukey’s multiple comparison test in panel k, a parts of whole Chi-Square analysis in panel h, and a one-way ANOVA with Tukey’s multiple comparison test in panel j. Numerical data are provided in Statistics Source Data Extended Fig. 3.
Extended Data Fig. 4. Serine synthesis promotes differentiation.
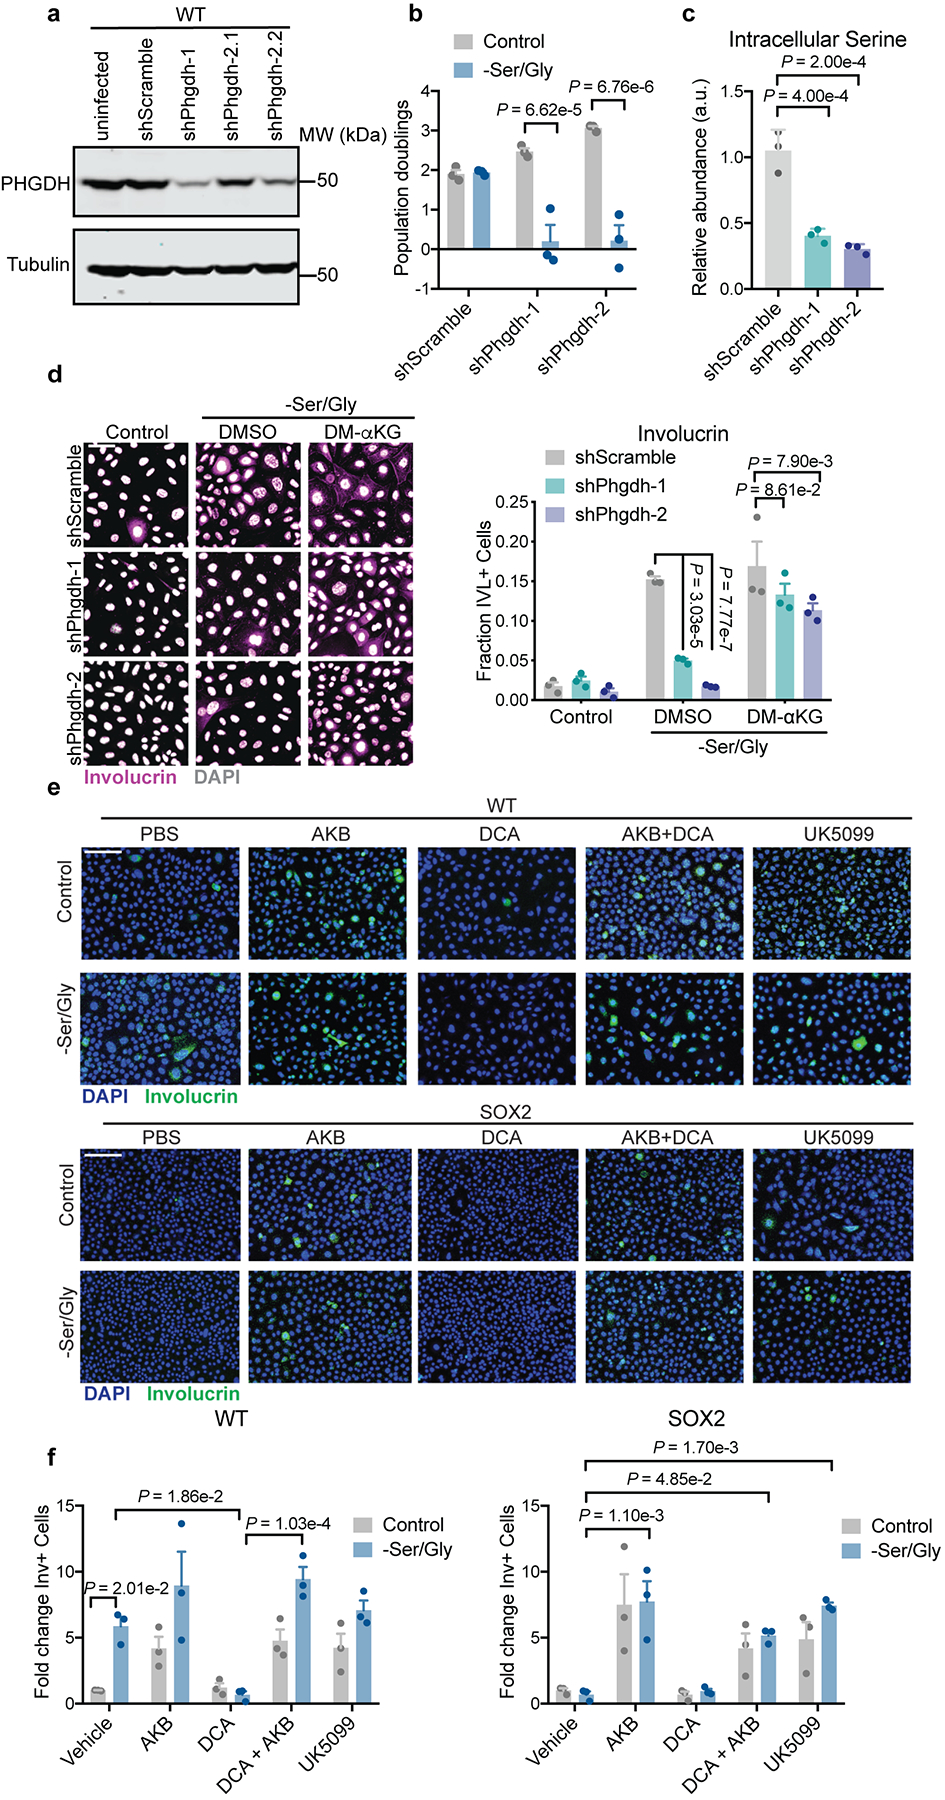
a, Western blot of Phgdh knockdown in WT EpdSCs. shPhgdh2.1 and shPhgdh2.2 represent independent transductions with same shRNA and in subsequent experiments, shPhgdh2.2 is referred to as shPhgdh2. Experiment was performed twice with similar results. shRNA sequences can be found in Supplementary Table 5. b, 48 hour population doublings of shPhgdh WT cells (n=3 biologically independent samples). Data are mean ±SEM. c, Intracellular serine pools upon Ser/Gly starvation (n=3 biologically independent samples). Data are mean ±SEM. d, Involucrin immunofluorescence in shPhgdh lines cultured with DMSO or DM-αKG following 24 hours of Ser/Gly starvation (n=3 independent experiments). Data are mean ±SEM. e-f, Representative immunofluorescence (e) and quantification (f) of Involucrin in indicated conditions (n=3 independent experiments). Data are mean ±SEM. Statistical significance was determined using a two-way ANOVA with Sidak’s multiple comparison test in panels b and f, Tukey’s multiple comparison test in panel d, and an ordinary one-way ANOVA with Dunnett’s multiple comparison test in panel c. Scanned images of unprocessed blots are shown in Source Data Extended Fig. 4. Numerical data are provided in Statistics Source Data Extended Fig. 4.
Extended Data Fig. 5. Glucose-derived serine synthesis supports the TCA cycle and αKG-driven differentiation.
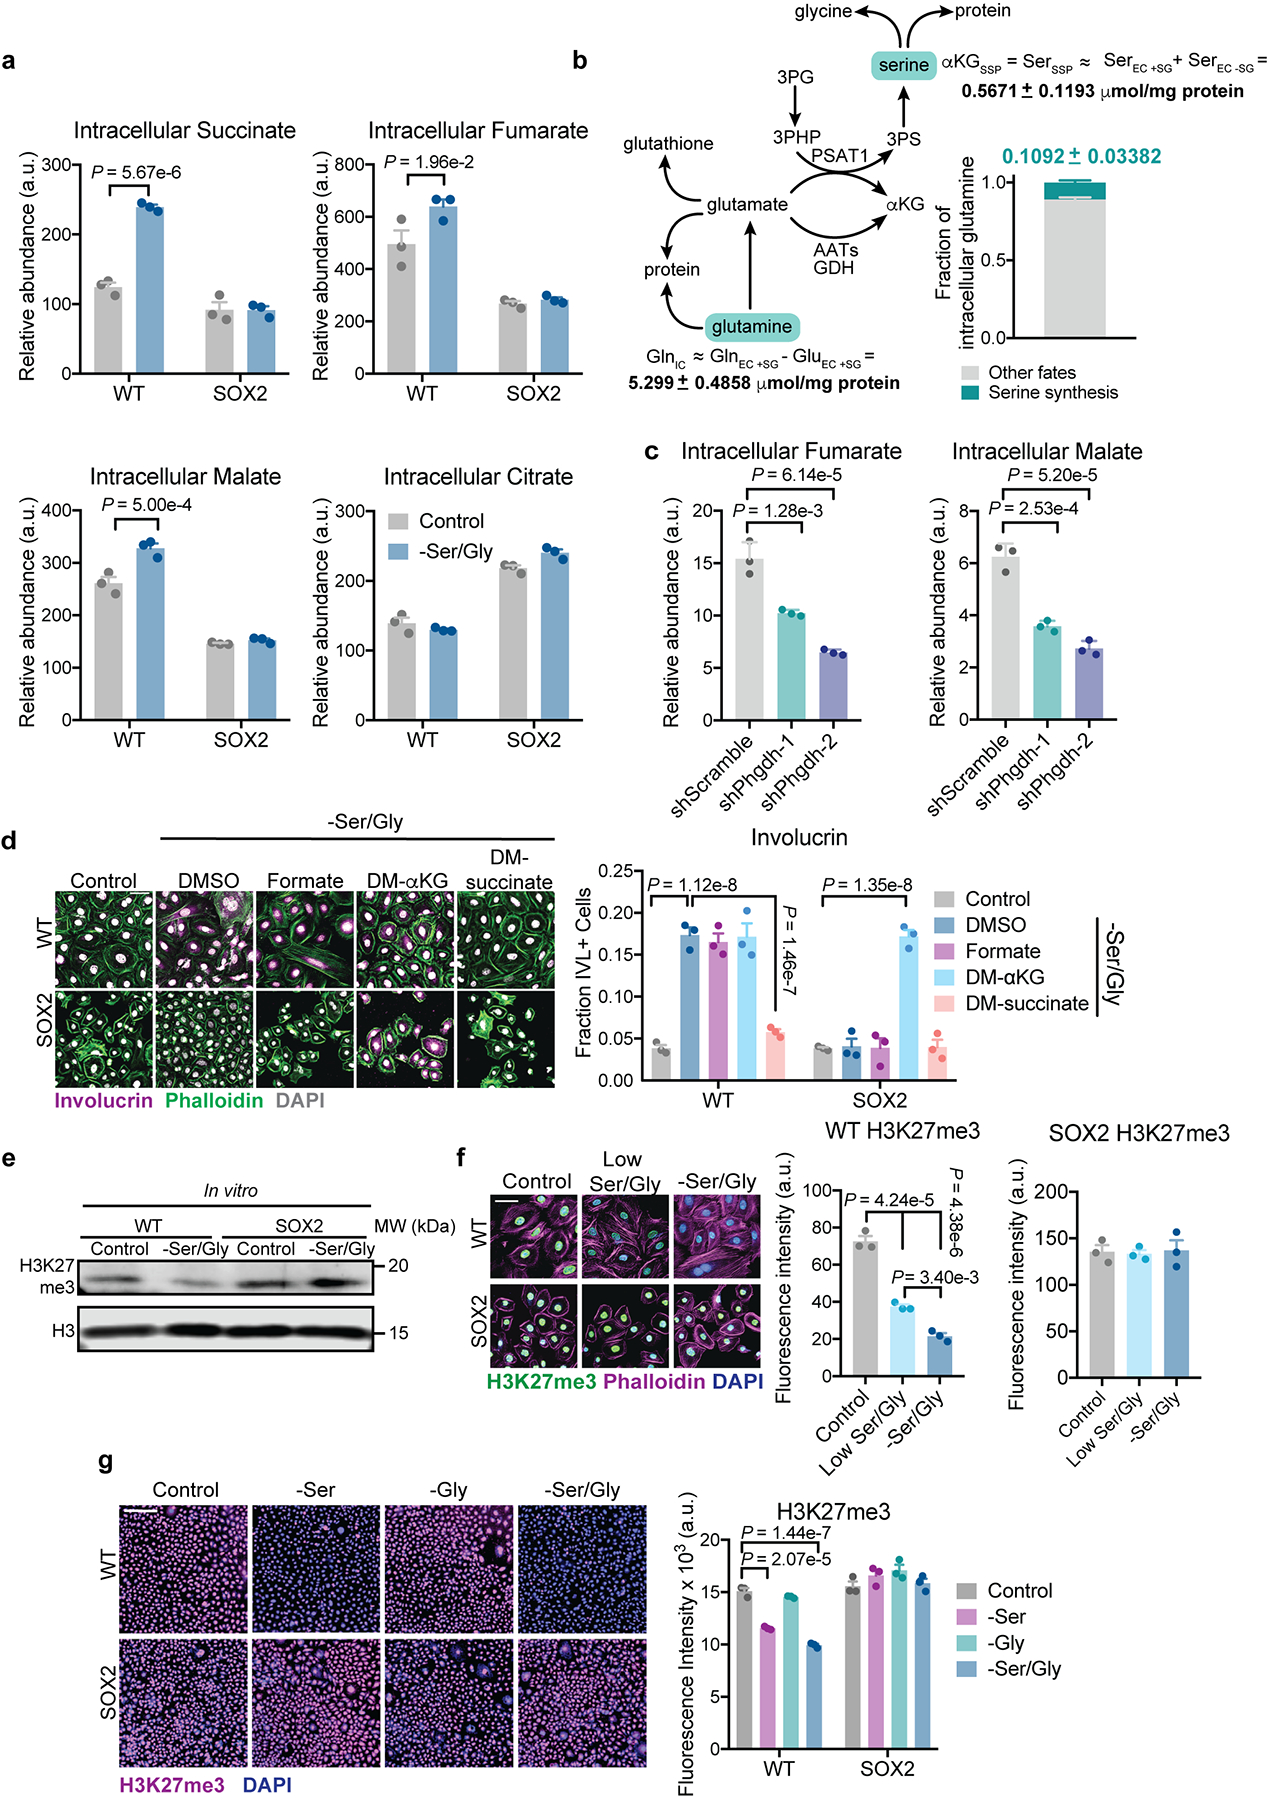
a, Metabolite pools following 16 h of Ser/Gly starvation (n=3 biologically independent samples). Data are mean ±SEM. b, Estimation of serine synthesis contribution to αKG pools (n=6 biologically independent samples, serine uptake data from Fig. 1c) See Methods and Supplementary Tables 2 and 3 for more information. αKGSSP = αKG produced from SSP; SerSSP = serine produced from SSP; SerEC +SG = serine consumed in the presence of extracellular Ser/Gly; SerEC –SG = serine secreted in the absence of extracellular Ser/Gly; GlnIC = available intracellular glutamine pool; GlnEC +SG = glutamine consumed in the presence of extracellular Ser/Gly; GluEC +SG = glutamate secreted in the presence of extracellular Ser/Gly. Data are mean ±SEM. c, Intracellular fumarate and malate in WT EpdSCs expressing indicated hairpins following 16 h Ser/Gly deprivation (n=3 biologically independent samples). Data are mean ±SEM. d, Involucrin staining in cells supplemented with 1 mM formate, 4 mM DM-αKG or 4 mM DM-succinate (n=3 independent experiments). Data are mean ±SEM. e, Representative immunoblot for H3K27me3 levels. See Supplementary Table 4 for quantification of immunoblot in triplicate independent experiments. f, Immunofluorescence for H3K27me3 upon culture in low Ser/Gly or Ser/Gly-free medium (n=3 independent experiments). Data are mean ±SEM. g, Immunofluorescence for H3K27me3 upon culture in serine free, glycine free, or Ser/Gly-free medium (n=3 independent experiments). Data are mean ±SEM. Statistical significance was determined using a two-way ANOVA with Sidak’s multiple comparison test for panel a, with Tukey’s multiple comparison test for panel d and g, and an ordinary one-way ANOVA with Tukey’s multiple comparison test for panels c and f. Scanned images of unprocessed blots are shown in Source Data Extended Fig. 5. Numerical data are provided in Statistics Source Data Extended Fig. 5.
Extended Data Fig. 6. Role of ROS, p53 and mTORC1 signaling in serine starvation response.
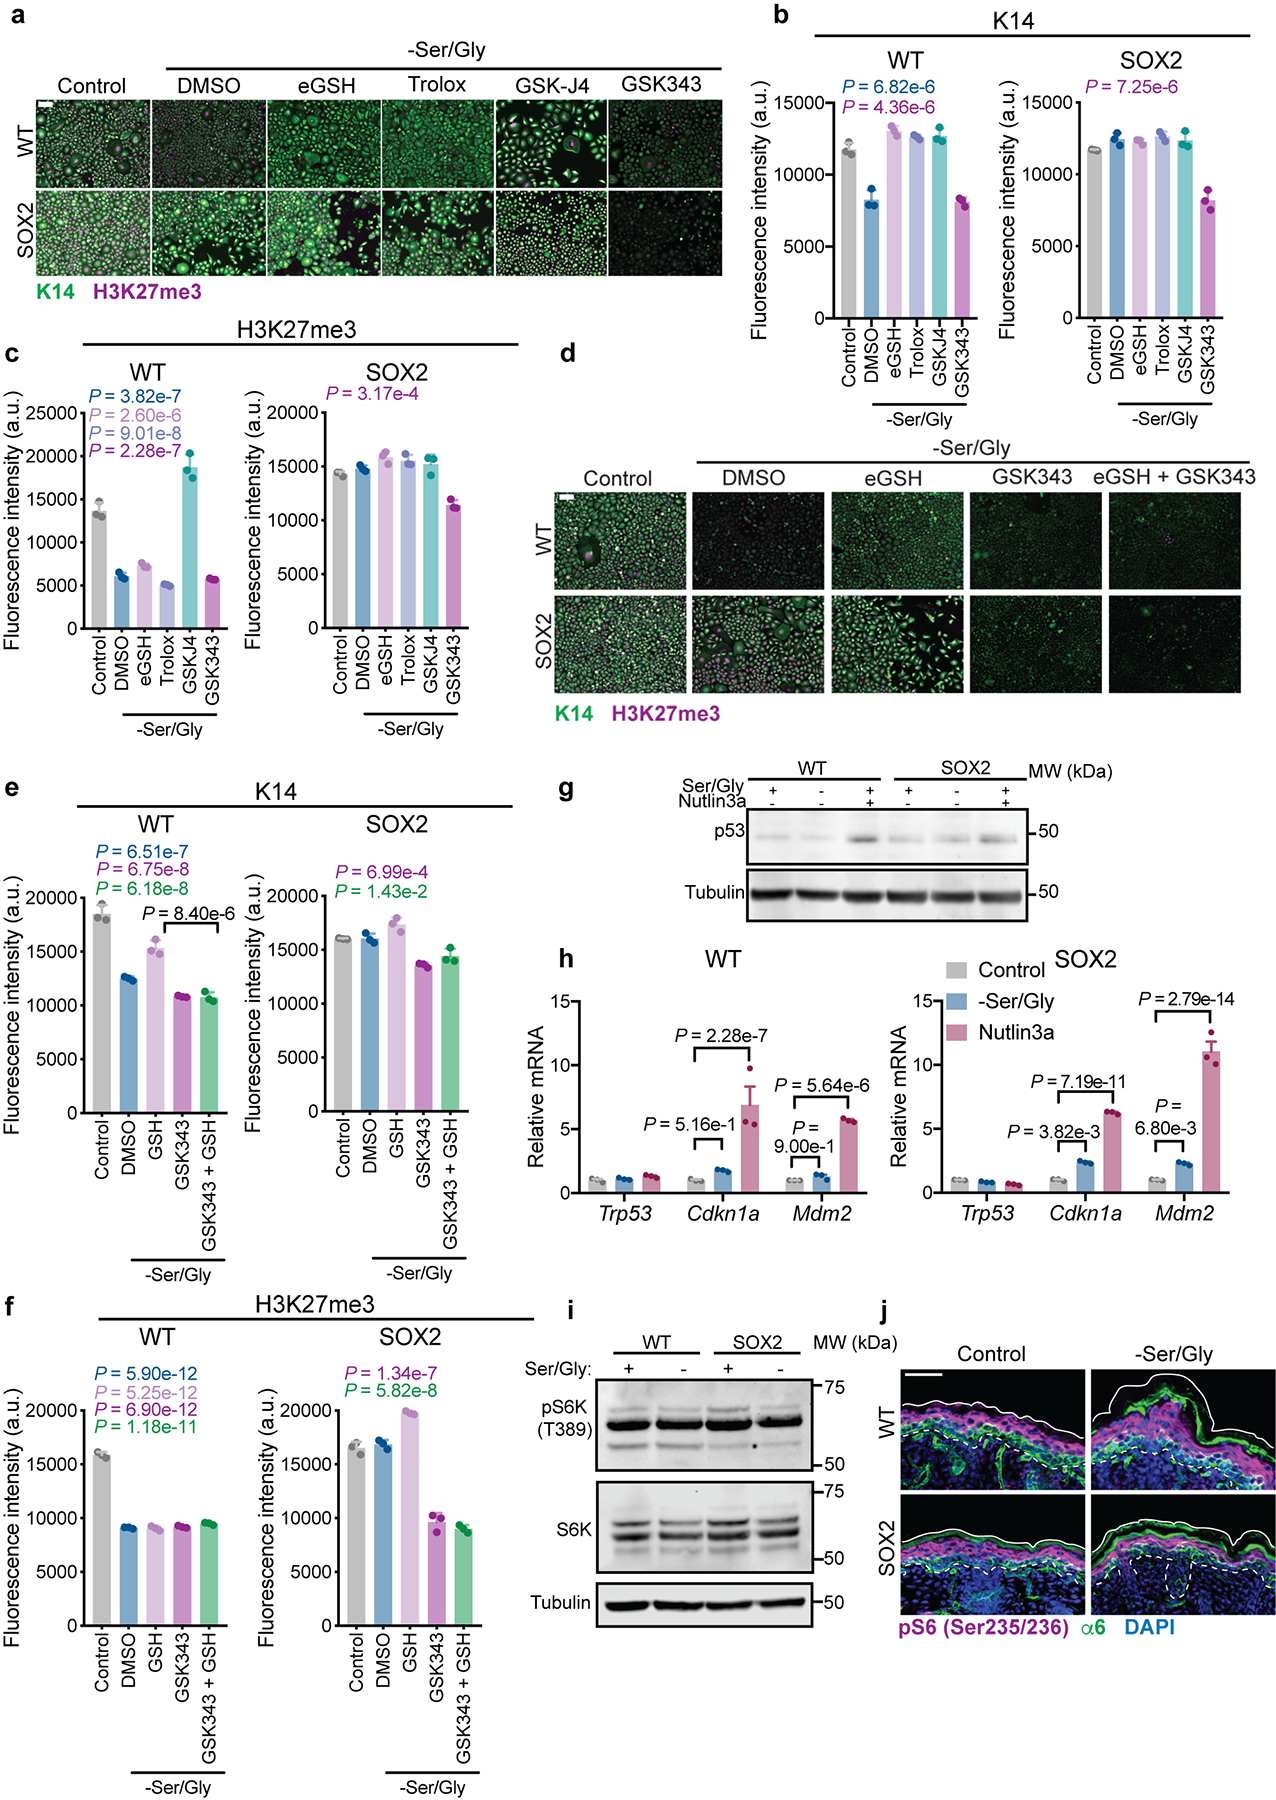
a-c, Representative immunofluorescence (a) and quantification of K14 (b) and H3K27me3 (c) in WT and SOX2+ cells cultured with cell-permeable esterified reduced glutathione (eGSH), the antioxidant Trolox, the JMJD3 inhibitor GSK-J4, or the EZH2 inhibitor GSK343, performed in triplicate. (n = 3 independent experiments). d-f, Representative immunofluorescence (d) and quantification of K14 (e) and H3K27me3 (f) in WT and SOX2+ cells in indicated conditions, (n = 3 independent experiments). g, Representative immunoblot of p53 stabilization upon 24 h Ser/Gly starvation or treatment with 10 μM of the MDM2 inhibitor Nutlin-3a, performed in duplicate. Experiment was performed in triplicate with similar results. h, RT-qPCR for expression of canonical p53 target genes (n=3 independent experiments). i, Representative immunoblot for phosphorylation of the mTORC1 target S6K following 24 h Ser/Gly starvation, performed in duplicate. Experiment was performed in triplicate with similar results. j, S6 phosphorylation in P0 mice on a control or Ser/Gly-free diet (n = 3 animals analyzed per condition). Scale bar = 50 μm. All data are mean ±SEM. Statistical significance was determined using an ordinary one-way ANOVA with Tukey’s multiple comparison test for panels b, c, e and f (P-values are relative to control) and a two-way ANOVA with Sidak’s multiple comparison test for panel h. Scanned images of unprocessed blots are shown in Source Data Extended Fig. 6. Numerical data are provided in Statistics Source Data Extended Fig. 6.
Extended Data Fig. 7. Mouse SCCs are sensitive to Ser/Gly starvation in vivo.
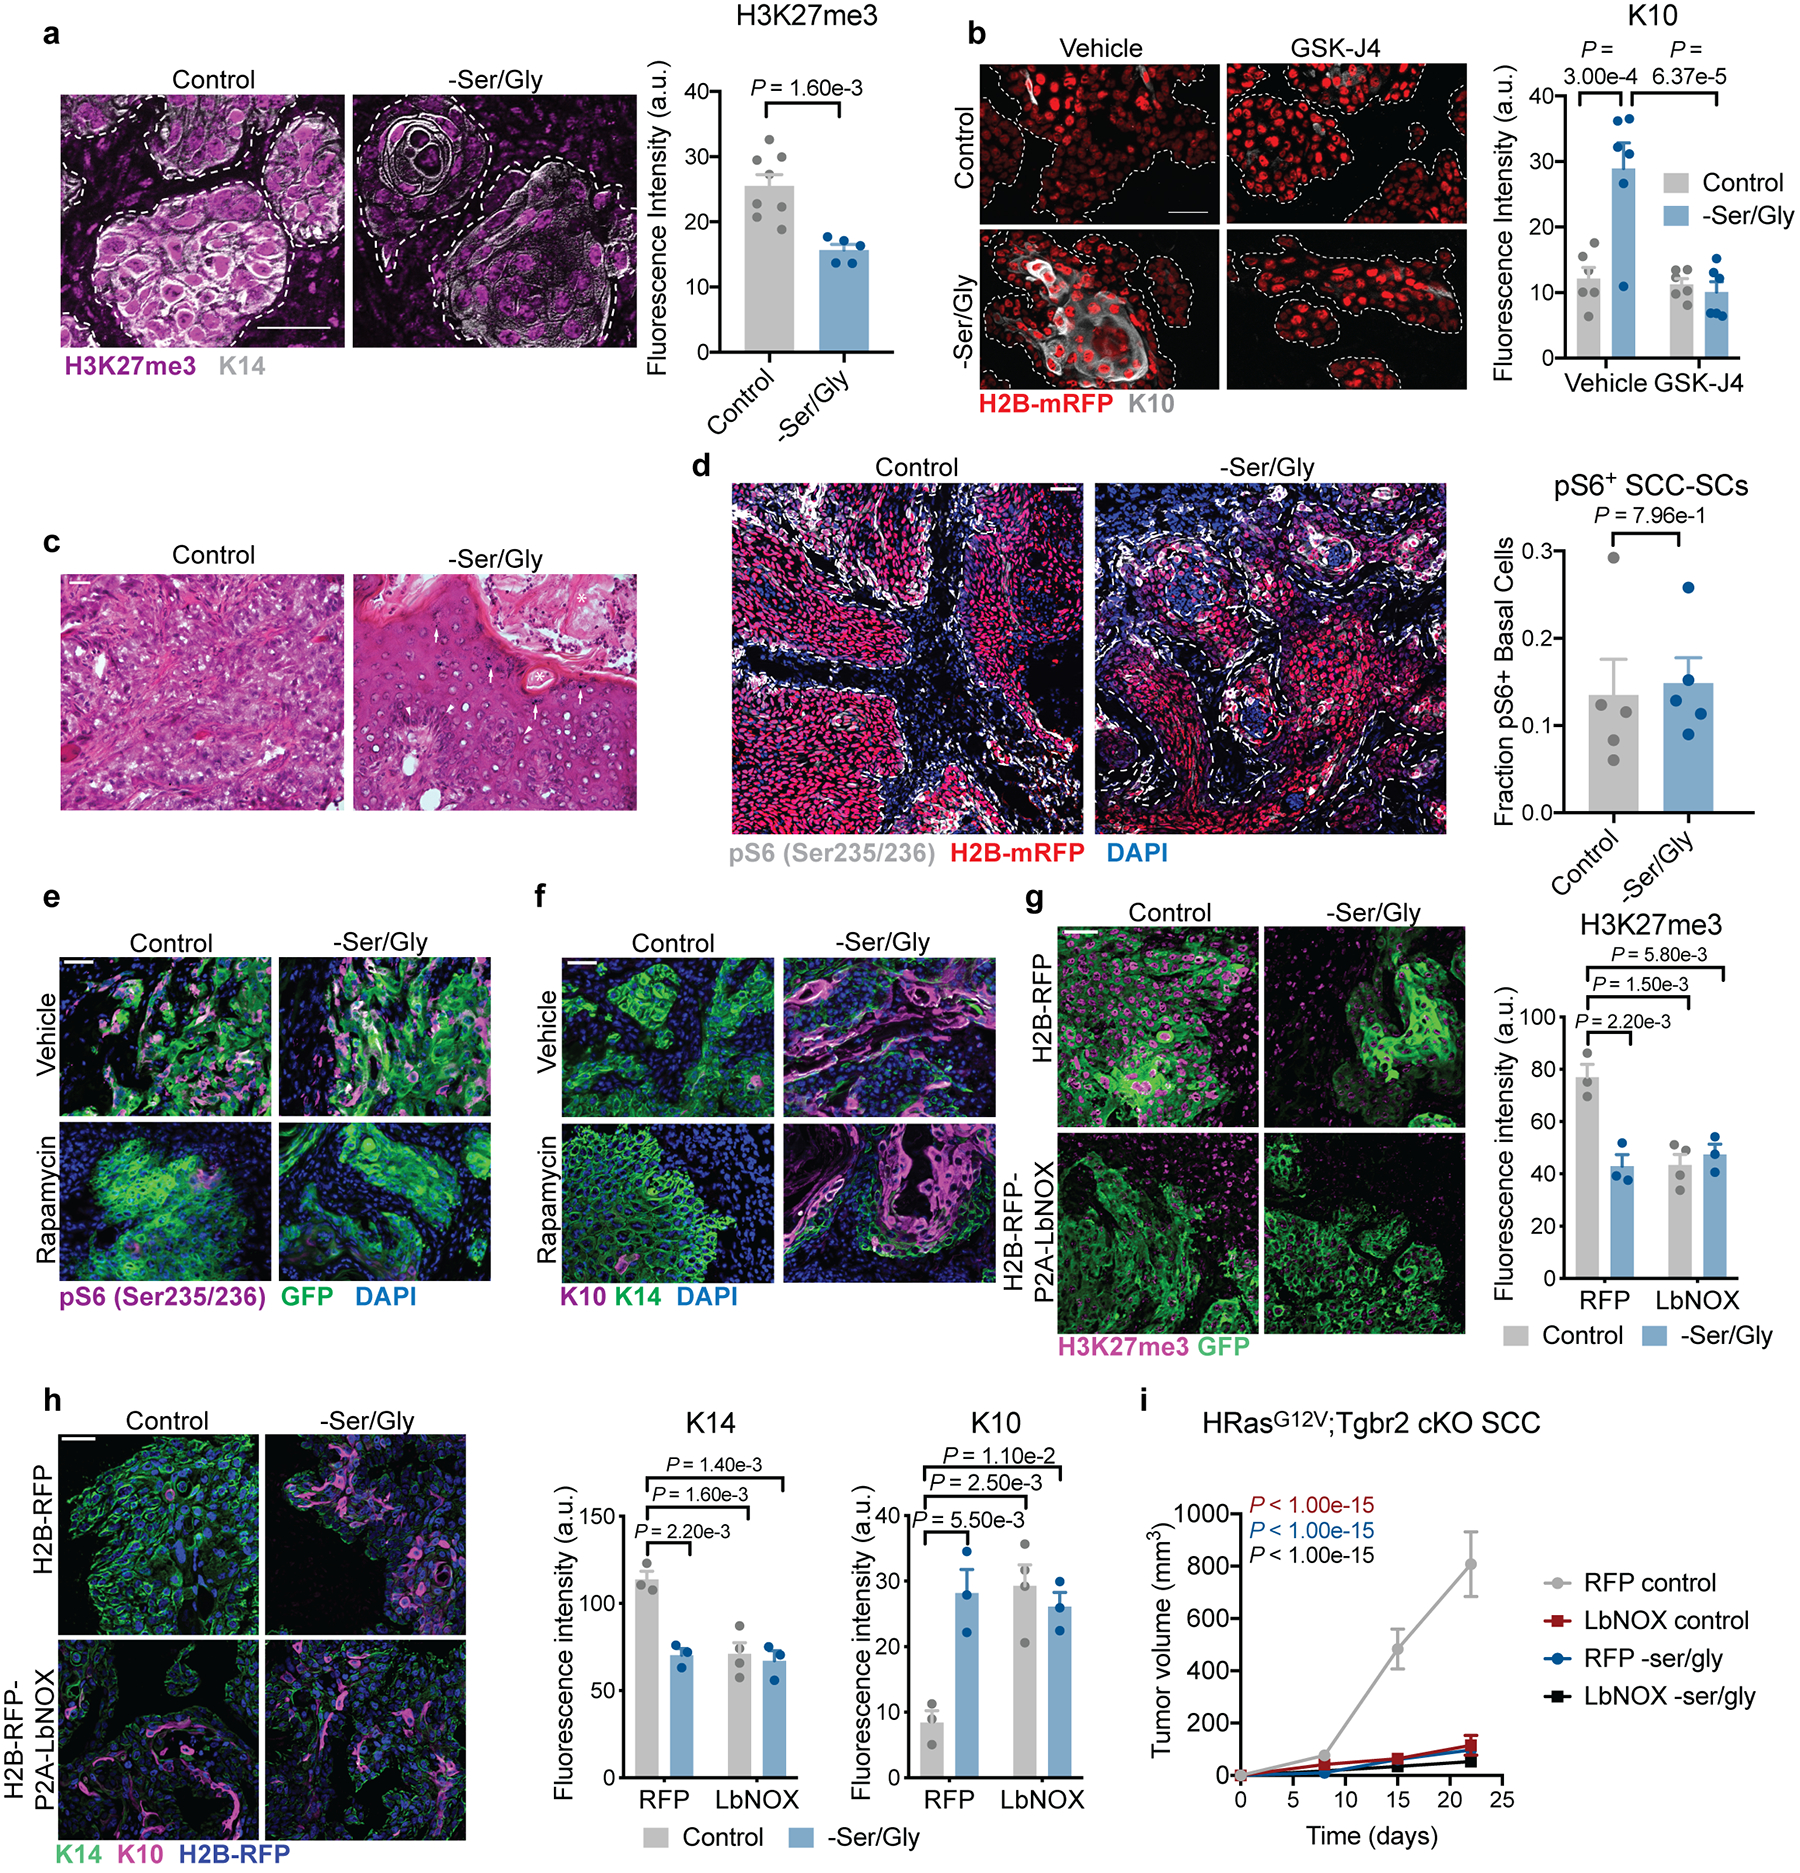
a. H3K27me3 levels in mouse SCCs grown in Nude mice on control or Ser/Gly-free diet (n=8 control tumors, n=5 –Ser/Gly tumors) Data are mean ±SEM. b, K10 expression in SCCs grown in Nude mice on control or Ser/Gly-free diet treated with 10 mg/kg GSK-J4 (n=6 tumors per condition). Data are mean ±SEM. c, Representative hematoxylin & eosin (H&E) of SCCs. Asterisks denote keratin pearls, arrows denote keratohyalin granules, arrowheads denote intercellular bridges, all signs of differentiation in SCCs. Three tumors were analyzed per condition with similar results. d, pS6 staining in SCCs (n=5 tumors per condition). Data are mean ±SEM. e-f, pS6 staining (e) and K10 staining (f) in SCCs grown in Nude mice treated with 4 mg/kg rapamycin. Three tumors were analyzed per condition with similar results. g, H3K27me3 staining in SCCs expressing RFP or LbNOX-Flag (n=3 tumors per condition). Data are mean ±SEM. h, K14 and K10 staining in SCCs expressing RFP or LbNOX-Flag (n=3 tumors per condition). Data are mean ±SEM. i, Tumor growth of SCCs expressing RFP or LbNOX-Flag (n=20 tumors per condition). Data are mean ±SEM. P-values are comparison to RFP control at end point. Statistical significance was determined using an unpaired two-tailed student’s t-test for panels a and d, and a two-way ANOVA with Tukey’s multiple comparison test for panels b, g, h and i. Numerical data are provided in Statistics Source Data Extended Fig. 7.
Extended Data Fig. 8. Human SCCs are sensitive to Ser/Gly starvation regardless of p53 status in vivo.
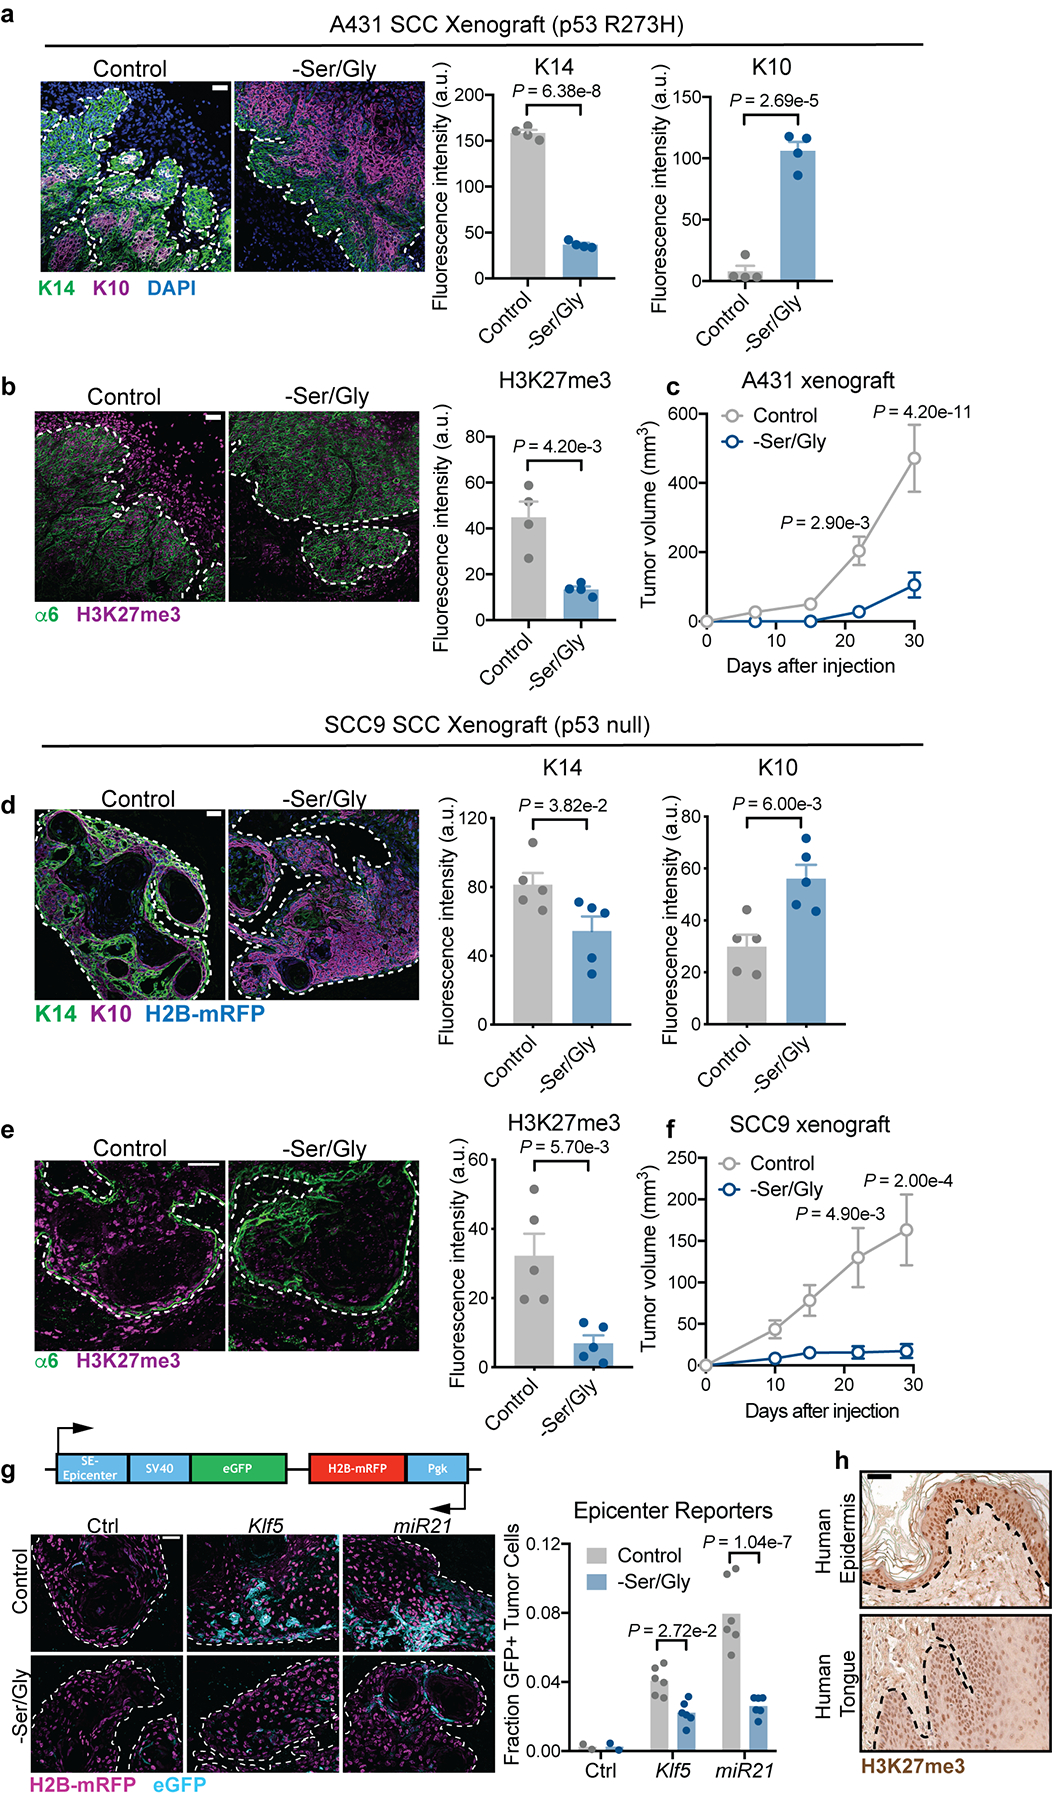
a-c, K14/K10 (a), H3K27me3 (b) and growth (c) of p53 mutant A431 human SCCs grown in Nude mice (n=4 tumors per condition for immunofluorescence analysis, n=20 tumors per condition for growth). Data are mean ±SEM. d-f K14/K10 (d), H3K27me3 (e) and growth (f) of p53 null SCC9 human SCCs grown in Nude mice (n=4 tumors per condition for immunofluorescence analysis, n=20 tumors per condition for growth). Data are mean ±SEM. g, Super-enhancer epicenter reporter expression in SCC9 SCCs grown in Nude mice (n=2 control reporter tumors, 6 mir21 tumors, 6 Klf5 tumors per condition). Data are mean. h, Immunohistochemistry of H3K27me3 in normal human skin and tongue. Statistical analysis was determined using an unpaired two-tailed student’s t-test for panels a, b, d and e, a two-way ANOVA with Tukey’s multiple comparison test for panels c and f, and with Sidak’s multiple comparison test for panel g. Numerical data are provided in Statistics Source Data Extended Fig. 8.
Extended Data Fig. 9. Glucose-derived serine synthesis suppresses tumorigenesis.
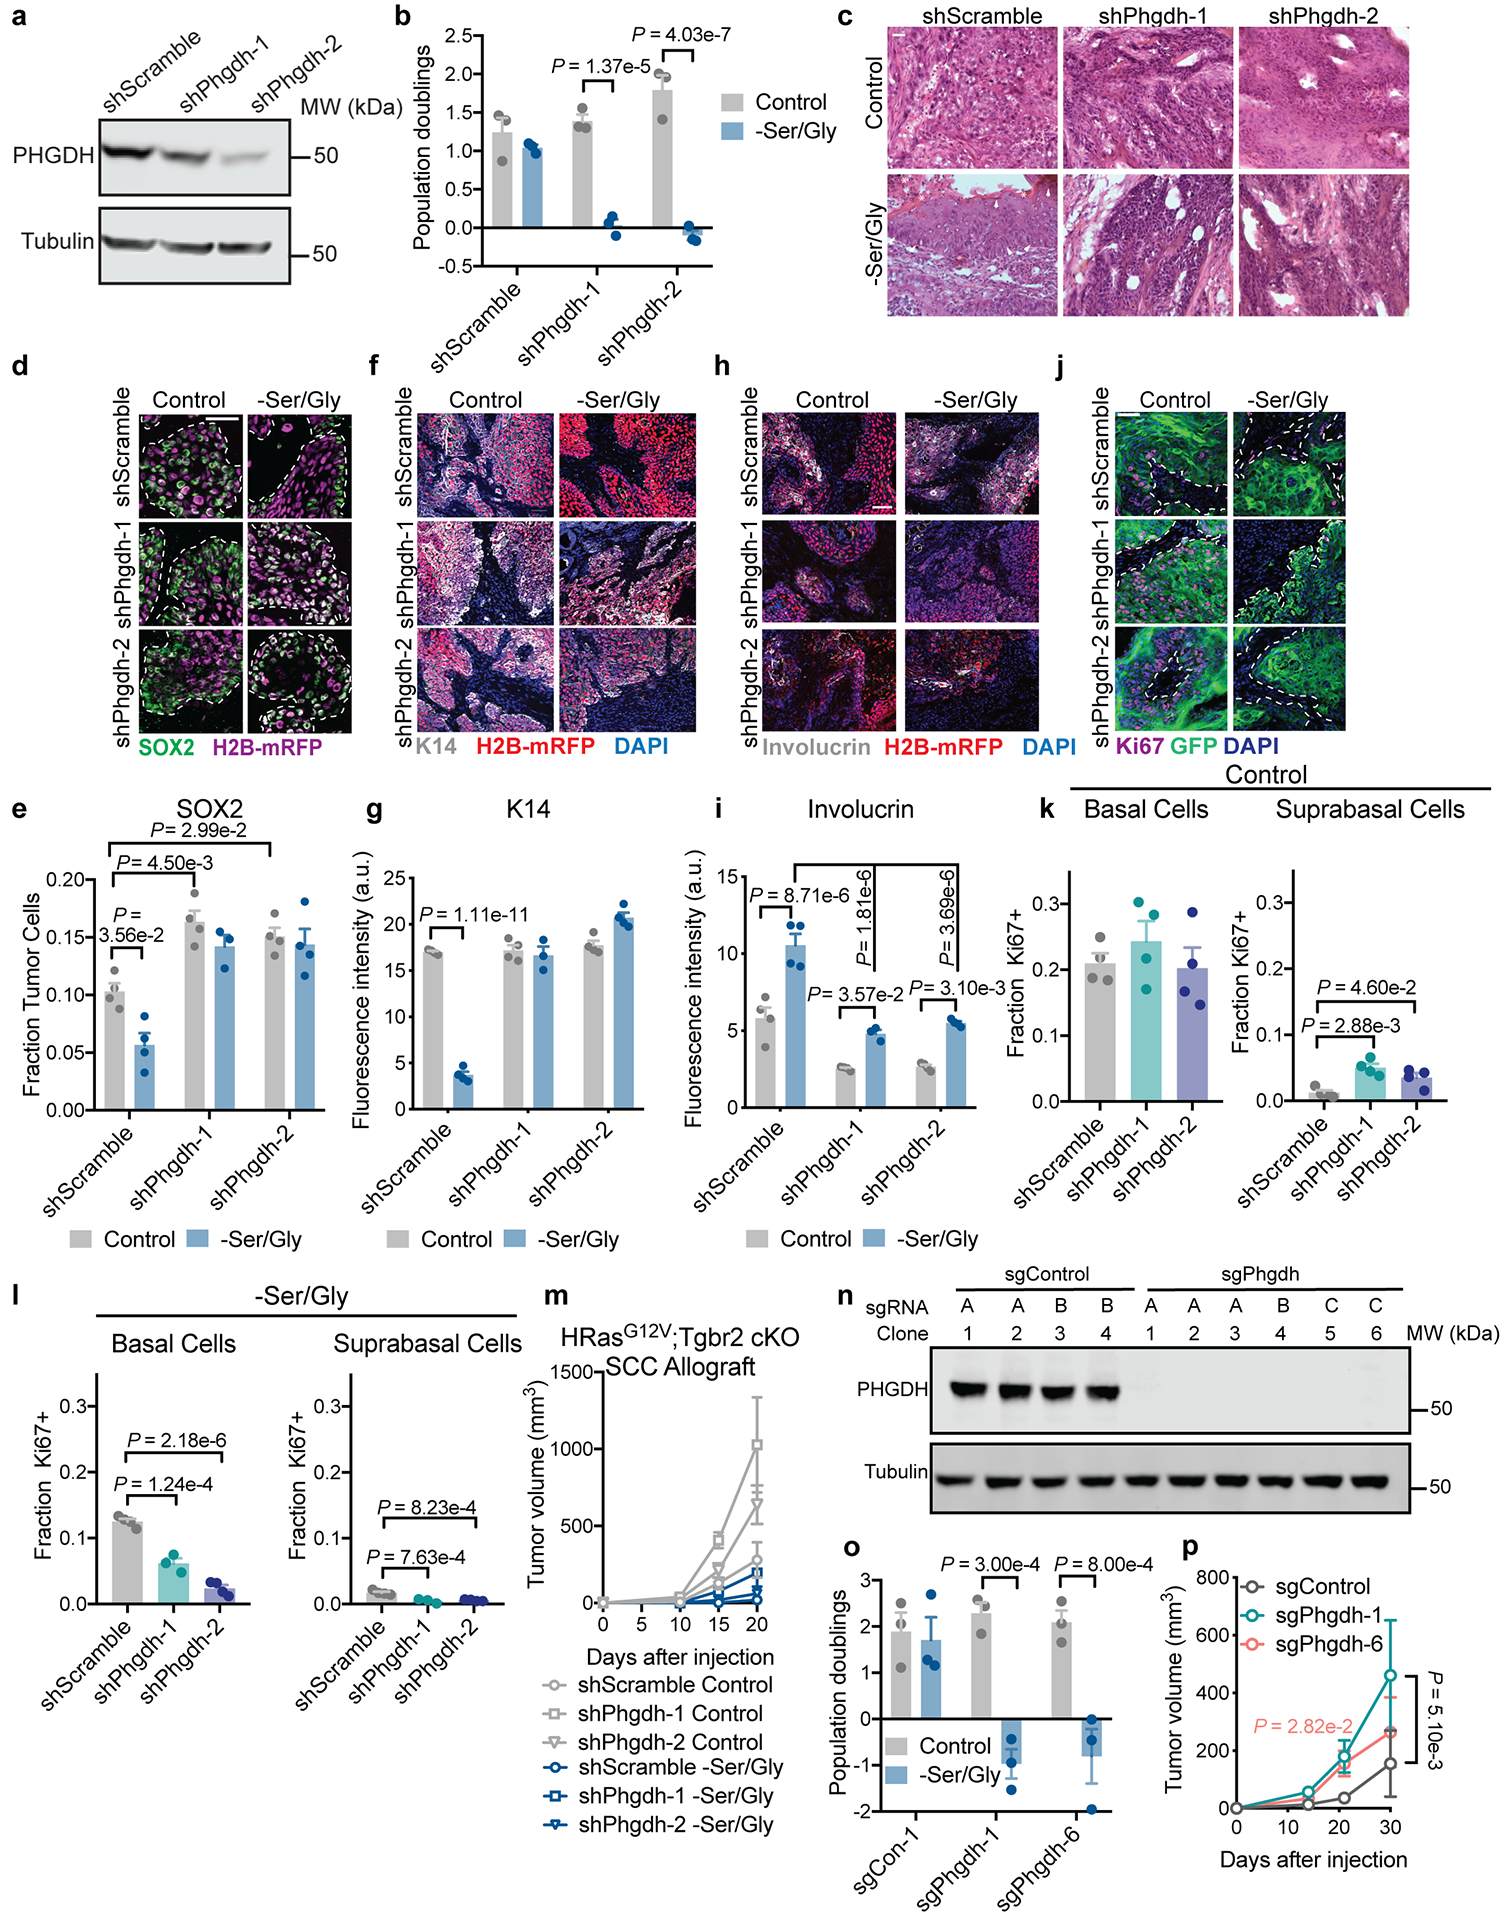
a, Representative PHGDH knockdown efficiency in mouse SCC cells. Experiment performed in duplicate independent experiments with similar results. b, Population doublings of shPhgdh SCC cells in vitro during 48 h of Ser/Gly starvation (n=3 biologically independent samples). c, Representative H&E of shScramble and shPhgdh SCCs. Asterisks denote keratin pearls, arrows denote keratohyalin granules, arrowheads denote intercellular bridges, all signs of differentiation in SCCs. Three tumors analyzed per condition with similar results. d-l, Immunofluorescence and analysis of SOX2 (d,e), K14 (f,g), Involucrin (h,i) and Ki67 (j-l) in shScramble and shPhgdh SCCs (n=3 tumors for shPhgdh-1 –Ser/Gly, n=4 tumors for all other conditions). m, Growth of SCCs (n=4 tumors per condition). n, Verification of Phgdh knockout by immunoblot in SCC cells. Experiment was performed in duplicate with similar results. sgRNA sequence information can be found in Supplementary Table 6. o, Population doublings of sgPhgdh SCC cells in vitro during 48 h of Ser/Gly starvation (n=3 biologically independent samles). p, Growth of sgPhgdh SCC cells orthotopically grafted into Nude mice (n=8 tumors for days 1–30, n=24 tumors for days 1–24). Scale bar = 50 μm. All data are mean ±SEM. Statistical significance was determined using a two-way ANOVA with Sidak’s multiple comparison test in panels b and o, with Tukey’s multiple comparison test in e, g and i, with Dunnett’s multiple comparison test in panel p, and an ordinary one-way ANOVA with Tukey’s multiple comparison test in panels k and l. Scanned images of unprocessed blots are shown in Source Data Extended Fig. 9. Numerical data are provided in Statistics Source Data Extended Fig. 9.
Extended Data Fig. 10. Serine starvation drives αKG-dependent demethylation in vivo.
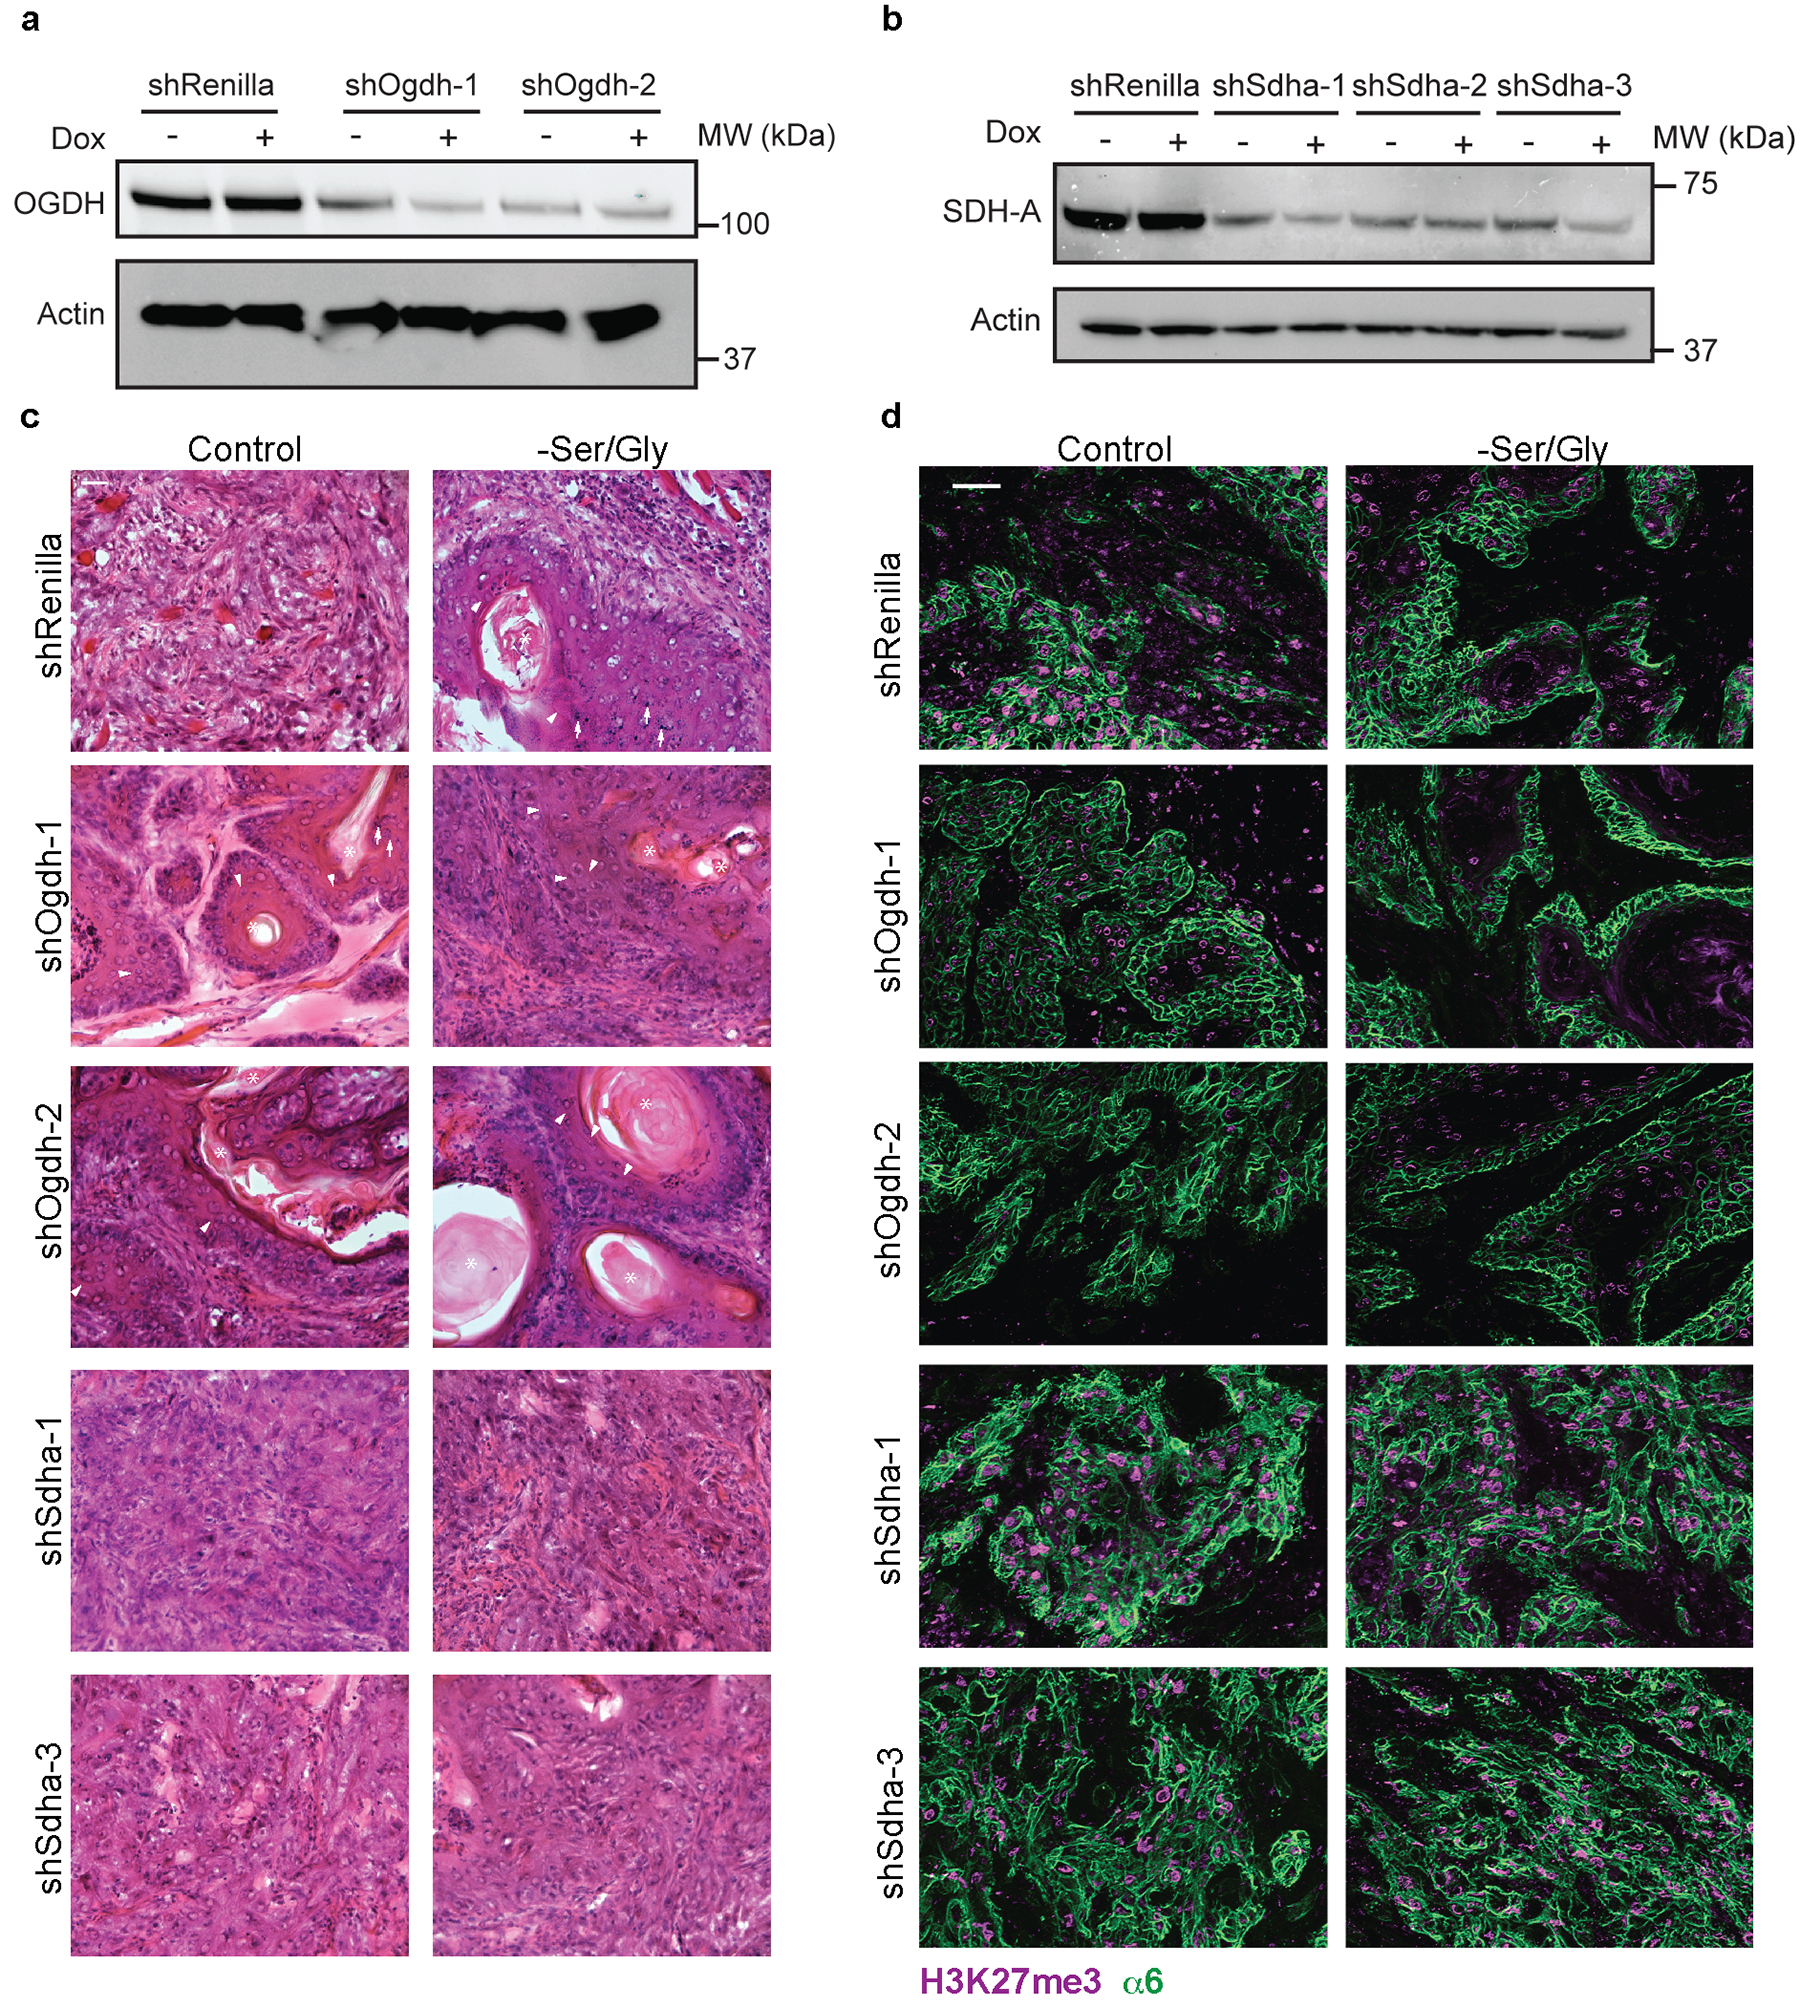
a-b, OGDH (a) and SDHA (b) protein knockdown efficiency in SCC cells following 24 h in culture with or without doxycycline. Western blots performed in duplicate with similar results. shRNA sequences can be found in Supplementary Table 5. c, H&E of SCCs. Asterisks denote keratin pearls, arrows denote keratohyaline granules, arrowheads denote intercellular bridges, all signs of differentiation in SCCs. Three tumors were analyzed per condition with similar results. d, Bulk H3K27me3 levels in shRenilla, shOgdh and shSdha SCCs grafted into Nude mice on control or Ser/Gly-free diet. Three tumors were analyzed per condition with similar results. Scale bar = 50 μm. Scanned images of unprocessed blots are shown in Source Data Extended Fig. 10.
Supplementary Material
Supplementary table 1: Serine synthesis pathway western blot quantification normalized to tubulin and WT control;
Supplementary table 2: Serine standard curve data;
Supplementary table 3: Extracellular glutamine, glutamate and serine data;
Supplementary table 4: H3K27me3 immunoblot quantification normalized to H3 within genotype;
Supplementary table 5: shRNA sequences;
Supplementary Table 6: sgRNA sequences;
Supplementary Table 7: RT-qPCR primers.
Acknowledgements.
We thank J. Que for the R26-LSL-Sox2-IRES-eGFP mice and S. Lowe for sharing the LT3GEPIR vector. We thank M. Nikolova and E. Wong for technical assistance, J. Levorse for in utero lentiviral injections, and M. Sribour, L. Polak and L. Hidalgo for mouse care and special diet experiments. We thank S. Mazel, S. Semova, S. Han, and S. Tadesse at Rockefeller University’s Flow Cytometry core for conducting FACS sorting. We thank all members of the Fuchs and Finley labs for discussions. We thank A. Intlekofer for discussion and shared equipment and S. Vardhana, S. Ellis, N. Infarinato and A. Siliciano for critical assessment of the manuscript. E. Fuchs is a Howard Hughes Medical Investigator. L. Finley is a Searle Scholar. S. Baksh is a Ruth Kirschstein NIH Predoctoral fellow (F31CA236465); S. Gur-Cohen is a Postdoctoral Fellow of the Human Frontiers Science Program (LT001519/2017) and the European Molecular Biology Organization (ALTF 1239-2016); B. Hurwitz is a Ruth Kirschstein NIH Predoctoral Fellow (F30CA236239-01); M. Tierney is a Ruth Kirstein NIH Postdoctoral Fellow (1F32AR073105); B. Hurwitz, J. Novak and S. Baksh are predoctoral fellows of the Weill Cornell/Rockefeller/Sloan Kettering Tri-Institutional Medical Scientist Training Program (T32GM007739). This research was supported by grants to E.F. from the National Institutes of Health (R01-AR31737), NYSTEM (CO29559) and a collaborative grant from The Starr Foundation (I11-0039 to E.F. and L.F.). This work was additionally supported by grants to L.F. from the Damon Runyon Cancer Research Foundation (DFS-23-17), the Concern Foundation, the Anna Fuller Fund, The Edward Mallinckrodt, Jr. Foundation, The Starr Foundation (I12-051) and the Memorial Sloan Kettering Cancer Center Support Grant P30 CA008748.
Footnotes
Declaration of competing interests.
Authors declare no competing interests.
References
- 1.Ge Y & Fuchs E Stretching the limits: from homeostasis to stem cell plasticity in wound healing and cancer. Nat. Rev. Genet 19, 311–325 (2018). [DOI] [PMC free article] [PubMed] [Google Scholar]
- 2.Martincorena I et al. High burden and pervasive positive selection of somatic mutations in normal human skin. Science (80-.). 348, (2015). [DOI] [PMC free article] [PubMed] [Google Scholar]
- 3.Martincorena I et al. Somatic mutant clones colonize the human esophagus with age. Science eaau3879 (2018). doi: 10.1126/science.aau3879 [DOI] [PMC free article] [PubMed] [Google Scholar]
- 4.Blokzijl F et al. Tissue-specific mutation accumulation in human adult stem cells during life. Nature 538, 260–264 (2016). [DOI] [PMC free article] [PubMed] [Google Scholar]
- 5.Jaiswal S et al. Age-Related Clonal Hematopoiesis Associated with Adverse Outcomes. N. Engl. J. Med 371, 2488–2498 (2014). [DOI] [PMC free article] [PubMed] [Google Scholar]
- 6.Genovese G et al. Clonal Hematopoiesis and Blood-Cancer Risk Inferred from Blood DNA Sequence. N. Engl. J. Med 371, 2477–2487 (2014). [DOI] [PMC free article] [PubMed] [Google Scholar]
- 7.Lapouge G et al. Identifying the cellular origin of squamous skin tumors. Proc. Natl. Acad. Sci. U. S. A 108, 7431–6 (2011). [DOI] [PMC free article] [PubMed] [Google Scholar]
- 8.Barker N et al. Crypt stem cells as the cells-of-origin of intestinal cancer. Nature 457, 608–611 (2009). [DOI] [PubMed] [Google Scholar]
- 9.White AC et al. Defining the origins of Ras/p53-mediated squamous cell carcinoma. Proc. Natl. Acad. Sci. U. S. A 108, 7425–30 (2011). [DOI] [PMC free article] [PubMed] [Google Scholar]
- 10.White AC & Lowry WE Refining the role for adult stem cells as cancer cells of origin. Trends Cell Biol. 25, 11–20 (2015). [DOI] [PMC free article] [PubMed] [Google Scholar]
- 11.Brown S et al. Correction of aberrant growth preserves tissue homeostasis. Nature 548, 334–337 (2017). [DOI] [PMC free article] [PubMed] [Google Scholar]
- 12.Dow LE et al. Apc Restoration Promotes Cellular Differentiation and Reestablishes Crypt Homeostasis in Colorectal Cancer. Cell 161, 1539–1552 (2015). [DOI] [PMC free article] [PubMed] [Google Scholar]
- 13.Ying Z, Sandoval M & Beronja S Oncogenic activation of PI3K induces progenitor cell differentiation to suppress epidermal growth. Nat. Cell Biol 1 (2018). doi: 10.1038/s41556-018-0218-9 [DOI] [PMC free article] [PubMed] [Google Scholar]
- 14.Warrell RP et al. Differentiation Therapy of Acute Promyelocytic Leukemia with Tretinoin (All-trans-Retinoic Acid). N. Engl. J. Med 324, 1385–1393 (1991). [DOI] [PubMed] [Google Scholar]
- 15.Boumahdi S et al. SOX2 controls tumour initiation and cancer stem-cell functions in squamous-cell carcinoma. Nature 511, 246–250 (2014). [DOI] [PubMed] [Google Scholar]
- 16.Sendoel A et al. Translation from unconventional 5′ start sites drives tumour initiation. Nature 541, 494–499 (2017). [DOI] [PMC free article] [PubMed] [Google Scholar]
- 17.Maier S et al. SOX2 amplification is a common event in squamous cell carcinomas of different organ sites. Hum. Pathol 42, 1078–1088 (2011). [DOI] [PubMed] [Google Scholar]
- 18.Blanco S et al. Stem cell function and stress response are controlled by protein synthesis. Nature 534, 335–340 (2016). [DOI] [PMC free article] [PubMed] [Google Scholar]
- 19.Saxton RA & Sabatini DM mTOR Signaling in Growth, Metabolism, and Disease. Cell 168, 960–976 (2017). [DOI] [PMC free article] [PubMed] [Google Scholar]
- 20.Carey BW, Finley LWS, Cross JR, Allis CD & Thompson CB Intracellular α-ketoglutarate maintains the pluripotency of embryonic stem cells. Nature 518, 413–416 (2014). [DOI] [PMC free article] [PubMed] [Google Scholar]
- 21.Flores A et al. Lactate dehydrogenase activity drives hair follicle stem cell activation. Nat. Cell Biol 19, 1017–1026 (2017). [DOI] [PMC free article] [PubMed] [Google Scholar]
- 22.Agathocleous M et al. Ascorbate regulates haematopoietic stem cell function and leukaemogenesis. Nature 549, 476–481 (2017). [DOI] [PMC free article] [PubMed] [Google Scholar]
- 23.Intlekofer AM & Finley LWS Metabolic signatures of cancer cells and stem cells. Nat. Metab 1, 177–188 (2019). [DOI] [PMC free article] [PubMed] [Google Scholar]
- 24.Vardhana SA et al. Glutamine independence is a selectable feature of pluripotent stem cells. Nat. Metab 1, 676–687 (2019). [DOI] [PMC free article] [PubMed] [Google Scholar]
- 25.Maddocks ODK et al. Modulating the therapeutic response of tumours to dietary serine and glycine starvation. Nature 544, 372–376 (2017). [DOI] [PubMed] [Google Scholar]
- 26.Maddocks ODK et al. Serine starvation induces stress and p53-dependent metabolic remodelling in cancer cells. Nature 493, 542–546 (2012). [DOI] [PMC free article] [PubMed] [Google Scholar]
- 27.Gao X et al. Dietary methionine influences therapy in mouse cancer models and alters human metabolism. Nature 572, 397–401 (2019). [DOI] [PMC free article] [PubMed] [Google Scholar]
- 28.Liu K et al. Sox2 Cooperates with Inflammation-Mediated Stat3 Activation in the Malignant Transformation of Foregut Basal Progenitor Cells. Cell Stem Cell 12, 304–315 (2013). [DOI] [PMC free article] [PubMed] [Google Scholar]
- 29.Hosios AM et al. Amino Acids Rather than Glucose Account for the Majority of Cell Mass in Proliferating Mammalian Cells. Dev. Cell 36, 540–549 (2016). [DOI] [PMC free article] [PubMed] [Google Scholar]
- 30.Yang M & Vousden KH Serine and one-carbon metabolism in cancer. Nat. Rev. Cancer 16, 650–662 (2016). [DOI] [PubMed] [Google Scholar]
- 31.Michelakis ED, Webster L & Mackey JR Dichloroacetate (DCA) as a potential metabolic-targeting therapy for cancer. Br. J. Cancer 99, 989–94 (2008). [DOI] [PMC free article] [PubMed] [Google Scholar]
- 32.Halestrap AP The mitochondrial pyruvate carrier. Kinetics and specificity for substrates and inhibitors. Biochem. J 148, 85–96 (1975). [DOI] [PMC free article] [PubMed] [Google Scholar]
- 33.Diehl FF, Lewis CA, Fiske BP & Vander Heiden MG Cellular redox state constrains serine synthesis and nucleotide production to impact cell proliferation. Nature Metabolism 1, 861–867 (2019). [DOI] [PMC free article] [PubMed] [Google Scholar]
- 34.Sullivan LB et al. Supporting Aspartate Biosynthesis Is an Essential Function of Respiration in Proliferating Cells. Cell 162, 552–63 (2015). [DOI] [PMC free article] [PubMed] [Google Scholar]
- 35.Titov DV et al. Complementation of mitochondrial electron transport chain by manipulation of the NAD+/NADH ratio. Science 352, 231–5 (2016). [DOI] [PMC free article] [PubMed] [Google Scholar]
- 36.Williamson DH, Lund P & Krebs HA The redox state of free nicotinamide-adenine dinucleotide in the cytoplasm and mitochondria of rat liver. Biochem. J 103, 514–27 (1967). [DOI] [PMC free article] [PubMed] [Google Scholar]
- 37.Birsoy K et al. An Essential Role of the Mitochondrial Electron Transport Chain in Cell Proliferation Is to Enable Aspartate Synthesis. Cell 162, 540–551 (2015). [DOI] [PMC free article] [PubMed] [Google Scholar]
- 38.Lechler T & Fuchs E Asymmetric cell divisions promote stratification and differentiation of mammalian skin. Nature 437, 275–280 (2005). [DOI] [PMC free article] [PubMed] [Google Scholar]
- 39.Asare A, Levorse J & Fuchs E Coupling organelle inheritance with mitosis to balance growth and differentiation. Science 355, eaah4701(2017). [DOI] [PMC free article] [PubMed] [Google Scholar]
- 40.Altman BJ, Stine ZE & Dang CV From Krebs to clinic: glutamine metabolism to cancer therapy. Nat. Rev. Cancer 16, 619–634 (2016). [DOI] [PMC free article] [PubMed] [Google Scholar]
- 41.Possemato R et al. Functional genomics reveal that the serine synthesis pathway is essential in breast cancer. Nature 476, 346–350 (2011). [DOI] [PMC free article] [PubMed] [Google Scholar]
- 42.Schvartzman JM, Thompson CB & Finley LWS Metabolic regulation of chromatin modifications and gene expression. J. Cell Biol 217, 2247–2259 (2018). [DOI] [PMC free article] [PubMed] [Google Scholar]
- 43.Ezhkova E et al. Ezh2 Orchestrates Gene Expression for the Stepwise Differentiation of Tissue-Specific Stem Cells. Cell 136, 1122–1135 (2009). [DOI] [PMC free article] [PubMed] [Google Scholar]
- 44.Sen GL, Webster DE, Barragan DI, Chang HY & Khavari PA Control of differentiation in a self-renewing mammalian tissue by the histone demethylase JMJD3. Genes Dev. 22, 1865–70 (2008). [DOI] [PMC free article] [PubMed] [Google Scholar]
- 45.Maddocks ODK, Labuschagne CF, Adams PD & Vousden KH Serine Metabolism Supports the Methionine Cycle and DNA/RNA Methylation through De Novo ATP Synthesis in Cancer Cells. Mol. Cell 61, 210–221 (2016). [DOI] [PMC free article] [PubMed] [Google Scholar]
- 46.Hamanaka RB et al. Mitochondrial reactive oxygen species promote epidermal differentiation and hair follicle development. Sci. Signal 6, ra8(2013). [DOI] [PMC free article] [PubMed] [Google Scholar]
- 47.Morris JP et al. α-Ketoglutarate links p53 to cell fate during tumour suppression. Nature 573, 595–599 (2019). [DOI] [PMC free article] [PubMed] [Google Scholar]
- 48.Castilho RM, Squarize CH, Chodosh LA, Williams BO & Gutkind JS mTOR Mediates Wnt-Induced Epidermal Stem Cell Exhaustion and Aging. Cell Stem Cell 5, 279–289 (2009). [DOI] [PMC free article] [PubMed] [Google Scholar]
- 49.Ding X et al. mTORC1 and mTORC2 regulate skin morphogenesis and epidermal barrier formation. Nat. Commun 7, 13226(2016). [DOI] [PMC free article] [PubMed] [Google Scholar]
- 50.Reeves MQ, Kandyba E, Harris S, Del Rosario R & Balmain A Multicolour lineage tracing reveals clonal dynamics of squamous carcinoma evolution from initiation to metastasis. Nat. Cell Biol 20, 699–709 (2018). [DOI] [PMC free article] [PubMed] [Google Scholar]
- 51.Sullivan MR et al. Increased Serine Synthesis Provides an Advantage for Tumors Arising in Tissues Where Serine Levels Are Limiting. Cell Metab. (2019). doi: 10.1016/J.CMET.2019.02.015 [DOI] [PMC free article] [PubMed] [Google Scholar]
- 52.Kruidenier L et al. A selective jumonji H3K27 demethylase inhibitor modulates the proinflammatory macrophage response. Nature 488, 404–408 (2012). [DOI] [PMC free article] [PubMed] [Google Scholar]
- 53.Min BM et al. Inactivation of the p53 gene by either mutation or HPV infection is extremely frequent in human oral squamous cell carcinoma cell lines. Eur. J. Cancer. Part B Oral Oncol 30, 338–345 (1994). [DOI] [PubMed] [Google Scholar]
- 54.Reiss M et al. Status of the p53 tumor suppressor gene in human squamous carcinoma cell lines. Oncol. Res 4, 349–357 (1992). [PubMed] [Google Scholar]
- 55.Ge Y et al. Stem Cell Lineage Infidelity Drives Wound Repair and Cancer. Cell 169, 636–650.e14 (2017). [DOI] [PMC free article] [PubMed] [Google Scholar]
- 56.Locasale JW et al. Phosphoglycerate dehydrogenase diverts glycolytic flux and contributes to oncogenesis. Nat. Genet 43, 869–874 (2011). [DOI] [PMC free article] [PubMed] [Google Scholar]
- 57.Labuschagne CF, van den Broek NJF, Mackay GM, Vousden KH & Maddocks ODK Serine, but Not Glycine, Supports One-Carbon Metabolism and Proliferation of Cancer Cells. Cell Rep. 7, 1248–1258 (2014). [DOI] [PubMed] [Google Scholar]
- 58.Lu C et al. IDH mutation impairs histone demethylation and results in a block to cell differentiation. Nature 483, 474–478 (2012). [DOI] [PMC free article] [PubMed] [Google Scholar]
- 59.Figueroa ME et al. Leukemic IDH1 and IDH2 Mutations Result in a Hypermethylation Phenotype, Disrupt TET2 Function, and Impair Hematopoietic Differentiation. Cancer Cell 18, 553–567 (2010). [DOI] [PMC free article] [PubMed] [Google Scholar]
- 60.Letouzé E et al. SDH Mutations Establish a Hypermethylator Phenotype in Paraganglioma. Cancer Cell 23, 739–752 (2013). [DOI] [PubMed] [Google Scholar]
- 61.Xiao M et al. Inhibition of α-KG-dependent histone and DNA demethylases by fumarate and succinate that are accumulated in mutations of FH and SDH tumor suppressors. Genes Dev. 26, 1326–38 (2012). [DOI] [PMC free article] [PubMed] [Google Scholar]
- 62.Intlekofer AM et al. Hypoxia Induces Production of L-2-Hydroxyglutarate. Cell Metab. 22, 304–311 (2015). [DOI] [PMC free article] [PubMed] [Google Scholar]
- 63.Pan M et al. Regional glutamine deficiency in tumours promotes dedifferentiation through inhibition of histone demethylation. Nat. Cell Biol 18, 1090–1101 (2016). [DOI] [PMC free article] [PubMed] [Google Scholar]
- 64.Elia I et al. Breast cancer cells rely on environmental pyruvate to shape the metastatic niche. Nature 568, 117–121 (2019). [DOI] [PMC free article] [PubMed] [Google Scholar]
- 65.Raffel S et al. BCAT1 restricts αKG levels in AML stem cells leading to IDHmut-like DNA hypermethylation. Nature 551, 384–388 (2017). [DOI] [PubMed] [Google Scholar]
- 66.Chang C-J et al. EZH2 Promotes Expansion of Breast Tumor Initiating Cells through Activation of RAF1-β-Catenin Signaling. Cancer Cell 19, 86–100 (2011). [DOI] [PMC free article] [PubMed] [Google Scholar]
- 67.Beck B et al. A vascular niche and a VEGF–Nrp1 loop regulate the initiation and stemness of skin tumours. Nature 478, 399–403 (2011). [DOI] [PubMed] [Google Scholar]
- 68.Oshimori N, Oristian D & Fuchs E TGF-β Promotes Heterogeneity and Drug Resistance in Squamous Cell Carcinoma. Cell 160, 963–976 (2015). [DOI] [PMC free article] [PubMed] [Google Scholar]
- 69.Millard P, Letisse F, Sokol S & Portais J-C IsoCor: correcting MS data in isotope labeling experiments. Bioinformatics 28, 1294–1296 (2012). [DOI] [PubMed] [Google Scholar]
- 70.Perez AR et al. GuideScan software for improved single and paired CRISPR guide RNA design. Nat. Biotechnol 35, 347–349 (2017). [DOI] [PMC free article] [PubMed] [Google Scholar]
Associated Data
This section collects any data citations, data availability statements, or supplementary materials included in this article.
Supplementary Materials
Supplementary table 1: Serine synthesis pathway western blot quantification normalized to tubulin and WT control;
Supplementary table 2: Serine standard curve data;
Supplementary table 3: Extracellular glutamine, glutamate and serine data;
Supplementary table 4: H3K27me3 immunoblot quantification normalized to H3 within genotype;
Supplementary table 5: shRNA sequences;
Supplementary Table 6: sgRNA sequences;
Supplementary Table 7: RT-qPCR primers.
Data Availability Statement
Source data for Figs. 1–7 and Extended Data Figs. 1–10 are provided with the paper. All data supporting the findings are available upon reasonable request. All materials are available upon completion of a material transfers agreement. Comments and requests for materials and data should be addressed to E.F. (fuchslb@rockefeller.edu) and L.W.S.F. (finleyl@mskcc.org).


