

Abstract
Genetic diversity among metastases is poorly understood but contains important information about disease evolution at secondary sites. Here we investigate inter- and intra-lesion heterogeneity for two types of metastases that associate with different clinical outcomes: lymph node and distant organ metastases in human colorectal cancer. We develop a rigorous mathematical framework for quantifying metastatic phylogenetic diversity. Distant metastases are typically monophyletic and genetically similar to each other. Lymph node metastases, in contrast, display high levels of inter-lesion diversity. We validate these findings by analyzing 317 multi-region biopsies from an independent cohort of 20 patients. We further demonstrate higher levels of intra-lesion heterogeneity in lymph node than in distant metastases. Our results show that fewer primary tumor lineages seed distant metastases than lymph node metastases, indicating that the two sites are subject to different levels of selection. Thus, lymph node and distant metastases develop through fundamentally different evolutionary mechanisms.
Introduction
Human cancers develop over years and decades before becoming symptomatic1,2. Consequently, primary tumors often harbor substantial intra-tumor heterogeneity in the form of distinct subclones whose lineages may have diverged many generations ago. The reservoir of genetic diversity in the primary tumor has been extensively described in recent years3–5. Heterogeneity found within metastases (intra-metastatic) is comparatively less well understood, but most studies agree that individual metastases are typically less diverse than the primary tumors from which they derive6. Given that metastases are thought to be formed by relatively small founder populations – single tumor cells or small clusters of tumor cells7 – such a heterogeneity reduction is to be expected.
The heterogeneity between anatomically distinct metastatic lesions within a patient (inter-metastatic heterogeneity) is arguably even less explored. Does inter-metastatic diversity mirror the diversity of the primary tumor, suggesting that many if not all subclones have similar metastatic potential8? Or are metastases a homogenous group, formed by a single clone that is perhaps endowed with superior metastatic ability9? Examples of these scenarios have been described in the literature, but quantifications of their frequency are largely lacking.
Finally, it is unknown whether different metastasis types harbor different heterogeneity levels. Metastases can form in locoregional lymph nodes or in distant organs, or they can develop by direct invasion and subsequent spread within specialized anatomic structures like the peritoneum. Accurate measures of metastasis diversity could help illuminate how many cells contribute to metastasis formation and to what degree selection shapes the metastatic landscape. Here, we investigate patterns of inter- and intra-metastatic heterogeneity for two distinct metastasis types: lymph node and distant organ metastases. Clinically, these occur at different frequencies and carry different prognostic implications. We show that inter- and intra-metastatic heterogeneity differs between lymph node and distant metastases and discuss the implications of these findings for our understanding of metastasis evolution.
Results
Inter-lesion diversity of lymph node and distant metastases
To investigate inter-metastatic heterogeneity, we began by analyzing a published collection of colorectal cancer phylogenies, focusing on patients with multiple primary tumor and metastasis samples10. (Supplementary Table 1 contains detailed patient information). Evaluating trees (Fig. 1a, Supplementary Figures 1–3), we noticed a recurring pattern. Lymph node metastases and primary tumor samples typically diverged in alternating succession from the tree trunk, while distant lesions usually had one common ancestor and tended to form the terminal branch of the tree (Extended Data Fig. 1). Given the consistency of these observations, we sought to formalize them. First, to avoid sampling bias, we reduced the data set to one sample per lymph node and distant metastasis. That is, in cases where multiple biopsies were taken from the same metastasis, we removed all but one by majority vote (methods), such that each metastasis was represented by only one representative biopsy. Then, we determined in what fraction of patients anatomically distinct distant metastases had one common ancestor and grouped together in a monophyletic clade. We found monophyletic clades in 67% of patients. In contrast, lymph node metastases formed monophyletic clades in only 10% of patients (Fig. 1b). Note that the classification into monophyletic/polyphyletic groups is unrelated to our previously described common and distinct origin categories, which reflect whether lymph node and distant metastases have a common subclonal origin and are directly related to each other by descent10. Analysis of monophyly, in contrast, describes the relative genetic diversity observed within a metastasis category. Fig. 1c illustrates the two different concepts in general terms. Furthermore, the mean number of internal nodes separating lesions from each other was significantly lower for distant metastases, confirming the relative homogeneity of this group (Fig. 1d).
Fig. 1: Lymph node but not distant metastases form polyphyletic clades.

a | Phylogenetic trees of patients C45, C66, C3610. Liv, liver metastasis; SB, small bowel metastasis. b | All distant metastases formed a monophyletic clade in 67% (4/6) of patients (blue bar). All lymphatic metastases formed a monophyletic group in 10% (1/10) (red bar; p = 0.036, two-tailed Fisher’s exact test). Black bars denote 90% confidence intervals. c | Both common evolutionary origin of lymph node and distant metastases (purple dashes) or distinct origins (pink dashes) are compatible with monophyly and polyphyly. d | Normalized mean number of internal nodes separating a pair of distinct distant metastases (N=6) is lower than the mean of lymphatic metastases (N=10; means of 0.24 vs 0.42, p=0.045, two-tailed Mann-Whitney test). e | Numbers of lymphatic (N=10) and distant metastases (N=6) per patient are similar (p=0.61, two-tailed Mann-Whitney test). f | The probability of observing a monophyletic clade of all sampled metastases m by chance decreases with increasing m and increasing number of other samples k. g | In distant metastasis samples from both Naxerova10 and Kim11, the RDS (root diversity score) decreases as the power to observe a low score increases with the number of sampled metastases. k ranges between 2 and 8 in both cohorts. h | The RDS was significantly lower for distant metastases (N=11) than lymphatic metastases (N=10) (0.09 vs 0.65; p=0.0026; two-tailed Mann-Whitney test). i | RDSs as in h, stratified by treatment, were significantly different (p=0.0056, Kruskal-Wallis test). RDSs of untreated distant metastases (N=6) were lower than those of untreated lymph node metastases (N=9) (mean of 0.067 vs 0.76, p=0.0013, Conover’s test). Treated distant metastases (N=5) also had a lower root diversity score than untreated lymph node metastases (mean of 0.12 vs 0.76, p=0.019, Conover’s test). Box plot elements: center line, median; magenta diamond, mean; box limits, lower and upper quartiles; whiskers, lowest and highest value within 1.5 IQR.
Next, we considered the possibility that differential sampling may have affected the results. We did not observe a significant difference between the number of sampled lymph node and distant metastases, but the mean and variance were slightly higher in the lymph node group (Fig. 1e). Additionally, the number of primary tumor regions sampled in each case affects the odds of finding monophyletic groups by chance. To account for the different number of lesions sampled in each patient, we developed a mathematical framework to quantify the likelihood that monophyletic groups would arise by chance for any given phylogeny. We define m as the number of metastasis samples under investigation (either lymph node or distant), and k as the number of all other tumor samples in the phylogeny (Supplementary Note). We calculate a root diversity score (RDS) defined by the probability that at least l out of m metastases form a common clade in a tree with n = k + m samples (Supplementary Table 2). The RDS denotes the probability that a tree with an equally or more extreme clustering of metastases occurs by chance alone. For example, in subject C36 (Fig. 1a), the RDS for distant metastases is 0.067, as the likelihood that two distant metastases (m=2) will cluster by chance in a phylogeny with n=9 samples is 6.7%. The power to detect non-random clustering of metastases increases with the number of samples n in a phylogeny (Fig. 1f). Further instructive examples of RDSs are provided in the Supplementary Note.
We used the RDS to quantify the homogeneity of distant metastases in our cohort. We found that after accounting for the number of other samples (k) in the phylogenies, indeed the RDS for distant metastases was generally low (Fig. 1g), even for phylogenies in which not all distant metastases fell into a monophyletic clade. To validate the low root diversity of distant metastases in an independent cohort, we analyzed phylogenetic trees from a study of five colorectal cancers with multiple matched liver metastases (trees are shown in Supplementary Fig. 4)11. We found the smallest possible RDS in every case (Fig. 1g). In 8 out of 11 patients with multiple distant lesions in the combined two cohorts, the likelihood that metastases would cluster to the observed degree by chance alone was below 10% (Supplementary Table 2).
Returning to our original question, we next applied the RDS to lymph node and distant metastases in a comparative analysis. The results showed highly significant differences in root diversity between the two metastasis types, confirming that lymph node metastases are far more likely to be polyphyletic than distant metastases (Fig. 1h), even after accounting for differential sampling in a mathematically rigorous fashion. To determine whether treatment effects may have influenced our results, we separated untreated cases that had received neither neoadjuvant nor adjuvant therapy from treated cases. RDSs of untreated distant metastases remained significantly lower than those of untreated lymph node metastases (Fig. 1i). Treated distant metastases had a slightly higher RDS but remained significantly different from lymph node metastases (Fig. 1i).
Validating inter-lesion diversity of metastases
Next, we set out to validate these findings in an independent cohort. We identified 20 patients who had undergone resection of a primary gastrointestinal cancer and more than one lymph node or distant metastasis. We analyzed multiple locoregional lymph node metastases for 70% of patients (n=14) and multiple distant metastases for 45% of patients (n=9). 82% of distant metastases were liver lesions. Clinical information for all patients is provided in Supplementary Table 3. For every patient, we exhaustively sampled all lymph node and distant metastases of sufficient size and purity, along with the largest possible number of primary tumor regions. To analyze these biopsies, we used polyguanine fingerprinting, a method that uses insertions/deletions in hypermutable polyguanine tracts for inference of robust evolutionary trees12,13. (See Supplementary Note for more details on the properties of polyguanine-based phylogenies). We acquired 22,545 polyguanine genotypes across 317 tissue samples (Supplementary Table 4) and reconstructed the evolutionary history of these tumors with a previously validated analysis pipeline10.
A selection of phylogenetic trees from the validation cohort is shown in Fig. 2a–f. Patient C99 underwent simultaneous resection of a right colon cancer and two liver metastases. Phylogenetic reconstruction showed that samples from the same liver metastasis grouped tightly together (Liv1a-d and Liv2a-c) (Fig. 2a). Furthermore, both liver metastases clustered in a monophyletic clade with a bootstrap confidence value of 99%. (As for our previous cohort, to calculate the RDS, we collapsed multiple samples from the same metastasis into one tree tip; see methods and Supplementary Figs. 5–24 for both full and collapsed trees with bootstrap values). Patient C70 (Fig. 2b) underwent resection of a cecal primary tumor, and, after intervening treatment, excision of several liver metastases and distant metastases to the paraaortic and iliac lymph nodes. (Lymph node metastases that are located in distant sites, and not in locoregional lymph nodes draining the primary tumor, are considered distant organ metastases and define stage IV cancer). Again, the distant metastases clustered tightly on the phylogenetic tree. We also analyzed multiple adenomas that were present in the patient’s colonic mucosa. As expected, these separated very clearly from the invasive cancer, indicating independent clonal origins. For patient C98 (Fig. 2c), we analyzed 6 primary tumor samples and two liver metastases that were resected less than 6 months after the primary tumor. The two distant metastases were similarly sized (2.2 and 2.7 cm) and clustered in a monophyletic clade. In contrast, patients C6 and C11 (Fig. 2d–e) had locoregional lymph node metastases only. The position of lymph node metastases on the tumor phylogeny in these cases was representative of the cohort average: they intermingled with primary tumor samples and either did not cluster together, or clustered no more than they would be expected to by chance, for example in cases where a large number of lymph nodes was analyzed, as in patient C83 (Fig. 2f). Consequently, lymph node RDSs were high in all three cases.
Fig. 2: Validation cohort confirms higher inter-metastatic heterogeneity in lymph node than in distant metastases.

a | Full phylogenetic tree of patient C99. Liver metastases Liv1 and Liv2 were sampled in multiple areas (a-d). b | Full phylogenetic tree of patient C70. For root diversity score calculation, adenoma samples (A1-A3) were removed. c-f | Collapsed phylogenetic trees (one sample per metastasis only) for patients C98, C6, C11 and C83. g | RDSs (root diversity scores) for lymph node metastases (N=14) and distant metastases (N=9) in the validation cohort (p=0.016, two-tailed Mann-Whitney test). h | Combined root diversity scores for lymphatic metastases (N=24) and distant metastases (N=20) from Naxerova10, Kim11 and the new validation cohort (p=4.2e-5, two-tailed Mann-Whitney test). i | Bootstrap values of monophyletic clades (l branch) for lymph node metastases (N=15) were lower than for distant metastases (N=15) (mean of 57% vs 81%; p=0.025, two-tailed Mann-Whitney test). This plot only contains samples from Naxerova et al. and the validation cohort; no bootstrap values were available for Kim et al. j | RDSs for the validation cohort only, stratified by treatment, were significantly different (p=0.048, Kruskal-Wallis test). RDSs of untreated distant metastases (N=4) were lower than those of untreated lymph node metastases (N=12) (mean of 0.045 vs 0.45, p=0.038, Conover’s test). Treated distant metastases in N=5 patients had a lower root diversity score than lymph node metastases (mean of 0.23 vs 0.45, p=0.26, Conover’s test). k | RDSs for all treated metastases (N=10) and untreated distant metastases (N=10) across all three (Naxerova, Kim, validation) cohorts (p=0.037, two tailed Mann-Whitney test). l | Collapsed phylogenetic tree for patient C102. Box plot elements: center line, median; magenta diamond, mean; box limits, lower and upper quartiles; whiskers, lowest and highest value within 1.5 IQR.
Calculating RDSs across the entire validation cohort (Fig. 2g, Supplementary Table 5), we again observed significantly higher values for lymph node than for distant sites. Combining RDSs from both cohorts showed this effect with high statistical confidence (Fig. 2h). Furthermore, across many evolutionary trees, distant metastases grouped together in clades that were supported by very high bootstrap values, indicating that the observed clustering was supported by particularly strong data (Fig. 2i). As in the discovery cohort, distant metastases were further removed from the normal germline sample than lymph node metastases or primary tumor samples (Extended Data Fig. 2).
After stratifying patients by treatment, we again found significantly higher RDSs in untreated lymph node metastases than in untreated distant metastases (Fig. 2j). As in the original cohort, RDSs for treated distant metastases were higher. Combining both cohorts, we compared treated vs. untreated metastases to each other directly and found higher RDSs in the former (Fig. 2k). To understand this surprising observation, we reviewed phylogenetic trees and saw that treated cases frequently showed diminished internal tree structure. For example, the phylogenetic tree of C102 - a heavily treated patient who received both neoadjuvant and adjuvant chemotherapy - exhibited a star-like topology, with all samples radiating from the tree trunk with approximately equal branch lengths (Fig. 2l), consistent with severe homogenization of all lesions by treatment. We conclude that the natural diversity differences between lymph node and distant metastases are most effectively observed when subclonal structure has not been altered by treatment.
Finally, we wanted to exclude the possibility that bias in primary tumor sampling (e.g. strong preponderance of luminal vs. invasive areas among our biopsies) had affected our results. Disparate tumor areas might conceivably have differential likelihoods of seeding lymphatic or distant metastases, affecting our ability to find ancestor clones. A review and classification of all primary tumor histological slides showed that luminal biopsies made up 54% and 64% of primary tumor samples in the discovery and validation cohorts, respectively, indicating that both mucosal and deep regions were well-represented (Supplementary Table 6). Importantly, we found that lymph node and distant metastases were equally likely to originate in luminal and deep primary tumor areas, excluding biases in primary tumor sampling as potential confounders (Extended Data Fig. 3).
Modeling metastasis-seeding lineages in primary tumors
Collectively, these results show that lymph node metastases are a more diverse group than distant metastases and suggest the relative absence of strong selection during the formation of lymph node lesions. In other words, the data suggest that many primary tumor clones are lymph node metastasis-competent (LN-seeding), but fewer clones are distant metastasis-competent (DM-seeding). We reasoned that a stochastic model of metastasis formation could help estimate the relative ratios of LN-seeding to DM-seeding clones. We began by simulating a number of distinct clones that are spatially arranged in the primary tumor (Fig. 3a). This starting configuration is well-aligned with data indicating that in colorectal cancer, clones exist as spatially discrete entities4. In each simulation, mLM clones are randomly selected to have LN-seeding ability and mDM clones are selected to have DM-seeding ability (Fig. 3b). Both mLM and mDM can vary between 1 and 10 (here, the maximum number of clones). Once the LN- and DM-seeding clones have been chosen, they begin seeding lymphatic metastases with a seeding rate of qLM and distant metastases with a seeding rate of qDM per day, respectively. All other clones seed metastases at 50-fold lower rates. Furthermore, we assume that there are nLM and nDM suitable sites where disseminated cells can survive and expand to form lymphatic and distant metastases, respectively. After arrival at one of the sites, cells divide with a birth rate of b = 0.25 and die with a death rate of d = 0.241. Once all metastases reach a detection size of at least M cells, we evaluate the subclonal composition of all metastases and also sample nPT regions of the primary tumor. Primary tumor samples are a mixture of 2-3 adjacent clones because our experimental biopsies would be unlikely to coincide with exact clone boundaries (Fig. 3c, d, each panel showing one simulation). Similar to our approach for polyguanine data, we then calculate the pairwise distances between the in silico tumor samples based on the observed clone fractions, reconstruct phylogenetic trees and calculate RDSs for lymphatic and distant metastases.
Fig. 3: Stochastic model of metastasis diversity.

a | The model assumes the existence of a primary tumor consisting of 10 spatially discrete clones (six pictured). b | Randomly, mLM and mDM clones are selected to have the ability to seed lymphatic (LN-seeding) or distant (DM-seeding) metastases. mLM and mDM range from 1-10. c | Example simulation in which clones C1 and C6 were selected to have LN-seeding ability, and clone C3 was selected to have DM-seeding ability. Consequently, liver metastases predominantly consist of C3-type cells, while lymph node metastases are a mixture of C1 and C6-type cells. Metastases are sampled, along with random biopsies from the primary tumor (P1 and P2) which cross boundaries between 2-3 adjacent clones. Phylogenetic trees are reconstructed based on the genetic composition of all samples and root diversity scores (RDS) are calculated. d | As in (c) for a different random number of DM- and LN-seeding clones. e | RDS (inter-lesion heterogeneity) and Shannon Diversity Indices for N=20 simulations with 10 LN-seeding and 10 DM-seeding clones. PT, primary tumor; LN, lymphatic metastases; DM, distant metastases. f | As in (e) for 10 LN-seeding and 3 DM-seeding clones. g | As in (e) for 10 LN-seeding and 1 DM-seeding clone. Box plot elements: center line, median; magenta diamond, mean; box limits, lower and upper quartiles; whiskers, lowest and highest value within 1.5 IQR. Error bars in the lower panels show mean and standard deviation.
To determine which ratios of LN- and DM-seeding clones would reproduce our experimental data, we began with a “baseline scenario” in which all 10 clones can seed lymphatic and distant metastases with the same seeding rate of qLM = qDM = 10−8 per cell per day14 (Fig. 3e). To mimic our experimental sampling, we assumed that nLM, nDM and nPT are uniformly distributed between 2 and 6, corresponding to the average sample numbers in our cohorts. As expected, in this baseline scenario we obtained the same RDS distribution for lymphatic and distant metastases. Furthermore, RDSs were high (median of 1), consistent with the fact that all clones were metastasis-competent, resulting in high average metastasis diversity. The design of our model furthermore allowed us to evaluate intra-lesion heterogeneity with the Shannon Diversity Index (SDI, a common measure of species diversity)15. As expected, in the baseline scenario in which all clones have equal metastasis-seeding ability, the SDI was uniformly high in both lymphatic and distant metastases (Fig. 3e, lower panel).
Next, we analyzed additional scenarios in which all clones can seed lymphatic metastases with qLM = 10−8, but distant metastases can only be seeded by 9, 8, 7 … 1 clones. For three DM-seeding clones, the RDSs and SDIs for distant metastases begin to drop visibly (Fig. 3f) and are further depressed if only one clone has DM-seeding ability (Fig. 3g). In order to quantify the parameter combination (ratio of LN-seeding to DM-seeding clones) that best fit our experimental data, we calculated a fold change measure (median RDSLN / median RDSDM) for our combined discovery and validation cohorts and for all simulations. We found that the experimentally measured fold change (7.8) was best explained by LN-seeding to DM-seeding clone ratios between 10:3 (fold change 6.8) and 10:2 (fold change 13.1) (Extended Data Fig. 4).
Lymph node metastases exhibit high intra-lesion diversity
Comparison of inter-metastatic heterogeneity (measured by the RDS) and intra-metastatic heterogeneity (measured by the SDI) in our stochastic model indicated that the two measures are correlated (Fig. 3e–g). This is consistent with relaxed selection leading to more diversity within individual lymph node lesions in addition to polyphyly among different lymph node metastases. To examine this effect in our own data, we searched for evidence of subclonal mixing in our polyguanine genotypes. Amplification of polyguanine tracts leads to a characteristic “stutter distribution” that is created by polymerase slippage during PCR12. Its mode indicates the true genotype of a polyguanine tract in a sample of interest13,16. Normal tissue samples have smooth, unimodal stutter distributions for homozygous polyguanine tracts (Fig. 4a). Cancer samples often contain additional peaks that may indicate the presence of subclones. The higher the diversity of an allele population, the larger the variance of the stutter distribution. Therefore, for loci with normal copy number, the relative variance of the genotype is related to the number of subclones in a sample. Fig. 4a shows genotypes of two loci for normal tissue, a lymph node and a liver metastasis in patient C12 (microsatellite unstable). An increased number of peaks is clearly visible in the lymph node metastasis in comparison with the distant metastasis, resulting in increased variance of the distribution. To evaluate subclonal mixing systematically, we calculated the variance for each marker in each patient sample. Fig. 4b depicts the results of this analysis for patient C12. The variance is significantly lower for distant metastasis genotypes, indicating less allelic diversity compared to lymph node metastases. To summarize data from all patients, we determined the median of the lymph node and distant metastasis variance distributions (Fig. 4b) for each patient and plotted the medians in a paired manner (Fig. 4c). The variance was almost uniformly lower in distant metastases, indicating diminished subclonal diversity in distant vs. lymph node metastases.
Fig. 4: Intra-metastatic diversity is higher in lymph node than in distant metastases.

a | Polyguanine genotypes for markers Nax47 and Nax38 for three samples from patient C12. Local peak maxima and their sizes are indicated with red arrows. var = variance. b | Variance of genotypes in lymph node metastases (N=88) and in the distant metastasis (N=22) of C12, normalized by the average variance in the primary tumor. Every grey dot corresponds to a separate stutter distribution variance as shown in (a). The medians of the lymph node and distant metastasis variances are indicated as dark grey dots and connected by a line. P-value derives from a two-sided Mann-Whitney test. c | Paired medians of lymph node and distant metastasis variances (as in (b)) for microsatellite stable cancers in the Naxerova et al. and validation cohorts. Note that microsatellite unstable cancers are not visualized in this plot, as their variances are much larger (as in (b)), but the paired medians of these cases have nonetheless been incorporated into the p-value (N=24 overall, p=0.002, two-tailed Wilcoxon matched-pairs signed-rank test). d | Polyclonal seeding is expected to lead to a greater diversity transfer from the primary tumor to secondary lesions, resulting in a larger fraction of variants that are shared between the primary and a metastasis than in the case of monoclonal seeding. e | The fraction of shared variants is higher for synchronous locoregional lymph node metastasis – primary tumor pairs than for synchronous distant metastasis – primary tumor pairs in the TRACERx17 renal carcinoma study (p=6e-4, two-tailed Fisher’s exact test). f | The fraction of variants that is subclonal in both the primary tumor and the metastasis is greater in synchronous lymph node metastases than in synchronous distant metastases in the TRACERx cohort (p=0.019, two-tailed Fisher’s exact test). g | The fraction of subclonal variants is greater in synchronous lymph node metastases than in synchronous distant metastases in the TRACERx cohort (p=0.029, two-tailed Fisher’s exact test). h | As in (e), but for synchronous metastasis – primary tumor pairs from Becerra et al.20 (p=0.013, two-tailed Fisher’s exact test). White numbers in panels (e)-(h) denote the total variants in each group.
Next, we extended these intra-lesion heterogeneity analyses to data acquired with other methods. A recent TRACERx renal cell carcinoma study had sequenced pairs of primary tumors and locoregional lymph node or distant metastases17. We began by considering the percentage of shared mutations between primary tumors and metastases. If lymph node metastases develop through more polyclonal seeding than distant metastases, more mutational diversity will be transferred from the primary tumor to the lymph node (Fig. 4d). We have recently derived an exact mathematical model of this transfer process18. Indeed, we found that the fraction of mutations shared with the primary tumor was higher for lymph node than for distant metastases (Fig. 4e). Note that we limited this analysis to synchronous metastases in order to avoid artifacts related to differential metastasis growth times. Since an alternative explanation for these data is that lymph node metastases arise later in tumor evolution than distant metastases, we searched for more direct evidence of polyclonal seeding in the form of mutations that were subclonal in both the metastasis and the primary tumor. Unless these mutations arise independently (which is unlikely), they can only exist if multiple tumor cells seed the metastasis19. The incidence of variants that were subclonal in both sites was significantly higher for lymph node metastases (Fig. 4f). Next, we quantified the size of the evolutionary bottleneck during metastasis formation. Most mutations found in the primary renal carcinomas were subclonal, indicating a high degree of genetic diversity in the ancestral cancer (Fig. 4g). Distant metastases, on the other hand, contained predominantly clonal mutations, demonstrating a heterogeneity reduction consistent with a strict bottleneck (as also noted by Turajlic et al.17). Lymph node metastases occupied an intermediate position between the primary tumor and distant metastases, suggesting a relaxed bottleneck. We also investigated another renal carcinoma cohort with lymph node/distant metastasis-primary pairs and again found that locoregional lymph node metastases shared a significantly higher fraction of variants with the primary tumor (Fig. 4h)20. Therefore, in addition to being polyphyletic, lymph node metastases are polyclonal to a higher degree than distant metastases.
Finally, we wanted to determine whether our findings could be replicated at single cell resolution. We re-analyzed sequencing data from an experiment in which 4T1 cells were transduced with retroviral barcodes21 and injected into murine mammary fat pads. Subsequently, primary tumors, locoregional lymph nodes and samples from the brain, liver, lungs and blood were collected and sequenced to recover barcodes (Fig. 5a). Again, we plotted the SDI for each anatomical site and found that the heterogeneity of lymph node-resident cells was second only to the primary tumor, with a highly significant difference between locoregional lymph nodes and distant organs (Fig. 5b). We investigated the analogous scenario in humans using single cell copy number data from a primary colorectal cancer, locoregional lymph node metastasis, synchronous untreated liver metastasis and a post-treatment liver metastasis (from Bian et al.22) (Fig. 5c). Using the frequencies of subclones defined by their genomic breakpoints22, we again calculated the SDI across different anatomic sites. We observed the same pattern as in the mouse experiment: the primary tumor displayed the highest heterogeneity, the untreated liver metastasis showed the lowest heterogeneity and the lymph node metastasis occupied an intermediate position (Fig. 5d).
Fig. 5: Confirmation of increased intra-metastatic diversity in lymph node metastases at single-cell resolution.

a | Tracing of seeding events with retroviral barcodes. Barcoded 4T1 cells were injected into five mice and allowed to form primary tumors. Barcodes carried by disseminated cells were then recovered from locoregional lymph nodes, circulating tumor cells and distant organs. b | Shannon diversity index of barcodes recovered from different sites. A highly significant diversity drop is observed between locoregional lymph nodes (N=5) and distant organs (N=15) (p=2.2e-16, two-tailed Student’s t-test). Data were obtained from Wagenblast et al.21 c | Single-cell copy number analysis of an untreated human colorectal primary tumor, lymph node metastasis, liver metastasis and post-treatment liver metastasis. Distinct subclones (identified by genomic breakpoints) are shown in different colors and drawn in proportion to their frequency in different sites. Data were obtained from Bian et al.22. d | Shannon diversity index corresponding to the sites shown in (c). e | Summary schematic showing that lymphatic metastases are polyclonal and polyphyletic, while distant liver metastases are monoclonal and monophyletic in colorectal cancer.
Discussion
Our results show that lymph node and distant metastases display considerably different levels of genetic diversity. Lymph node metastases are polyphyletic and polyclonal and develop through a wider evolutionary bottleneck than distant metastases. These observations suggest weaker selection: many cells from the primary tumor appear capable of migrating to and thriving in lymph nodes. Distant metastases, in contrast, are less polyclonal than lymph node metastases and typically form monophyletic groups, indicating the presence of a stricter evolutionary bottleneck (Fig. 5e). Hence, our data support the notion that lymph node and distant metastases develop through fundamentally different evolutionary mechanisms.
The implications of poly- vs. monophyly in lymph node and distant metastases reach beyond the implications of poly- vs. monoclonality. Polyclonality of lymph node metastases is perhaps to be expected and has been observed in colorectal cancer23. Due to their physical proximity to the primary tumor, draining lymph nodes likely receive tumor cells at higher rates than similarly sized areas in distant organs. Hence, even if selective pressures determining survival and outgrowth were uniform across ectopic sites, more tumor cells would contribute to lymph node metastases due to high seeding frequency. In contrast, tumor cells disseminating to distant organs would be much more likely to arrive at a future growth site alone or in small clusters7, with a low probability of other tumor cells arriving at the exact same location. However, this does not explain monophyly of distant metastases. If tumor cells disseminated from primary tumors or lymph nodes and randomly grew out in distant sites, they would likely be monoclonal, but there would be no reason for them to be monophyletic and resemble each other.
Multiple explanations for the high phylogenetic similarity of distant metastases exist. First, metastases may have given rise to each other24–27. Most lesions in our data set were liver metastases and could have formed through intra-hepatic seeding. We consider this explanation unlikely, as many metastases presented in different liver segments, which are independent functional units with separate vascular systems. Furthermore, distinct liver metastases were often connected to their most recent common ancestor by similarly long branches, a pattern that is inconsistent with sequential seeding. Finally, several patients who had metastases in different organs still showed monophyletic origin of these lesions. However, there was one counterexample – ovarian and omental metastases in patient C89 – and cases with metastases in different organs were rare in this study, limiting our ability to generalize. Therefore, we can only say with confidence that liver metastases in colorectal cancer tend to be monophyletic groups and are not obviously formed by intra-hepatic spread.
Another explanation for monophyly of distant metastases is that specific pressures select for a particular subpopulation. Potential examples of such selective pressures are the ability to enter and exit the blood stream28, travel longer distances29, or survive in organ-specific microenvironments30. This possibility is supported by a recent study which showed that distant metastases in different cancer types were more often monophyletic than expected by chance31. The existence of an (epi-) genetically defined metastatic clone has been strongly debated over the years32. Our results motivate a continued search for the molecular traits of this clone.
Online Methods
Root diversity score.
The root diversity score (RDS) denotes the probability that in a cancer phylogeny with n tumor samples, at least l out of m metastases samples form a single clade. We generalized Edwards’ and Cavalli-Sforza’s approach to calculate the number of distinct phylogenies with a given number of samples in which at least l of m metastases samples form a monophyletic group33,34 (Supplementary Note). To obtain the probability that such a phylogeny would evolve by chance, we divide this number of phylogenies by the total number of phylogenies with n tumor samples (see Equation S2 in Supplementary Note). All RDS values are provided in Supplementary Tables 2 and 5.
Tumor samples.
This study was approved by the Institutional Review Board of Massachusetts General Hospital (MGH). We identified suitable patients by searching the MGH pathology database for the terms “carcinoma” or “adenocarcinoma”. Primary colorectal resections were then identified by an automated algorithm on the basis of TNM staging in the final diagnosis, accompanied by any of a series of keywords identifying the resection as colorectal. Staging information was extracted and each patient was linked to all cases matching their medical record numbers. We reviewed the resulting lists manually to identify patients for whom a primary tumor resection was available and who either had multiple positive lymph node metastases or multiple positive distant metastases. We then ordered histological slides and formalin fixed and paraffin embedded tissue blocks from the archives and carefully reviewed them to identify cases which contained sufficient material for sampling (n=17). This cohort was supplemented with two cases (C6 and C11) which we had identified and partially analyzed in a previous technical study on polyguanine profiling12. Furthermore, we obtained additional tissue materials from a case (C57) that was included in the discovery cohort but had to be excluded from all relevant analyses because no lymph node metastases and only one liver metastasis were available for analysis at the time. We were able to obtain tissue blocks of three more liver metastases and completely redid tissue sampling and genotyping for this case. All cases were colorectal adenocarcinomas, with the exception of C97 (a neuroendocrine carcinoma) and C92 (an adenocarcinoma of the small bowel). We grouped together lymph node metastases with residual lymphoid tissue and ”replaced lymph nodes” (tumor deposits) in which no such tissue could be found; these are considered equivalent from a staging perspective. Tumor samples were processed as previously described10. Briefly, tumor cores were obtained with either 1.5- or 2-mm biopsy punches if the tumor was sufficiently bulky and dense. Alternatively, if tumor areas of interest were relatively small, 5-8 μm sections were carefully macrodissected under the microscope. DNA from deparaffinized tissues was extracted with phenol-chloroform and precipitated with sodium acetate. For spatial classification, a board-certified gastrointestinal pathologist (J.K.L) reviewed H&E slides of all 170 primary tumor areas from the discovery and validation cohorts and classified the sampled areas into luminal and deep tumor regions. He followed established anatomical landmarks and international definitions as proposed in the 7th and 8th editions of the American Joint Committee on Cancer (AJCC) staging manual. All tumors in our cohorts were T3 or T4 stage neoplasms. We classified samples taken from mucosal and submucosal regions (corresponding to Tis and T1 stage invasion) as “luminal” and samples taken from the muscularis propria, subserosal and serosal regions (corresponding to T2, T3 and T4 stage invasion) as “deep”. The full classification is available in Supplementary Table 6.
Polyguanine profiling and genotype analysis.
Primer sequences and a detailed PCR protocol for amplification of polyguanine markers can be found in Naxerova et al.10. We designed and validated several new markers for this study; their primer sequences can be found in Supplementary Table 7. Similarly, a very detailed description of the data analysis pipeline is provided in Naxerova et al.10. Briefly, all polyguanine genotypes are acquired in triplicate to ensure reproducibility of the stutter distribution. Genotypes are exported from GeneMapper software as tab-delimited text files and filtered to remove replicates whose intensity is below 10% of the average for that patient and marker, eliminated low quality amplifications. Technical replicates are compared to each other to remove outliers and the most representative replicate is selected for further analysis10.
Phylogenetic reconstruction and k,l,m determination.
To reconstruct a cancer’s evolutionary tree, a distance matrix representing the degree of genetic divergence between sampled tumor areas is constructed. Briefly, pairwise Jensen-Shannon distances are calculated between the representative replicates of all sampled tumor regions for any given marker and patient, summed over all markers and divided by the total number of sampled markers for normalization purposes10. The resulting distance matrix serves as input for tree reconstruction using the classical neighbor-joining method35, implemented in the R package ape36. Branch confidence values are calculating by resampling mutation data (markers) with replacement 1000 times. We furthermore exclude impure samples that have a relatively high level of contamination with normal cells as described previously10. For the present study, we use the same method and impurity cutoffs as for the discovery cohort (fraction of points within the narrow interval around the diagonal <0.45 and ratio of points below and above the diagonal <0.15, see10 for more details), with the only difference that we now exclude markers that are definitely not mutated in the sample of interest and in most other tumor samples (distance to normal for the sample of interest < 0.06 and median distance to normal < 0.06) from the calculation of the two purity statistics, as they contain no useful information about tumor cell content. Finally, as previously, we exclude samples with low quality DNA that fail to produce representative replicates for a large fraction of markers (here: >30%). To collapse full phylogenies to the “one-sample-per-lesion” trees required for the root diversity score calculation, we applied the following rules: (1) Remove all but one normal germline sample from the tree; (2) Remove all non-cancer samples (adenomas) from the tree, as they do not represent genetic heterogeneity within the cancer under investigation and do not give rise to metastases. (3) If all samples from the same metastasis cluster together in one monophyletic clade, remove all but one of these samples. If not all samples from the same metastasis cluster together without other samples intermingling (a rare phenomenon in our cohort), collapse by majority rule, i.e. retain a sample from the clade which contains the largest number of samples from that metastasis. If the majority rule cannot be applied because only two samples are available and they do not cluster in the same clade, treat them as independent lesions. (We only had one example of this scenario in the cohort, C57). In one case (C97), we analyzed three samples from liver metastasis Liv1 (a, b, c) and two samples from liver metastasis Liv2 (a, b). Liv1a, Liv1c (the majority of Liv1 samples) and Liv2a and Liv2b all clustered together in a monophyletic clade, but with intermixing of samples from Liv1 and Liv2, suggesting very high levels of homogeneity between the two metastases. In this case, we reasoned that the fairest approach would be to count them as two lesions only (as counting all 5 samples separately would lead to a perhaps unfairly low RDS) and collapsed the tree to retain Liv1a and Liv2a (Supplementary Fig. 20).
Mathematical model of phylogenetic heterogeneity among metastases.
We used a continuous-time branching process model to mimic the seeding of lymphatic and distant metastases37–39. We consider a primary tumor that reached a carrying capacity of M 108 cells (≈ 1 cm3)40 and consists of 10 equally-sized clones. For simplicity, we assume that all clones contain a number of ubiquitous mutations that are present in all of them and a number of private, non-overlapping mutations that distinguish between them. All clones contain the same number of private mutations. Depending on the considered scenario, mLM clones are randomly selected to have “lymph node metastasis (LN)-seeding ability” and mDM clones are selected to have distant metastasis (DM)-seeding ability. Both mLM and mDM can vary between 1 and 10 in different scenarios. We further model that there are mLM suitable sites where these disseminated cells can survive and expand to form lymphatic metastases and mDM suitable sites where disseminated cells can survive and expand to form distant metastases. Once the LN- and DM-seeding clones have been chosen, they begin seeding lymphatic metastases with a seeding rate of qLM = 10−8 and distant metastases with a seeding rate of qDM = 10−8 per day, respectively14. All other (not chosen) clones seed lymphatic and distant metastases with a rate of 2 * 10−10. After arrival at one of the sites, cells divide with a birth rate of b = 0.25 and die with a death rate of d = 0.241. Once all metastases reach a size of at least M = 108 cells, we record the subclonal composition of all metastases and sample nPT regions of the primary tumor which are a mixture of 2-3 adjacent clones. To mimic the sampling in our own two cohorts, we assumed that nLM, nDM and nPT are uniformly distributed between 2 and 6. We calculate pairwise Euclidian distances between metastases and primary tumor samples based on the observed clone fraction vectors, reconstruct neighbor-joining phylogenetic trees and calculate root diversity scores and Shannon Diversity Indices for lymphatic and distant metastases.
Statistics and other analyses.
TRACERx data were obtained from the supplement of Turajlic et al.17. In that patient cohort, tumor samples were obtained across lesions in a uniform fashion, with the same biopsy punch size, and purity was high across samples. Furthermore, as also reported in the methods of the original paper, sequencing coverage was high and comparable between primary tumor regions and metastases (613x and 567x, respectively). We pooled alteration data from SNVs/INDELs/DNVs and arm level SCNAs and excluded metachronous lesions (all lesions from patients K326, K280, K208, K029, K379 and the lung metastasis from patient K153). Samples labeled “LN” corresponding to paraaortic, aortocaval, paracaval, retroperitoneal or hilar lymph nodes were considered locoregional lymph node metastases, all other non-lymphatic lesions which include lung, liver, bone, adrenal, peri-renal, contralateral renal metastases and tumor thrombi were grouped together as distant metastases for the purposes of figure 4. To analyze the abundance of barcoded tumor cells in different mouse tissues (Fig. 5a,b), we obtained raw fastq files corresponding to different mice and tissue types as well as the library containing the barcodes. Each fastq file was aligned to the library file using the QuasR R package, allowing for one mapping position per read. Subsequently, the library file was read in using the Biostrings package and the aligned reads corresponding to the same barcode were quantified with QuasR. Barcodes were filtered to retain only those that were present in at least one primary tumor sample. The Shannon diversity index for each sample was calculated using the vegan R package. Whole mouse organs were used for the experiments, such that the diversity of barcoded cells present in each organ is faithfully represented in the results. The abundances of individual subclones across different anatomic sites in cancer patient CRC01 (Fig. 5c,d) were obtained directly from the authors. Numbers of cells analyzed for the different lesions were relatively comparable (Primary tumor: 133; Lymph node metastasis: 52, Untreated liver metastasis: 83 ; Treated liver metastasis: 114). Again, the Shannon diversity index was calculated with the vegan R package. Statistical tests used throughout the manuscript were all two-sided. Student’s t-tests were used for normally distributed data, Mann-Whitney tests were used for data that were not necessarily normally distributed and Fisher’s exact tests were used to test for non-random associations between categorical variables. Additional information on used software and experimental design can be found in the Life Sciences Reporting Summary.
Extended Data
Extended Data Figure 1: Distances to tree root (germline).

Mean distances between the root normal sample and samples of primary tumors, lymphatic metastases, and distant metastases, respectively. Distance was measured as the number of internal nodes separating a pair of samples and then normalized by the total number of internal nodes in a given phylogeny. Means are 0.51 for N=16 primary tumors, 0.55 for N=16 lymphatic metastases, and 0.68 for N=16 distant metastases. Box plot elements: center line, median; magenta diamond, mean; box limits, lower and upper quartiles; whiskers, lowest and highest value within 1.5 IQR.
Extended Data Figure 2: Branch lengths to tree root (germline) for the validation cohort.

Comparison of normalized branch lengths from the normal sample to N=107 primary tumor regions, N=86 lymphatic metastases, and N=34 distant metastases in the validation cohort. Branch lengths were significantly different (p=4.9e-7, Kruskal-Wallis test). Branch lengths for distant metastases were significantly longer than for primary tumor samples (mean 0.9 vs 0.75; p=1.8e-7, Conover’s test) and longer than for lymphatic metastases (mean 0.9 vs 0.77; p=1.9e-6, Conover’s test). Box plot elements: center line, median; magenta diamond, mean; box limits, lower and upper quartiles; whiskers, lowest and highest value within 1.5 IQR.
Extended Data Figure 3: Spatial classification of primary tumor biopsies.
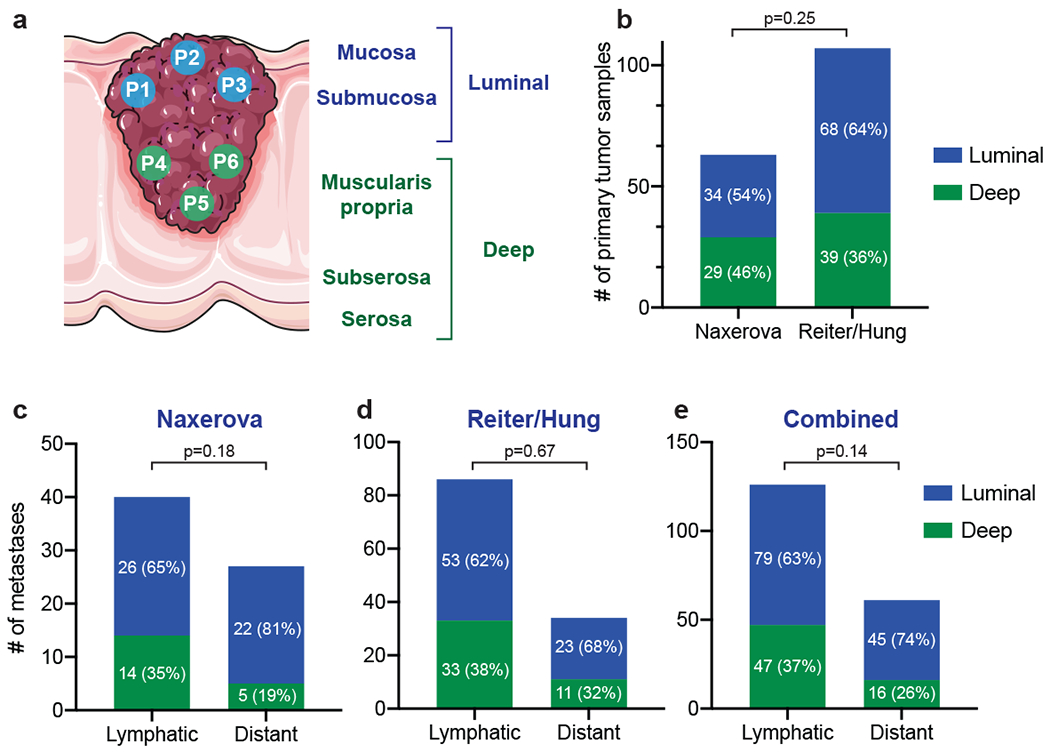
Spatial classification of primary tumor samples. (a) Primary tumor biopsies are classified as luminal or deep by a board-certified pathologist based on established anatomical landmarks. (b) Percentages of luminal and deep primary tumor samples in the Naxerova and Reiter/Hung cohorts. (c) For each lymphatic and distant metastasis, the closest primary tumor sample is found in the polyguanine marker-based distance matrix. Luminal/deep classifications of closest primary tumor samples are plotted separately for lymphatic and distant metastases. (d) As in (c) for the Reiter/Hung cohort. (e) as in (c) and (d) for the combined two cohorts. White numbers in panels (b)-(e) denote the number of samples in each group. Two-tailed Fisher’s exact tests were used to calculate the p-values.
Extended Data Figure 4. Numbers of LN-seeding and DM-seeding clones.

Median RDSLN/RDSDM values for simulations of 10 LN-seeding clones and variable numbers of DM-seeding clones. 100 patients were simulated per parameter combination. The experimentally determined fold change (Naxerova & Reiter/Hung & Kim cohorts) is shown as vertical red line.
Supplementary Material
Acknowledgments.
This work was support by grants from the NIH (R37CA225655), AACR (561314) and NHLBI (HL142494) to K.N. and from NCI (R00CA22999102) to J.G.R. We thank Shuhui Bian, Fuchou Tang and Wei Fu for sharing with us the frequencies of CRC01 subclones across different anatomic sites.
Footnotes
Data availability. Raw polyguanine profiling data and phylogenetic trees for the discovery cohort (Naxerova et al. Science 2017) can be downloaded from datadryad.org (http://dx.doi.org/10.5061/dryad.vv53d). Original whole-exome sequencing data of Kim et al.11 were deposited to the Sequence Read Archive (SRA) at the NCBI under the project ID of PRJNA271316. Raw polyguanine profiling data for the new validation cohort are available from datadryad.org (https://doi.org/10.5061/dryad.9ghx3ffdf).
Code availability. The source code to calculate the RDS as well as to produce various figure panels is available as jupyter notebook at http://github.com/johannesreiter/rootdiversity. The notebooks are implemented in Python 3.6. All required input data are contained in the Supplementary Tables.
Competing interests. The authors declare no competing financial interests.
References
- 1.Jones S, Chen W-D, Parmigiani G, Diehl F, Beerenwinkel N, Antal T, et al. Comparative lesion sequencing provides insights into tumor evolution. Proc. Natl. Acad. Sci 105, 4283–4288 (2008). [DOI] [PMC free article] [PubMed] [Google Scholar]
- 2.Mitchell TJ, Turajlic S, Rowan A, Nicol D, Farmery JHR, O’Brien T, et al. Timing the Landmark Events in the Evolution of Clear Cell Renal Cell Cancer: TRACERx Renal. Cell 173, 611–623.e17 (2018). [DOI] [PMC free article] [PubMed] [Google Scholar]
- 3.Andor N, Graham TA, Jansen M, Xia LC, Aktipis CA, Petritsch C, et al. Pan-cancer analysis of the extent and consequences of intratumor heterogeneity. Nat. Med 22, 105–113 (2016). [DOI] [PMC free article] [PubMed] [Google Scholar]
- 4.Cross W, Kovac M, Mustonen V, Temko D, Davis H, Baker A-M, et al. The evolutionary landscape of colorectal tumorigenesis. Nat. Ecol. Evol 2, 1661–1672 (2018). [DOI] [PMC free article] [PubMed] [Google Scholar]
- 5.Reiter JG, Baretti M, Gerold JM, Makohon-Moore AP, Daud A, Iacobuzio-Donahue CA, et al. An analysis of genetic heterogeneity in untreated cancers. Nat. Rev. Cancer 19, 639–650 (2019). [DOI] [PMC free article] [PubMed] [Google Scholar]
- 6.Priestley P, Baber J, Lolkema MP, Steeghs N, de Bruijn E, Shale C, et al. Pan-cancer whole-genome analyses of metastatic solid tumours. Nature 575, 210–216 (2019). [DOI] [PMC free article] [PubMed] [Google Scholar]
- 7.Aceto N, Bardia A, Miyamoto DT, Donaldson MC, Wittner BS, Spencer JA, et al. Circulating tumor cell clusters are oligoclonal precursors of breast cancer metastasis. Cell 158, 1110–1122 (2014). [DOI] [PMC free article] [PubMed] [Google Scholar]
- 8.Yachida S, Jones S, Bozic I, Antal T, Leary R, Fu B, et al. Distant metastasis occurs late during the genetic evolution of pancreatic cancer. Nature 467, 1114–1117 (2010). [DOI] [PMC free article] [PubMed] [Google Scholar]
- 9.Haffner MC, Mosbruger T, Esopi DM, Fedor H, Heaphy CM, Walker DA, et al. Tracking the clonal origin of lethal prostate cancer. J. Clin. Invest 123, 4918–4922 (2013). [DOI] [PMC free article] [PubMed] [Google Scholar]
- 10.Naxerova K, Reiter JG, Brachtel E, Lennerz JK, van de Wetering M, Rowan A, et al. Origins of lymphatic and distant metastases in human colorectal cancer. Science 357, 55–60 (2017). [DOI] [PMC free article] [PubMed] [Google Scholar]
- 11.Kim T-M, Jung S-H, An CH, Lee SH, Baek I-P, Kim MS, et al. Subclonal Genomic Architectures of Primary and Metastatic Colorectal Cancer Based on Intratumoral Genetic Heterogeneity. Clin. Cancer Res. 21, 4461–72 (2015). [DOI] [PubMed] [Google Scholar]
- 12.Naxerova K, Brachtel E, Salk JJ, Seese AM, Power K, Abbasi B, et al. Hypermutable DNA chronicles the evolution of human colon cancer. Proc. Natl. Acad. Sci. U. S. A 111, E1889–98 (2014). [DOI] [PMC free article] [PubMed] [Google Scholar]
- 13.Salipante SJ & Horwitz MS Phylogenetic fate mapping. Proc Natl Acad Sci U S A 103, 5448–5453 (2006). [DOI] [PMC free article] [PubMed] [Google Scholar]
- 14.Reiter JG, Makohon-Moore AP, Gerold JM, Heyde A, Attiyeh MA, Kohutek ZA, et al. Minimal functional driver gene heterogeneity among untreated metastases. Science 361, 1033–1037 (2018). [DOI] [PMC free article] [PubMed] [Google Scholar]
- 15.Shannon CE A Mathematical Theory of Communication. Bell Syst. Tech. J (1948). doi: 10.1002/j.1538-7305.1948.tb01338.x [DOI] [Google Scholar]
- 16.Salk JJ, Salipante SJ, Risques RA, Crispin DA, Li L, Bronner MP, et al. Clonal expansions in ulcerative colitis identify patients with neoplasia. Proc. Natl. Acad. Sci 106, 20871–20876 (2009). [DOI] [PMC free article] [PubMed] [Google Scholar]
- 17.Turajlic S, Xu H, Litchfield K, Rowan A, Chambers T, Lopes JI, et al. Tracking Cancer Evolution Reveals Constrained Routes to Metastases: TRACERx Renal. Cell 173, 581–594.e12 (2018). [DOI] [PMC free article] [PubMed] [Google Scholar]
- 18.Heyde A, Reiter JG, Naxerova K & Nowak MA Consecutive seeding and transfer of genetic diversity in metastasis. Proc. Natl. Acad. Sci. U. S. A 116, 14129–14137 (2019). [DOI] [PMC free article] [PubMed] [Google Scholar]
- 19.Macintyre G, Van Loo P, Corcoran NM, Wedge DC, Markowetz F & Hovens CM How Subclonal Modeling Is Changing the Metastatic Paradigm. Clin Cancer Res 23, (2017). [DOI] [PubMed] [Google Scholar]
- 20.Becerra MF, Reznik E, Redzematovic A, Tennenbaum DM, Kashan M, Ghanaat M, et al. Comparative Genomic Profiling of Matched Primary and Metastatic Tumors in Renal Cell Carcinoma. Eur. Urol. Focus 4, 986–994 (2018). [DOI] [PMC free article] [PubMed] [Google Scholar]
- 21.Wagenblast E, Soto M, Gutiérrez-Ángel S, Hartl CA, Gable AL, Maceli AR, et al. A model of breast cancer heterogeneity reveals vascular mimicry as a driver of metastasis. Nature 520, 358–362 (2015). [DOI] [PMC free article] [PubMed] [Google Scholar]
- 22.Bian S, Hou Y, Zhou X, Li X, Yong J, Wang Y, et al. Single-cell multiomics sequencing and analyses of human colorectal cancer. Science. 362, 1060–1063 (2018). [DOI] [PubMed] [Google Scholar]
- 23.Ulintz PJ, Greenson JK, Wu R, Fearon ER & Hardiman KM Lymph node metastases in colon cancer are polyclonal. Clin. Cancer Res. 24, 2214–2224 (2018). [DOI] [PMC free article] [PubMed] [Google Scholar]
- 24.Gundem G, Van Loo P, Kremeyer B, Alexandrov LB, Tubio JMC, Papaemmanuil E, et al. The evolutionary history of lethal metastatic prostate cancer. Nature 520, 353–357 (2015). [DOI] [PMC free article] [PubMed] [Google Scholar]
- 25.McPherson A, Roth A, Laks E, Masud T, Bashashati A, Zhang AW, et al. Divergent modes of clonal spread and intraperitoneal mixing in high-grade serous ovarian cancer. Nat. Genet 48, 758–767 (2016). [DOI] [PubMed] [Google Scholar]
- 26.El-Kebir M, Satas G & Raphael BJ Inferring parsimonious migration histories for metastatic cancers. Nat. Genet 50, 718–726 (2018). [DOI] [PMC free article] [PubMed] [Google Scholar]
- 27.Naxerova K & Jain RK Using tumour phylogenetics to identify the roots of metastasis in humans. Nature Reviews Clinical Oncology 12, 258–272 (2015). [DOI] [PubMed] [Google Scholar]
- 28.Valastyan S & Weinberg RA Tumor metastasis: molecular insights and evolving paradigms. Cell 147, 275–92 (2011). [DOI] [PMC free article] [PubMed] [Google Scholar]
- 29.Ryser MD, Min B-H, Siegmund KD & Shibata D Spatial mutation patterns as markers of early colorectal tumor cell mobility. Proc. Natl. Acad. Sci. U. S. A 115, 5774–5779 (2018). [DOI] [PMC free article] [PubMed] [Google Scholar]
- 30.Obenauf AC & Massagué J Surviving at a distance: organ specific metastasis. Trends in cancer 1, 76–91 (2015). [DOI] [PMC free article] [PubMed] [Google Scholar]
- 31.Zhao Z-M, Zhao B, Bai Y, Iamarino A, Gaffney SG, Schlessinger J, et al. Early and multiple origins of metastatic lineages within primary tumors. Proc. Natl. Acad. Sci. U. S. A 113, 2140–5 (2016). [DOI] [PMC free article] [PubMed] [Google Scholar]
- 32.Vanharanta S & Massagué J Origins of Metastatic Traits. Cancer Cell 24, 410–421 (2013). [DOI] [PMC free article] [PubMed] [Google Scholar]
Methods-only references
- 33.Edwards AWF, Cavalli-Sforza L The reconstruction of evolution. Heredity (Edinb). 18, 104–105 (1963). [Google Scholar]
- 34.Felsenstein J Inferring phylogenies. Sinauer Assoc. (2003). doi: 10.1086/383584 [DOI] [Google Scholar]
- 35.Saitou N & Nei M The neighbor-joining method: a new method for reconstructing phylogenetic trees. Mol. Biol. Evol 4, 406–425 (1987). [DOI] [PubMed] [Google Scholar]
- 36.Paradis E, Claude J & Strimmer K APE: Analyses of Phylogenetics and Evolution in R language. Bioinformatics 20, 289–290 (2004). [DOI] [PubMed] [Google Scholar]
- 37.Reiter JG, Makohon-Moore AP, Gerold JM, Bozic I, Chatterjee K, Iacobuzio-Donahue CA, et al. Reconstructing metastatic seeding patterns of human cancers. Nat. Commun 8, 14114 (2017). [DOI] [PMC free article] [PubMed] [Google Scholar]
- 38.Haeno H, Gonen M, Davis MB, Herman JM, Iacobuzio-Donahue CA & Michor F Computational modeling of pancreatic cancer reveals kinetics of metastasis suggesting optimum treatment strategies. Cell 148, 362–375 (2012). [DOI] [PMC free article] [PubMed] [Google Scholar]
- 39.Durrett R Branching Process Models of Cancer. in Branching Process Models of Cancer 1–63 (Springer International Publishing, 2015). doi: 10.1007/978-3-319-16065-8_1 [DOI] [Google Scholar]
- 40.Del Monte U Does the cell number 109 still really fit one gram of tumor tissue? Cell Cycle 8, 505–506 (2009). [DOI] [PubMed] [Google Scholar]
Associated Data
This section collects any data citations, data availability statements, or supplementary materials included in this article.