

Abstract
Cas9 is commonly introduced into cell lines to enable CRISPR/Cas9-mediated genome editing. Here we studied the genetic and transcriptional consequences of Cas9 expression per se. Gene expression profiling of 165 pairs of human cancer cell lines and their Cas9-expressing derivatives revealed upregulation of the p53 pathway upon Cas9 introduction, specifically in TP53-WT cell lines. This was confirmed at the mRNA and protein levels. Moreover, elevated levels of DNA repair were observed in Cas9-expressing cell lines. Genetic characterization of 42 cell line pairs showed that Cas9 introduction can lead to the emergence and expansion of p53-inactivating mutations. This was confirmed by competition experiments in isogenic TP53-WT/TP53-null cell lines. Lastly, Cas9 was less active in TP53-WT than in TP53-mutant cell lines, and Cas9-induced p53 pathway activation affected cellular sensitivity to both genetic and chemical perturbations. These findings may have broad implications for the proper use of CRISPR/Cas9-mediated genome editing.
Neutral genetic manipulations can lead to genetic and transcriptional diversification of cell lines, most likely due to culture bottlenecks associated with such manipulations1,2. However, it is currently unknown whether introduction of specific “neutral” genes can select for the acquisition or expansion of specific genetic alterations. Of particular interest is Cas9 (CRISPR-associated protein 9), which is commonly introduced into cell lines to facilitate genome editing3–5. Whether Cas9 expression itself is sufficient to elicit cellular stress responses remains unknown (Supplementary Note 1).
To test whether Cas9-expressing cell lines (hereinafter: Cas9 lines) differ in any systematic way from their parental lines (hereinafter: WT lines) we performed genome-wide expression profiling of 165 pairs of WT/Cas9 lines, using the L1000 assay6 (Supplementary Data 1). Each line was profiled in 16 technical replicates, and global expression profiles were then compared between WT and Cas9 lines to characterize a Cas9 transcriptional signature (Online Methods). As expected, the expression patterns of all Cas9 lines were similar to those of their parental WT lines, and all of the pairs (165/165) clustered together in an unsupervised hierarchical clustering (Extended Data Fig. 1a). However, significant transcriptional differences were observed when comparing Cas9 and WT lines. The pair-wise transcriptional difference between the groups significantly exceeded the transcriptional variation observed when comparing replicates within each group (Extended Data Fig. 1b). A median of 87 genes (range: 2 to 1,650) were differentially expressed by at least two-fold between pairs (P < 0.05; q < 0.05; Fig. 1a, Table 1 and Supplementary Note 2). Gene set enrichment analysis (GSEA)7,8 revealed that differentially expressed genes often converged on MSigDB Hallmark gene sets (Fig. 1b). Importantly, the transcriptional effect of Cas9 was stronger than that observed in a similar analysis of lines expressing empty or reporter vectors (P = 0.001; Fig. 1b and Extended Data Fig. 1b), and was not merely a reflection of Cas9 infectability (Extended Data Fig. 1c).
Figure 1: Cas9 introduction can activate the p53 pathway.
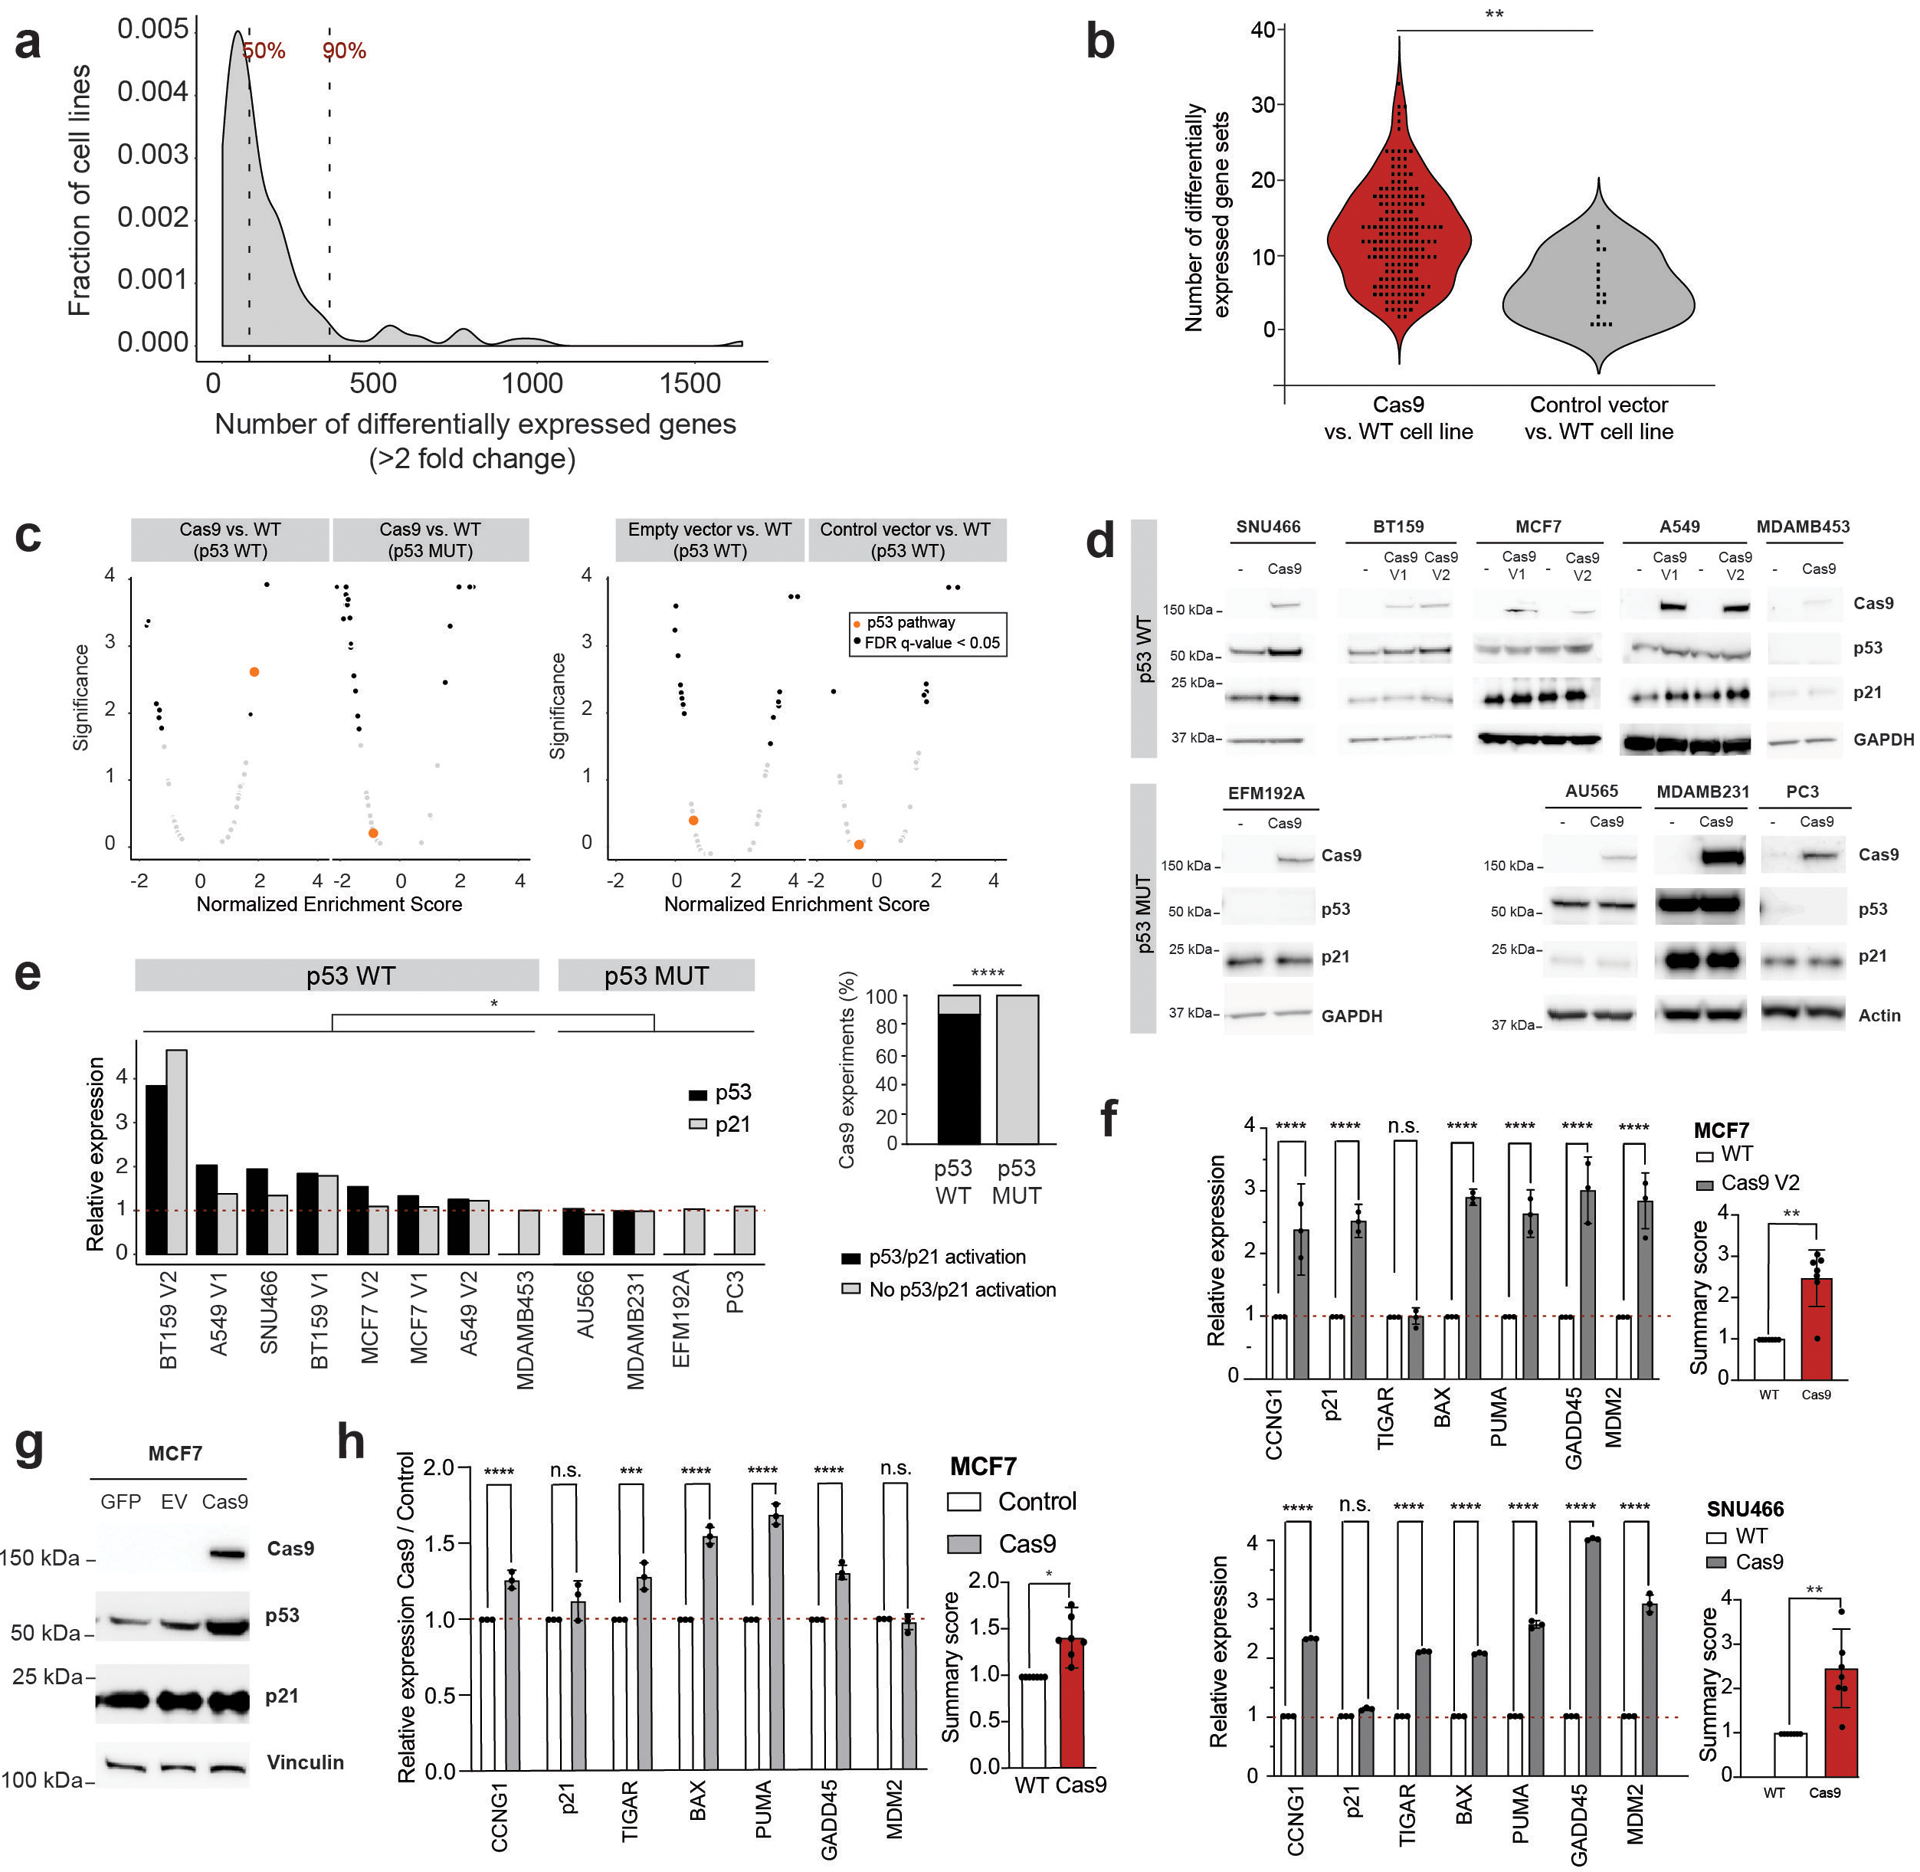
(a) The number of differentially expressed genes (fold change ≥ 2) across 165 Cas9 vs. WT transcriptional signatures. Dashed vertical lines highlight the median (87 genes) and the 90% percentile (389 genes). (b) The number of MSigDB Hallmark biological pathways that are significantly enriched (GSEA enrichment score with multiple hypotheses correction; FDR q < 0.05) following the introduction of Cas9 (red) or empty/control vectors (gray) **, P = 0.001, two-sided Kolmogorov–Smirnov test. Data points represent cell line pairs. (c) The degree and significance of modulation of the 50 MSigDB Hallmark biological pathways, following the introduction of empty vectors, reporter vectors or Cas9 into TP53-WT cell lines, and the introduction of Cas9 into TP53-mutant cell lines. Black, significantly enriched (GSEA enrichment score with multiple hypotheses correction; FDR q < 0.05) pathways. Orange, the p53 pathway. Each plot represents the results of one Aggregate expression signature (see Online Methods). (d) Protein levels of Cas9, p53, p21 and a housekeeping protein in 8 TP53-WT lines and 4 TP53-mutant lines before and after Cas9 introduction. Representative results of 3 independent experiments are shown. (e) Left: WB quantification. Each bar represents a WB shown in (d). *, P = 0.027 and P = 0.024 for p53 and p21, respectively; one-tailed Wilcoxon rank test. Right: The fraction of lines that activated p53 or p21 in response to Cas9 introduction. *, P = 0.01, one-tailed Fisher’s exact test. (f) Left: confirmation of p53 pathway activation in MCF7 and SNU466 by RT-qPCR analysis of 7 p53 transcriptional targets. ****, P < 0.0001, one-tailed t test. Right: the average activation of p53 transcriptional targets. **, P < 0.01, two-sided one-sample t test. (g) Protein levels of Cas9, p53, p21 and a housekeeping protein in MCF7 cells transfected with GFP, Cas9 or a backbone-matched empty vector (EV). Representative results of 3 independent experiments are shown. (h) Left: confirmation of p53 activation in MCF7 cells transfected with Cas9 by RT-qPCR analysis of 7 p53 transcriptional targets. Shown is the relative activation in cells transfected with Cas9 compared to cells transfected with control vectors. ***, P = 0.0002, ****, P < 0.0001, one-tailed t test. Right: the average activation of p53 transcriptional targets. *, P < 0.05, two-sided one-sample t test. For all bar plots: data values, the means of the 7 targets; error bars, S.D.
Table 1:
Summary Table.
| Type of profiling | p53 status | # of unique cell lines | % cell lines w/ >100 genes deregulated (>2X) | % cell lines w/ p53 pathway activation | % cell lines w/ emergence or expansion of a p53 mutation (ΔAF>0.05) |
|---|---|---|---|---|---|
| Gene expression | WT | 43 | 44.2% | 32.6% | NA |
| Mutant | 122 | 43.4% | 9.1% | ||
| WB + RT-qPCR | WT | 5 | NA | 80% | NA |
| Mutant | 4 | 0% | |||
| Targeted DNA sequencing | WT | 14 | NA | NA | 10% |
| Mutant | 26 |
Shown are the number of TP53-WT and TP53-mutant cell lines that were included in each experimental assay, the % of cell lines with > 100 genes deregulated by > 2 fold-change (FC), the % of cell lines with significant activation of the p53 pathway, and % of cell lines with emergence or expansion of a functional TP53 mutation (ΔAF > 0.05).
Next, we asked whether any specific cellular pathways were consistently activated or suppressed in Cas9 compared to WT lines. GSEA revealed a significant activation (P < 0.05; q < 0.05) of the p53 pathway in 25 (15.2%) of the pairs. Importantly, this activation was enriched in TP53-WT lines compared to lines harboring an inactivating TP53 mutation (33% of the TP53-WT pairs vs. 9% of the TP53-mutant pairs, P = 0.0008; Extended Data Fig. 1d). When individual pairwise comparisons of Cas9 vs. WT lines were aggregated to generate a universal signature of Cas9 activation across lines (Online Methods), activation of the p53 pathway was one of the two most significantly activated pathways in the Cas9 lines (together with NF-kB signaling). This was significantly enriched in TP53-WT lines, and was not observed in lines expressing empty or reporter vectors (Fig. 1c, Extended Data Fig. 1e–g Supplementary Data 2 and Supplementary Note 3).
Immunoblotting confirmed p53 pathway activation upon Cas9 introduction into TP53-WT cells. Modestly elevated levels of p53 and/or p21 protein expression were observed in 7 out of 8 independent Cas9 introduction experiments across 5 TP53-WT lines (P = 0.027 and P = 0.024 for p53 and p21, respectively; Fig. 1d,e), but was not detected in 4 independent Cas9 introduction experiments across 4 TP53-mutant lines (P = 0.01 for the comparison between groups; Fig. 1d,e). RT-qPCR analysis confirmed that Cas9 lines – but not lines expressing GFP, luciferase or a DNA barcode – exhibited elevated mRNA levels of multiple p53 transcriptional targets (Fig. 1f, Extended Data Fig. 2a,b and Table 1).
Figure 2: Cas9 introduction is associated with elevated DNA damage.
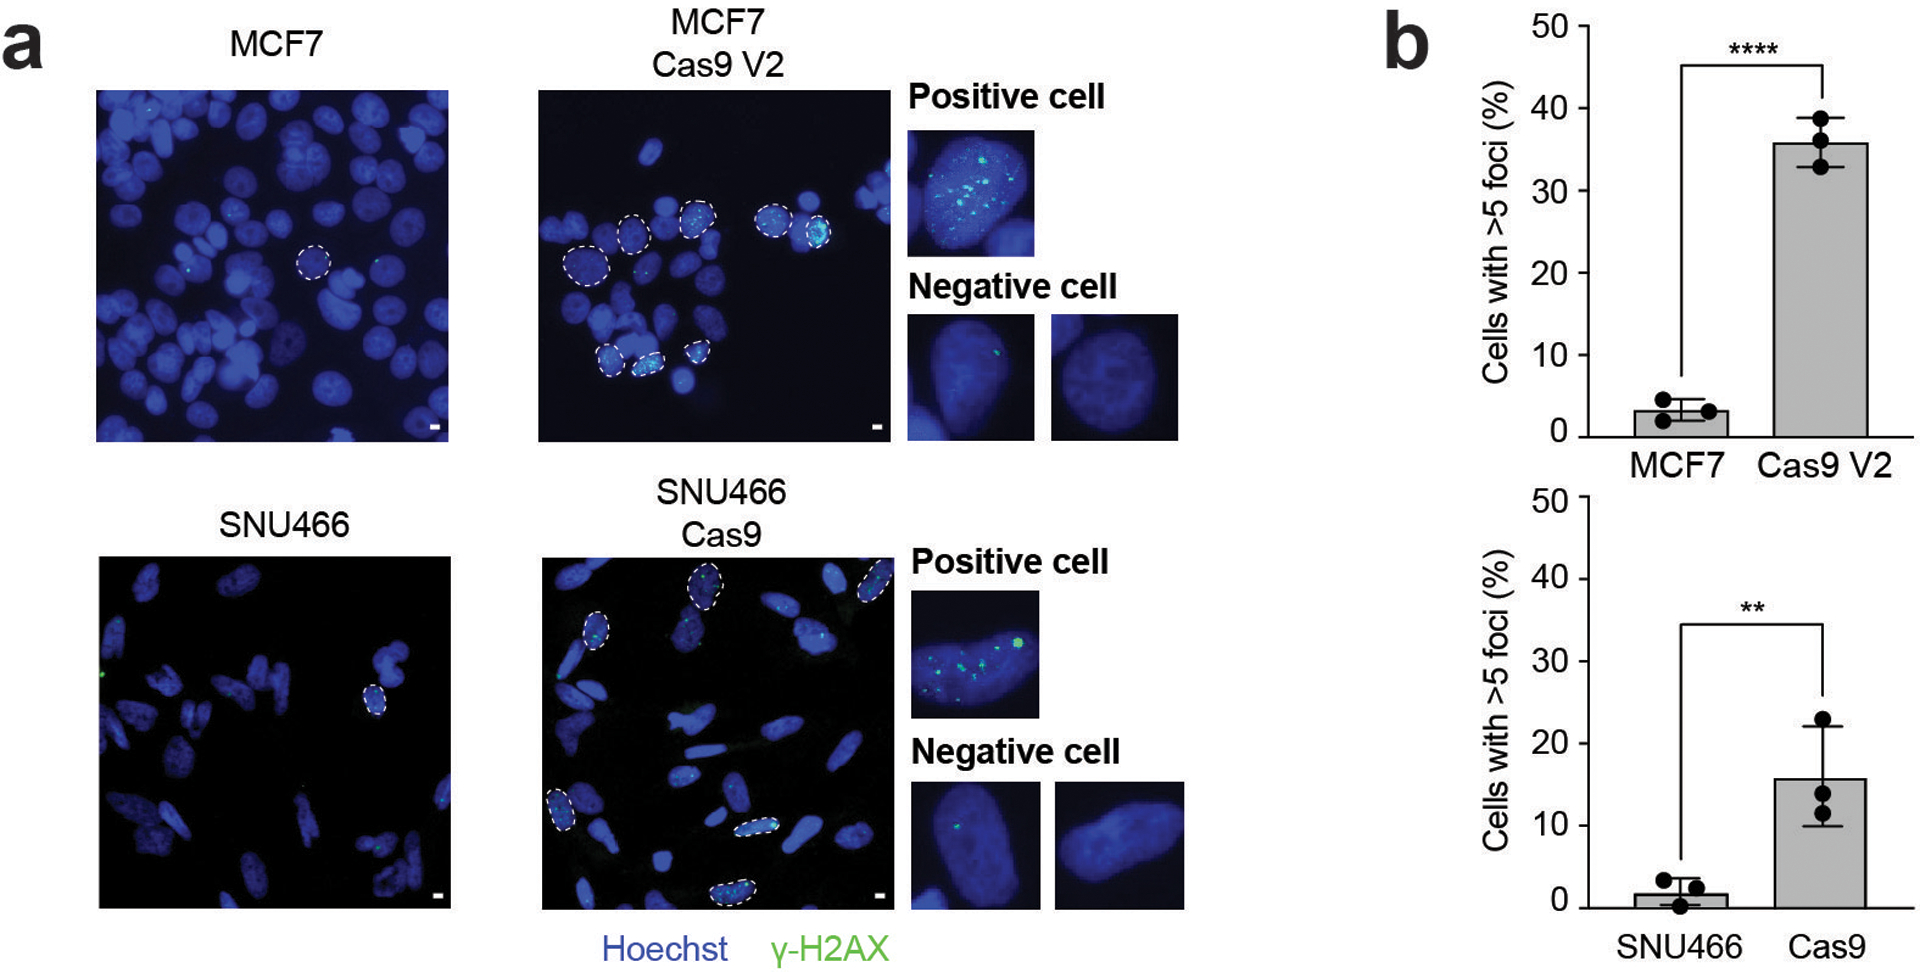
(a) Fluorescent microscopy images of γH2AX foci (green) and DAPI (blue) in WT and Cas9 MCF7 and SNU466 cells. Cells with > 5 foci have been marked in white. Scale bar represents 10 μm. Representative images of three independent experiments are shown. (b) Quantification of γH2AX foci from three independent repeats; n = 841 and n = 1,056 for WT and Cas9 MCF7 cells, respectively; n = 752 and n = 810 for WT and Cas9 SNU466 cells, respectively. P < 0.0001 and P = 0.009, for MCF7 and SNU466, respectively; one-tailed t test. Data values represent the means, with error bars corresponding to S.D.
To further rule out the possibility that the observed p53 activation is merely a consequence of viral transduction, or that it would occur following the overexpression of any gene, we performed the following experiments. First, we transfected the TP53-WT lines MCF7 and HCT116 with either Cas9, GFP or a backbone-matched empty vector. In MCF7 cells, p53 activation was significantly stronger in the Cas9-expressing cells (Fig. 1g,h). In HCT116 cells, we did not observe a significant difference in p53 pathway activity between the different transfections (Extended Data Fig. 2c); however, when we transduced isogenic TP53-WT and TP53-null HCT116 lines9 with viruses carrying either Cas9 or a backbone-matched empty vector, p53 activation was significantly stronger upon Cas9 transduction (and was specific to the TP53-WT cells; Extended Data Fig. 2d,e). Together, these findings demonstrate that Cas9-induced p53 activation cannot be explained by technical noise, by the effect of viral transduction, or by a general selection bottleneck.
The well-established role of p53 in response to DNA damage makes its activation in the context of Cas9 expression particularly interesting (Supplementary Note 4)10–13. Notably, NF-kB signaling was the other top pathway significantly activated specifically following Cas9 introduction (Supplementary Data 2). p53 and NF-kB are the major regulators of the transcriptional response to DNA damage14,15, alluding to a potential involvement of DNA damage in the observed p53 response. Indeed, a DNA repair transcriptional signature7 was positively enriched following Cas9 introduction in 32 (19.4%) of the line pairs, in both TP53-WT and TP53-mutant lines (P = 0.07; Extended Data Fig. 3a). Immunofluorescence of three pairs confirmed that expression of Cas9 increased the number of DNA double-strand breaks, as measured by γH2AX foci (P < 0.0001; Fig. 2a,b and Extended Data Fig. 3b,c).
Figure 3: Cas9 introduction selects for inactivating TP53 mutations.
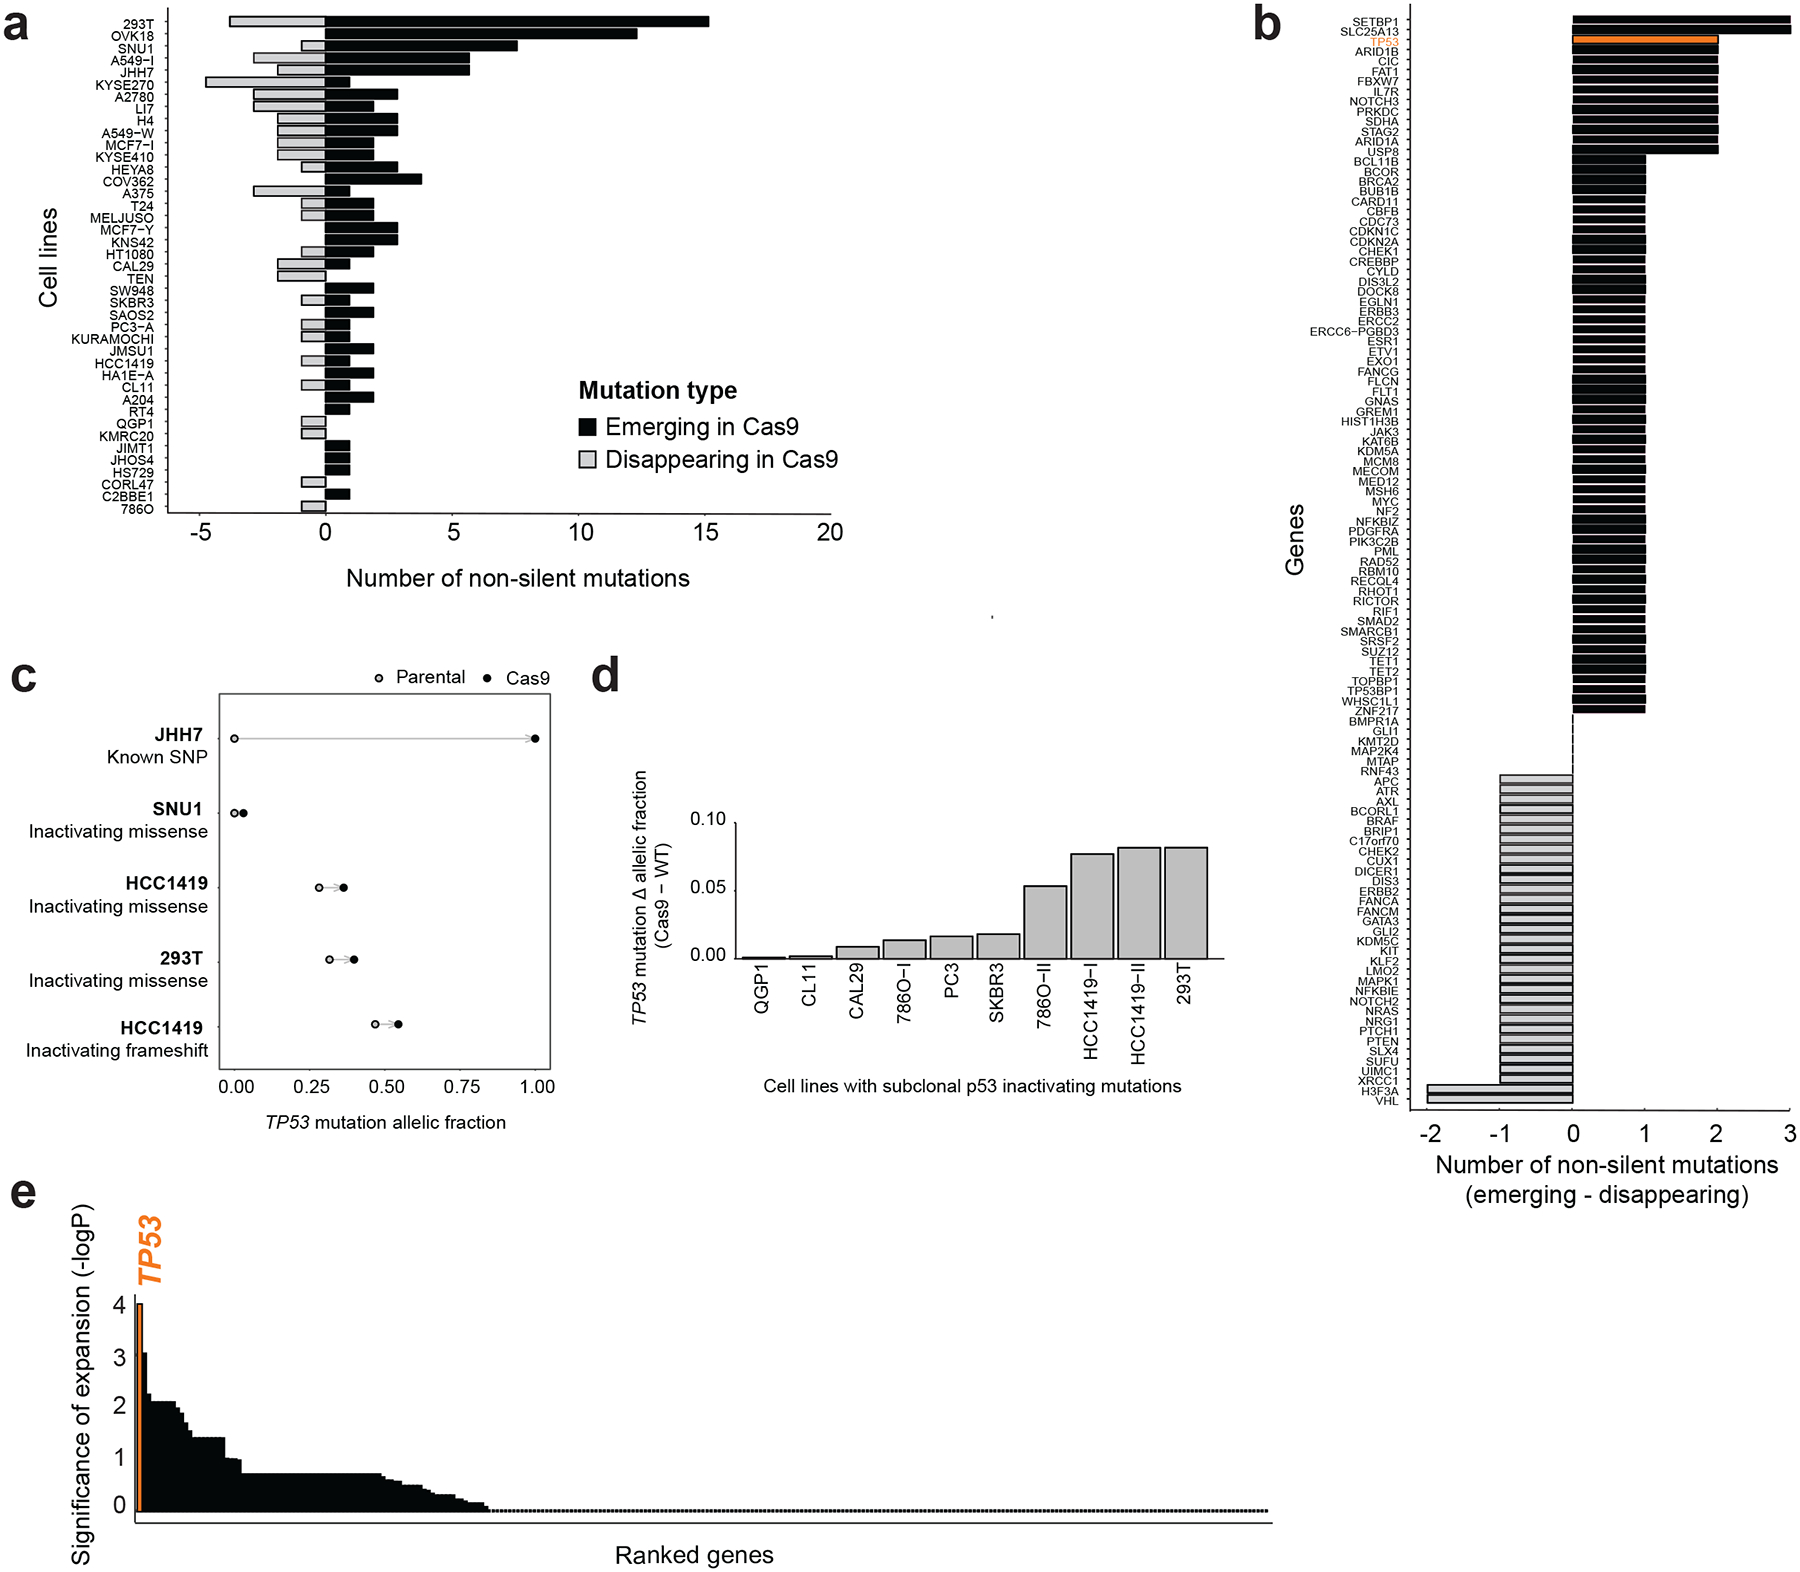
(a) The number of non-silent mutations that differ between the 41 profiled Cas9 lines and their matched WT lines (that is, mutations detected in either the parental or the Cas9 line, but not in both). Emerging mutations are shown in black, disappearing mutations in gray. *, P = 0.01, one-tailed paired t test. (b) Cancer risk genes ranked by their tendency to acquire non-silent mutations in the Cas9 lines. TP53 is highlighted in orange, and is among the top 4% of genes (out of 128 genes with a non-silent mutation present). (c) Changes in the allelic fraction (AF) of 5 non-silent TP53 mutations in four independent cell line pairs. Two of the mutations could not be detected in the parental WT line at all, while the other three were detected at lower AF. (d) Changes in the AF of 10 pre-existing subclonal inactivating TP53 mutations across 8 cell line pairs. *, P = 0.005, one-tailed paired t test. (e) Cancer genes ranked by the significance (based on two-tailed one-sample Wilcoxon rank test) of nonsilent subclonal mutation expansion following Cas9 introduction. TP53 is highlighted in orange, and ranks 1st in this analysis (out of 276 genes).
Activation of the p53 pathway following Cas9 introduction suggests that p53 activity is a barrier that cells need to overcome in order to stably express Cas9. Cas9 introduction might therefore select for p53-inactivating mutations. To test this hypothesis, we characterized point mutations of 447 cancer genes in 42 pairs of WT/Cas9 lines, using deep (283×) targeted exon sequencing16 (Online Methods and Supplementary Data 3). The mutational landscapes of all Cas9 lines were all highly similar to those of their parental counterparts, as expected (Extended Data Fig. 4a,b). When considering only non-synonymous single-nucleotide variants (SNVs) and indels affecting the coding sequence, an average of 2.6 mutations were detected in Cas9 lines but not in their parental WT lines, and an average of 1.3 mutations were detected in WT lines but not in their derivative Cas9 lines (Fig. 3a). This means that Cas9 lines tend to acquire new mutations more often than they tend to lose them (P = 0.003). On average, ~4.5 non-silent mutations in bona fide cancer predisposition genes separated Cas9 lines from their parental WT lines (Fig. 2a, Extended Data Fig. 4c and Supplementary Note 5).
Figure 4: Expansion of inactivating TP53 mutations is accelerated by Cas9 in a cell competition assay.
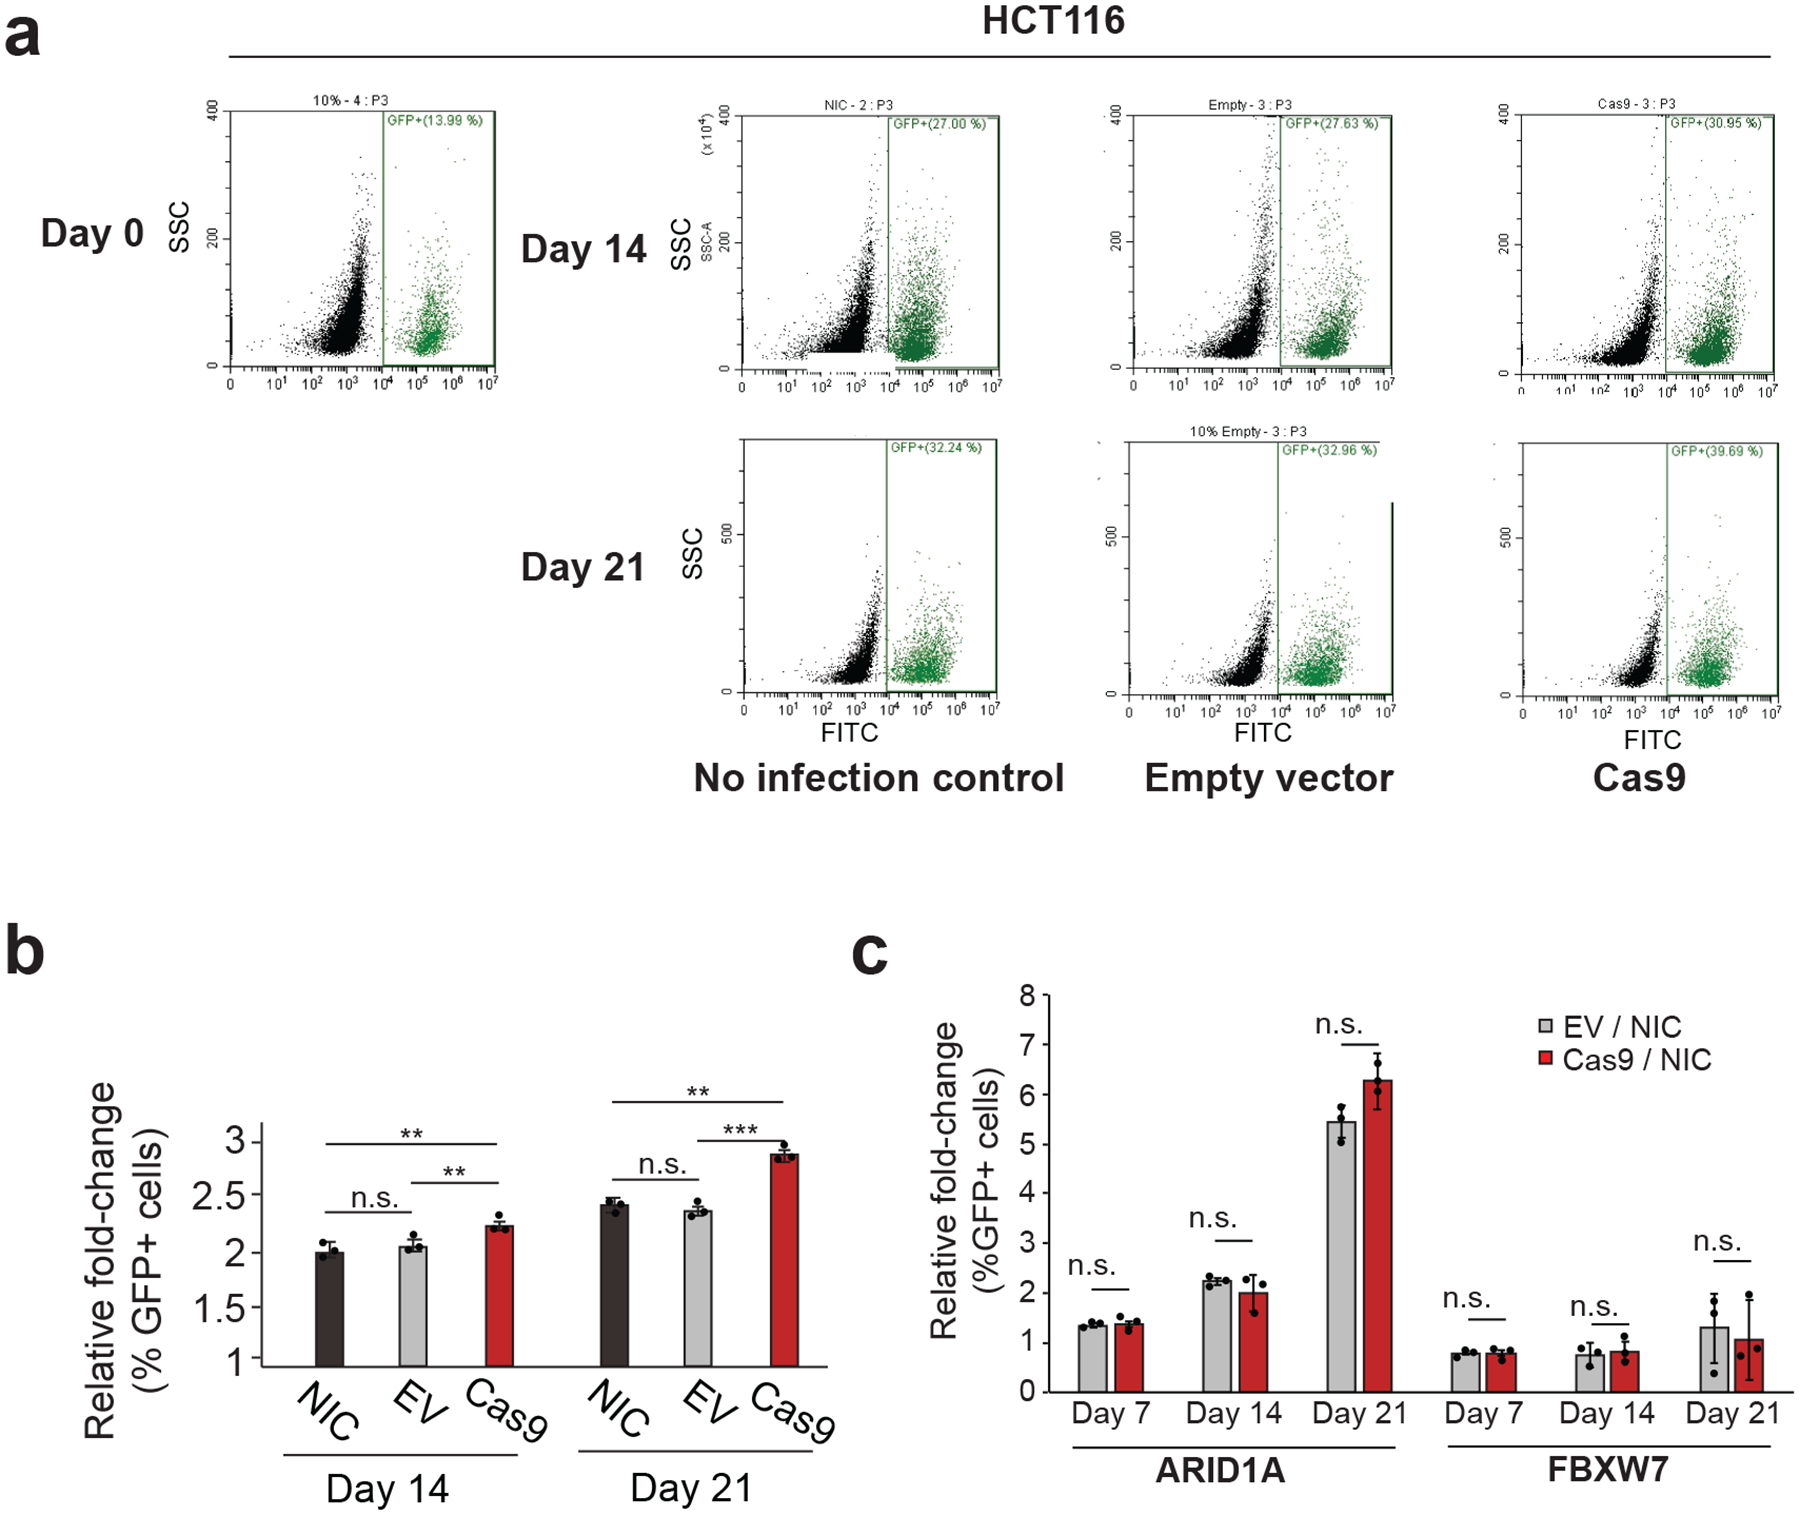
(a) Representative flow cytometry scatter plots, gated by GFP expression. The proportion of HCT116 TP53-null/GFP+ was quantified at day 0, day 14 and day 21 post-infection with backbone-matched empty vector or Cas9 vector, or without infection at all. Representative results of three independent experiments are shown. (b) Quantification of the flow cytometry experiments shown in (a). n = 3 cell culture replicates per condition. At day 14 and day 21, the proportion of TP53-null cells in the population is significantly higher in cells infected with Cas9 compared to the empty vector and no-infection controls. P = 0.003 and P = 0.001 for the comparisons of NIC vs. Cas9 and EV vs. Cas9 at day 14, respectively; P = 0.001 and P = 6.4 ×10⁻⁵ for the comparisons of NIC vs. Cas9 and EV vs. Cas9 at day 21, respectively; two-tailed t test. Data values represent the means of 3 cell culture replicates for each condition at each time point, with error bars corresponding to S.D. (c) Comparison of the cell competition experiments in ARID1A-null and FBXW7-null HCT116 cells. For ARID1A, P = 0.65 and P = 0.34 and P = 0.1 for the comparisons of day 7, day 14 and day 21, respectively; for FBXW7, P = 0.94, P = 0.79 and P = 0.71 for the comparisons of day 7, day 14 and day 21, respectively; two-tailed t test. Data values represent the means of 3 replicates for each condition at each time point, with error bars corresponding to S.D. NIC, no-infection control; EV, empty vector.
TP53 was among the top 4% of genes in its tendency to acquire new mutations upon Cas9 introduction (Fig. 3b). Non-silent TP53 mutations emerged in the Cas9 line of 2 out of the 42 examined pairs, SNU1 and JHH7, and significantly expanded in two additional lines, 293T and HCC1419 (which had two such mutations, both of which expanded; P = 0.008 and P = 0.047; Fig. 3c and Table 1). For JHH7, the mutation was not detected in the parental WT line, but became clonally homozygous (AF = 1) in the Cas9 line (Fig. 3c, Extended Data Fig. 4d and Supplementary Note 6). In three of these four lines (SNU1, HCC1419 and 293T), the mutations that emerged or expanded in the Cas9 line were bona fide inactivating mutations17. Importantly, changes in the opposite direction – i.e., detection of a non-silent TP53 mutation only in the WT line and not in its Cas9 derivative – were never observed (Extended Data Fig. 4e). Moreover, we identified a total of 10 pre-existing subclonal inactivating TP53 mutations in 8 lines, and found a mild but significant (P = 0.005) tendency towards expansion of these mutations in the Cas9 lines (Fig. 3d). Notably, we did not detect a non-silent TP53 mutation emerging or expanding following lentiviral transduction of a reporter or a DNA barcode, in 9 independent experiments across 3 TP53-WT lines (Extended Data Fig. 4f), further supporting the Cas9-specificity of the phenomenon.
To address whether the significant tendency of p53-inactivating mutations to expand following Cas9 introduction is unique to this gene, or common to all/other tumor suppressor genes, we analyzed the allelic fractions of all subclonal non-silent mutations across all 447 genes included in our sequencing panel. The tendency of mutated subclones to expand (increased allelic fraction) was greater for TP53 than for any other gene (Fig. 3e and Supplementary Data 4). Next, we compared the relative abundance of emerging silent vs. non-silent mutations in TP53 and all other genes, to ask whether TP53 is significantly enriched for functional non-silent mutations in comparison to other tumor suppressor genes. The ratio of silent to non-silent emerging mutations in TP53 ranked #5 (that is, top ~1%) of all genes (Extended Data Fig. 4g, Supplementary Data 4 and Supplementary Note 7).
Next, we performed a cell competition assay with the isogenic HCT116 lines: EGFP-labeled TP53-null cells were transduced with viruses carrying either Cas9 or a backbone-matched empty vector, mixed with their isogenic TP53-WT cells (1:8 ratio), and their proportion in the population was monitored over time by flow cytometry. As expected, the proportion of TP53-null cells gradually increased with time. Importantly, this expansion was faster when cells were infected with Cas9 compared to the empty vector and no-infection controls (P = 0.0013 and P = 6.3 × 10⁻⁵, respectively; Fig. 4a,b), indicating that Cas9 increases the adaptive value of p53 inactivation. We repeated the cell competition experiment with two additional tumor suppressor genes, ARID1A and FBXW7 (Supplementary Note 8). In contrast to the Cas9-induced expansion of the TP53-null cells, ARID1A-null and FBXW7-null cells did not expand more quickly following Cas9 introduction compared to the empty vector controls (Fig. 4c). These data demonstrate that Cas9 expression selects specifically for p53-inactivating mutations, rather than for mutations in other tumor suppressor genes.
Based on all previous findings, we predicted that Cas9 activity in TP53-WT lines would be lower, on average, than that in TP53-mutant lines. We therefore compared Cas9 activity between 216 TP53-WT and 482 TP53-mutant lines, using a quantitative functional assay of Cas9 activity18. Indeed, Cas9 activity was significantly lower in TP53-WT lines (P = 3.1 × 10⁻⁵; Fig. 5a and Supplementary Data 5), confirming that p53 activity jeopardizes the efficient expression of Cas9.
Figure 5: Cas9-induced p53 activation can functionally affect genetic and chemical perturbation assays.
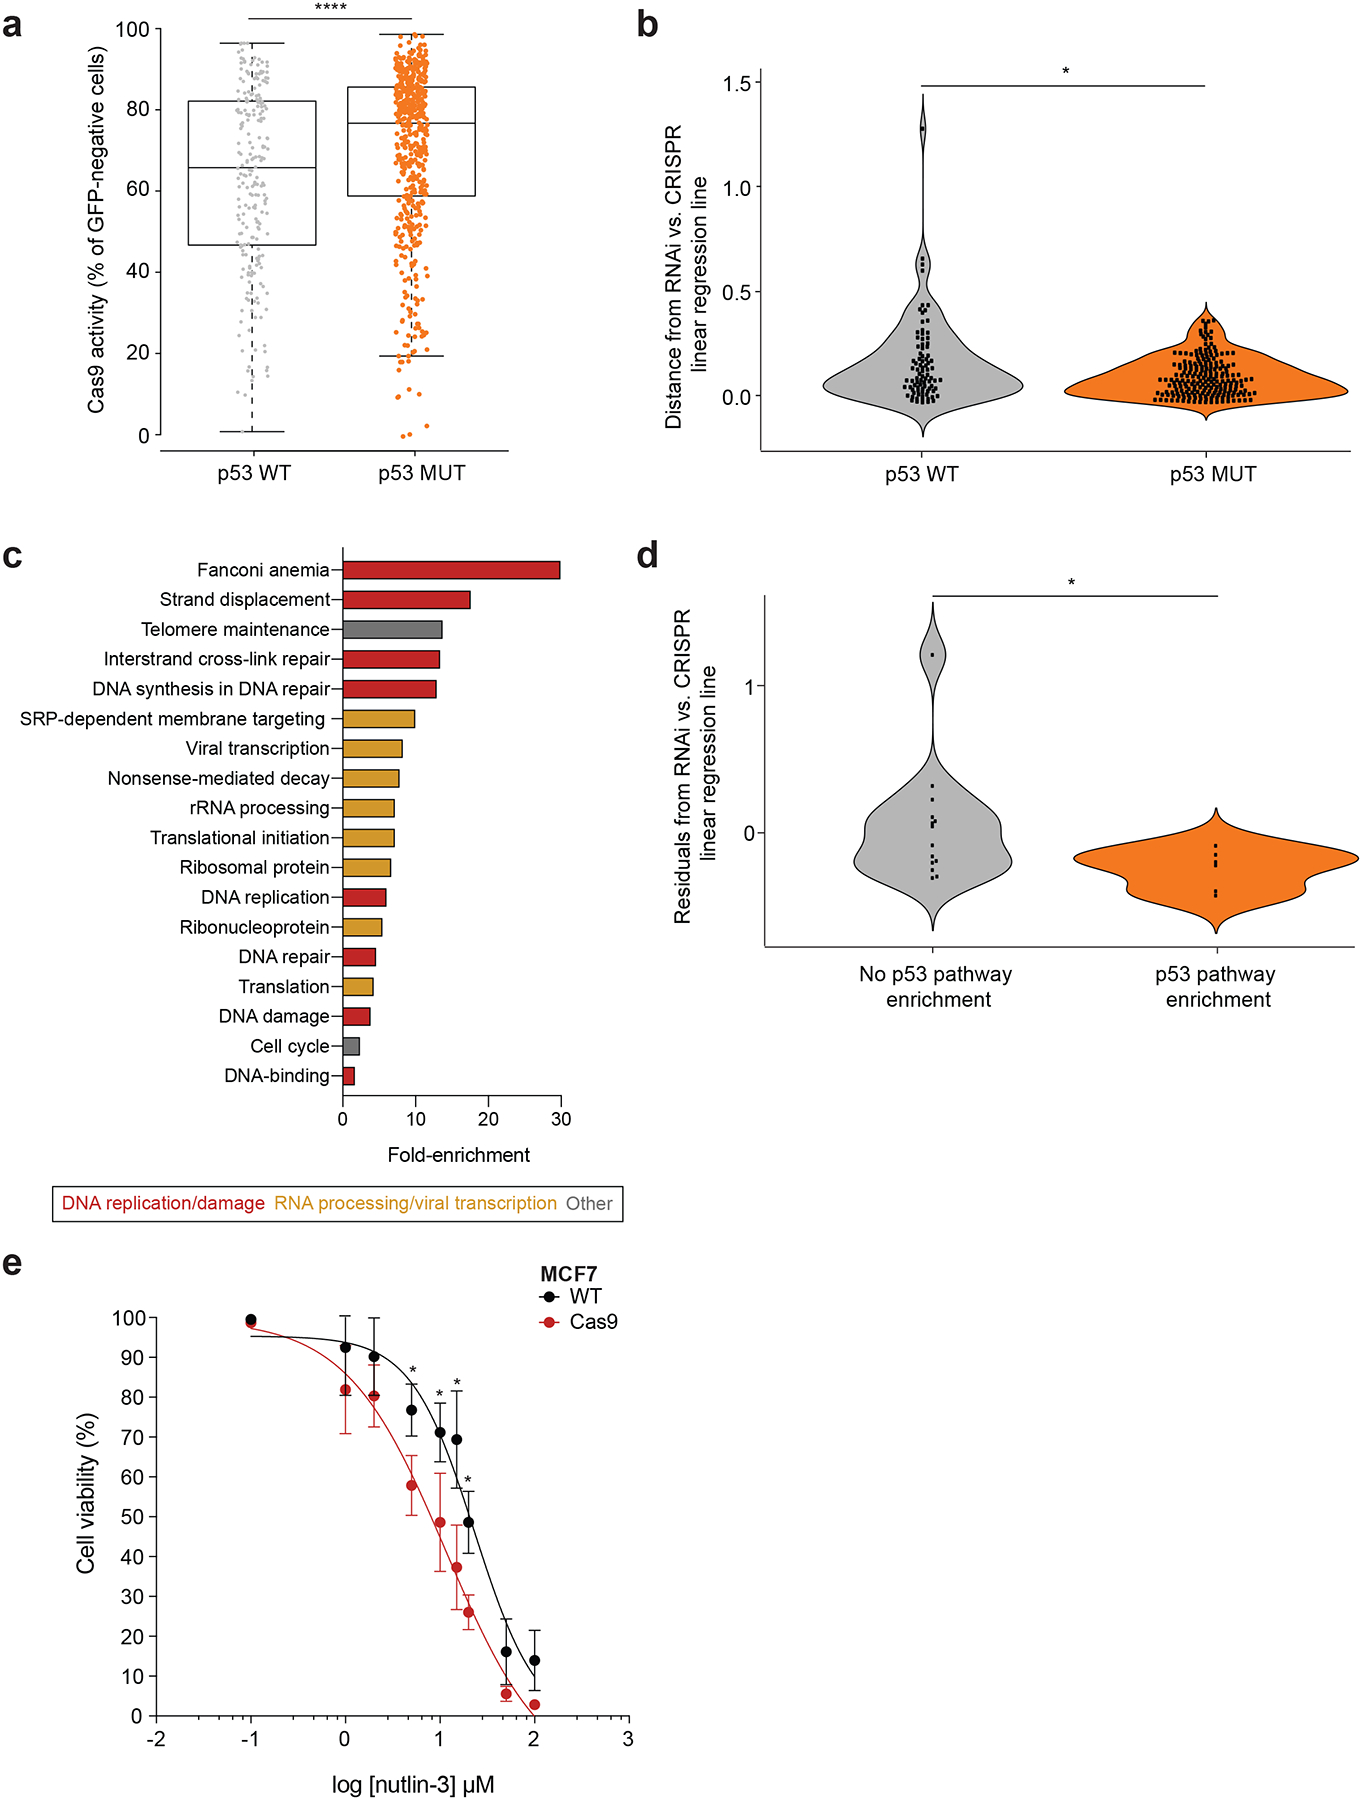
(a) Comparison of Cas9 activity between 216 TP53-WT and 482 TP53-null cell lines, using an EGFP-based Cas9 activity assay20. The higher the fraction of GFP-negative cells, the higher the level of Cas9 activity. Bar, median; box, 25th and 75th percentile; whiskers, 1.5 × interquartile range of the lower and upper quartiles; circles, individual cell lines. *, P = 2.7 ×10⁻⁵, one-tailed t test. (b) Comparison of the concordance between CRISPR and RNAi gene perturbation screens in 86 TP53-WT and 207 TP53-mutant cell lines. Shown is the absolute distance from the CRISPR/RNAi linear regression line: the higher the distance the less concordant the CRISPR and RNAi screens are. *, P = 0.022, one-tailed Wilcoxon rank test. Data points represent cell lines. (c) Gene sets that are significantly enriched (DAVID functional annotation analysis with multiple hypotheses correction; P < 0.01, q < 0.25) in the list of genes that are selectively essential in 86 TP53-WT cell lines in the CRISPR, but not in the RNAi genetic screen. Gene sets are colored by their functional category. (d) Comparison of the concordance between CRISPR and RNAi gene perturbation screens in 20 TP53-WT cell lines that exhibited p53 pathway activation in L1000 Cas9 vs. WT signatures and those that did not. Shown is the distance from the CRISPR/RNAi regression line: negative values represent a stronger proliferation effect of p53 inhibition in CRISPR vs. RNAi screen. *, P = 0.02, one-tailed t-test. Data points represent cell lines. (e) Dose response curves of the response of parental and Cas9-expressing MCF7 cells to the MDM2 inhibitor nutlin-3. *, P = 0.029, P = 0.01, P = 0.0004, and P = 0.0099 for 5 μM, 10 μM, 15 μM and 20 μM, respectively, two-way ANOVA. Data values represent the means of 3 cell culture replicates for each condition at each time point, with error bars corresponding to S.D.
To address whether the phenomenon described in this study has affected previous CRISPR/Cas9 screens, we compared the Broad Institute’s CRISPR/Cas9 and RNAi genetic perturbation screens (Online Methods). The concordance in genetic dependencies between the CRISPR/Cas9 and the RNAi datasets was significantly lower in TP53-WT lines (P = 0.022; Fig. 5b). Next, we performed a functional annotation enrichment analysis on the list of genes that were more essential in the TP53-WT cells in the CRISPR/Cas9 screens, but not in the RNAi screens. This list was significantly enriched for genes related to two major functional categories: 1) DNA replication and DNA damage repair, and 2) RNA processing and viral transcription (Fig. 5c and Supplementary Data 6). This suggests that Cas9-induced DNA damage in TP53-WT cells increased the dependency on functional DNA repair machinery, consistent with a similar recent analysis19. Finally, we compared the dependency on TP53 itself between TP53-WT lines in which p53 pathway activation was identified and TP53-WT lines in which such activation was not observed. The proliferation effect of TP53 CRISPR/Cas9 knockout (relative to TP53 RNAi knockdown) was significantly stronger in lines with Cas9-induced p53 pathway activation (P = 0.02; Fig. 5d). Together, these findings demonstrate that the phenomenon described here has indeed affected previous CRISPR/Cas9 screens.
To further test the functional implications of Cas9-induced p53 activation, we compared the response of parental and Cas9-expressing MCF7 cells to the MDM2-inhibitor nutlin-3. We found a modest, but significant, increase in drug sensitivity in the Cas9-expressing cells (Fig. 5e), consistent with the rest of our findings. We conclude that Cas9-induced p53 activation can affect both genetic and chemical perturbation assays.
In summary, we found that Cas9 expression can elicit activation of the p53 pathway when introduced into human cell lines, leading to the emergence or expansion of inactivating TP53 mutations (ΔAF > 0.05) in ~10% of cases (Table 1). Our findings suggest that Cas9-induced DNA damage may underlie p53 activation, but the molecular mechanisms that lead to this response, as well as those that mitigate it to allow Cas9 tolerance in the absence of genetic selection, remain to be elucidated. While we have not ruled out that some of the observed p53 activation could be attributed to the viral transduction itself20,21, and that the presence of a sgRNA could exacerbate p53 activation further10–12, our findings demonstrate Cas9-specific p53 activation. Albeit mild, this p53 activation is persistent and appears to be sufficient to select for p53-inactivating mutations.
We propose that it is therefore important to carefully investigate p53 status following the introduction of Cas9 into TP53-WT cells, as it may have implications for the interpretation of genetic and chemical CRISPR/Cas9-based screens, as well as for additional applications of the CRISPR/Cas9 technology (Supplementary Note 9 and Extended Data Fig. 5). A recent study suggested that CRISPR-induced p53 activation could be overcome by transient p53 silencing12. Our findings suggest that cells may overcome such p53 activation in another way – by selecting for p53-inactivating mutations – which could have long-term irreversible consequences. Further investigation is required to determine the potential physiological relevance of these findings for CRISPR/Cas9-based therapeutics.
Online Methods
Cell culture.
Description of culture media used for all experiments is available in Supplementary Data 7. All cell lines were maintained at 37°C in 5% CO2. Cas9-expressing versions of all cell lines were generated by lentiviral transduction followed by selection with 4–10 μg/ml blasticidin (Gibco).
Cas9 transduction and transfection.
Human cancer cell lines were transduced with a lentiviral vector expressing the Streptococcus pyogenes Cas9 nuclease under blasticidin selection (pXPR-311Cas9), and Cas9 expression was confirmed with a GFP reporter assay, as previously published2,22,23. For validation experiments, human cancer cell lines were transduced with a lentiviral vector expressing the S. pyogenes Cas9 nuclease under blasticidin selection (pLX311-Cas9) or with an empty vector control (pLX311-empty), and Cas9 expression was confirmed by western blotting. For transfection experiments, cells were transfected with 1 μg of an expression vector expressing GFP (pLX307-eGFP), Cas9 (pLX311-Cas9), or an empty vector control (pLX311-empty) using TransIT®-LT1 Transfection Reagent (Mirus), as per manufacturer’s protocol. After 72 h, cell lysates were collected and subjected to immunoblot analysis.
L1000 data processing.
For each cell line, 16 wells of WT samples and Cas9-expressing samples were processed using the L1000 data processing pipeline, which has been described in depth elsewhere6. Briefly, cells were transferred to 384-well plates and kept in media without additives prior to lysis. 384-well oligo dT-coated Turbocapture plates were used to capture mRNA; after removing lysate and adding a reverse-transcription mix containing MLLV, the plate was washed and a mixture of both upstream and downstream probes (each containing a gene-specific sequence and a universal primer site) for each of the 978 (“Landmark”) genes measured was added. The probes were first annealed to cDNA over a 6-h period, and then ligated together to form a PCR template. After ligation, Hot Start Taq and universal primers were added to the plate, and the upstream primer was biotinylated to allow for later staining with streptavidin-phycoerythrin. Next, the PCR amplicon was hybridized to Luminex microbeads using the complementary and probe-specific barcode on each bead; after overnight hybridization, the beads were washed and stained with streptavidin-phycoerythrin. Luminex FlexMap 3D scanners then used to measure each bead independently, reporting bead color, identity, and fluorescence intensity of the stain; the last of these was converted into median fluorescence intensity values for each of the 978 measured genes using a deconvolution algorithm (resulting in GEX level data). These GEX data were then normalized relative to a set of invariant genes, and then quantile normalized to produce QNORM level data. An inference model was applied to the QNORM data to infer gene expression changes for a total of 10,174 genes, which corresponds to the “BING” (Best INferred Genes) space of genes we report above.
L1000 data quality control.
All samples from the 165 unique cell lines profiled passed internal technical L1000 assay quality control measures described elsewhere6. Additionally, all samples included passed an internal fingerprinting algorithm that verifies the identity of cell lines on L1000 plates by comparing quantile-normalized gene expression data in each well with respect to a ranked reference library of over 1,000 cell lines; samples are defined as passing if their Spearman correlation to their respective reference profile is higher than equivalent correlation values to all other reference cell line profiles.
Generation of transcriptional data dendrograms.
Within each cell line (considering Cas9 and WT cells separately), the median expression value was calculated for each of the 978 directly measured genes. A dendrogram was then constructed from the aggregate of each of these signatures using Euclidean distance and complete linkage hierarchical clustering.
Generation of Cas9 transcriptional signatures.
For individual Cas9 vs. WT transcriptional signatures within a cell line, a signal to noise ratio was calculated for each of the 10,174 genes of QNORM-level data using the following formula: . When the number of samples within a class (Cas9 or WT) was below 10, the within-class standard deviation value was adjusted to to avoid zero values in the denominator. Fold change values were calculated as . Meta Cas9 vs. WT transcriptional signatures within each class of TP53 mutation statuses considered (TP53 WT or TP53 MUT, based on the functional mutation classification reported in Giacomelli et al.17) were composed by taking the median value of the signal to noise ratio for each of the 10,174 genes across cell lines in the TP53 mutation class. Aggregate Cas9 vs. WT transcriptional signatures were composed across all cell lines sharing a TP53 mutation status by calculating a signal to noise ratio as above for each of the 10,174 genes using all samples available for all cell lines in that class.
Generation of control transcriptional signatures.
To control for the possible transcriptional consequences of viral introduction, significant enrichment of pairwise Cas9 vs. WT L1000 signatures was compared to enrichment values of LacZ vs. WT, GFP vs. WT, and empty lentiviral vector vs. WT pairwise signatures. These signatures were composed from previously existing QNORM-level data by identifying untreated (hereafter: WT), LacZ or GFP (hereafter: control vector), and empty vector cell line samples previously used as negative controls in the L1000 NIH LINCS Phase I and II datasets (GSE92742 and GSE70138 on Gene Expression Omnibus respectively). In total, five separate cell lines (A375, HA1E, MCF7, PC3, and VCAP) had sufficient samples of good technical quality per class to compose pairwise transcriptional signatures; as these samples generally came from distinct experimental batches and clustered by project codes, batch effects were removed using the COMBAT algorithm24. 15 pairwise signatures (5 empty vectors vs. WT and 10 control vectors vs. WT) were ultimately generated in each of the available cell lines with sufficient data, as described above.
Gene set enrichment analysis.
Gene Set Enrichment Analysis (GSEA) 8was performed using the best inferred 10,147 genes by the L1000 inference model6. Samples were divided into the pairwise, meta, and aggregate sets of two classes described above (“Generation of Cas9 transcriptional signatures” and “Generation of control transcriptional signatures”) to generate several transcriptional signatures. For each signature, a ranked gene list and signal-to-noise values were used as input for the GSEA preranked module of GSEA, using the Java application (version 3.0). The analysis was run using the curated “Hallmark” signature collection from the Molecular Signature Database (MSigDB)7. Signatures were considered to have p53 activation if the HALLMARK_P53_PATHWAY gene set was significantly positively enriched (FDR q < 0.05), and signatures were considered to have a DNA damage response if the HALLMARK_DNA_REPAIR gene set was significantly positively enriched (FDR q < 0.05).
Deep targeted sequencing.
Prior to library preparation, DNA was fragmented (Covaris sonication) to 250 bp and further purified using Agentcourt AMPure XP beads. Size-selected DNA was ligated to sequencing adaptors with sample-specific barcodes during automated library preparation (SPRIworks, Beckman-Coulter). Libraries were pooled and sequenced on an Illumina Miseq to estimate library concentration based on the number of index reads per sample. Library construction was considered to be successful if the yield was ≥ 250 ng, and all samples yielded sufficient library. Normalized libraries were pooled in batches, and hybrid capture was performed using the Agilent Sureselect Hybrid Capture kit with the POPv3_824272 bait set16. The list of 447 genes included in POPv3_824272 is provided as Supplementary Data 3. Captures were then pooled and sequenced on one HiSeq3000 lane. Pooled sample reads were de-convoluted and sorted using the Picard tools (http://broadinstitute.github.io/picard). The reads were aligned to the reference sequence b37 edition from the Human Genome Reference Consortium using “bwa aln” (http://bio-bwa.sourceforge.net/bwa.shtml), with the following parameters: “-q 5 -l 32 -k 2 -o 1”, and duplicate reads were identified and removed using the Picard tools25. The alignments were further refined using the GATK tool for localized realignment around indel sites (https://software.broadinstitute.org/gatk/documentation/tooldocs/current/org_broadinstitute_gatk_tools_walkers_indels_IndelRealigner.php). Recalibration of the quality scores was also performed using GATK tools (http://gatkforums.broadinstitute.org/discussion/44/base-quality-score-recalibration-bqsr)26,27. Metrics for the representation of each sample in the pool were generated on the unaligned reads after sorting on the barcode (http://broadinstitute.github.io/picard/picard-metric-definitions.html). All samples achieved our target threshold of > 30× coverage for > 80% of the targeted bases. The average mean exon target coverage was 283.17× (range: 92.42×−494.11×). MCF7 and A549 WT/Cas9 pairs were previously characterized2, and analyzed together with all other cell lines. MCF7, A549 and MCF10A cell lines expressing reporter vectors and DNA barcodes were previously characterized1, and used for the analysis presented in Extended Data Figure 2f.
Targeted sequencing data analysis.
Mutation analysis for single-nucleotide variants (point mutations, or SNVs) was performed using MuTect v1.1.428. Indel calling was performed using the SomaticIndelDetector tool in GATK ((http://www.broadinstitute.org/cancer/cga/indelocator). Consecutive variants in the same codon were re-annotated to maximize the effect on the codon and marked as “Phased” variants. MuTect was run in paired mode, pairing all samples to a normal sample, CEPH1408. Mutations were called if detected in > 2% of the reads (AF > 0.02). All SNVs, indels, and phased variants were annotated with Variant Effect Predictor (VEP)29. Variants that affect protein coding regions underwent further filtering/classification based on frequency in the gnomAD, ESP, and COSMIC (version 80) databases. If the frequency of the variant was more than 1% in all gnomAD and ESP populations and if the variant was not present at least twice in the COSMIC database, the variant was considered to be germline (given that no matched normal samples were available). If the frequency of the variant was more than 10% in any of the gnomAD and ESP populations, it was considered to be germline (regardless of its frequency in COSMIC). Non-silent mutations were considered to be those with the following BestEffect Variant Classification: missense, initiator codon, nonsense, frameshift, inframe insertion or inframe deletion. Mutations that appeared more than once in COSMIC were regarded as COSMIC mutations. The complete list of variants (SNVs, indels, and phased) are provided as Supplementary Data 3. TP53 mutations were manually inspected by visualizing the sequencing BAM files in Integrative Genomics Viewer (https://software.broadinstitute.org/software/igv), and the frameshift mutation at location 17:7,579,460 in HCC1419 was updated based on this inspection. To examine the potential expansion of pre-existing inactivating mutations, we considered only somatic missense, nonsense and frameshift mutations present at 0.02 < AF < 0.48 or 0.52 < AF < 0.98 in the parental WT lines. To rank the genes based on the fraction of non-silent mutations out of all emerging mutations, mutations were first filtered to only those whose change in allelic fraction was at least 0.05 and genes were filtered to only those that exhibited at least 5 such mutations. Then, the proportion of non-silent mutations out of all occurring mutations was calculated for each gene.
Generation of sequencing data dendrograms.
A dendrogram was constructed using complete linkage hierarchical clustering for all cell lines profiled with targeted sequencing, where Euclidean distance was calculated between vectors composed of a count value of all mutations in a given gene (if present) or zero values (for non-mutated genes in the sequencing panel) within each cell line (considering Cas9 and WT samples separately).
Pairwise detection of mutation emergence and disappearance.
Mutations were determined to be acquired in Cas9 (present in Cas9 but not the WT sample of a cell line) or removed in Cas9 (present in the WT but not Cas9 sample of a cell line) at three levels of mutation-calling stringency: all mutations, non-silent mutations (variants classified as frameshifts, inframe deletions, inframe insertions, initiator codons, missense, nonsense, splice acceptors or splice donors), and mutations in the Catalogue of Somatic Mutations in Cancer30 (COSMIC; variants with COSMIC count > 2), and a gnomAD31 population frequency percentage below 1% in both African-American and European populations. Within a given cell line, a given mutation in a gene was considered ‘emerging’ in Cas9 if its specific cDNA change was present in the Cas9 sample but not in the WT sample, and was considered ‘disappearing’ in Cas9 if its specific cDNA change was present in the WT sample but not in the Cas9 sample.
Dependency Map data analysis.
The Data Explorer tool from the DepMap portal (depmap.org/portal) was used to download CERES-corrected CRISPR (Public 19Q3) and RNAi dependency scores (DEMETER2, Broad) corresponding to TP53 dependency scores in 326 cell lines with both CRISPR and RNAi annotations32–34. These data were fitted with a linear regression line, and then differences in residuals for TP53-WT vs. TP53-MUT cell lines were compared using a one-sided Wilcoxon rank test. Dependency data was also subsetted to only include TP53 WT cell lines overlapping with available transcriptional data (n = 20 cell lines), and the same analysis of linear regression residuals was performed again, this time comparing cell lines whose transcriptional signature was positively enriched for the Hallmark p53 gene set vs. cell lines without such enrichment, using a one-sided Wilcoxon rank test. To analyze the genes with significantly different dependency scores between TP53-WT and TP53-mutant cell lines, CERES-corrected CRISPR (Public 2019Q3) and RNAi (DEMETER2, Broad) dependency data were obtained from the DepMap portal and subsetted to overlapping cell lines and genes (n = 326 and n = 15,468, respectively). For each gene, a one-sided Wilcoxon rank test was performed comparing dependency scores in the TP53-WT and TP53-mutant lines in which scores were available for CRISPR and RNAi perturbations separately, and P values were corrected using the Benjamini-Hochberg (FDR) adjustment. Genes that were significantly (adjusted P < 0.1) more essential in TP53-WT than in TP53-mutant cell lines in the CRISPR but not (adjusted P > 0.1) in RNAi were determined. This gene list was subjected to a functional annotation enrichment analysis using the DAVID functional annotation tool35, with the list of genes included in the CRISPR and RNAi screens serving as a background list.
Immunoblotting.
Cells were lysed with RIPA lysis buffer (25 mM Tris-HCl at pH 7.6, 150 mM NaCl, 1% NP-40 and 0.1% SDS) and centrifuged at 15,000 × g at 4 °C for 15 min. Protein concentration was determined by the BCA assay (Novex®, Life Technologies). Thirty μg of each sample and a PageRuler™ Prestained protein ladder (Thermo Scientific) were loaded on a NuPAGE® 4–12% Bis-Tris gradient gel with 1× NuPAGE® MOPS running buffer (Novex®, Life Technologies) and separated at 150 V for 1 h. Next, a dry transfer was done at 20 V for 6 min using PVDF mini stacks in an iBlot 2 instrument (Thermo Fisher Scientific). The membrane was blocked in 5% dry milk in TBS-T for 30 min and immunoblotted overnight at 4°C with primary antibodies against Cas9 (#14697, CST), p53 (#9282, CST), p21 (#2947, CST), β-actin (sc-47778, Santa Cruz Biotechnology), GAPDH (#5174, CST) and vinculin (V9131, Sigma-Aldrich) diluted 1:1,000 in PBS containing 5% milk. The membrane was washed in TBS-T and further incubated for 1 hour with goat anti-rabbit and goat anti-mouse secondary antibodies (sc-2027 and sc-2025, Santa Cruz Biotechnology) diluted 1:10,000 in TBS-T containing 5% milk. Signal detection was performed with the SuperSignal West Femto and Pico kits (Thermo Scientific) in the ImageQuant LAS 4000 imager (GE Healthcare Life Sciences).
Real-Time Quantitative PCR analysis.
Total RNA was extracted from cell lysates using the RNeasy Mini Kit (Qiagen). First-strand cDNA synthesis was performed with 2 mg of RNA following the M-MLV Reverse Transcriptase protocol (Thermo Fisher Scientific). Briefly, samples were mixed with 250 ng random primers, 10 mM dNTPs and heated at 65°C for 5 min. Next, 5× First-Strand Buffer (Invitrogen), 0.1 M DTT, RNaseOUT Recombinant Ribonuclease Inhibitor (40 units/ml) and M-MLV Reverse Transcriptase (200 units/ml) were added to each tube. The synthesis reaction was continued by incubation at 25°C for 10 min, followed by 37°C for 50 min and 70°C for 15 min. To measure gene expression, 500 ng of cDNA were amplified in 20 ml reactions including 1× Maxima SYBR Green/ROX qPCR Master Mix (Thermo Fisher Scientific) and 0.3 mM of forward and reverse primers. Primers used for the amplification of p53 transcriptional targets have been previously reported36, using β-actin as an internal reference gene. Data were analyzed by the ΔΔCt method in the StepOne™ Software v2.1 (Thermo Fisher Scientific).
Immunofluorescence analysis.
Cells were seeded in 3-well slides (Electron Microscopy Science) the day before the experiment. After washing with DBPS containing Ca2+ (DBPS/Ca2+), cells were fixed with 4% paraformaldehyde at room temperature for 20 min. Following washes with DBPS/Ca2+, cells were permeabilized with 0.5% Triton-X-100 in PBS at room temperature for 10 min. Next, blocking buffer (5% BSA in TBS) was added, and slides were incubated at room temperature for 1 h. For the detection of DNA damage, a primary rabbit antibody against γ-H2AX (#9718, Cell Signaling Technology) was used at a 1/400 dilution. The slides were incubated at room temperature for 2 h and washed in DPBS/Ca2+. Next, secondary rabbit AF 488 antibody (A-21206, Thermo Fisher Scientific) and Hoechst (H3570, Thermo Fisher Scientific) for nuclei counterstaining were added at a dilution of 1/500 and 1/10,000 respectively. After incubation at room temperature for 1 h, samples were washed with DPBS/Ca2+ and mounted using ProLong Diamond Antifade Mountant solution (P36970, Thermo Fisher Scientific). Slides were stored in the dark and visualized in a Revolve microscope (Echo Laboratories). Cells were scored as positive for DNA damage if > 5 foci per cell were detected for phospho-histone H2AX.
Cell competition assay.
Isogenic TP53-WT and TP53-null HCT116 cell lines were purchased from Horizon. Knockout of TP53 in these cell lines was achieved through homologous recombination of targeting vectors9. The status of p53 was confirmed by western blotting. TP53-null cells were transduced with a lentiviral vector expressing the EGFP under puromycin selection (pLX317-eGFP), and GFP expression was confirmed by flow cytometry. GFP-expressing TP53-null cells were mixed with TP53-WT cells in a 1:8 ratio, and transduced 24 h later with either Cas9 (pLX311-Cas9) or a backbone-matched control vector (pLX311-empty) under blasticidin selection. Cas9 expression was confirmed by western blotting. The ratio of green (TP53-null) to non-green (TP53-WT) cells was quantified throughout time using a CytoFLEX Flow Cytometer (Beckman Coulter). Both data acquisition and data analysis were performed on the CytoFLEX machine. A figure exemplifying the gating strategy is provided as Supplementary Figure 1.
Drug response assay.
MCF7 cells were seeded at a density of 9,000 cells per well in a 96-well plate. The next day, medium was washed and fresh medium containing nutlin-3 (Sigma-Aldrich) was added to the corresponding wells in a concentration range of 0 μM – 100 μM. After 72 h of incubation, levels of ATP were measured as a surrogate marker for cell viability using the CellTiter-Glo assay (Promega). Luminescence measurements were acquired in a SpectraMax reader (ATC) using an integration time of 500 ms.
Statistical analyses.
The significance of the differences in transcriptional activity scores was determined by a two-tailed t test. The significance of the difference in the number of enriched MSigDB Hallmark signatures between the introduction of Cas9 and that of control/empty vectors was determined by a one-sided Kolmogorov-Smirnov test. The significance of enrichment values was determined using a false discovery rate measure8. The significance of the differences in the transcriptional enrichment of the p53 and the DNA repair MSigDB Hallmark signatures between TP53-WT and TP53-mutant cell lines, and between Cas9 and empty/reporter vectors, were determined by a two-tailed Fisher’s exact test. The significance of the difference in p53 and p21 protein expression levels between TP53-WT and TP53-mutant cell lines, and that of the differences in the concordance between CRISPR and RNAi screens in TP53-WT and TP53-mutant cell lines, were determined by a one-tailed Wilcoxon rank test. The significance of the difference between the fraction of line showing activation following Cas9 introduction was determined by a one-tailed Fisher’s exact test. The significance of the differences in mRNA levels of p53 targets between WT and Cas9 lines, and that of the difference in Cas9 activity between TP53-WT and TP53-mutant cell lines, were determined by a one-tailed t test. The significance of the difference in the overall activation of p53 transcriptional targets was determined by a two-tailed one-sample t test. The significance of the tendency of non-silent mutations to emerge was determined by a two-tailed one-sample Wilcoxon rank test. The significance of the differences between the number of mutations emerging in the Cas9 lines and the number of mutations disappearing in the Cas9 lines, that of the differences in the allelic fraction of pre-existing subclonal inactivating TP53 mutations, and that of the difference between the number of γH2AX foci, were determined by a one-tailed paired t test. The significance of the expansion of TP53 mutations in HCC1419 was determined by a binomial test, based on the allelic fraction of each mutation in the WT line. The cell line Cas9 activity levels (Supplementary Data 5) were correlated with the cell line transcriptional activity scores (TAS, as defined in6) using a two-sided test for association using Spearman’s rho. The significance of the differences in nutlin-3 sensitivity were determined using a two-way ANOVA test.
Code availability.
All the code used to generate and/or analyze the data is publicly available.
Software packages.
L1000 data were analyzed using the ‘cmapR’ package (v1.0.1)37; sequencing data were analyzed using the software described above; all other data were processed and graphed using the ‘tidyverse’ suite of R packages (v1.2.1; https://peerj.com/preprints/3180/) and ‘ggpubr’ (v0.2; https://rpkgs.datanovia.com/ggpubr/index.html). Dendrograms and statistical tests were performed using the ‘stats’ package (v3.5.2)38, and analyses involving R were performed using R v3.5.039. GSEA analysis was run using Java 1.8 and version 3.0 of the GSEA Java application.
Data availability.
All datasets are available within the article, its Supplementary Information, or from the corresponding authors upon request. DNA sequencing data were deposited to SRA (https://www.ncbi.nlm.nih.gov/sra) with BioProject accession number PRJNA545458. Gene expression data were uploaded to the following URL: https://clue.io/data/XPR_BASE#CAS9_BASELINE. Source Data of all immunostaining blots are available in the online version of this paper.
Extended Data
Extended Data Fig. 1. Cas9 introduction activates the p53 pathway (related to Figure 1).
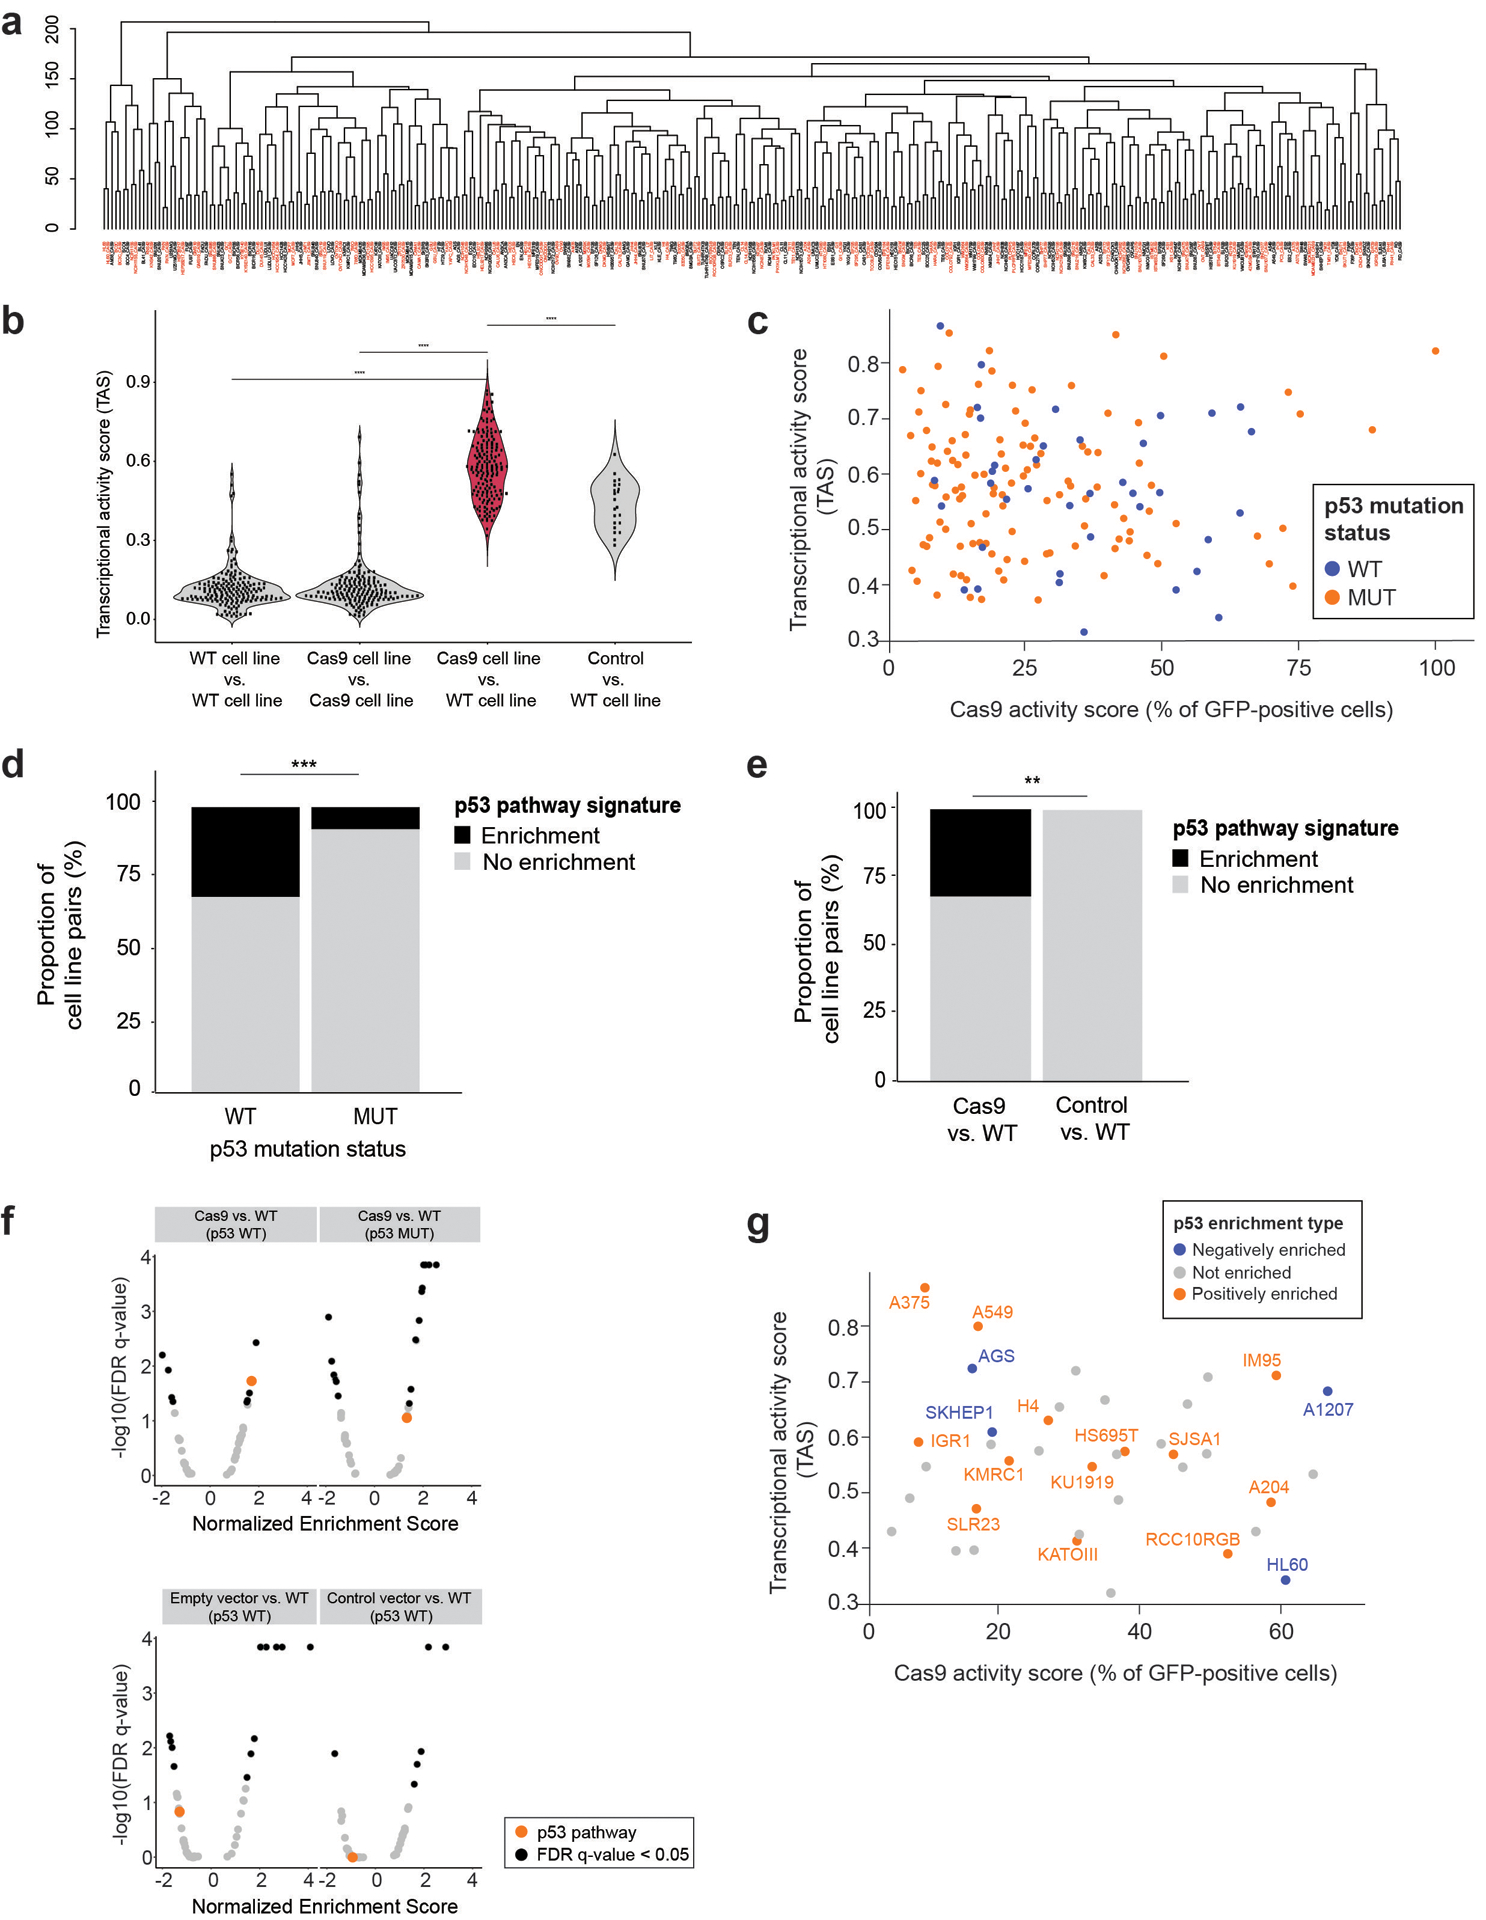
(a) Unsupervised hierarchical clustering of 165 WT/Cas9 cell line pairs, based on their median L1000 transcriptional profiles (landmark space, n = 978 genes). Cell line pairs are colored in red and black, alternately, to highlight that all Cas9 lines cluster together with their parental WT lines. (b) Transcriptional activity scores (TAS)6 comparison of technical replicates of 165 parental lines, 165 technical replicates of Cas9 lines, 165 Cas9 lines vs. parental lines, or 22 control vector lines vs. parental cell lines. *, P < 2 × 10⁻¹⁶, P < 2 ×10⁻¹⁶ and P = 2.5 × 10⁻⁷, two-tailed paired t test. Data points represent cell line pairs. (c) Lack of correlation between Cas9 activity levels (measured by GFP levels; see Online Methods) and the strength of the transcriptional response (measured by TAS). P = 0.68, two-tailed test for association using Spearman’s rho. 158 lines are colored by their TP53 mutation status; 7 lines excluded due to lack of Cas9 activity data. (d) The proportion of lines (n = 165) with an activated p53 pathway activity following Cas9 introduction, in TP53-WT vs. TP53-mutant cell lines. *, P = 0.0007, two-tailed Fisher’s exact Test. (e) The proportion of TP53-WT lines (n = 61) with an activated p53 pathway activity following Cas9 or empty/reporter vector introduction. *, P = 0.006, two-tailed Fisher’s exact Test. (f) The degree and significance of enrichment of the 50 MSigDB Hallmark biological pathways, following the introduction of empty vectors, reporter vectors and Cas9 into TP53-WT cell lines, and the introduction of Cas9 into TP53-mutant cell lines. Black, significantly enriched (GSEA enrichment score with multiple hypotheses correction; q < 0.05) pathways. Orange, the p53 pathway. Each plot represents the results of one Meta expression signature (see Online Methods). (g) Comparison of Cas9 activity levels and TAS, as in (d), but only 40 available TP53-WT lines are presented. Cell lines are colored by whether their gene expression profiles were enriched for the p53 Hallmark gene set (and in which direction). P = 0.30, two-tailed test for association using Spearman’s rho.
Extended Data Fig. 2. Confirmation of p53 activation following Cas9 introduction (related to Figure 1).
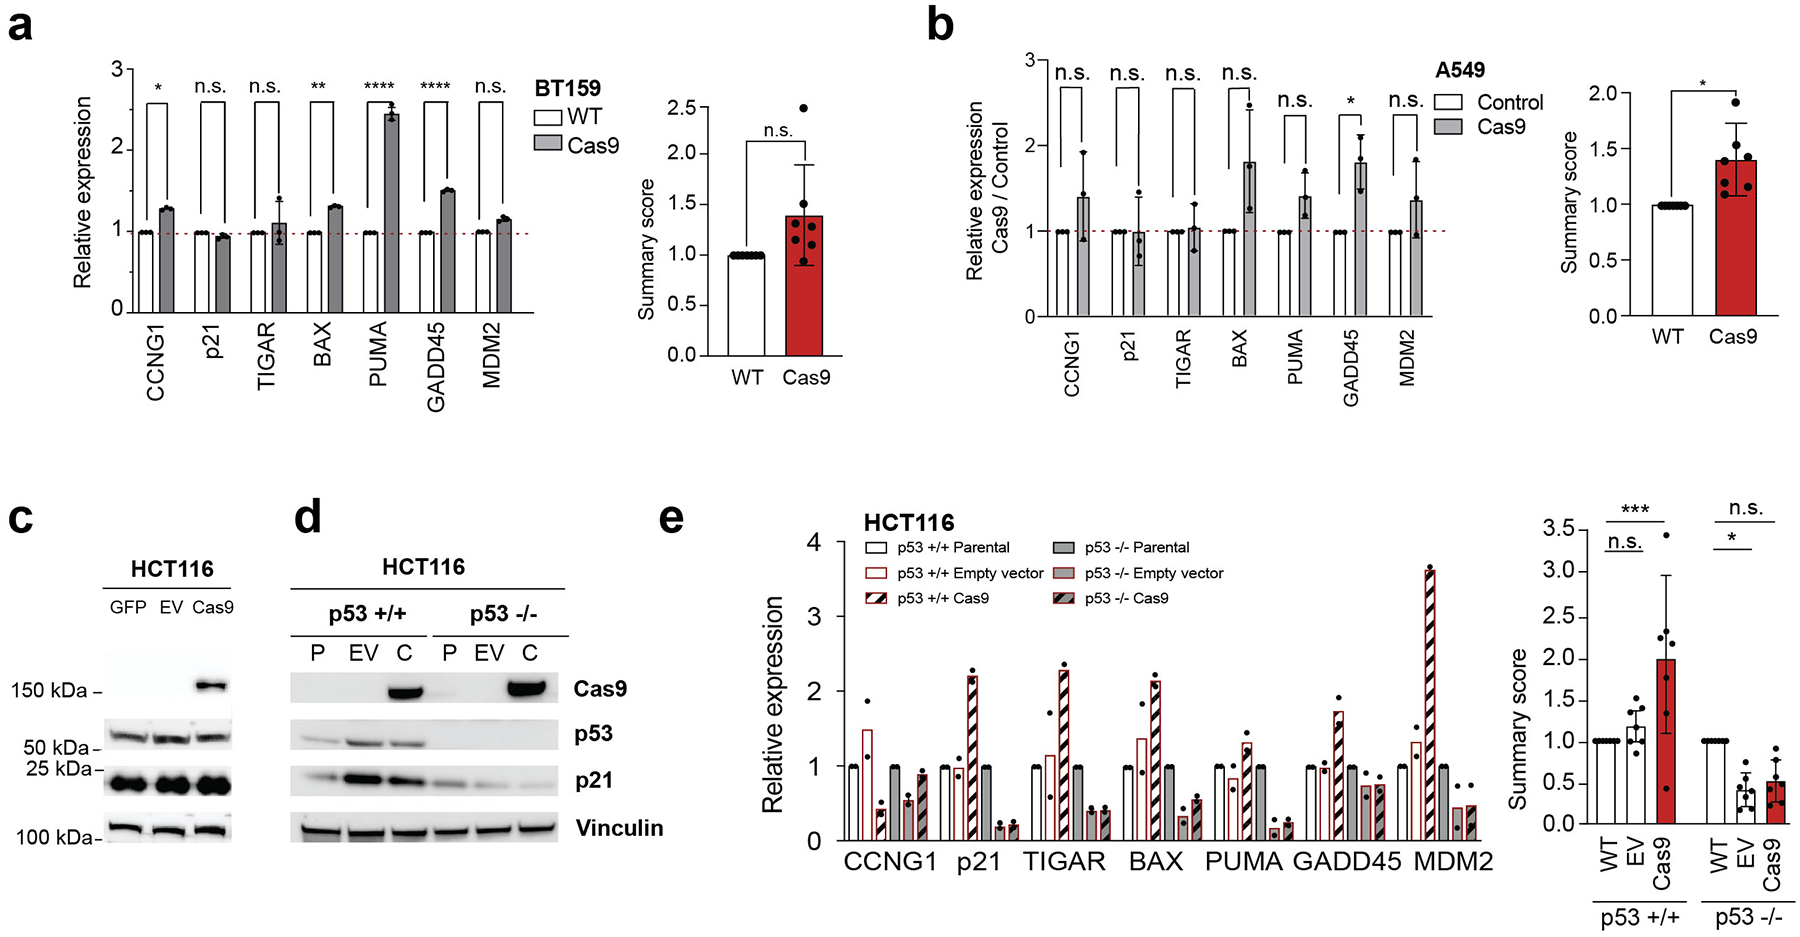
(a) Left: confirmation of p53 pathway activation in BT159 cell lines by RT-qPCR analysis of 7 transcriptional targets of p53. *, P = 0.017, **, P = 0.0065, ****, P < 0.0001, one-tailed t test. Data values represent the means of 3 replicates, with error bars corresponding to S.D. Right: the average activation of p53 transcriptional targets. P = 0.08, two-tailed one-sample t test. Data values represent the means of the 7 targets, with error bars corresponding to S.D. (b) Left: RT-qPCR analysis of 7 transcriptional targets of p53 in A549 (TP53-WT) before and after its transduction with Cas9 or with three control vectors: luciferase, GFP or DNA barcode. *, P = 0.048, one-tailed t test. Data values represent the means of the 3 control vectors and of 3 biological replicates of Cas9, with error bars corresponding to S.D. Right: the average activation of p53 transcriptional targets. *, P < 0.05, two-tailed one-sample t test. Data values represent the means of the 7 targets, with error bars corresponding to S.D. (c) Protein levels of Cas9, p53, p21 and a housekeeping protein in HCT116 cells transfected with GFP, Cas9 or a backbone-matched empty vector (EV). Results represent a single experiment. (d) Protein levels of Cas9, p53, p21 and a housekeeping protein in isogenic TP53-WT (P) and TP53-null HCT116 cells before and after transduction of Cas9 (C) or of a backbone-matched control vector (EV). Results represent a single experiment. (e) Left: RT-qPCR analysis of 7 transcriptional targets of p53 shows p53 pathway activation specifically in the Cas9-expressing TP53-WT HCT116 cells. Data values represent the means of 2 replicates, with error bars corresponding to S.D. Right: the average activation of p53 transcriptional targets. *, P = 0.028, ***, P = 0.0004, ****, P < 0.0001, two-tailed one-sample t test. Data values represent the means of the 7 targets, with error bars corresponding to S.D.
Extended Data Fig. 3. Cas9 introduction activates the DNA damage response (related to Figure 2).
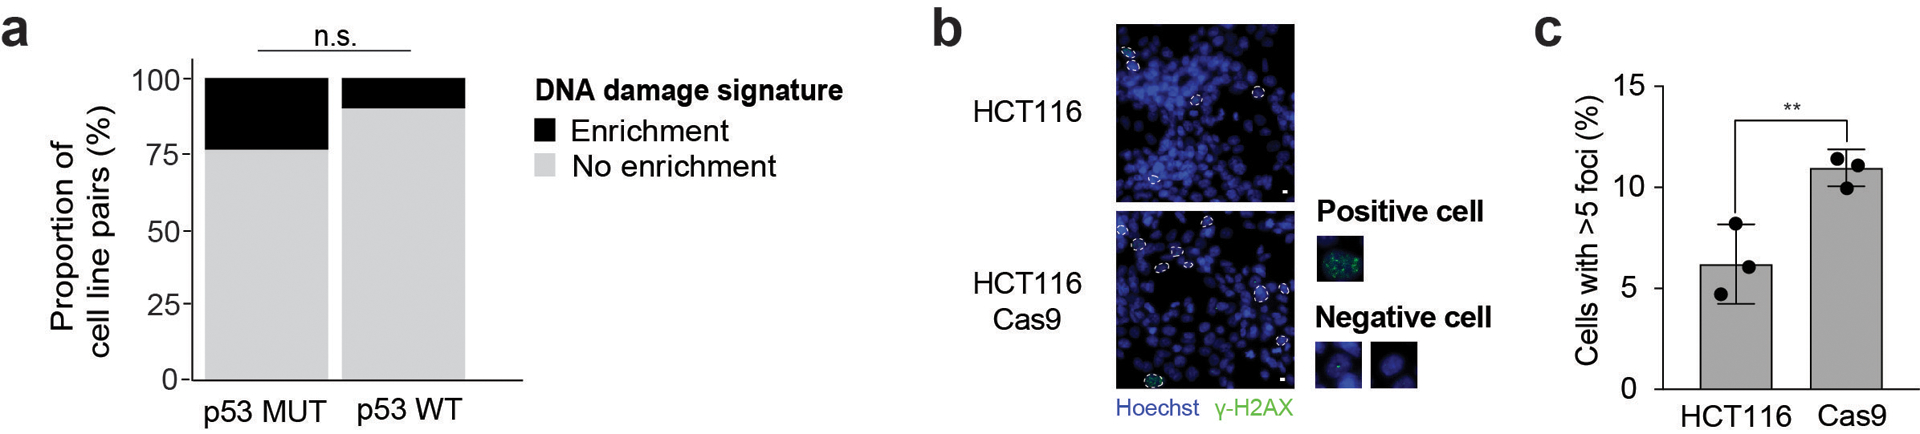
(a) The proportion of cell lines (n = 165) with a positively enriched DNA damage transcriptional signature, following Cas9 introduction. *, P = 0.07; two-tailed Fisher’s exact Test. (b) Fluorescent microscopy images of γH2AX foci (green) and DAPI (blue) in parental TP53-WT HCT116 cells and following Cas9 transduction. Cells with > 5 foci have been marked in white. Scale bar represents 10 μm. (c) Quantification of γH2AX foci from three independent repeats; n = 1,765 and n = 2,523, for WT and Cas9 HCT116 cells, respectively. **, P = 0.0095; one-tailed t test. Data show means, with error bars corresponding to S.D.
Extended Data Fig. 4. Cas9 introduction selects for inactivating TP53 mutations (related to Figure 3).
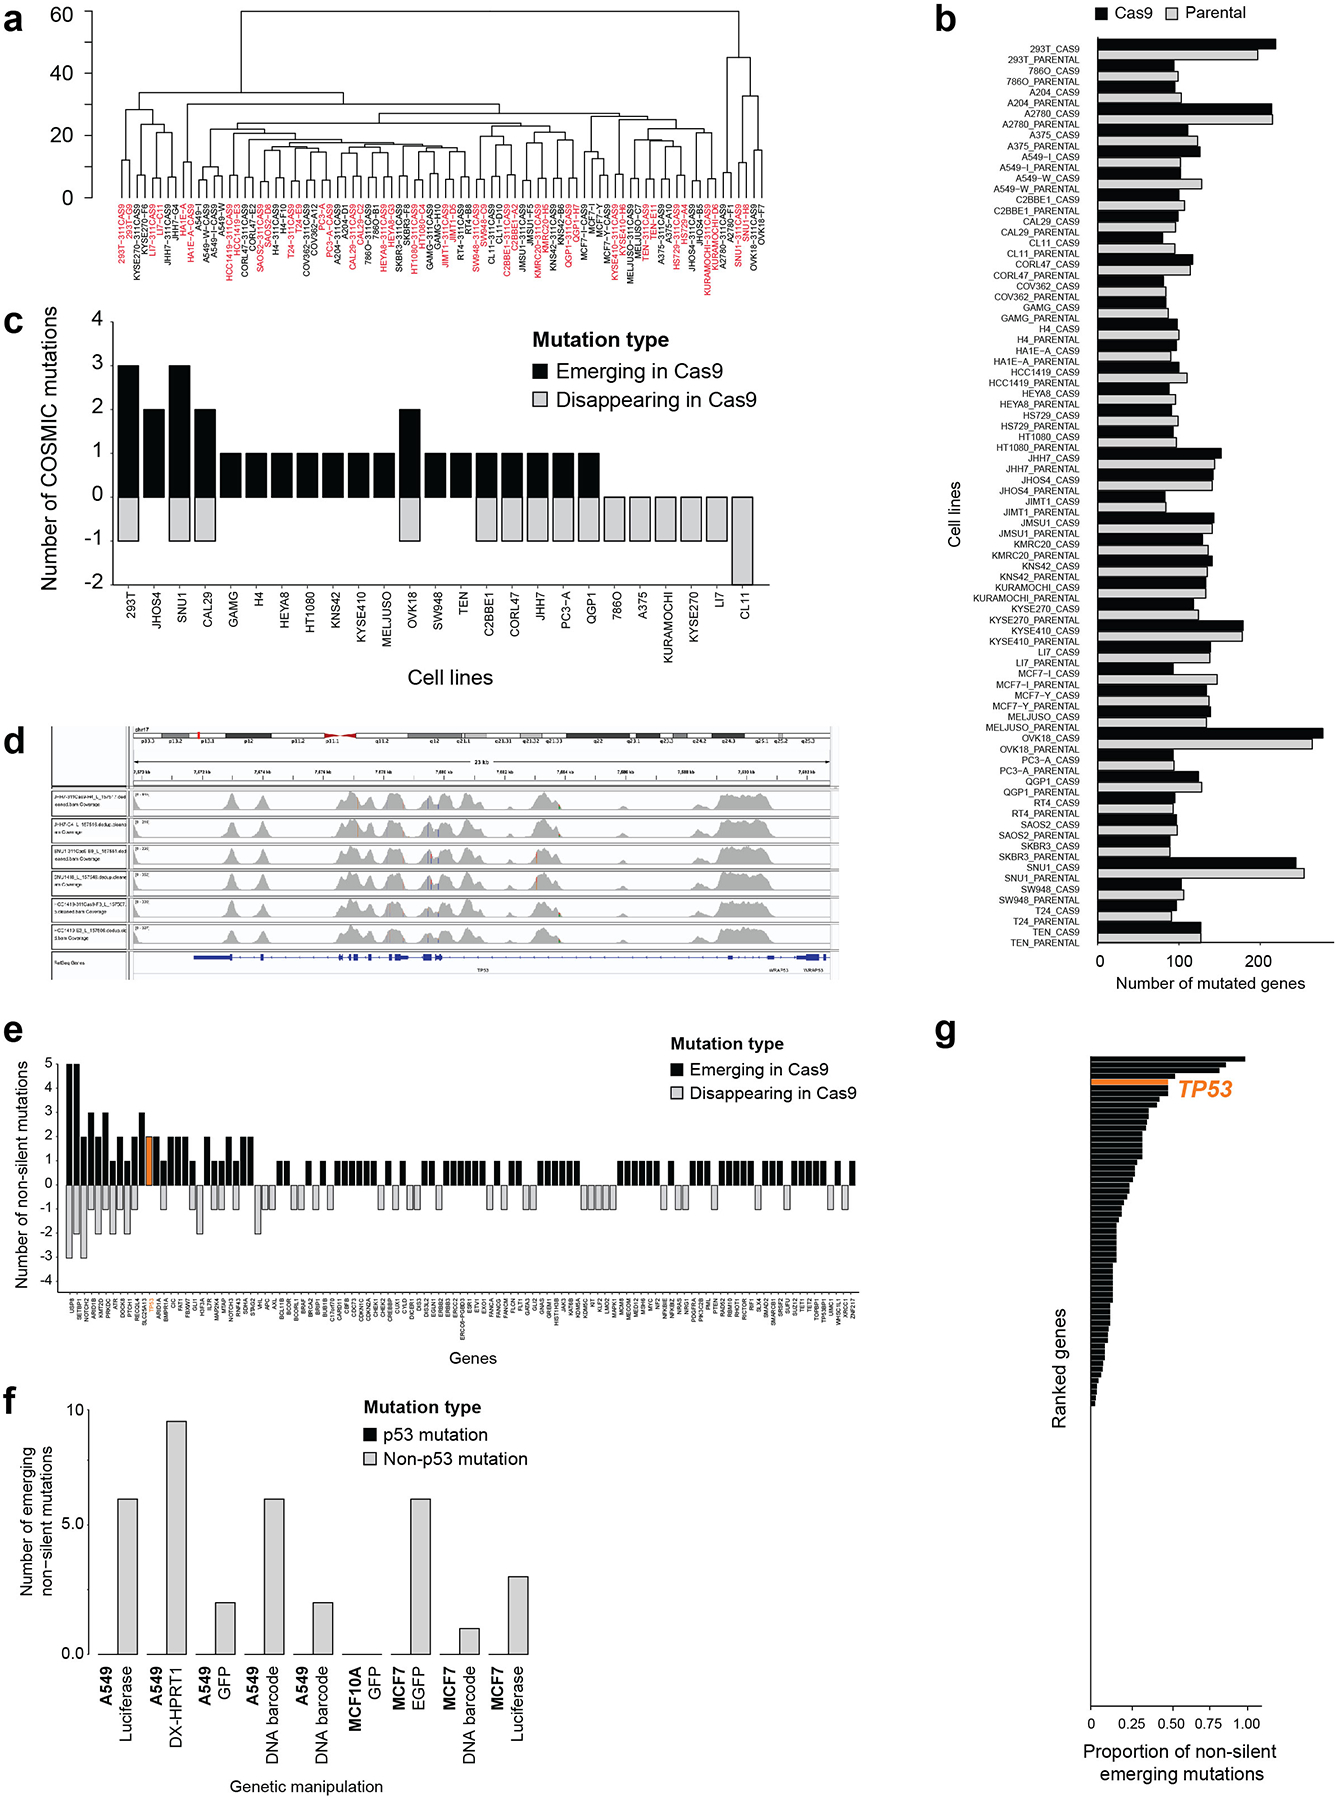
(a) Unsupervised hierarchical clustering of 42 WT/Cas9 cell line pairs across 40 independent cell lines, based on their genetic profiles. Cell line pairs are colored in red and black, alternately, to highlight that all Cas9 lines cluster together with their parental WT lines. (b) The count of overall mutations detected across the 42 WT/Cas9 cell line pairs. (c) The number of recurrent COSMIC mutations that differ between the Cas9 lines and their matched WT lines (that is, detected either in the parental or in the Cas9 line, but not in both). Emerging mutations are shown in black, disappearing mutations in gray, for the 25 cell lines with any COSMIC mutations present. *, P = 0.027, one-tailed paired t test. (d) Sequencing coverage of the TP53 exons in the three cell line pairs in which emergence or expansion of TP53 mutations were detected. (e) Cancer genes ranked by their tendency to acquire mutations in the Cas9 lines. Emerging mutations are shown in black, disappearing mutations in gray. TP53 is highlighted in orange. (f) The number of non-silent mutations that differ between WT lines and their reported or barcoded derivatives. No mutation in TP53 was observed in 9 independent experiments across three TP53-WT cell lines. (g) Cancer genes ranked by the proportion of silent mutations out of all emerging (silent and non-silent) mutations. TP53 is highlighted in orange, and is among the top ~1% of genes (out of 128 genes with a non-silent mutation present).
Extended Data Fig. 5. Proposed workflow for Cas9-related laboratory experiments.
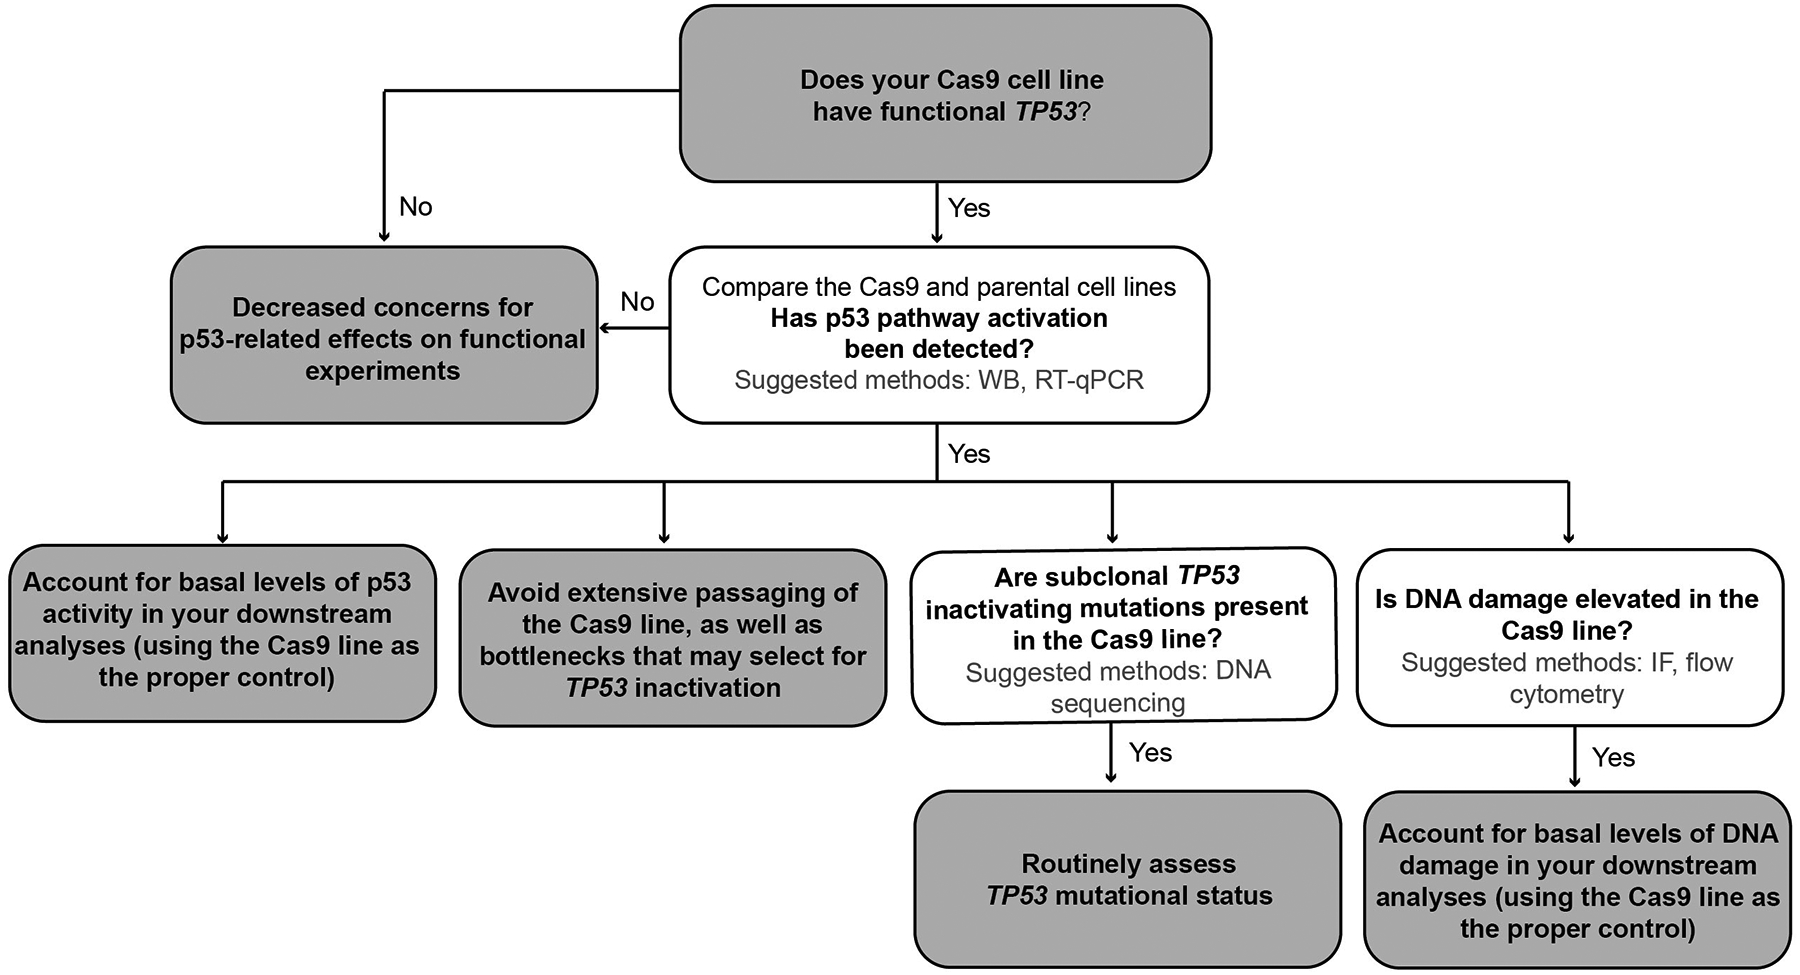
When conducting systematic CRISPR/Cas9-mediated screens or focused studies in TP53-WT cancer cell lines, we recommend determining the basal activation level of the p53 pathway in the Cas9-expressing line. If there is p53 activation, it is recommended to assess Cas9-derived ongoing DNA damage accumulation as well. Finally, as continuous Cas9 expression poses a selection pressure that over time may be reflected in the emergence or expansion of p53-inactivating mutations, it is recommended to avoid extensive passaging and culture bottlenecks that may accelerate this process.
Supplementary Material
Acknowledgements
We thank A. Subramanian, D. Root, T. Natoli, C. Kadoch, S. Cassel and C. Collings for helpful discussions; X. Lu, A. Giacomelli, K. Labella, K. Sanson and W. Hahn for contributing reagents; M. Ducar and S. Drinan for assistance with the OncoPanel assay; and F. Piccioni for assistance with Cas9 cell line generation. This work was supported by NIH (R01 CA18828, CA215489, CA219943; R.B.), the Gray Matters Brain Cancer Foundation (R.B.), Pediatric Brain Tumor Foundation (R.B.), HHMI (T.R.G.) and HFSP (U.B.-D.). Research in the U.B.-D. laboratory is supported by the Azrieli Foundation, the Richard Eimert Research Fund on Solid Tumors, the Tel-Aviv University Cancer Biology Research Center, and the Israel Cancer Association.
Footnotes
Conflicts of interest
J.G.D. consults for Tango Therapeutics, Foghorn Therapeutics, and Pfizer. T.R.G. is a paid advisor to GlaxoSmithKline and Sherlock Biosciences. R.B. owns shares in Ampressa and receives grant funding from Novartis. D.D. is an employee of Cellarity.
References
- 1.Ben-David U, Beroukhim R & Golub TR Genomic evolution of cancer models: perils and opportunities. Nat Rev Cancer 19, 97–109 (2019). [DOI] [PMC free article] [PubMed] [Google Scholar]
- 2.Ben-David U et al. Genetic and transcriptional evolution alters cancer cell line drug response. Nature 560, 325–330 (2018). [DOI] [PMC free article] [PubMed] [Google Scholar]
- 3.Cong L et al. Multiplex genome engineering using CRISPR/Cas systems. Science 339, 819–23 (2013). [DOI] [PMC free article] [PubMed] [Google Scholar]
- 4.Jinek M et al. RNA-programmed genome editing in human cells. Elife 2, e00471 (2013). [DOI] [PMC free article] [PubMed] [Google Scholar]
- 5.Mali P et al. RNA-guided human genome engineering via Cas9. Science 339, 823–6 (2013). [DOI] [PMC free article] [PubMed] [Google Scholar]
- 6.Subramanian A et al. A Next Generation Connectivity Map: L1000 Platform and the First 1,000,000 Profiles. Cell 171, 1437–1452 e17 (2017). [DOI] [PMC free article] [PubMed] [Google Scholar]
- 7.Liberzon A et al. The Molecular Signatures Database (MSigDB) hallmark gene set collection. Cell Syst 1, 417–425 (2015). [DOI] [PMC free article] [PubMed] [Google Scholar]
- 8.Subramanian A et al. Gene set enrichment analysis: a knowledge-based approach for interpreting genome-wide expression profiles. Proc Natl Acad Sci U S A 102, 15545–50 (2005). [DOI] [PMC free article] [PubMed] [Google Scholar]
- 9.Bunz F et al. Requirement for p53 and p21 to sustain G2 arrest after DNA damage. Science 282, 1497–501 (1998). [DOI] [PubMed] [Google Scholar]
- 10.Haapaniemi E, Botla S, Persson J, Schmierer B & Taipale J CRISPR-Cas9 genome editing induces a p53-mediated DNA damage response. Nat Med 24, 927–930 (2018). [DOI] [PubMed] [Google Scholar]
- 11.Ihry RJ et al. p53 inhibits CRISPR-Cas9 engineering in human pluripotent stem cells. Nat Med 24, 939–946 (2018). [DOI] [PubMed] [Google Scholar]
- 12.Schiroli G et al. Precise Gene Editing Preserves Hematopoietic Stem Cell Function following Transient p53-Mediated DNA Damage Response. Cell Stem Cell 24, 551–565 e8 (2019). [DOI] [PMC free article] [PubMed] [Google Scholar]
- 13.Wu Y et al. Highly efficient therapeutic gene editing of human hematopoietic stem cells. Nat Med 25, 776–783 (2019). [DOI] [PMC free article] [PubMed] [Google Scholar]
- 14.Elkon R et al. Dissection of a DNA-damage-induced transcriptional network using a combination of microarrays, RNA interference and computational promoter analysis. Genome Biol 6, R43 (2005). [DOI] [PMC free article] [PubMed] [Google Scholar]
- 15.Wang W, Mani AM & Wu ZH DNA damage-induced nuclear factor-kappa B activation and its roles in cancer progression. J Cancer Metastasis Treat 3, 45–59 (2017). [DOI] [PMC free article] [PubMed] [Google Scholar]
- 16.Sholl LM et al. Institutional implementation of clinical tumor profiling on an unselected cancer population. JCI Insight 1, e87062 (2016). [DOI] [PMC free article] [PubMed] [Google Scholar]
- 17.Giacomelli AO et al. Mutational processes shape the landscape of TP53 mutations in human cancer. Nat Genet 50, 1381–1387 (2018). [DOI] [PMC free article] [PubMed] [Google Scholar]
- 18.Doench JG et al. Rational design of highly active sgRNAs for CRISPR-Cas9-mediated gene inactivation. Nat Biotechnol 32, 1262–7 (2014). [DOI] [PMC free article] [PubMed] [Google Scholar]
- 19.Sinha S et al. Integrated computational and experimental identification of p53, KRAS and VHL mutant selection associated with CRISPR-Cas9 editing. bioRxiv, 407767 (2019). [Google Scholar]
- 20.Piras F et al. Lentiviral vectors escape innate sensing but trigger p53 in human hematopoietic stem and progenitor cells. EMBO Mol Med 9, 1198–1211 (2017). [DOI] [PMC free article] [PubMed] [Google Scholar]
- 21.Zacharias J, Romanova LG, Menk J & Philpott NJ p53 inhibits adeno-associated viral vector integration. Hum Gene Ther 22, 1445–51 (2011). [DOI] [PMC free article] [PubMed] [Google Scholar]
- 22.Ben-David U et al. The landscape of chromosomal aberrations in breast cancer mouse models reveals driver-specific routes to tumorigenesis. Nat Commun 7, 12160 (2016). [DOI] [PMC free article] [PubMed] [Google Scholar]
- 23.Meyers RM et al. Computational correction of copy number effect improves specificity of CRISPR-Cas9 essentiality screens in cancer cells. Nat Genet 49, 1779–1784 (2017). [DOI] [PMC free article] [PubMed] [Google Scholar]
- 24.Johnson WE, Li C & Rabinovic A Adjusting batch effects in microarray expression data using empirical Bayes methods. Biostatistics 8, 118–27 (2007). [DOI] [PubMed] [Google Scholar]
- 25.Li H & Durbin R Fast and accurate short read alignment with Burrows-Wheeler transform. Bioinformatics 25, 1754–60 (2009). [DOI] [PMC free article] [PubMed] [Google Scholar]
- 26.DePristo MA et al. A framework for variation discovery and genotyping using next-generation DNA sequencing data. Nat Genet 43, 491–8 (2011). [DOI] [PMC free article] [PubMed] [Google Scholar]
- 27.McKenna A et al. The Genome Analysis Toolkit: a MapReduce framework for analyzing next-generation DNA sequencing data. Genome Res 20, 1297–303 (2010). [DOI] [PMC free article] [PubMed] [Google Scholar]
- 28.Cibulskis K et al. Sensitive detection of somatic point mutations in impure and heterogeneous cancer samples. Nat Biotechnol 31, 213–9 (2013). [DOI] [PMC free article] [PubMed] [Google Scholar]
- 29.McLaren W et al. Deriving the consequences of genomic variants with the Ensembl API and SNP Effect Predictor. Bioinformatics 26, 2069–70 (2010). [DOI] [PMC free article] [PubMed] [Google Scholar]
- 30.Bamford S et al. The COSMIC (Catalogue of Somatic Mutations in Cancer) database and website. Br J Cancer 91, 355–8 (2004). [DOI] [PMC free article] [PubMed] [Google Scholar]
- 31.Karczewski KJ et al. Variation across 141,456 human exomes and genomes reveals the spectrum of loss-of-function intolerance across human protein-coding genes. 531210 (2019). [Google Scholar]
- 32.Dempster JM et al. Extracting Biological Insights from the Project Achilles Genome-Scale CRISPR Screens in Cancer Cell Lines. 720243 (2019). [Google Scholar]
- 33.McFarland JM et al. Improved estimation of cancer dependencies from large-scale RNAi screens using model-based normalization and data integration. Nat Commun 9, 4610 (2018). [DOI] [PMC free article] [PubMed] [Google Scholar]
- 34.Tsherniak A et al. Defining a Cancer Dependency Map. Cell 170, 564–576 e16 (2017). [DOI] [PMC free article] [PubMed] [Google Scholar]
- 35.Huang DW et al. The DAVID Gene Functional Classification Tool: a novel biological module-centric algorithm to functionally analyze large gene lists. Genome Biol 8, R183 (2007). [DOI] [PMC free article] [PubMed] [Google Scholar]
- 36.Kung CP, Khaku S, Jennis M, Zhou Y & Murphy ME Identification of TRIML2, a novel p53 target, that enhances p53 SUMOylation and regulates the transactivation of proapoptotic genes. Mol Cancer Res 13, 250–62 (2015). [DOI] [PMC free article] [PubMed] [Google Scholar]
- 37.Enache OM et al. The GCTx format and cmap{Py, R, M, J} packages: resources for optimized storage and integrated traversal of annotated dense matrices. Bioinformatics 35, 1427–1429 (2019). [DOI] [PMC free article] [PubMed] [Google Scholar]
- 38.Team RDCR: A language and environment for statistical computing. (R Foundation for Statistical Computing, Vienna, Austria, 2010). [Google Scholar]
Associated Data
This section collects any data citations, data availability statements, or supplementary materials included in this article.
Supplementary Materials
Data Availability Statement
All datasets are available within the article, its Supplementary Information, or from the corresponding authors upon request. DNA sequencing data were deposited to SRA (https://www.ncbi.nlm.nih.gov/sra) with BioProject accession number PRJNA545458. Gene expression data were uploaded to the following URL: https://clue.io/data/XPR_BASE#CAS9_BASELINE. Source Data of all immunostaining blots are available in the online version of this paper.