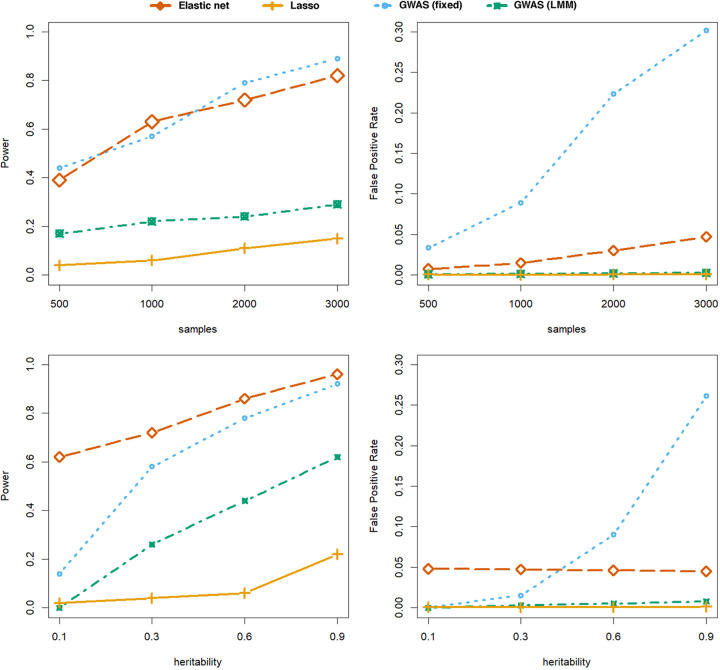
FIG 2.
Power and false-positive rates in the simulation study set up to resemble antibiotic resistance genotype-phenotype architecture. (Top) The effect of sample size, with 100 causal variants in the pbp2x gene and a binary phenotype. (Bottom) The effect of phenotype heritability, with 50 causal variants spread across the three pbp genes and a continuous phenotype. Multivariate methods tested were the elastic net with default α (red) and Lasso regression (orange). Univariate methods were the fixed effects/seer model (blue) and the FastLMM linear mixed model (green).

