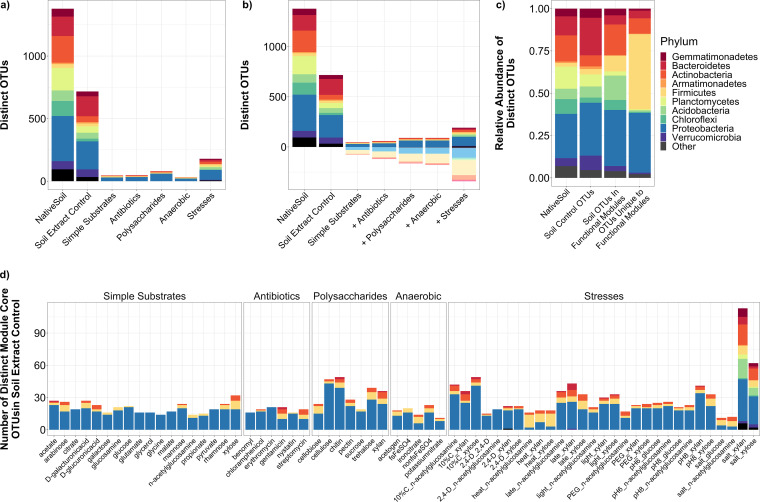
FIG 5.
Microbiome comparisons between soil controls and functional modules. Core microbiomes were generated for each module through calculation of distinct OTUs represented in at least 40% of replicates and comprising at least 0.01% of cumulative read counts for that module. (a) Absolute abundance plot of distinct OTUs, with a comparison of the distinct OTUs present in native soils, distinct OTUs present in liquid soil extract controls, and the OTUs in liquid soil extract controls represented in at least one module core for each of the functional module categories. (b) Stepwise absolute abundance plot of distinct core OTUs in module categories, where each successive module category represents the distinct module core OTUs present in the category, along with those in all previous categories. Above the x axis represents OTUs also found in liquid soil extract control; below the x axis represents OTUs uniquely found in functional module cores. (c) Relative abundance plot of the distinct OTUs—either those present in native soil, those present in liquid soil extract controls, those present in both liquid soil extract control and functional module cores, or those uniquely present in functional module cores. (d) Absolute abundance plot of distinct liquid soil extract OTUs found in each individual functional module. Bars in plots are colored according to the phylum to which each core OTU belongs.

