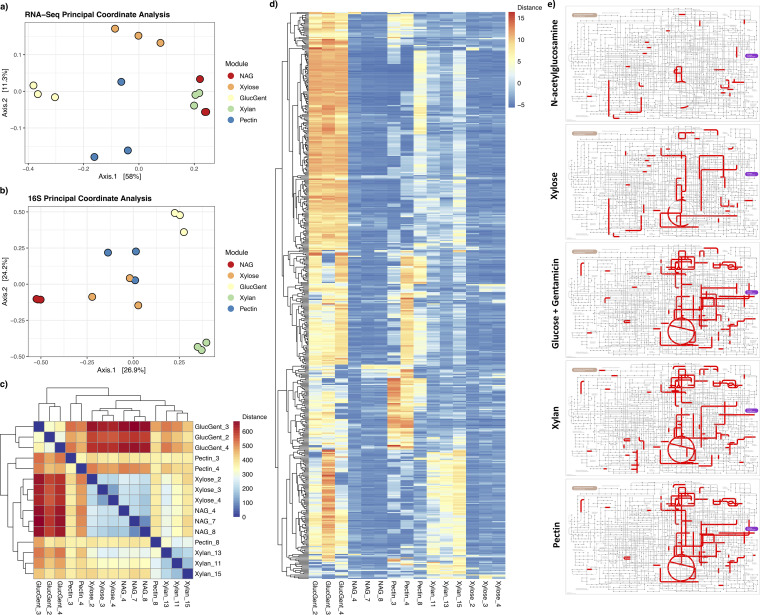
FIG 6.
RNA-Seq functional trends. Bray-Curtis distance objects were generated for the RNA-Seq data set as well as the corresponding samples within the 16S amplicon data set, generating principal coordinate analysis plots for both the RNA-Seq (a) and 16S (b) data sets. Points are colored by module (red, NAG/N-acetylglucosamine; orange, xylose; yellow, GlucGent/glucose + gentamicin; green, xylan; blue, pectin). (c) Heatmap of Euclidean distances between individual samples within the RNA-Seq data set, where red indicates high distance/dissimilarity between samples, and blue indicates low distance/similarity between samples. (d) Heatmap of expression values for the 15 samples in the RNA-Seq data set. To subset the data set to the transcripts that were most informative with regard to sample-to-sample variation, in this plot the transcripts were first reduced to the 5,000 with the highest average counts, then further to the 500 of those with the highest coefficient of variation (the ratio of standard deviation to the mean) for counts. The data in panels a, c, and d are based on applying variance-stabilizing transformation to the original DESeq-normalized data object so as to more easily visualize differences between samples. (e) Significantly upregulated KEGG orthologs for each of the five modules used in RNA-Seq. Lists of enriched KOs were generated by performing comparisons between all pairs of modules, where KOs that were significantly upregulated in a module relative to at least two other modules were retained (as well as having a shrunken log-fold change of >1.0 and an adjusted P value of <0.05). Subsequent visualization of KOs on a microbial metabolism map was accomplished using iPath 3.0.

