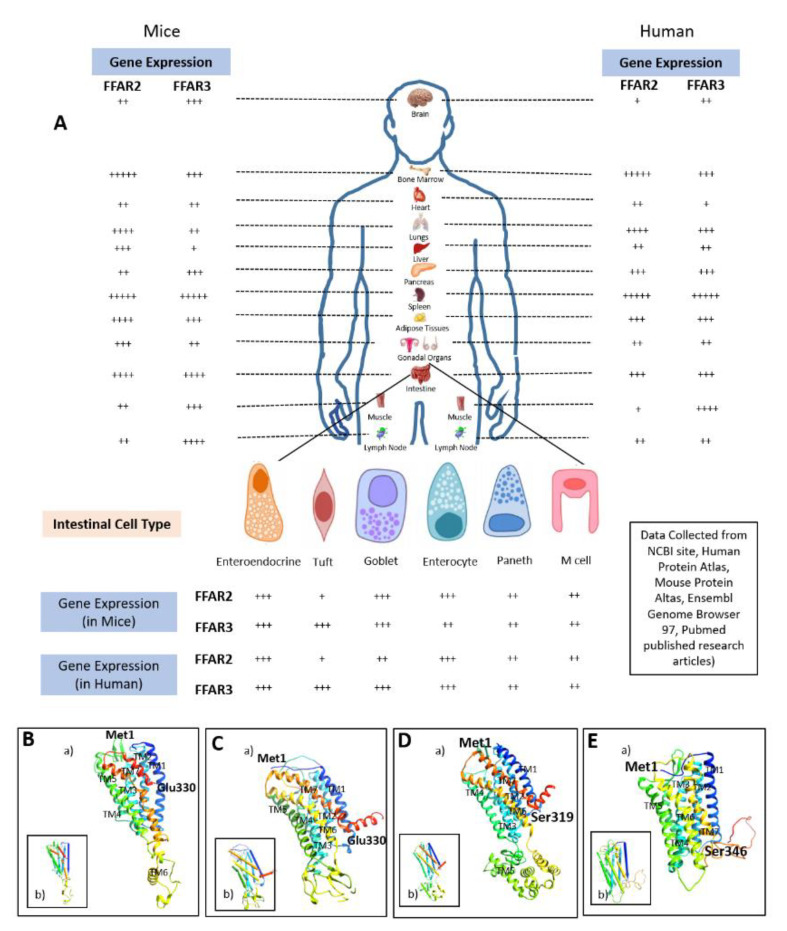
Figure 2.
(A) Diagrammatic representation of FFAR2 and FFAR3 expression in human tissues/cells and their comparison with mouse tissues/cells. (B–E) Homolgy structure of mouse (B,D) and human (C,E) FFAR2 (A,B) and pFFAR3 (D,E) protein. (a,b) Depicts the rainbow (a) and pipes and plank (b) structures.

