

Abstract

Glucose metabolism is an essential process for energy production and cell survival for both normal and abnormal cellular metabolism. Several glucose transporter/solute carrier 2A (GLUT/SLC2A) superfamily members, including glucose transporter 1 (GLUT1), have been shown to mediate the cellular uptake of glucose in diverse cell types. GLUT1-mediated glucose uptake is a transient and rapid process; thus, the real-time monitoring of GLUT1 trafficking is pivotal for a better understanding of GLUT1 expression and GLUT1-dependent glucose uptake. In the present study, we established a rapid and effective method to visualize the trafficking of GLUT1 between the plasma membrane (PM) and endolysosomal system in live cells using an mCherry-EGFP-GLUT1 tandem fluorescence tracing system. We found that GLUT1 localized at the PM exhibited both red (mCherry) and green (EGFP) fluorescence (yellow when overlapping). However, a significant increase in red punctate fluorescence (mCherry is resistant to acidic pH), but not green fluorescence (EGFP is quenched by acidic pH), was observed upon glucose deprivation, indicating that the mCherry-EGFP-GLUT1 functional protein was trafficked to the acidic endolysosomal system. Besides, we were able to calculate the relative ratio of mCherry to EGFP by quantification of the translocation coefficient, which can be used as a readout for GLUT1 internalization and subsequent lysosomal degradation. Two mutants, mCherry-EGFP-GLUT1-S226D and mCherry-EGFP-GLUT1-ΔC4, were also constructed, which indirectly confirmed the specificity of mCherry-EGFP-GLUT1 for monitoring GLUT1 trafficking. By using a series of endosomal (Rab5, Rab7, and Rab11) and lysosomal markers, we were able to define a model of GLUT1 trafficking in live cells in which upon glucose deprivation, GLUT1 dissociates from the PM and experiences a pH gradient from 6.8–6.1 in the early endosomes to 6.0–4.8 in the late endosomes and finally pH 4.5 in lysosomes, which is appropriate for degradation. In addition, our proof-of-concept study indicated that the pmCherry-EGFP-GLUT1 tracing system can accurately reflect endogenous changes in GLUT1 in response to treatment with the small molecule, andrographolide. Since targeting GLUT1 expression and GLUT1-dependent glucose metabolism is a promising therapeutic strategy for diverse types of cancers and certain other glucose addiction diseases, our study herein indicates that pmCherry-EGFP-GLUT1 can be utilized as a biosensor for GLUT1-dependent functional studies and potential small molecule screening.
Introduction
Glucose is the most fundamental source for the production of energy and subsequent metabolic processes in all organisms; consequently, the fine-tuning of glucose uptake is critical for maintaining glucose homeostasis and metabolic balance.1 At the cellular level, the transportation of glucose across the plasma membrane (PM) is the first rate-limiting step for glucose metabolism and is facilitated by a series of glucose transporter/solute carrier 2A (GLUT/SLC2A) family members.2 Glucose transporter 1 (GLUT1) is one of the most intensively studied GLUT family members due to its ubiquitous role in glucose uptake in various cell types.3 Increasing evidence suggests that the dysregulation of GLUT1 plays a key role in a series of diseases.4,5 For instance, the impairment of GLUT1-dependent glucose transport has been reported to lead to a novel group of disorders named GLUT1 deficiency syndrome.4 In contrast, the overexpression of GLUT1 has been observed in several cancers, thereby facilitating glucose uptake and increasing glycolytic flux, which in turn facilitates cancer cell dependence on glucose and/or survival.5,6 Therefore, exploring the regulation of GLUT1 at the cellular level has become a hot topic, especially in the metabolic field.
Several mechanisms have been revealed to be involved in the regulation of GLUT1 expression: (i) several perturbations, such as decreases in nutrient or oxygen availability, have been demonstrated to typically increase the basal transcription of GLUT17,8 and (ii) the subcellular trafficking of GLUT1 between internal vesicular compartments and the cell surface is another major form of GLUT1 regulation. GLUT1 can undergo internalization via early endosomes (EE)-late endosomes (LE) and then traffic into the lysosome for degradation via the endolysosomal pathway; however, GLUT1 can also be recycled back to the PM by recycling endosomes (RE) through the actions of multiple GTPases.9−11 In addition, mutations within the GLUT1 functional domain can also affect its cellular trafficking, e.g., S226 phosphorylation of GLUT1 promotes its membrane localization, whereas the deletion of the PDZ-binding motif impairs GLUT1 cell surface trafficking.12,13 Studies aimed at determining GLUT1 trafficking provide insight into glucose uptake.
Although immunofluorescence and immunohistochemistry, as well as biochemical fractionation, can be used to access the endogenous GLUT1 expression, they cannot reflect the real-time changes in GLUT1. In addition, GLUT1, as a transmembrane protein, preferentially forms clusters or dimeric or tetrameric complexes, which may cause difficulties in GLUT1 functional studies, e.g., fuzzy positioning, nonspecific coloring, difficult separation, long experimental cycles, and expense.14,15 At the live cell level, GLUT1 trafficking can be observed by microscopy using proteins tagged with single fluorescence, yet it is difficult to quantify the kinematics of GLUT1 since it can be either degraded or recycled.9,13,16 A recent study demonstrated that a genetically encoded bioluminescent Förster resonance energy transfer (BRET) assay can be applied to visualize the dynamic formation of GLUT1 multimeric complexes in live cells.17 However, precise, highly specific, easily applicable, and low-cost fluorescent tracers for dynamic GLUT1 trafficking are currently lacking. In the present study, we establish a dual-fluorescence-based mCherry-EGFP-GLUT1 tracing tool that enables the real-time imaging of GLUT1 trafficking between internal vesicular compartments and the cell surface at the single-cell level. This quantifiable tool can also be used as a biosensor for glucose uptake determination and possibly small inhibitor screening.
Results and Discussion
Establishment of a Dual-Fluorescence-Based GLUT1 Tracking Tool
Dynamic changes in GLUT1 expression and trafficking are fundamental for maintaining glucose homeostasis.18,19 Increasing evidence suggests that the endolysosomal degradation of GLUT1 is a major form of GLUT1 expression regulation and that GLUT1 translocating from the PM to lysosomes encounters a sudden change in pH from neutral to acidic (less than 4.5 in the lysosome),9,13so we sought to develop a tool to monitor GLUT1 trafficking in real-time during the endocytosis process. Fluorescence-based labeling of a protein enables the visualization of the correct localization, including colocalization with subcellular structures, such as endosomes in live cells, allowing for single-cell analysis, which may eliminate cell-to-cell variability. Previously, mRFP-EGFP tandem fluorescent-tagged LC3 was utilized for the analysis of the autophagosome maturation process; this reporter shows an EGFP and mRFP signal before fusion with the lysosomes and exhibits only an mRFP signal upon fusion with the lysosomes.20 By taking advantage of the differential sensitivity of mCherry (mRFP can also be used) and EGFP to lysosomal acidity, we hypothesized that the mCherry-EGFP-GLUT1 tandem fluorescent-tagged GLUT1 plasmid could be used to visualize the trafficking of GLUT1 from neutral endosomes to acidic endolysosomes.
A schematic of the mCherry-EGFP-GLUT1 tandem fluorescence-based tracking tool is presented in Figure 1A. The transient transfection of pmCherry-EGFP-GLUT1 into SW 1353 cancer cells produced both red (mCherry) and green (EGFP) fluorescence signals at the PM (yellow signal in the merge), and few red punctate fluorescence were observed in the cytosol under normal culture conditions (Figure 1B–F). It has been reported that glucose deprivation markedly increases lysosome capacity to account for the enhanced endosome/autophagosome fusion and subsequent degradation.21 Consistent with this finding, we found that glucose deprivation markedly enhanced lysosome capacity as the autophagosome marker mCherry-EGFP-LC3 lost its EGFP fluorescence but red punctate fluorescence were retained following fusion with the lysosomes (Supporting Information, Figure S1A,B). Significantly, as shown in Figure 1B–F, glucose deprivation led to a pronounced localization of red punctate fluorescence (mCherry, which is resistant to acidic pH) in the perinuclear compartment, which did not emit any green fluorescence (EGFP was quenched by the acidic pH), indicating that the vast majority of GLUT1 was trafficked into acidic endolysosomes.
Figure 1.

Establishment of mCherry-EGFP-GLUT1 tandem fluorescence tracing tool. (A) Schematics of mCherry-EGFP-GLUT1 construct used to visualize the subcellular trafficking of GLUT1 in cells under different pH microenvironment. In a neutral PM, fluorescence of mCherry-EGFP-GLUT1 generates yellow punctate fluorescence with excitation of both EGFP (488 nm/507 nm, green) and mCherry (580 nm/610 nm, red). However, the fluorescence signal of EGFP is quenched when it enters the acidic lysosome, while the fluorescent protein mCherry can be excited as before. (B) Analysis of red punctate fluorescence from confocal z-stack images of SW 1353 cells transfected with the mCherry-GLUT1 plasmid, after pretreatment with or without glucose, *P < 0.05, **P < 0.01. (C, D) Representative images of the colocalization of mCherry-GLUT1 (red punctate fluorescence) with lysosome (green punctate fluorescence stained by LysoTracker DND-26) in the SW 1353 cells. Confocal images of the entire z-stack with orthogonal views, XZ and YZ, were outlined by red and green lines, respectively. *P < 0.05. (E, F) Representative images of SW 1353 cells transfected with the mCherry-EGFP-GLUT1 plasmid with or without glucose. The nucleus was stained with DAPI before observation. Scale bar = 30 μm. Inset boxes in the merged images were magnified in the right panel. Statistical analysis of red punctate fluorescence (mCherry) and yellow punctate fluorescence (EGFP + mCherry) was showed, ****P < 0.0001. (G, H) Formulation used for calculating the TC. The single-cell total fluorescence intensity (mCherry or EGFP) was defined as TFI (R or G) within the yellow line of the fluorescence images, while the cytoplasmic fluorescence intensity (mCherry or EGFP) was defined as CFI (R or G), which was marked by the dashed line. The plasma membrane fluorescence intensity (PMFI) was calculated, as described in Experimental Section. Images observed from the z-position with the highest amount of vesicles were selected in all conditions. Scale bar = 30 μm. The fluorescence intensity and TC value were analyzed by Gen5 3.06, ***P < 0.001. The above statistical results showed the mean ± SD of three independent experiments at least 50 cells.
Using an equation (Figure 1G), we were able to quantify the translocation coefficient (TC) by dividing the cytosolic fluorescence intensity (CFI, mCherry intensity/EGFP intensity) to PM fluorescence intensity (PMFI, mCherry intensity/EGFP intensity). The results showed that glucose deprivation significantly increased the TC value (Figure 1H). It will be more significant to analyze the subcellular trafficking of GLUT1 between the PM and different cellular organelles by integrating other mathematical equations or models, e.g., the two-pool model or Holman’s three-pool model.16
Similarly, we were able to monitor the analogous family members of GLUT1, GLUT3. As shown in Supporting Information, Figure S1C,D, a notable increase in red (mCherry) punctate fluorescence and TC was observed in glucose-deprived cells compared with cells cultured in normal glucose levels. Recently, several studies have described biosensors of GLUT1, e.g., a dual-labeled GLUT1 fusion protein (nanoluciferase-mCherry-GLUT1) has been described and applied to investigate GLUT1 oligomerization,17 and biotinylated GLUT photo labels have been applied to study GLUT translocation to the cell surface.22 In combination, these results suggest that the mCherry-EGFP-GLUT1 tandem fluorescent-tagged GLUT1 plasmid can be used as a biosensor for GLUT1 trafficking.
Confirmation of the Specificity of mCherry-EGFP-GLUT1 by Mutations
To further characterize the specificity of mCherry-EGFP-GLUT1 for tracking GLUT1 expression in live cells, we constructed two mutants of pmCherry-EGFP-GLUT1, as illustrated in Figure 2A. GLUT1-S226D is a highly phosphorylated form of GLUT1, which has previously been demonstrated to mainly localize to the PM.12 As expected, the transient transfection of pmCherry-EGFP-GLUT1-S226D into SW 1353 cells produces a predominant localization of mCherry-EGFP-GLUT1-S226D at the PM in both the glucose+ and glucose– groups. The Statistical Analysis section indicated that the TC value of mCherry-EGFP-GLUT1-S226D in the glucose deprivation medium was comparable to that in the normal medium (Figure 2B,C). We also investigated another mutant of GLUT1, a recycling-deficiency mutant with a deleted PDZ binding motif.13 As shown in Figure 2D,E, compared with WT, mCherry-EGFP-GLUT1-ΔC4 was unable to recycle back to the PM and was instead sequestered in the endolysosomal system. These results indirectly indicate that the dual-fluorescence-based mCherry-EGFP-GLUT1 tracing sensor is specific for monitoring the trafficking of GLUT1 in live cells.
Figure 2.

Subcellular localization of mCherry-EGFP-GLUT1 mutants. (A) Schematic representation of functional domains of mCherry-EGFP-GLUT1, mCherry-EGFP-GLUT1 S226D, and mCherry-EGFP-GLUT1-ΔC4. (B, C) Cells transiently expressing mCherry-EGFP-GLUT1 S226D were observed either in the presence or absence of glucose. Scale bar = 30 μm. Inset boxes in the merged images were magnified in the right panel. Statistical analysis of TC, n.s. (D, E) Cells transiently expressing mCherry-EGFP-GLUT1-ΔC4 and mCherry-EGFP-GLUT1 were cultured in normal glucose medium for 48 h. The fluorescence images were observed by confocal microscopy. Scale bar = 30 μm. Inset boxes in the merged images were magnified in the right panel. Statistical analysis of TC, ***P < 0.001.
Glucose Deprivation Induces GLUT1 Endocytic Trafficking in Cancer Cells
The dynamic change in GLUT1 is fine-tuned by EE/LE/lysosomal degradation and the EE/RE/cell surface pathway at the protein level.9,14,19 We next sought to explore how mCherry-EGFP-GLUT1 undergoes endocytic sorting. Consistent with the above findings, glucose deprivation markedly increased the number of perinuclear localized red punctate fluorescence, and these punctate fluorescence exhibited good colocalization with LAMP1, which is a lysosomal marker (Figure 3A). Pearson’s correlation coefficient of mCherry with LAMP1 notably increased upon glucose deprivation (Figure 3B). Taken together, these results demonstrate that mCherry-EGFP-GLUT1 is indeed trafficked into lysosomes, thus quenching EGFP fluorescence while retaining the mCherry-labeled red punctate fluorescence.
Figure 3.

Monitoring the trafficking of GLUT1 using the mCherry-EGFP-GLUT1 plasmid. (A, B) Representative merged and magnified fluorescence images of cells transiently expressing mCherry-EGFP-GLUT1. Cells undergoing glucose starvation were used as a control; antibodies against LAMP1 (blue) were used to identify the lysosomes. Scale bar = 30 μm. Pearson’s correlation coefficient was used to analyze colocalization of mCherry and LAMP1, *P < 0.05. (C, D) SW 1353 cells were cotransfected with mCherry-EGFP-GLUT1 and Myc-Rab7 for 48 in the presence or absence of glucose. Antibody against Myc (blue) was used to probe Myc-Rab7, which reflects the LE. Scale bar = 30 μm. Quantitative colocalization analysis of LE with mCherry was analyzed as Pearson’s correlation coefficient (D), **P < 0.001. (E) Representative real-time images of SW 1353 cells expressing mCherry-EGFP-GLUT1 in the absence of glucose while containing 10 μM 2-DG. Inset boxes in the upper panel were enlarged, as shown below. Arrows delineated the migration of mCherry-EGFP-GLUT1-containing vesicular structures from the PM toward the endolysosome. Image frames were extracted from videos for comparison.
We then aimed to determine how mCherry-EGFP-GLUT1 colocalizes with a series of endosomal markers. It has been well recognized that Rab7 controls the aggregation and fusion of late endocytic structures/lysosomes, as well as the maintenance of the perinuclear lysosome compartment.23,24 Accordingly, we also observed a significant increase in Rab7 colocalization with mCherry (purple in merged images) upon glucose deprivation (Figure 3C,D). Although a slight increase in mCherry colocalization with the EE marker Rab5 (yellow in merged images) was observed in the absence of glucose (Supporting Information, Figure 2A), a lack of colocalization of mCherry with Rab11 was found (Supporting Information, Figure 2B). Taken together, these results indicate that although increasing amounts of mCherry-EGFP-GLUT1 dissociate from the PM, they favor the EE/LE/lysosomal degradation pathway instead of recycling back to the PM. Furthermore, time-lapse confocal microscopy was used to monitor the trafficking of mCherry-EGFP-GLUT1. In a series of 30 s intervals, we observed the trafficking of mCherry-EGFP-GLUT1 into the perinuclear lysosome compartment (Figure 3E). Thus, we propose a model of GLUT1 trafficking in the live cells (Figure 4) in which GLUT1 dissociates from the PM and experiences a pH gradient from 6.8–6.1 in the EE to 6.0–4.8 in the LE and finally 4.5 in lysosomes for acidic degradation upon glucose deprivation.
Figure 4.
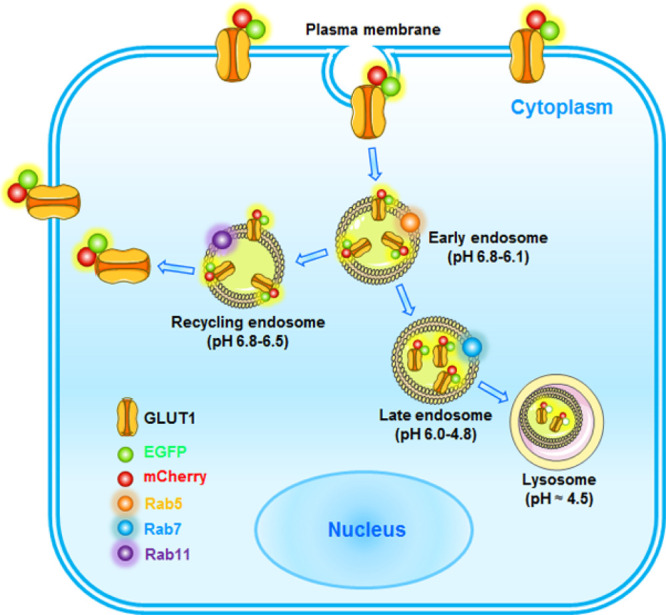
Schematic diagram showing the use of a dual-fluorescence reporter for GLUT1 trafficking in live cells. In normal conditions, mCherry-EGFP-GLUT1 is mainly localized at the PM in multiple cancer cells thereby transporting glucose for glycolysis and cell survival. Following glucose deprivation, mCherry-EGFP-GLUT1 undergoes endocytosis and is efficiently sorted into EE, which can be colocalized with Rab5. Further, glucose deprivation is sufficient to induce an increase of Rab7- and LAMP1-positive trafficking of GLUT1 for acidic degradation, which in turn emits mCherry fluorescence signal (EGFP was quenched by the acidic pH). However, when glucose deprivation is eliminated, Rab11 could facilitate GLUT1 recycling to the PM to transport glucose.
A Proof-of-Concept Study: Small Molecule Screening Using pmCherry-EGFP-GLUT1
Glucose uptake in proliferating cells is predominantly mediated by GLUT1, and the enhanced expression of GLUT1 at the PM contributes to increased glucose metabolism fueling the anabolic metabolism of cancer cells.25 Therefore, targeting GLUT1 and GLUT1-dependent glucose uptake has become a promising strategy for cancer therapy. Recently, a series of natural and synthetic GLUT1 inhibitors have been proposed to modulate glucose metabolism in cancer cells.26,27 Among these natural small molecules, Andro, a diterpenoid lactone isolated from Andrographis paniculata, has been shown to possess anticarcinogenic activity in a variety of cancer cell types. We previously demonstrated that Andro plays a key role in regulating SW 1353 cell proliferation and apoptosis,28 presumably via the regulation of autophagy and glucose metabolism.29−31 Consistent with previous reports, Andro significantly inhibited the expression of SOX9 and Nrf2-dependent autophagy (Figure 5A). In addition, we found that Andro suppressed the endogenous expression of GLUT1 at the PM, which was followed by a reduction in glucose uptake and glycolysis (Figure 5B–F). Since mCherry-EGFP-GLUT1 can be used to monitor the trafficking of GLUT1, we then applied this tool to investigate GLUT1 trafficking in a single cell. As shown in Figure 5G,H, treatment with Andro significantly increased the abundance of red punctate fluorescence in the cytosol and the TC value, suggesting that Andro suppresses GLUT1 expression mainly by targeting GLUT1 for lysosomal degradation. These results provide a proof of concept that pmCherry-EGFP-GLUT1 accurately reflects endogenous changes in GLUT1 in response to treatment with the small molecule Andro. Altering glucose uptake and metabolism with appropriate tool compounds, such as GLUT1 inhibitors, has recently been implicated in oncology and other glucose addiction diseases. Our study also implies the possibility that pmCherry-EGFP-GLUT1 can be utilized as a biosensor for GLUT-1-dependent functional studies and potential small molecule screening.
Figure 5.

Proof of concept: real-time visualization of GLUT1 trafficking for small molecule screening. (A) SW 1353 cells were treated with Andro (10 or 30 μM) in the presence or absence of rapamycin (Rapa-1, 10 μM) for 24 h. The expression levels of Nrf-2, hexokinase 2, SOX9, and p-p70S6K were determined by IB with β-actin as total protein loading control. (B) SW 1353 cells were treated with 30 μM of Andro for 24 h. The subcellular expression of GLUT1 at the plasma (P), cytoplasm (C), and organelles (O) was determined by IB. The expression of Na-K-ATP was used as loading control of P. (C, D) Andro induces a decrease in glucose uptake. SW 1353 cells were treated with Andro for 24 h, and then the glucose uptake was determined using 2-NBDG by flow cytometry, *P < 0.05. (E, F) SW 1353 cells were treated with different concentrations of Andro, and then the ECAR were examined by extracellular flux analysis. Analyzed glycolytic capacity, ****P < 0.0001 (Andro 10 μM), ***P < 0.001 (Andro 30 μM). Analyzed glycolytic reserve, *P < 0.05 (Andro 10 μM), ****P < 0.0001 (Andro 30 μM). (G, H) pmCherry-EGFP-GLUT1 transfected into SW 1353 cells, followed by the treatment with DMSO or Andro for 24 h; the trafficking of GLUT1 was observed using confocal microscopy. Scale bar = 30 μm. The TC value was calculated as indicated above, ***P < 0.001.
Conclusions
Glucose uptake is a fundamental cellular process for energy production in both physiological and pathological conditions and is achieved through a series of GLUT family members including GLUT1.3,15,19 The kinetics of GLUT1 internalization, endosomal sorting, and recycling to the PM play principal roles in maintaining glucose homeostasis.9,16,18 Although several methods, such as immunofluorescence, immunohistochemistry, and biochemical fractionation, can be used to assess the endogenous GLUT1 expression and trafficking, a universal and simple way to monitor GLUT1 and GLUT1-dependent glucose uptake in real-time is lacking. In the present study, we developed a pH-sensitive mCherry-EGFP labeling method to determine GLUT1 trafficking in single live cells.
The dual-fluorescence tracing plasmid expressing mCherry-EGFP-GLUT1 has several unique advantages: (i) it allows for the real-time observation of GLUT1 trafficking between the cell surface and the endolysosomal system in live cells, especially, by the means of super-resolution microscopy; (ii) it allows for GLUT1 functional study by the quantification of GLUT1 kinetic change under diverse conditions at the single-cell level; and (iii) pmCherry-EGFP-GLUT1 can be utilized as a biosensor for potential small molecule screening, e.g., by establishing clustered regularly interspaced short palindromic repeat-based screening both in vitro and in vivo. Alternatively, this system can be optimized by acid-indicating fluorescence such as Keima32 to develop noninvasive approach for monitoring glucose metabolism of tumor cells in vivo. These methods might pave the way for novel therapeutic strategies for targeting GLUT1 and GLUT1-dependent glycolysis in various cancers.
However, some limitations of the present study are not ignorable: (i) since GLUT1 can form high-order complexes to enhance the transportation of glucose in a nonlinear fashion, it is notable that the mCherry-EGFP-GLUT1 fusion protein may affect the formation of higher-order structural complexes; (ii) another possibility that should be considered is that the mCherry-EGFP-GLUT1 chimera might result in altered receptor properties; and (iii) partial degradation (cutting of the linkers) of the mCherry-EGFP-GLUT1 protein in the lysosome somehow might not faithfully reflect the GLUT1 trafficking in cells; thus caution should be taken when analyzing the kinematics of GLUT1 internalization.
Experimental Section
Chemicals
Andrographolide (Andro) and rapamycin (Rapa) were purchased from Selleck Chemicals (USA) and dissolved in dimethyl sulfoxide (DMSO, MP Biomedicals). 2-Deoxy-d-glucose (2-DG) was purchased from Sigma-Aldrich (USA) and was diluted in Dulbecco’s modified Eagle’s medium (DMEM) without glucose (Gibco). All chemical reagents and other solvents used were of analytical grades.
Cell Culture and Reagents
Human chondrosarcoma SW 1353 cells were cultured in DMEM (Gibco) containing 10% heat-inactivated fetal bovine serum (FBS, Biological Industries), 100 units/mL penicillin, 100 μg/mL streptomycin, 0.11 mg/mL sodium pyruvate, and l-glutamine, as described previously.33 Cell transfection was performed by using the transfection reagent Lipofectamine 2000 (Invitrogen, USA) along with the DNA at a 3:1 ratio (μL:μg).
Plasmid Construction
The plasmid expressing mCherry-EGFP-LC3 was a gift from Bin Li (Jinan University, China). For mCherry-EGFP-GLUT1 plasmid construction, cDNA from HEK293T cells was used to amplify GLUT1 using the primers 5′-CGCAAGCTTCATGGAGCCCAGCAGCAAGAAG-3′ and 5′-TCAGGATCCTGGTGATCTGGGGCGACTCAC-3′, and the purified PCR product was inserted in-frame into the pmCherry-EGFP backbone using two enzymatic sizes, HindIII and BamHI. pmCherry-EGFP-GLUT3 was constructed using the primers 5′-CGCAAGCTTGATGGGGACACAGAAGGTCAC-3′ and 5′-TCAGGATCCGAGGTGGAAGGAGGCACGACT-3′. The GLUT1-S226D mutant (pmCherry-EGFP-GLUT1-S226D), which is an activated form of phosphorylation, was generated by replacing serine with aspartic acid at residue 226 using the primers 5′-CGGGCCAAGGATGTGCTAAAG-3′ and 5′-CTTTAGCACATCCTTGGCCCG-3′. The GLUT1-ΔC4 mutant (pmCherry-EGFP-GLUT1-ΔC4), which has been demonstrated to prevent GLUT1 cell surface localization and promote the lysosomal degradation of GLUT1,13 was constructed by deleting the last four residues using the primers 5′-CGCAAGCTTCATGGAGCCCAGCAGCAAGAAG-3′ and 5′-TCAGGATCCTCAAGCCCCCAGGGGATGGAACAG-3′. Myc-Rab5, Myc-Rab7, and Myc-Rab11 were constructed by the ligation of the subcloned fragments into the Myc-vector using the restriction sites SalI and KpnI. The subcloned fragments were amplified from mCherry-Rab5, mCherry-Rab11, and mCherry-Rab7 (a gift from Prof. Xingguo Liu, Guangzhou Institute of Biomedicine and Health, Chinese Academy of Sciences) using the following primers: Rab5-forward: 5′-TATGTCGACGATGGCTAGTCGAGGAGCAAC-3′, Rab5-reverse: 5′-TTGGTACCTTAGTTACTACAACACTGATTCCTGGTTGGCTGTGCAGGCTC-3′, Rab7-forward: 5′-TATGTCGACGATGACCTCTAGGAAGAAAGTGTTG-3′, Rab7-reverse: 5′-TTGGTACCTCAGCAACTGCAGCTTTCTGCCGAGGCCTTGGC-3′, Rab11-forward: 5′-TATGTCGACGATGGGCACCCGCGACGACG-3′, and Rab11-reverse: 5′-TTGGTACCTTAGATGTTCTGACAGCACTGCACCTTTGGCTTG-3′.
Immunofluorescence
SW 1353 cells were grown on 15 mm glass-bottom cell culture dishes (NEST) for 24 h, and then 1.5 μg of the mCherry-EGFP-GLUT1 plasmid was transfected or cotransfected with 1.5 μg of pMyc-Rab5/7/11 using Lipofectamine 2000 (Invitrogen, USA) for 36 h; after DMSO or Andro treatment or glucose starvation for 12 h, the cells were washed twice with phosphate-buffered saline (PBS, HyClone) and then fixed with 4% paraformaldehyde (Beyotime) for 5 min at room temperature. After blocking with 5% nonfat milk, the primary antibody such as a mouse polyclonal antibody against Myc (Cell signaling Technology, 1:800) or a rabbit polyclonal antibody against LAMP1 (Cell signaling Technology, 1:200) was added and incubated overnight at 4 °C. The cells were then washed and incubated with an Alexa Fluor 350 goat anti-mouse IgG (H + L), a highly cross-adsorbed secondary antibody (Thermo Fisher Scientific; 1–10 μg/mL), or an Alexa Fluor 350 goat anti-rabbit IgG (H + L), a highly cross-adsorbed secondary antibody (Thermo Fisher Scientific; 1–10 μg/mL), for 1 h under the dark. For nucleus visualization, the cells were stained with DAPI for 10 min. The images were taken with a laser scanning confocal microscope (ZEISS LSM 700, Germany).
Lysosome Staining
SW 1353 cells were seeded on glass-bottom cell culture dishes for 24 h, and the transient transfection of the pmCherry-GLUT1 plasmid was performed using Lipofectamine 2000 for another 24 h, followed by the presence or absence of glucose for another 24 h. The acidic compartments of SW 1353 cells were stained with the green fluorescent dye LysoTracker Green DND-26. The preheating dye was added at a final concentration of 50 nM and incubated for 30 min. The images were taken with a laser scanning confocal microscope (ZEISS LSM 700, Germany).
Images Analysis
Fluorescence intensity can be semiquantified for relative protein expression. Considering the gradual quenching of EGFP during the process of LE fusion with lysosomes, the ratio of mCherry to EGFP fluorescence intensity in the cytoplasm can accurately reflect the translocation of GLUT1. The aforementioned ratio is normalized to the stable ratio of the red fluorescence intensity and the green fluorescence intensity outside this region. We were able to quantify the TC. Briefly, the single-cell total fluorescence intensity (mCherry or EGFP) was defined as TFI (R or G) within the yellow line of the fluorescence images, while the cytoplasmic fluorescence intensity (mCherry or EGFP) was defined as CFI (R or G), which was marked by a dashed line. The PMFI was calculated by subtracting CFI from TFI. Then, the TC was analyzed using the equation TC = CFI(R/G)/PMFI(R/G). For GLUT1 and subcellular marker colocalization, Pearson’s correlation coefficients were calculated using the Image J software (v2).
Confocal Time-Lapse Imaging
For time-lapse imaging, SW 1353 cells were seeded on glass-bottom cell culture dishes (NEST, Biotechnology, New Orleans, LA, USA) for 24 h, and the transient transfection of the pEGFP-mCherry-GLUT1 plasmid was performed using Lipofectamine 2000 (Invitrogen) for another 48 h, followed by glucose starvation for 2 h. Continuous images were collected at 30 s intervals beginning as soon as the 2-DG (10 μM) was added to observed the endocytic trafficking process at 37 °C in a humidified incubator containing 5% CO2, using the 63× oil objective of a Leica confocal laser scanning microscope (TCS XP8, Germany). EGFP was excited using the 488 nm line of the argon laser source, and mCherry was excited with the 561 nm laser line.
Immunoblotting (IB)
Protein expression levels were determined by IB, as we described previously.34 Total proteins or membrane proteins were extracted from SW 1353 cells using cell lysis buffer for western and IP (Beyotime, China) or a Minute Plasma Membrane Protein Isolation kit (Invent Biotechnologies, USA) according to the manufacturer’s instructions. Since boiling can cause the aggregation of membrane proteins, lysates were denatured at 65 °C for 30 min following the addition of sample buffer as this prevented the aggregation of membrane proteins. The primary antibodies used for IB were as follows: anti-GLUT1 (Cell Signaling Technology; 1:1000), anti-SOX9 (Cell Signaling Technology; 1:1000), anti-Nrf-2 (Cell Signaling Technology; 1:1000), anti-hexokinase II (HK2, Cell Signaling Technology; 1:1000), anti-p-p70 S6K (Cell Signaling Technology; 1:1000), anti-β-actin (Cell Signaling Technology; 1:1000), and anti- Na-K-ATP (Cell Signaling Technology; 1:1000). The HRP-linked anti-rabbit IgG antibody (1:1000–1:2000) and HRP-linked anti-mouse IgG antibody (1:1000–1:2000) were obtained from Cell Signaling Technology.
Glucose Uptake Assay
Glucose uptake was performed on SW 1353 cells by incubating them with a fluorescent 2-deoxy-2-[(7-nitro-2,1,3-benzoxadiazol-4-yl)amino]-d-glucose (2-NBDG, Cayman Chemical). SW 1353 cells were treated with Andro for 24 h, and glucose uptake was determined by incubating the cells in a 37 °C incubator for 20 min with 50 μmol/L 2-NBDG in glucose-free DMEM (Gibco) and then glucose starving them for 30 min. The cells were harvested by trypsinization and washed twice with ice-cold PBS under the dark. After being resuspended, the cells were subjected to BD Accuri C6 PLUS flow cytometry.
Seahorse XF96 Glycolysis Stress Assay
An XF96 extracellular flux analyzer (Seahorse Bioscience, Billerica, MA, USA) was used to determine the extracellular acidification rate (ECAR). Briefly, SW 1353 cells were seeded in 96-well Seahorse XF96 culture plates at a density of 10,000 cells/well with 10% FBS DMEM for 24 h and treated with different concentrations of Andro for another 24 h. The cells were washed and incubated with the base medium at 37 °C in a non-CO2 incubator for 1 h to ensure that the measurements of extracellular pH were accurate. Then, ECAR measurement was taken according to the manufacturer’s instructions using the instrument every 8 min up to 2 h. All seahorse flux data were normalized to total protein content measured by the BCA Protein Quantitation Kit (Biocolor BioScience & Technology Company, Shanghai, China).
Statistical Analysis
All experiments were performed at least three times, and the data are expressed as the mean ± standard deviation (SD). Statistical analysis was performed using the GraphPad Prism 6 software (GraphPad Software, San Diego, CA, USA). Comparisons between two groups were performed by using Student’s t-test, and multiple comparisons were evaluated using one-way analysis of variance with Dunnett’s test. Values of P > 0.05 were considered not significant (n.s.); P < 0.05 was considered statistically significant (*).
Acknowledgments
The authors appreciate funding support from the National Natural Science Foundation of China (81602360, 81672224, and 81871809), National Natural Science Foundation of Guangdong (2019A1515011082, 2017A030313665, 2017A030313556, and 2018A0303130103), Macau Foundation for Development of Science and Technology (0029/2019/A and 111/2015/A), Science and Technology Planning Project of Guangzhou (201707010493), Fundamental Research Funds for the Central Universities (21616326), China Postdoctoral Science Foundation (2016M602606 and 2017T100661); Medical Scientific Research Foundation of Guangdong Province (A2016017), and Major Science and Technology Planning Projects of Tianhe District (2018YZ001).
Glossary
Abbreviations
- GLUT/SLC2A
glucose transporter/solute carrier
- PM
plasma membrane
- TC
translocation coefficient
- BRET
bioluminescent Förster resonance energy transfer
- Andro
andrographolide
- Rapa
rapamycin
- DMSO
dimethyl sulfoxide
- DMEM
Dulbecco’s modified Eagle’s medium
- FBS
fetal bovine serum
- PBS
phosphate-buffered saline
- CFI
cytosolic fluorescence intensity
- PMFI
plasma membrane fluorescence intensity
- 2-DG
2-deoxy-d-glucose
- IB
immunoblotting
- 2-NBDG
2-deoxy-2-[(7-nitro-2,1,3-benzoxadiazol-4-yl)amino]-d-glucose
- ECAR
extracellular acidification rate
- SD
standard deviation
- EE
early endosomes
- LE
late endosomes
- RE
recycling endosomes
- TFI
total fluorescence intensity
Supporting Information Available
The Supporting Information is available free of charge at https://pubs.acs.org/doi/10.1021/acsomega.0c01054.
(Figure S1) Establishment of the GLUT3 tracing system under lysosome activation condition in cancer cells and (Figure S2) GLUT1 trafficking in early and recycling endosomes by assessed mCherry-EGFP-GLUT1 and Rab5/Rab11 imaging (PDF)
Author Contributions
# Z.-Y.L. and Y.-L.S. contributed equally to this work. H.-T.Z. developed the hypothesis, designed the experiments, and drafted and revised the manuscript. Z.-G.Z. supervised the project. Z.-Y.L. and Y.-L.S. conducted the major experiment for confocal microscopy imaging and flow cytometry for glucose uptake. Y.-L.S. and J.-B.L. performed the ECAR assay. All authors contributed to the interpretation of the data and the writing of the manuscript. All authors reviewed and approved the manuscript.
The authors declare no competing financial interest.
Supplementary Material
References
- Gannon M. C.; Nuttall F. Q. Amino acid ingestion and glucose metabolism--a review. IUBMB Life 2010, 62, 660–668. 10.1002/iub.375. [DOI] [PubMed] [Google Scholar]
- Mueckler M.; Thorens B. The SLC2 (GLUT) family of membrane transporters. Mol. Aspects Med. 2013, 34, 121–138. 10.1016/j.mam.2012.07.001. [DOI] [PMC free article] [PubMed] [Google Scholar]
- Macheda M. L.; Rogers S.; Best J. D. Molecular and cellular regulation of glucose transporter (GLUT) proteins in cancer. J. Cell. Physiol. 2005, 202, 654–662. 10.1002/jcp.20166. [DOI] [PubMed] [Google Scholar]
- Koch H.; Weber Y. G. The glucose transporter type 1 (Glut1) syndromes. Epilepsy Behav. 2019, 91, 90–93. 10.1016/j.yebeh.2018.06.010. [DOI] [PubMed] [Google Scholar]
- Yu M.; Yongzhi H.; Chen S.; Luo X.; Lin Y.; Zhou Y.; Jin H.; Hou B.; Deng Y.; Tu L.; et al. The prognostic value of GLUT1 in cancers: a systematic review and meta-analysis. Oncotarget 2017, 8, 43356–43367. 10.18632/oncotarget.17445. [DOI] [PMC free article] [PubMed] [Google Scholar]
- Granja S.; Pinheiro C.; Reis R. M.; Martinho O.; Baltazar F. Glucose Addiction in Cancer Therapy: Advances and Drawbacks. Curr. Drug Metab. 2015, 16, 221–242. 10.2174/1389200216666150602145145. [DOI] [PubMed] [Google Scholar]
- You M.; Jin J.; Liu Q.; Xu Q.; Shi J.; Hou Y. PPARα Promotes Cancer Cell Glut1 Transcription Repression. J. Cell. Biochem. 2017, 118, 1556–1562. 10.1002/jcb.25817. [DOI] [PubMed] [Google Scholar]
- Kozlovsky N.; Rudich A.; Potashnik R.; Ebina Y.; Murakami T.; Bashan N. Transcriptional activation of the Glut1 gene in response to oxidative stress in L6 myotubes. J. Biol. Chem. 1997, 272, 33367–33372. 10.1074/jbc.272.52.33367. [DOI] [PubMed] [Google Scholar]
- Roy S.; Leidal A. M.; Ye J.; Ronen S. M.; Debnath J. Autophagy-Dependent Shuttling of TBC1D5 Controls Plasma Membrane Translocation of GLUT1 and Glucose Uptake. Mol. Cell 2017, 67, 84–95.e5. 10.1016/j.molcel.2017.05.020. [DOI] [PMC free article] [PubMed] [Google Scholar]; e85
- Huotari J.; Helenius A. Endosome maturation. EMBO J. 2011, 30, 3481–3500. 10.1038/emboj.2011.286. [DOI] [PMC free article] [PubMed] [Google Scholar]
- Langemeyer L.; Fröhlich F.; Ungermann C. Rab GTPase Function in Endosome and Lysosome Biogenesis. Trends Cell Biol. 2018, 28, 957–970. 10.1016/j.tcb.2018.06.007. [DOI] [PubMed] [Google Scholar]
- Lee E. E.; Ma J.; Sacharidou A.; Mi W.; Salato V. K.; Nguyen N.; Jiang Y.; Pascual J. M.; North P. E.; Shaul P. W.; et al. A Protein Kinase C Phosphorylation Motif in GLUT1 Affects Glucose Transport and is Mutated in GLUT1 Deficiency Syndrome. Mol. Cell 2015, 58, 845–853. 10.1016/j.molcel.2015.04.015. [DOI] [PMC free article] [PubMed] [Google Scholar]
- Wieman H. L.; Horn S. R.; Jacobs S. R.; Altman B. J.; Kornbluth S.; Rathmell J. C. An essential role for the Glut1 PDZ-binding motif in growth factor regulation of Glut1 degradation and trafficking. Biochem. J. 2009, 418, 345–367. 10.1042/BJ20081422. [DOI] [PMC free article] [PubMed] [Google Scholar]
- Mueckler M. M.; Hruz P. W. Structural analysis of the GLUT1 facilitative glucose transporter. Mol. Membr. Biol. 2009, 18, 183–193. 10.1080/09687680110072140. [DOI] [PubMed] [Google Scholar]
- Deng D.; Xu C.; Sun P.; Wu J.; Yan C.; Hu M.; Yan N. Crystal structure of the human glucose transporter GLUT1. Nature 2014, 510, 121–125. 10.1038/nature13306. [DOI] [PubMed] [Google Scholar]
- Yeh J.-I.; Verhey K. J.; Birnbaum M. J. Kinetic analysis of glucose transporter trafficking in fibroblasts and adipocytes. Biochemistry 1995, 34, 15523–15531. 10.1021/bi00047a018. [DOI] [PubMed] [Google Scholar]
- Looyenga B.; VanOpstall C.; Lee Z.; Bell J.; Lodge E.; Wrobel K.; Arnoys E.; Louters L. Determination of GLUT1 Oligomerization Parameters using Bioluminescent Förster Resonance Energy Transfer. Sci. Rep. 2016, 6, 29130. 10.1038/srep29130. [DOI] [PMC free article] [PubMed] [Google Scholar]
- Wu N.; Zheng B.; Shaywitz A.; Dagon Y.; Tower C.; Bellinger G.; Shen C.-H.; Wen J.; Asara J.; McGraw T. E.; et al. AMPK-dependent degradation of TXNIP upon energy stress leads to enhanced glucose uptake via GLUT1. Mol. Cell 2013, 49, 1167–1175. 10.1016/j.molcel.2013.01.035. [DOI] [PMC free article] [PubMed] [Google Scholar]
- Galochkina T.; Chong M. N. F.; Challali L.; Abbar S.; Etchebest C. New insights into GluT1 mechanics during glucose transfer. Sci. Rep. 2019, 9, 998. 10.1038/s41598-018-37367-z. [DOI] [PMC free article] [PubMed] [Google Scholar]
- Kimura S.; Noda T.; Yoshimori T. Dissection of the autophagosome maturation process by a novel reporter protein, tandem fluorescent-tagged LC3. Autophagy 2007, 3, 452–460. 10.4161/auto.4451. [DOI] [PubMed] [Google Scholar]
- Ramírez-Peinado S.; León-Annicchiarico C. L.; Galindo-Moreno J.; Iurlaro R.; Caro-Maldonado A.; Prehn J. H. M.; Ryan K. M.; Muñoz-Pinedo C. Glucose-starved cells do not engage in prosurvival autophagy. J. Biol. Chem. 2013, 288, 30387–30398. 10.1074/jbc.M113.490581. [DOI] [PMC free article] [PubMed] [Google Scholar]
- Holman G. D. Chemical biology probes of mammalian GLUT structure and function. Biochem. J. 2018, 475, 3511–3534. 10.1042/BCJ20170677. [DOI] [PMC free article] [PubMed] [Google Scholar]
- Bucci C.; Thomsen P.; Nicoziani P.; McCarthy J.; van Deurs B. Rab7: a key to lysosome biogenesis. Mol. Biol. Cell 2017, 11, 467–480. 10.1091/mbc.11.2.467. [DOI] [PMC free article] [PubMed] [Google Scholar]
- Galvez T.; Gilleron J.; Zerial M.; O’Sullivan G. A. SnapShot: Mammalian Rab proteins in endocytic trafficking. Cell 2012, 151, 234–234. e232 10.1016/j.cell.2012.09.013. [DOI] [PubMed] [Google Scholar]
- Chan D. A.; Sutphin P. D.; Nguyen P.; Turcotte S.; Lai E. W.; Banh A.; Reynolds G. E.; Chi J.-T.; Wu J.; Solow-Cordero D. E.; et al. Targeting GLUT1 and the Warburg effect in renal cell carcinoma by chemical synthetic lethality. Sci. Transl. Med. 2011, 3, 94ra70. 10.1126/scitranslmed.3002394. [DOI] [PMC free article] [PubMed] [Google Scholar]
- Meng Y.; Xu X.; Luan H.; Li L.; Dai W.; Li Z.; Bian J. The progress and development of GLUT1 inhibitors targeting cancer energy metabolism. Future Med. Chem. 2019, 11, 2333–2352. 10.4155/fmc-2019-0052. [DOI] [PubMed] [Google Scholar]
- Reckzeh E. S.; Waldmann H. Small-Molecule Inhibition of Glucose Transporters GLUT-1-4. ChemBioChem 2019, 21, 45–52. 10.1002/cbic.201900544. [DOI] [PMC free article] [PubMed] [Google Scholar]
- Zhang H.-T.; Yang J.; Liang G.-H.; Gao X.-J.; Sang Y.; Gui T.; Liang Z.-J.; Tam M.-S.; Zha Z.-G. Andrographolide Induces Cell Cycle Arrest and Apoptosis of Chondrosarcoma by Targeting TCF-1/SOX9 Axis. J. Cell. Biochem. 2017, 118, 4575–4586. 10.1002/jcb.26122. [DOI] [PubMed] [Google Scholar]
- Soo H. L.; Quah S. Y.; Sulaiman I.; Sagineedu S. R.; Lim J. C. W.; Stanslas J. Advances and challenges in developing andrographolide and its analogues as cancer therapeutic agents. Drug Discovery Today 2019, 24, 1890–1898. 10.1016/j.drudis.2019.05.017. [DOI] [PubMed] [Google Scholar]
- Mishra S. K.; Tripathi S.; Shukla A.; Oh S. H.; Kim H. M. Andrographolide and analogues in cancer prevention. Front. Biosci., Elite Ed. 2015, 7, 255–266. [DOI] [PubMed] [Google Scholar]
- Yu B. C.; Chang C. K.; Su C. F.; Cheng J. T. Mediation of beta-endorphin in andrographolide-induced plasma glucose-lowering action in type I diabetes-like animals. Naunyn-Schmiedeberg’s Arch. Pharmacol. 2008, 377, 529–540. 10.1007/s00210-007-0240-0. [DOI] [PubMed] [Google Scholar]
- Katayama H.; Kogure T.; Mizushima N.; Yoshimori T.; Miyawaki A. A Sensitive and Quantitative Technique for Detecting Autophagic Events Based on Lysosomal Delivery. Chem. Biol. 2011, 18, 1042–1052. 10.1016/j.chembiol.2011.05.013. [DOI] [PubMed] [Google Scholar]
- Zhang H.-T.; Gui T.; Sang Y.; Yang J.; Li Y.-H.; Liang G.-H.; Li T.; He Q.-Y.; Zha Z.-G. The BET Bromodomain Inhibitor JQ1 Suppresses Chondrosarcoma Cell Growth via Regulation of YAP/p21/c-Myc Signaling. J. Cell. Biochem. 2017, 118, 2182–2192. 10.1002/jcb.25863. [DOI] [PubMed] [Google Scholar]
- Yang J.; Li Y.-H.; He M.-T.; Qiao J.-F.; Sang Y.; Cheang L. H.; Gomes F. C.; Hu Y.; Li Z.-Y.; Liu N.; et al. HSP90 regulates osteosarcoma cell apoptosis by targeting the p53/TCF-1-mediated transcriptional network. J. Cell. Physiol. 2019, 235, 3894–3904. 10.1002/jcp.29283. [DOI] [PubMed] [Google Scholar]
Associated Data
This section collects any data citations, data availability statements, or supplementary materials included in this article.