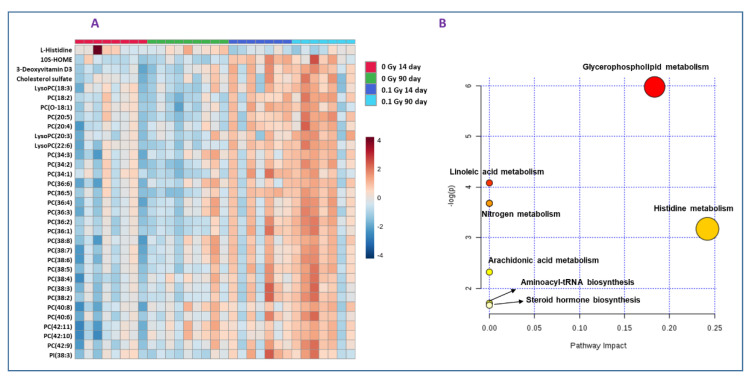
Figure 3.
Dysregulated metabolites and biochemical pathways of low dose high-LET radiation. Panel (A): Hierarchical clustering analysis of differential metabolite expression in the irradiated and sham groups. Panels (B): Pathway analysis of differentially abundant metabolites identified in plasma from mice exposed to 0.1 Gy 16O compared to sham using MetaboAnalyst 3.0.

