Abstract
Adaptive optics (AO) scanning laser ophthalmoscopy offers cellular level in-vivo imaging of the human cone mosaic. Existing analysis of cone photoreceptor density in AO images require accurate identification of cone cells, which is a time and labor-intensive task. Recently, several methods have been introduced for automated cone detection in AO retinal images using convolutional neural networks (CNN). However, these approaches have been limited in their ability to correctly identify cones when applied to AO images originating from different locations in the retina, due to changes to the reflectance and arrangement of the cone mosaics with eccentricity. To address these limitations, we present an adapted CNN architecture that incorporates spatial information directly into the network. Our approach, inspired by conditional generative adversarial networks, embeds the retina location from which each AO image was acquired as part of the training. Using manual cone identification as ground truth, our evaluation shows general improvement over existing approaches when detecting cones in the middle and periphery regions of the retina, but decreased performance near the fovea.
Keywords: CNN, Cone Detection, Adaptive Optics, Retina
1. INTRODUCTION
Adaptive optics (AO) scanning light ophthalmoscopy (SLO) [1, 2] is a cutting-edge retinal imaging modality that offers high resolution in-vivo images of photoreceptors in the human retina. While AOSLO has the capability to monitor and study cellular level change in the retina, accurate identification of cone photoreceptors within each AO image is required for such analysis. This task, generally performed by a human grader, is both labor and time intensive, placing limitations on both the scale and timeframe of potential AO imaging studies. [3] Recently, convolution neural network (CNN) based approaches have been proposed for the automated detection of cones in confocal and split detector AOSLO images. [4–6] In these methods, CNN is used to generate the probability that a pixel location in an image belongs to a cone in order to create a cone probability map for each AO image. The algorithm then detects the local maxima in the probability maps and identify them as cones. However, these approaches are shown to be less effective when operating on AO images acquired from different regions of the retina. This limitation is a result of changes to the reflectance and density of cones with respect to its distance from the fovea. [3] Cones are smaller and more tightly packed near the fovea but become larger and more spread out as distance from the fovea increases. In the perifoveal and peripheral locations, rod photoreceptors become more visible, resulting in potential false positive identifications.
To address these limitations, Cunefare et al. proposed RAC-CNN [6], which has several advantages over previous designs. First, it uses a semantic, U-net [7] architecture to produce whole image probability maps, which drastically reduce the computation time relative to previous patch-based designs [4]. Second, it used two different AO modalities (confocal [1] and split detector [2]) as the input data, allowing the network to use multi-modal information to aid the identification. Lastly, it incorporated manual identification of rod photoreceptor to train the network to also find rods within the AO images. This allowed the method to both reduce false positive cone detection, and indirectly provide contextual information regarding the location of AO image in the retina (since the number of rods in the image corresponds with how far away the region is from the fovea).
While RAC-CNN offered improved performance and speed over previous CNN based cone detection approaches, its general usability decreased due to its reliance on the ability to observe rods within the images. In general, image quality and motion artifacts often prevent the acquisitions of images where rods are fully visible. The appearance of rods can range dramatically within the same image, with some being fully resolved, while others are heavily distorted, blurred, or not visible at all. This is particularly true for patient data, which tend to be of lower image quality, and where the pathology can directly interfere with observation of such structures in the image. As a result, rods within an image often cannot be accurately identified even by human grader.
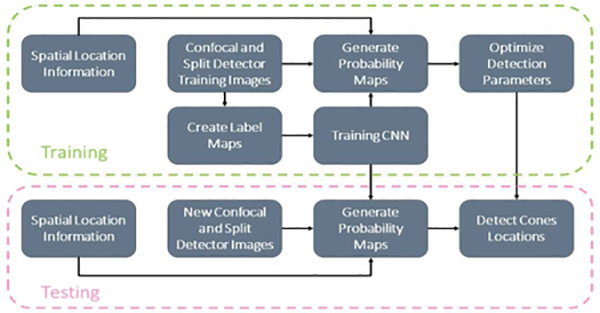
In this work, we build upon the advancements made in RAC-CNN but have removed the need for rod identification to provide contextual information for the identification. Instead, we have adapted the architecture to directly incorporate additional spatial information to inform the network on where each AO image originated from in the retina. Our approach, inspired by conditional generative adversarial networks (cGAN) [8], allows the network to associate specific patterns of cone reflectance with their respective location in the retina. This allows the network to differentiate between cones from the periphery and the cones from the fovea, whereas previously, cones from both locations would have been treated the same. Fig. 1 shows a high-level diagram of our algorithm design.
Figure 1.
Diagram of the proposed algorithm for automated cone detection in AO images.
2. METHOD
2.1. CNN
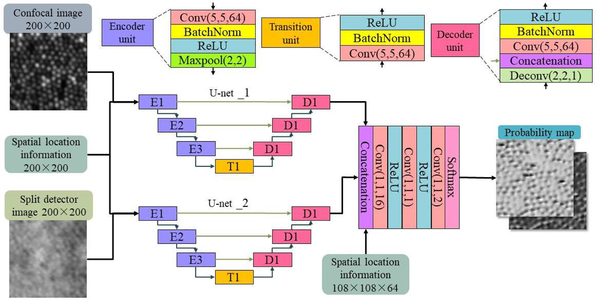
Our network architecture (Fig. 2) builds upon the RAC-CNN [6] design, which uses two U-nets [7] to process confocal and split detector images separately and concatenate them in a mixing layer. Each U-net is made up of 3 encoder blocks, a transition block and 3 decoder blocks. Skip connections exist from each encoder block to the corresponding decoder block. Each encoder block has a convolutional layer, a batch normalization layer, a Rectified Linear Unit (ReLU) layer and a max pooling layer in sequence. The transition block consists of a convolutional layer, a batch normalization layer and a ReLU layer. Finally, each decoder block has a deconvolutional layer, a concatenation layer, a convolutional layer, a batch normalization layer and a ReLU layer in sequence.
Figure 2.
Diagram of the CNN architecture used in the proposed method.
For all convolutional layers in the U-nets, we used 64 kernels with size 5×5×D (where D is the size of the third dimension of the input feature map). The max pooling layers downsample the width and height of the input feature maps by half. All deconvolutional layers have 64 kernels with size 5×5×D, which then upsample the input feature maps to their original dimensions. In order to better combine feature maps with spatial information (described below), our mixing layers consists of 3 convolutional layers (all 1×1×D, with D=16, 1 and 2, respectively) and 2 ReLU layers in cross arrangement, ending up with a SoftMax layer. Lastly, RAC-CNN [6] uses cross-entropy as its loss function, however in our experiments, we found that using the Dice’s coefficient of the cones provided better results and faster computation times. Since the cone locations in the training data represent single points on the image, we convert each location into labels in a pair of background and foreground label maps. On the foreground image, we place a circular label with a radius of 0.1M centered on each cone location, where M is the shortest distance between cone locations in the image, as calculated by a k-Nearest Neighbor algorithm. The background label map is then set as the complimentary of the foreground map.
2.2. Incorporating Spatial Information
To incorporate spatial information into our network, we drew inspiration from conditional generative adversarial networks [8], which adds conditional information as an additional input layer into its generator and discriminator. Following this idea, we added an input layer consisting of the retinal location of the image into the beginning of the U-Nets and at the start of the mixing layers. The dimensions of the spatial information input are the same as other input maps at each respective layer, and the retinal location the image was acquired from is linearly encoded to be between 0 and 1, where 0 is the location of the fovea, and 1 is the furthest retinal location in our images (~2500 μm).
2.4. Cone Detection
We followed the approach described by Cunefare et al. [4] to convert the probability maps from our network output into cone locations. The output from our network consists of two probability maps, representing the probability that each pixel location belongs to a cone photoreceptor center or the background. We extract the cone probability map and smooth it with a Gaussian kernel (σ=0.8) in order to filter out potential noise and small local maxima in the probability map. We then apply an extended-maximal transform using MATLAB’s imextendedmax function to find connecting maximal regions where probability differences are below 0.6 and remove weak candidates by thresholding values below 0.7. Finally, using a clustering algorithm, we find the cone center location. All parameters used in our algorithm were selected empirically using our training dataset.
3. EXPERIMENTS
3.1. Data
121 pairs of confocal and split detector AO images were acquired from the eyes of 12 healthy subjects using a previously described protocol. [3,9] The images were separated into a training and validation dataset. The training dataset consisted of 99 images of each modality and was used in the development and training of the CNN. The validation dataset consisted of 22 images of each modality and left out of the development process until the final evaluation. All images in both datasets were cropped to the size of 200×200 pixels. For each image, manual ground truth cone locations were identified by a trained human grader.
3.2. Validation
We evaluated our network using the validation dataset by comparing the cones identified by the algorithm against the manual ground truth. As a comparison to the proposed algorithm, we also used the validation dataset to evaluate the performance of the openly available CNN algorithm presented by Cunefare et al. [4] and the performance of the proposed algorithm when not using spatial information. Without spatial information, our method closely resembles the design presented for RAC-CNN [6], but without the use of rod photoreceptor location inputs. (RAC-CNN was not made openly available for a direct comparison.)
To evaluate the performance of each algorithm, we calculated the true positive rate, false discovery rate, and Dice’s coefficient between the algorithm and manual cone identification in each image. These measures were evaluated as follows: For each cone location coordinate (CAutomatic) identified in the algorithm result (RAutomatic), we used a k-Nearest Neighbor (KNN) algorithm to find the nearest coordinate (CManual) match from the manual result (RManual) for the same image, if the distance between the matched automated and manual coordinate was less than L/2, we would define this match as correct. L is a distance threshold that determines when two coordinates are located on the same cone. For this evaluation, we chose L as the mean shortest distance between the manual cone coordinates, which was also calculated using KNN. After all of the CAutomatic were matched, we counted the number of correct matches as true positives (NTP), the number of CAutomatic which didn’t have a corresponding manual match as false positives (NFP), and the number of CManual which weren’t matched to by the algorithm as false negatives (NFN). Using these values, we calculated the true positive rate, false discovery rate, and Dice’s coefficient to evaluate the performance of each result.
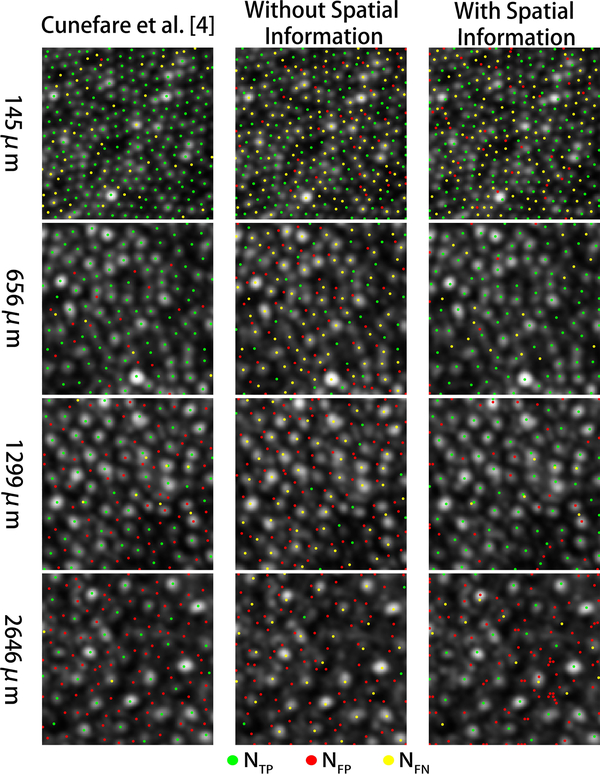
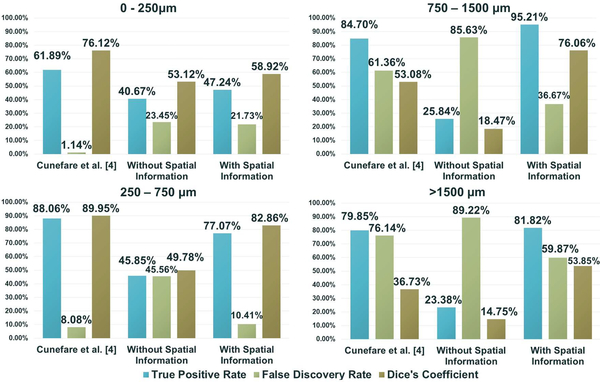
Fig. 3 shows examples of this analysis on confocal AO images from different locations of the retina. The cones detected by each algorithm (and their accuracy relative to the manual grader) is shown on each image. Fig. 4 shows the mean performance of each algorithm with respect to the retinal location of the AO images, over the validation dataset.
Figure 3.
Examples of cones identified using Cunefare et al. [4], and our proposed method with and without spatial information on confocal AO images at different eccentricities. The dots overlaid on each image show each algorithm’s true positives (green), false positives (red), and false negatives (yellow), relative to the manual ground truth.
Figure 4.
Mean true positive rate, false discovery rate, and Dice’s coefficient of the three algorithms’ cone detection results compared to the manual cone identifications. Each plot shows the mean results for images within a specific range of eccentricity in the retina.
3.3. Computation Time
All three algorithms were evaluated on a laptop PC with an i5–8300H CPU, 8 GB of RAM, and a NVIDIA GeForce GTX 1050Ti GPU. Cunefare et al. [4] was ran in MATLAB R2018a and MatConvNet. Our method with and without spatial information were ran on Python 3.6 and TensorFlow. Table 1. shows the mean and standard deviation of the computation time for each of the three algorithms when run on the validation dataset.
Table 1.
Mean runtime of each algorithm on the validation dataset.
| Runtime | Cunefare et al. [4] | Without Spatial Information | With Spatial Information |
|---|---|---|---|
| Mean | 3.763s | 1.329s | 1.524s |
| Standard Deviation | 0.221s | 2.674s | 1.408s |
4. DISCUSSION
In Fig. 4 we see that the relative performance of the three algorithms differed depending on the retinal eccentricity of the AO images. On average, our proposed algorithm had higher true positive rate and Dice, and lower false discovery rate than the other algorithms for images far away from the fovea (>750μm). However, for regions near the fovea (<250μm), Cunefare et al.’s [4] algorithm performed the best on average. For the proposed algorithm, much of the errors in this region was a result of producing more false negative detection near the fovea. We believe this may be a result of the dense cone structure near the fovea causing the probability maps from the semantic architecture to be more blurred, resulting in dark regions being marked as cones. Cunefare et al.’s [4] algorithm is likely less affected by this due to the patch-based windowing during the detection. Fig. 4 also demonstrates the impact of using spatial information as an additional input. In general, we see that adding spatial information increased the algorithm’s performance (by all three measures) on images from regions away from the fovea (>250 μm). However, the additional information did not appear to change the performance of the algorithm near the fovea (<250 μm). This suggests that the spatial location information was able to help specify changes to the appearance of cones across different eccentricities.
Table 1 shows that on average the proposed algorithm is about twice as fast as the method by Cunefare et al. [4]. This was expected since the semantic U-Net design operates on the whole image, whereas Cunefare et al.’s approach [4] needs to expand the images into multiple batches before input, which increases the size of the input feature map. When comparing between using and not using the spatial information, we observed a ~15% increase in runtime. Again, this is expected due to the additional input channel. However, this increase in computation time was offset by the performance gained. Lastly, Table 1 shows that the standard deviation of the proposed algorithm was larger than Cunefare et al.’s [4] method, but the sum of the mean and first standard deviation for both algorithms were roughly equivalent. This showed that the proposed method was able to improve the runtime on the majority of the images while keeping close to the same runtime for the remaining images.
5. CONCLUSIONS
In this work, we introduced a CNN design that uses retinal location information to assist cones photoreceptors detections within the AO image. Our results suggest that providing spatial information to the network can improve cone detection in peripheral images with relatively little increase in computation time. Future work will focus on reducing additional false positive detection in the foveal images when using the proposed network.
ACKNOWLEDGEMENT
National Eye Institute, National Institute of Health (NEI, NIH) (P30 EY001583, U01 EY025477, R01 EY028601); Research to Prevent Blindness, the Foundation Fighting Blindness; the F. M. Kirby Foundation; and the Paul and Evanina Mackall Foundation Trust.
7. REFERENCES
- [1].Dubra A, Sulai Y, Norris JL, Cooper RF, Dubis AM, Williams DR, and Carroll J, “Noninvasive imaging of the human rod photoreceptor mosaic using a confocal adaptive optics scanning ophthalmoscope,” Biomed. Opt. Express 2(7), 1864–1876, 2011. [DOI] [PMC free article] [PubMed] [Google Scholar]
- [2].Scoles D, Sulai YN, Langlo CS, Fishman GA, Curcio CA, Carroll J, and Dubra A, “In vivo imaging of human cone photoreceptor inner segments,” Invest. Ophthalmol. Visual Sci. 55(7), 4244–4251, 2014. [DOI] [PMC free article] [PubMed] [Google Scholar]
- [3].Morgan JI, Vergilio GK, Hsu J, Dubra A, and Cooper RF, “The reliability of cone density measurements in the presence of rods,” Translational vision science & technology 7, 21–21, 2018. [DOI] [PMC free article] [PubMed] [Google Scholar]
- [4].Cunefare D, Fang L, Cooper RF, Dubra A, Carroll J, and Farsiu S, “Open source software for automatic detection of cone photoreceptors in adaptive optics ophthalmoscopy using convolutional neural networks,” Sci. Rep. 7(1), 6620, 2017. [DOI] [PMC free article] [PubMed] [Google Scholar]
- [5].Cunefare D, Langlo CS, Patterson EJ, Blau S, Dubra A, Carroll J, and Farsiu S, “Deep learning based detection of cone photoreceptors with multimodal adaptive optics scanning light ophthalmoscope images of achromatopsia,” Biomed. Opt. Express 9(8), 3740–3756, 2018. [DOI] [PMC free article] [PubMed] [Google Scholar]
- [6].Cunefare D, Huckenpahler A, Patterson E, Dubra A, Carroll J, Farsiu S, “RAC-CNN: multimodal deep learning based automatic detection and classification of rod and cone photoreceptors in adaptive optics scanning light ophthalmoscope images.” Biomedical Optics Express. 10.3815.10.1364/BOE.10.003815, 2019. [DOI] [PMC free article] [PubMed] [Google Scholar]
- [7].Ronneberger O, Fischer P, and Brox T, “U-net: Convolutional networks for biomedical image segmentation,” in International Conference on Medical Image Computing and Computer-Assisted Intervention, pp.234–241, 2015. [Google Scholar]
- [8].Mirza M and Osindero S Conditional Generative Adversarial Nets. arXiv:1411.1784 [cs, stat], Nov. 2014. arXiv: 1411.1784 [Google Scholar]
- [9].Jackson K, Vergilio GK, Cooper RF, Ying G-S, and Morgan JI, “A 2-year longitudinal study of normal cone photoreceptor density,” Investigative ophthalmology & visual science 60, 1420–1430, 2019. [DOI] [PMC free article] [PubMed] [Google Scholar]


