Abstract
Natural products continue to be major sources of bioactive compounds and drug candidates not only because of their unique chemical structures but also because of their overall favorable metabolism and pharmacokinetic properties. The number of publicly accessible natural product databases has increased significantly in the past few years. However, the systematic ADME/Tox profile has been reported on a limited basis. For instance, BIOFACQUIM was recently published as a public database of natural products from Mexico, a country with a rich source of biomolecules. However, its ADME/Tox profile has not been reported. Herein, we discuss the results of an in-depth in silico ADME/Tox profile of natural products in BIOFACQUIM and other large public collections of natural products. It was concluded that the absorption and distribution profiles of compounds in BIOFACQUIM are similar to those of approved drugs, while the metabolism profile is comparable to that in the other natural product databases. The excretion profile of compounds in BIOFACQUIM is different from that of the approved drugs, but their predicted toxicity profile is comparable. This work further contributes to the deeper characterization of natural product collections as major sources of bioactive compounds with therapeutic potential.
1. Introduction
Natural products (NPs) offer diverse therapeutic alternatives as a result of their ability to produce diverse bioactive metabolites with scaffolds of difficult synthesis. NPs also show a broad range of biological activities, although some NPs have toxicity issues. Indeed, it is estimated that about 40% of all approved drugs have origin in NPs or are an inspiration from them.1,2 A recent estimation indicated that in 2014 this percentage increased to 50%.3 This includes drugs that were obtained from synthetic and semisynthetic derivatives or drugs whose scaffolds were identified from natural sources.1
As NPs are contributing to drug discovery programs, there has been a boost in the development of databases of NPs, many of which are now in the public domain. In the last 20 years, there was a rapid increase in the number of various databases and collections as general or thematic resources for NP information. Over 120 different NPs databases and collections were published and reused since 2000. Of them, 98 are still somehow accessible and only 50 are open access. The latter include not only databases but also large collections of NPs published as Supporting Information in scientific publications and collections that were backed up in the ZINC database for commercially available compounds. Some databases, even published relatively recently, are already not accessible anymore, which leads to a dramatic loss of data on NPs.4 The virtual NP libraries include encyclopedic databases as well as many specialized libraries focused, among others, on NPs related to certain geographic regions5 or specific indications.4 In addition to NPs, combinatorial libraries are attractive sources to expand the medicinally relevant chemical space. Some combinatorial libraries, although small-sized, are inspired by NP scaffolds.7
One of the recently developed databases of NPs is BIOFACQUIM. This is a novel compound database with compounds isolated and characterized from Mexican natural sources. BIOFACQUIM is being built, curated, and maintained manually by an academic group in the School of Chemistry, UNAM. The first version of BIOFACQUIM was published in 2018 and includes 423 compounds. Figure 1 shows the representative chemical scaffolds of compounds in BIOFACQUIM. It should be noted that 316 compounds were isolated from 49 different plant genera, 98 were isolated from 19 genera of fungi, and nine compounds were isolated from Mexican propolis (a sticky dark-colored hive product collected by bees from living plant sources).8 The most recent version of BIOFACQUIM contains 535 compounds. The last version has a higher scaffold diversity than the first release, and it also has privileged functional groups.9
Figure 1.
Most frequent chemical scaffolds identified in the first version of BIOFACQUIM.
Absorption, distribution, metabolism, and excretion (ADME) properties play a significant role in drug development.10 In fact, around 40% of all drug failures are, overall, due to ADME problems. Despite the fact that preclinical ADME studies have led to a reduction of failures caused by pharmacokinetics (PK), drug toxicity remains a problem. Both, nonoptimal ADME and toxicity can end up with late-stage failures, responsible for a large unproductive investment of time and money.11 Toward the improvement of ADME prediction, in silico models are contributing to drug optimization. Due to the complexity of the ADME process, it is not possible to make decisions based on a single descriptor.12 Big data and machine learning implementations promise a hopeful landscape in ADME13 and toxicity prediction.14
Since NPs are relevant in drug discovery as well as ADME/Tox profiling of chemical databases, there have been efforts to obtain, at least in silico, the ADME/Tox profile of NP databases. For instance, a computational ADME/Tox profiling of several different phytochemical databases with a detailed analysis of diverse PK criteria was recently published. It was concluded that 24 compounds have all of the ADME/Tox properties that can be considered for drug development.5 However, the ADME/Tox profile of BIOFACQUIM has not been reported.
Based on the fact that NPs are excellent sources of drug candidates and that it is valuable to obtain their in silico ADMETox profile,15,16 the objective of this work was to obtain a detailed ADME/Tox profile of the NPs included in the BIOFACQUIM database and compare them with the ADME/Tox properties of other NP databases. This work further contributes to the deeper characterization of NP collections for their applications in drug discovery.
2. Materials and Methods
2.1. Databases
To characterize the diversity of BIOFACQUIM and to explore the diversity of ADME/Tox properties, four compound databases of a broad interest in drug discovery were used as a reference. Table 1 summarizes the compound databases used in this work, which are described below. The link to the relevant publication is provided. From there, the reader can see the details of each compound database and access the website of the collection.
Table 1. BIOFACQUIM and Reference Databases Used in This Work.
| database | number of compounds | link |
|---|---|---|
| BIOFACQUIM | 531 | http://dx.doi.org/10.3390/biom9010031 |
| FDA | 1692 | http://dx.doi.org/10.1093/nar/gkx1037 |
| AfroDB | 954 | http://dx.doi.org/10.1371/journal.pone.0078085 |
| NuBBEDB | 1333 | http://dx.doi.org/10.1038/s41598-017-07451-x |
| TCM | 2000 | http://dx.doi.org/10.1371/journal.pone.0015939 |
Small-molecule drugs approved by the Food and Drug Administration (FDA) of the United States were obtained from the DrugBank database17 using an in house script.
As mentioned in Introduction, BIOFACQUIM compounds were isolated from diverse natural sources in Mexico and several of them have shown biological activity.8 The most recent version of BIOFACQUIM contains 535 compounds that have larger scaffold diversity than compounds in the first release and also have demonstrated to contain privileged functional groups.9
AfroDB is an NP database from the flora of the African continent. It has recorded activities for a broad range of tropical diseases as well as diseases dominant in rich countries.16
NuBBEDB is a collection of NPs from Brazil that contains botanic, chemical, pharmacologic, and toxicologic information of compounds and derivatives from plants and microorganisms.6
Traditional Chinese Medicine Database@Taiwan (TCM) collects information from Chinese medical texts and scientific publications. This web-based database contains more than 42 000 unique NPs based on ∼16 000 Murcko scaffolds and more than 20 000 pure compounds isolated from 453 TCM ingredients.18 In this work, a sample of 2000 compounds was taken from TCM to minimize the use of imbalanced data sets.
For each database, removal of inorganic compounds and neutralization of salts was done using KNIME.19
2.2. ADME Descriptors
Only when the ADME/Tox properties of a druglike compound are of sufficiently high quality, and when the target has been validated, the compound could be developed into new medication.20,21 This is why diverse methods have been integrated into web servers to predict drug-likeness of molecules.22 For instance, Jia et al. recently reviewed freely accessible online resources to evaluate drug-likeness of compound data sets. It was concluded that comprehensive databases that collect and offer high-quality and up-to-date data are essential for constructing rules or models for in silico drug-likeness evaluation. It was also found that online ADME/Tox resources provide useful guidelines to extract rational compounds that match the desirable PK properties or to filter compounds that are not likely to be drugs. Finally, it was concluded that NP databases are attractive sources for selecting novel scaffolds with promising bioavailability properties.22
Some physical properties have a strong correlation with ADME endpoints. For example, log Pw/oct (the partition coefficient of a compound between water and 1-octanol) has a strong association with the permeability of compounds. In the past several decades, a significant amount of in vitro and in vivo assay data has been accumulated as a byproduct of pharmaceutical development. This accumulated data enabled the development of models and software to predict ADME properties with high reliability and accuracy.23
2.3. Toxicity Descriptors
Determining the toxicity of chemical compounds is necessary to identify their harmful effects on humans, animals, plants, or the environment. In vivo animal tests are constrained by time, ethical considerations, and financial burden. Therefore, computational methods for estimating the toxicity of chemicals are considered useful. In silico toxicology aims to complement existing toxicity tests to predict toxicity, prioritize chemicals, guide toxicity tests, and minimize late-stage failures in drug design.14,24
3. Results and Discussion
3.1. ADME/Tox Descriptors
To calculate the ADME/Tox-related descriptors of BIOFACQUIM and the reference databases (Table 1), we used the SwissADME and pkCSM—pharmacokinetics servers. As discussed in this section, the two web servers have been extensively validated with experimental data (cf. refs (26, 38), vide infra). In addition, these web servers were selected because they are freely accessible and provide robust computational methods to estimate a global appraisal of the pharmacokinetics and toxicity of small molecules. SwissADME contains methods selected for robustness, speed, and straightforward interpretation. The pkCSM—pharmacokinetics sever enables a fast and reliable prediction of ADME/Tox properties. It was built performing a careful selection of data sets and published methods available in the literature.
3.1.1. Chemical Space
A visual representation of the chemical space covered by different NPs databases and drugs approved by the FDA was made by employing principal component analysis (PCA) based on 16 physicochemical and ADME/Tox descriptors. PCA was performed based on the molecular weight (mw), rotatable bonds, hydrogen bond acceptors and donors, surface area, Silicos-IT LogSw, Consensus LogP, intestinal absorption, BBB permeability, fraction unbound, total clearance, fraction Csp3, number of heavy atoms, number of Lipinski violations, Veber violations, and lead-likeness violations. The loadings of the first and second principal components (PCs) are listed in Table S1 in the Supporting Information. PC1 and PC2 explain 38.72 and 17.52% of the total variance, respectively. The surface area and Consensus LogP were the descriptors that mainly contribute to the principal components 1 and 2, respectively.
Figure 2 illustrates that the chemical space covered by the different NPs is similar to the chemical space of FDA-approved drugs. FDA covers the major chemical space. Most of the BIOFACQUIM chemical space is covered by the FDA. Some BIOFACQUIM compounds do not share the chemical space with FDA or other NP libraries. NuBBEDB shares a similar chemical space to FDA and BIOFACQUIM. AfroDB chemical space is close to TCM and FDA. Finally, the chemical space of TCM is close to FDA.
Figure 2.
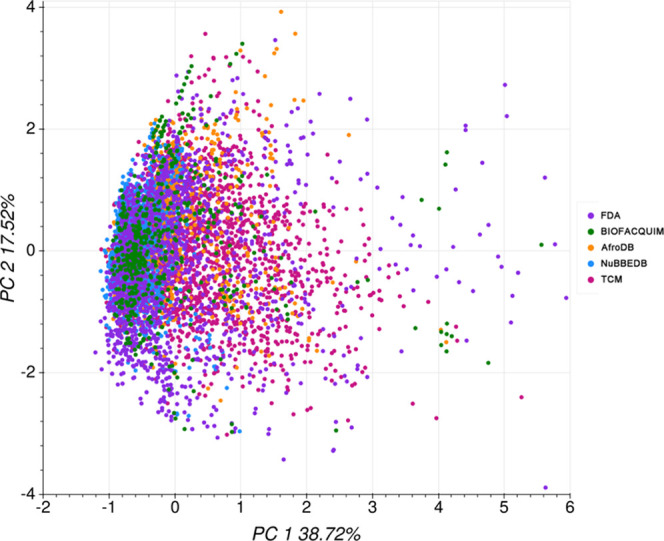
Visual representation of the chemical space of reference data sets based on 16 physicochemical and ADME/Tox descriptors. Of note, the total variance represented is 56.2%, and it is an approximation of the actual property-based chemical space.
3.1.2. Absorption
Absorption is the process of movement of a drug from an extravascular site of administration into the systemic circulation.25 It can be modeled with different properties described hereunder.
3.1.2.1. Solubility
Solubility in the intestinal fluid is an important property of oral drugs since insufficient solubility may limit the intestinal absorption through the portal vein system to obtain a therapeutic effect when systemic effects are warranted.25 Water-soluble compounds greatly facilitate many drug development activities, primarily because of the ease of handling and formulation. For oral administration, solubility is a major property influencing absorption. Similarly, a drug meant for parenteral usage has to be highly soluble in water to deliver a sufficient quantity of the active ingredient.26
Silicos-IT LogSw is the selected descriptor provided by SwissADME. It is the third predictor for solubility and was developed by SILICOS-IT. Silicos-IT LogSw estimates the decimal logarithm of the molar solubility in water (log S).26
Figure 3 shows the probability distribution of the five data sets. A summary statistics is in the Supporting Information (Table S3). Data suggest that NuBBEDB is the only database with a central distribution. In contrast, TCM shows high negative values, which indicate the presence of poorly soluble compounds. The distribution with the lowest Silicos-IT LogSw is FDA, which indicates that, overall, it has more water-soluble compounds as compared to other compound databases. The distribution of Silicos-IT LogSw values for BIOFACQUIM and AfroDB are similar, with most values between a range of −10 and 0. FDA has a mean value of −3.996. In contrast, AfroDB has the lowest mean value (−5.171) and BIOFACQUIM has a value between those of FDA and AfroDB (−4.197). FDA has a median value of −4.105, also AfroDB has a higher value (−5.03), and BIOFACQUIM has a value between these libraries (−4.4).
Figure 3.
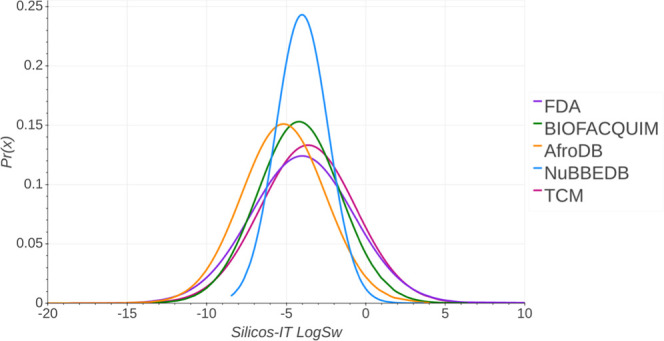
Distribution curve and summary statistics of Silicos-IT LogSw predicted with SwissADME.
3.1.2.2. Lipophilicity
The partition coefficient between n-octanol and water (log Po/w) is a common descriptor to measure lipophilicity. Lipophilicity of the compounds is related to the permeability through biological membranes. It could be decreased when lipophilicity is too low, whereas very hydrophilic compounds are usually not able to diffuse passively through them.25 SwissADME computes five values of this descriptor using different models. In this work, we used the descriptor Consensus LogPo/w, which is the arithmetic mean of the values predicted by the five proposed methods.
Figure 4 presents the probability distribution of Consensus LogP of the five data sets. A summary statistics is in the Supporting Information (Table S4). The TCM data set shows high positive values, which indicate the presence of highly lipophilic compounds. In contrast, the distribution with the lowest Consensus LogP is the FDA library, which indicates very hydrophilic compounds. The distributions of Consensus LogP values for BIOFACQUIM and AfroDB are comparable with most values between 0 and 10. The FDA mean value is 1.949, while AfroDB has the highest mean value (3.541) and BIOFACQUIM has a mean value between those in these libraries (2.993). The median value of FDA is 2.275, whereas BIOFACQUIM has a similar value (2.76) and AfroDB has the highest value (3.35).
Figure 4.
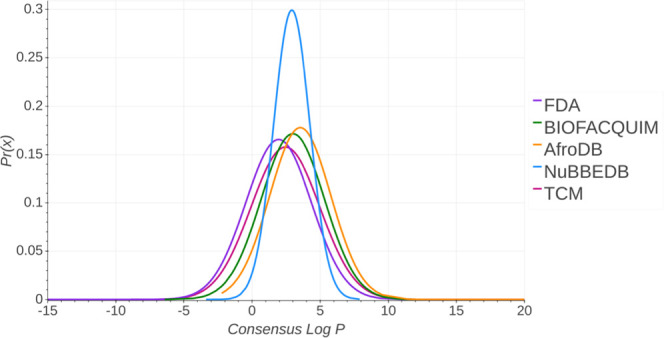
Distribution curve and summary statistics of Consensus LogP predicted with SwissADME.
3.1.2.3. Intestinal Absorption in Human (HIA)
Upon oral administration of a drug, its absorption in the small intestine is one of the key PK processes determining its bioavailability. The human intestinal absorption (HIA) of a substance is usually quantified as a portion of the given dose that has reached the portal vein
where Dblood is the amount of a substance that has reached the portal vein and Doral is the total amount of the orally administered substance. Thereby, the effect of metabolic changes during the first passage of a substance through the liver before entering the systemic circulation is excluded.
In this work, the HIA descriptor was computed with pkCSM—pharmacokinetics. For a given compound, this model predicts the percentage that will be absorbed through the human small intestine.27Figure 5 shows the probability distribution of intestinal absorption in humans of the five data sets. Results show that the distributions of BIOFACQUIM and AfroDB are comparable. A summary statistics is in the Supporting Information (Table S5). Data also indicates that FDA has a mean of 75.46, whereas NuBBEDB has a higher mean value (92.24). NuBBEDB also has a higher minimum value and median value than the FDA set. BIOFACQUIM has a similar mean value to AfroDB (83.433 and 86.934, respectively); in addition, the median of these libraries is similar (93.61 and 94.236, respectively). TCM has a mean value close to FDA (72.288 and 75.458, respectively).
Figure 5.
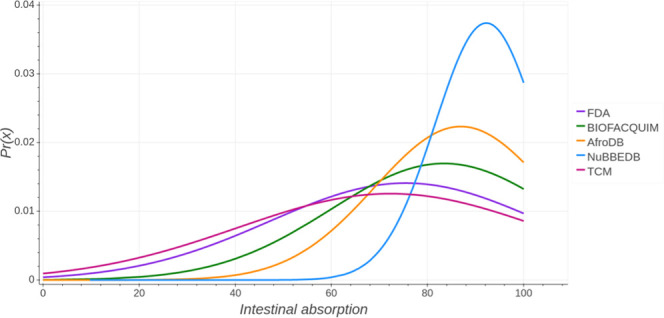
Distribution curve and summary statistics of intestinal absorption in humans predicted with pkCSM—pharmacokinetics.
3.1.3. Distribution
This ADME property refers to the distribution of the drugs throughout different compartments within the body.25 It can be quantified using different descriptors that were computed for BIOFACQUIM and reference databases.
3.1.2.4. P-Glycoprotein (P-gp) Substrate
This protein acts as a drug-extracting pump that needs energy in the process. The efflux takes place by means of a pore in the cell membrane that consists of 12 α-helices. High expression levels of P-gp are found in normal tissues such as the liver, pancreas, kidneys (renal tubules), colon, and adrenal cortex. These findings suggest that P-gp could have a physiological role in the secretion process. In tumor tissues, there is a correlation between the increase of P-gp expression and resistance to multiple drugs, being the cause of the phenotype multiple drug resistance (MDR).28 Binding to P-gp prediction was calculated with SwissADME in a binary form (yes/no).
3.1.2.5. BBB Permeability
The blood–brain barrier (BBB) protects the central nervous system (CNS) by separating the brain tissues from the bloodstream. It is mainly formed by the brain endothelium, which can prevent larger molecules (100%) and small molecules (98%) from entering into the CNS and allow transport of only water- and lipid-soluble molecules and selective transport molecules. Also, the barrier expresses numerous active transporters such as P-gp and glucose transporters. Glucose transporters allow glucose entry into brain cells.29 The BBB descriptor was calculated with SwissADME, and it predicts the permeable compounds in a binary form (yes/no).
Figure 6 summarizes the results of the percentages of compounds predicted to cross the BBB and the percentage of compounds predicted to be substrates of P-gp for each of the compound libraries. A summary of the percentages of inhibition is in the Supporting Information (Table S6). The highest percentage of compounds predicted to penetrate the BBB corresponds to NuBBEDB with 70% probability. FDA and BIOFACQUIM have similar percentages (39 and 41%, respectively); AfroDB and TCM have the lowest percentages (36 and 30%, respectively). TCM had the highest percentage predicted to be a substrate of P-gp (47%). FDA and AfroDB have similar percentages (41 and 37%, respectively), while BIOFACQUIM and NuBBEDB had the lowest percentages (28 and 18%, respectively).
Figure 6.
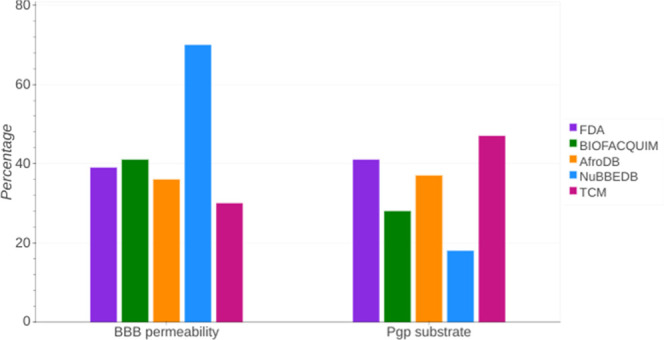
Percentage of compounds predicted to penetrate the BBB and be substrates of P-gp. The predictions were done with SwissADME.
3.1.2.6. Fraction Unbound
Drugs can bind extensively to proteins in the plasma. The free or unbound fraction of a drug is usually the portion that exerts a pharmacologic effect. If protein binding is reduced, a greater free fraction is available for any given total drug concentration, which may increase drug activity. Organic acids usually have a single binding site on albumin, whereas organic bases have multiple binding sites on glycoproteins. Predicting the effect of changes in protein binding is difficult because even though more free drugs are available at the site of action, more is available for metabolism or renal excretion. Hence, lower plasma concentrations can occur and drug half-life may decrease rather than increase.30 In this work, the fraction unbound descriptor was calculated with pkCSM—pharmacokinetics. For a given compound, the server predicts the fraction that would be unbound in plasma. Figure 7 summarizes the probability distribution of the fraction unbound in humans of the five databases. A summary statistics is in the Supporting Information (Table S7). The FDA set has a mean value of 0.339, while AfroDB has the highest mean value (0.158). BIOFACQUIM and NuBBEDB have similar mean values (0.213 and 0.233, respectively). Of all data sets, TCM has the closest mean value (0.253) to FDA. AfroDB has the lowest median value (0.114). NuBBEDB has a maximum value (0.989), similar to the maximum value of FDA (0.987). BIOFACQUIM has a mean value close to NuBBEDB (0.213 and 0.233, respectively). In addition, BIOFACQUIM has a median value (0.148) similar to AfroDB (0.114). BIOFACQUIM, FDA, and NuBBEDB have comparable maximum values.
Figure 7.
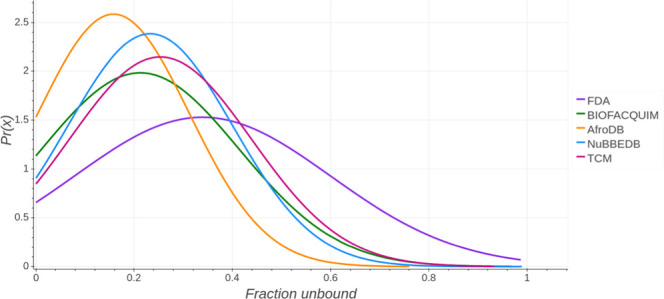
Distribution curve and summary statistics of the fraction unbound predicted with pkCSM—pharmacokinetics.
3.1.4. Metabolism
3.1.4.1. Inhibition of the Main Cytochromes
The metabolism of drugs is a complex biotransformation process where drugs are structurally modified to different molecules by different enzymes. Metabolism plays a major role in drug development, and its effects on PK, pharmacodynamics (PD), and safety should be studied extensively.31 Prediction of inhibition of the main cytochromes was calculated with SwissADME in a binary form (yes/no).
3.1.4.2. CYP450
Cytochrome P450 enzymes are primarily located in the liver and intestine and metabolize the majority of drugs through oxidation. CYP450 enzymes can either be induced or inhibited by various drugs and substances, which results in drug interactions that lead to toxicity or reduction in the therapeutic effect.32 Consistent with its highest abundance in humans, cytochrome P450 (CYP) 3A is responsible for the metabolism of about 60% of xenobiotics including drugs, carcinogens, steroids, and eicosanoids.33 A summary of the five CYPs considered in this work is presented in Table 2.
Table 2. Summary of the Five Cytochromes (CYPs) Considered in This Work.
| CYP | brief description | references |
|---|---|---|
| 3A4 | It is the most abundant form among the CYP3A subfamily. It has low substrate specificity. Chemical properties of a drug critical to CYP3A4 inactivation include the formation of reactive metabolites by CYP isoenzymes, preponderance of CYP inducers and P-gp substrates/inhibitors, and occurrence of clinically significant PK interactions with coadministered drugs. Mechanism-based inhibition of CYP3A4 causes PK-PD drug–drug interactions that may lead to adverse drug effects | (33) |
| 1A2 | It is an important metabolizing enzyme in the liver, comprising approximately 13% of all CYP proteins. There are more than 100 substrates reported for CYP1A2 | (34) |
| 2C19 | It is a clinically important enzyme responsible for the metabolism of several drugs. CYP2C19 is also known to be involved in the detoxification of potential carcinogens or the bioactivation of some environmental procarcinogen(s) to reactive DNA binding metabolites | (29) |
| 2C9 | It is abundantly expressed and contributes to drug metabolism to the greatest extent. It is the major enzyme responsible for the metabolic clearance of several drugs with a narrow therapeutic index. Thus, interindividual variability in CYP2C9 protein expression and activity may impact the efficacy and safety of drug treatment. CYP2C9 substrates used therapeutically, especially those where drug interactions and effects of genetic polymorphisms may affect treatment outcomes | (35) |
| 2D6 | It is involved in the hepatic metabolism of many clinically used medications. The CYP2D6 gene is highly polymorphic, and its function is highly variable. People with decreased or no CYP2D6 enzyme activity may be at risk of reduced efficacy and/or adverse effects when taking medications metabolized by CYP2D6 | (36) |
Prediction of the percentage of inhibition of the isoenzymes was done with SwissADME. Figure 8 shows the results for each database. A summary of inhibition of CYPs is in the Supporting Information (Table S8). According to the results, 31% of compounds in BIOFACQUIM inhibit CYP2C9 and 30% of compounds in this database would inhibit CYP1A2 and CYP3A4; 47% of compounds in NuBBEDB would inhibit CYP1A2. Also, it is predicted that between 31 and 37% of compounds in NuBBEDB inhibit the other four predicted CYPs. Compounds in AfroDB are predicted to inhibit mainly CYP3A4 (41%) followed by CYP2C9 (38%). Figure 8 also indicates that compounds in TCM inhibit mainly CYP3A4 (23%). Among the data sets studied in this work, compounds in TCM overall seem to inhibit the smallest number of cytochromes. Regarding the reference set FDA, compounds inhibit mainly CYP2D6 (30%) followed by CYP3A4 (24%).
Figure 8.
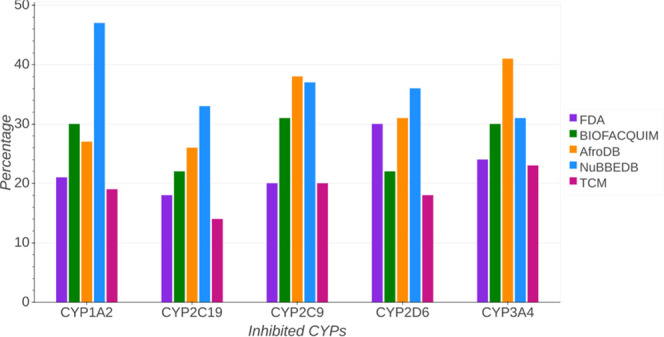
Percentages of the inhibition of the main cytochromes predicted with SwissADME.
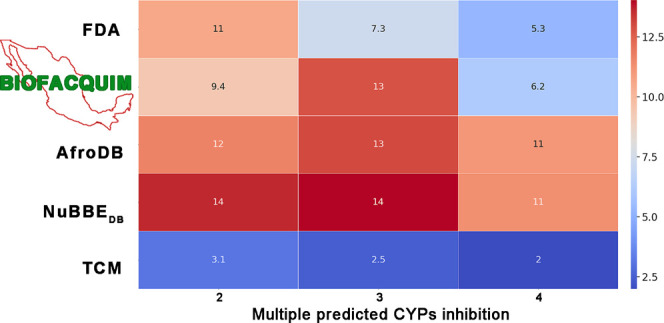
Several compounds in BIOFACQUIM and reference databases were predicted to inhibit more than one cytochrome. Figure 9 summarizes the percentages for multiple inhibitions of CYPs: 11% of compounds in FDA are predicted to inhibit two CYPs and just 5.3% of the data set could possibly inhibit four CYPs. BIOFACQUIM has 69 compounds (13%), which are predicted to inhibit three of five CYPs. AfroDB exhibits a similar proportion (13%). The TCM data set, overall, has the lowest inhibition of multiple CYPs. Heat maps that summarize the prediction of multiple inhibitions of the five CYPs for each library are included in the Supporting Information.
Figure 9.
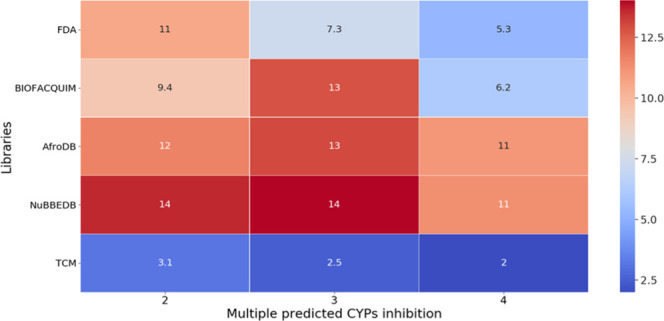
Heat map for the prediction of multiple inhibitions of cytochromes. The Y-axis represents different libraries. The X-axis indicates the frequencies to inhibit CYPs per compound.
3.1.5. Excretion
3.1.5.1. Total Clearance
This is an important PK parameter because it influences both the half-life (together with the volume of distribution) and bioavailability (together with oral absorption), thus impacting the dose regimen (how often) and dose size (how much) of a drug. Its prediction helps us to determine the feasibility of clinical dosing and provides a framework for the starting dose for first in human studies.37 In this work, drug clearance was represented by the proportionality constant CLtot and occurs primarily as a combination of hepatic clearance (metabolism in the liver and biliary clearance) and renal clearance (excretion via the kidneys). The selected model provided by pkCSM—pharmacokinetics predicts the total clearance log(CLtot) of a given compound in log(mL/min/kg).38
Figure 10 shows the probability distribution of the total clearance of the five data sets. A summary statistics is in the Supporting Information (Table S9). BIOFACQUIM has a similar median value (0.605) close to FDA (0.505). TCM has a median value (0.519) between BIOFACQUIM and FDA median values. AfroDB has the lowest median value (0.458). NuBBEDB has the highest median value (0.643). FDA has the lowest minimum value (−10.922). AfroDB and BIOFACQUIM have similar minimum values (−2.689 and −2.458, respectively). All of the five libraries have similar maximum values.
Figure 10.
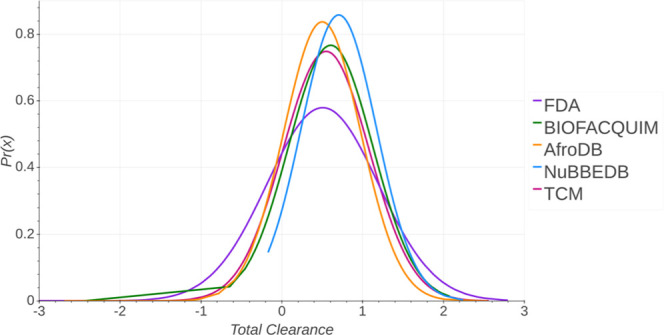
Distribution curve and summary statistics of the total clearance predicted with pkCSM—pharmacokinetics.
3.2. Toxicity
Toxicity is the degree to which a substance can damage an organism or organs of the organism, such as cells and tissues, and is one of the most significant reasons for failure in late-stage drug development. Early identification of toxicity would thus be very valuable.25 In this work, we computed four descriptors associated with toxicity using pkCSM—pharmacokinetics. The descriptors are summarized in Table 3.
Table 3. Descriptors Associated with Toxicity Computed in This Work and the Output.
| descriptor | description | output |
|---|---|---|
| hERG I/II inhibition | The hERG (human ether-a-go-go-related gene) encodes a potassium ion (K+) channel and is associated with increased duration of ventricular repolarization and prolongation of the QT interval, which could cause arrhythmia and more severe heart failure.39 Structurally and functionally unrelated drugs have been shown to block hERG channels, and some of these have been withdrawn from the market40 | If a compound is likely to be an hERG I/II inhibitor |
| Ames toxicity | It is used to assess the potential carcinogenic effect of chemicals using Salmonella typhimurium. When these mutant bacterial cells are treated with mutagenic chemicals, it causes a reversal of mutation in bacterial cells, which enables bacteria to grow on a media lacking in histidine. More potency of a chemical leads to more cells forming colonies on Agar media41 | If a compound would present a positive result in the Ames toxicity assay |
| hepatotoxicity | The liver plays a critical role in energy exchange and the biotransformation of xenobiotics. Liver suffering from damage always disrupt the normal metabolism and even lead to their failure42 | The server classifies compounds as hepatotoxic if they have at least one pathologic or physiologic effect associated with the disruption of the normal activity of the liver |
Figure 11 shows the prediction for different toxicity endpoints. A summary statistics is in the Supporting Information (Table S10). FDA is the only data set predicted to inhibit hERG I. AfroDB would mainly inhibit hERG II (45%). For BIOFACQUIM, the relative highest percentage of inhibition is for hERG II (28%), followed by Ames toxicity (19%), and hepatotoxicity (15%). For NuBBEDB, the largest percentage of compounds with a positive result would be in the AMES toxicity test (25%). Interestingly, the percentage of hepatotoxicity for FDA is significantly high (50%), much higher than any other databases (up to 20% of compounds or lower).
Figure 11.
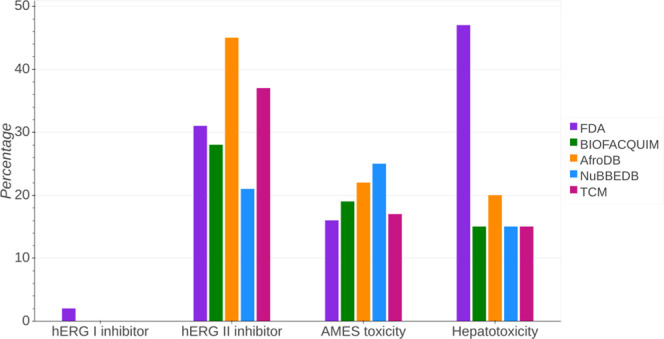
Bar plot and percentage of common toxicity endpoint prediction.
4. Conclusions
As recently discussed by Jia et al., in silico prediction of ADME/Tox properties with well-validated web servers and other chemoinformatic tools is useful for drug development projects.22 This is particularly true for the early phases. Of course, it would be desirable to conduct the experimental profiling of relevant ADME/Tox properties of compound libraries before selecting compound candidates for further consideration. However, this process is time-consuming and expensive. To reduce the number of compounds for such experimental validation, the research community has been working during the past several years to develop computational tools to predict ADME/Tox properties. A number of these well-validated tools have been made accessible in web servers such as SwissADME26 and pkCSM—pharmacokinetics.38 Although accurate predictions are still challenging for several of these properties, there has been significant progress as recently reviewed.22 Of note, the web servers or any other tools are not intended to replace experimental validation but rather to focus on the experimental efforts of a reduced number of compounds. Therefore, the in silico ADME/Tox profiling of compound databases, including natural product collections, is valuable.
In this work, the comparative ADME/Tox profiling of BIOFACQUIM let to the conclusion that compounds in the Mexican NP database have similar profiles to approved drugs with respect to several ADME/Tox properties. Specifically, it was found that BIOFACQUIM has a similar absorption profile to drugs approved by the FDA based on two descriptors. The absorption profile of BIOFACQUIM is comparable to that of NP from NuBBEDB, TCM, and AfroDB databases. BIOFACQUIM has a similar distribution profile to compounds in the FDA set based on “BBB permeability” and “Fraction unbound” descriptors. It was also concluded that the metabolism profile of BIOFACQUIM is similar to that of approved drugs based on the prediction of inhibition of CYP2C19 and it is very similar to the predicted metabolism profiles in AfroDB, TCM, and NuBBEDB based on the prediction of inhibition of CYP1A2, CYP2D6, and CYP3A4, respectively. BIOFACQUIM has a comparable predicted excretion profile to that of approved drugs, and it is even more similar to that of the compounds in TCM. The toxicity profile of BIOFACQUIM is similar to that of approved drugs based on the prediction of inhibition of hERG II; it is also similar to that of FDA and TCM compounds based on the Ames toxicity. The toxicity profile related to inhibition of hERG I is equal to those in AfroDB, NuBBEDB, and TCM databases. Hepatotoxicity prediction of BIOFACQUIM is equal to that of NuBBEDB and TCM. Results suggest that NPs are not only privileged molecules in activity but also in ADME/Tox properties.
The in silico profiling of BIOFACQUIM reported in this work will serve as a guide to prioritize compounds from this natural product collection for further development. This study further contributes to the construction and chemoinformatic characterization of NP databases in Latin America.43
Acknowledgments
B.I.D.-E. acknowledges Consejo Nacional de Ciencia y Tecnologıa (CONACyT) of Mexico for scholarship number 817896.
Supporting Information Available
The Supporting Information is available free of charge at https://pubs.acs.org/doi/10.1021/acsomega.0c01581.
Table S1, PCA summary; Table S2, PCA loadings; Table S3, statistical values of Silicos-IT LogSw predicted with SwissADME; Table S4, statistical values of Consensus LogP predicted with SwissADME; Table S5, statistical values of intestinal absorption in humans predicted with pkCSM—pharmacokinetics; Table S6, percentage of common distribution endpoints prediction; Table S7, statistical values of fraction unbound predicted with pkCSM—pharmacokinetics; Table S8, percentage of CYP inhibition by the data set; Table S9, statistical metrics of total clearance predicted with pkCSM—pharmacokinetics; Table S10, percentage of common toxicity endpoints prediction; Figure S1, chemical space visualization of BIOFACQUIM and FDA data sets; and Figure S2, histograms for Silicos-IT LogSw, Consensus LogP, intestinal absorption, fraction unbound, total clearance (PDF)
The authors declare no competing financial interest.
Supplementary Material
References
- Lahlou M. The success of natural products in drug discovery. Pharmacol. Pharm. 2013, 04, 17–31. 10.4236/pp.2013.43A003. [DOI] [Google Scholar]
- Lahlou M. Screening of natural products for drug discovery. Expert Opin. Drug Discovery 2007, 2, 697–705. 10.1517/17460441.2.5.697. [DOI] [PubMed] [Google Scholar]
- Newman D. J.; Cragg G. M. Natural products as sources of new drugs from 1981 to 2014. J. Nat. Prod. 2016, 79, 629–661. 10.1021/acs.jnatprod.5b01055. [DOI] [PubMed] [Google Scholar]
- Sorokina M.; Steinbeck C. Review on natural products databases: where to find data in 2020. J. Cheminf. 2020, 12, 20 10.1186/s13321-020-00424-9. [DOI] [PMC free article] [PubMed] [Google Scholar]
- Fatima S.; Gupta P.; Sharma S.; Sharma A.; Agarwal S. M. ADMET profiling of geographically diverse phytochemical using chemoinformatic tools. Future Med. Chem. 2020, 12, 69–87. 10.4155/fmc-2019-0206. [DOI] [PubMed] [Google Scholar]
- Pilon A. C.; Valli M.; Dametto A. C.; Pinto M. E. F.; Freire R. T.; Castro-Gamboa I.; Andricopulo A. D.; Bolzani V. S. NuBBEDB: An updated database to uncover chemical and biological information from Brazilian biodiversity. Sci. Rep. 2017, 7, 7215 10.1038/s41598-017-07451-x. [DOI] [PMC free article] [PubMed] [Google Scholar]
- Yongye A. B.; Waddell J.; Medina-Franco J. L. Molecular scaffold analysis of natural products databases in the public domain. Chem. Biol. Drug Des. 2012, 80, 717–724. 10.1111/cbdd.12011. [DOI] [PubMed] [Google Scholar]
- Pilón-Jiménez B. A.; Saldívar-González F. I.; Díaz-Eufracio B. I.; Medina-Franco J. L. BIOFACQUIM: A Mexican compound database of natural products. Biomolecules 2019, 9, 31 10.3390/biom9010031. [DOI] [PMC free article] [PubMed] [Google Scholar]
- Sánchez-Cruz N.; Pilón-Jiménez B. A.; Medina-Franco J. L. Functional group and diversity analysis of BIOFACQUIM: A Mexican natural product database. F1000Research 2019, 8, 2071 10.12688/f1000research.21540.1. [DOI] [PMC free article] [PubMed] [Google Scholar]
- Gupta P. K.Disposition. In Illustrated Toxicology; Elsevier, 2018; pp 67–106. ISBN 9780128132135. [Google Scholar]
- Bocci G.; Carosati E.; Vayer P.; Arrault A.; Lozano S.; Cruciani G. ADME-Space: a new tool for medicinal chemists to explore ADME properties. Sci. Rep. 2017, 7, 6359 10.1038/s41598-017-06692-0. [DOI] [PMC free article] [PubMed] [Google Scholar]
- Wang Y.; Xing J.; Xu Y.; Zhou N.; Peng J.; Xiong Z.; Liu X.; Luo X.; Luo C.; Chen K.; Zheng M.; Jiang H. In silico ADME/T modelling for rational drug design. Q. Rev. Biophys. 2015, 48, 488–515. 10.1017/S0033583515000190. [DOI] [PubMed] [Google Scholar]
- Schneckener S.; Grimbs S.; Hey J.; Menz S.; Osmers M.; Schaper S.; Hillisch A.; Göller A. H. Prediction of oral bioavailability in rats: Transferring Insights from in vitro correlations to (deep) machine learning models using in silico model outputs and chemical structure parameters. J. Chem. Inf. Model. 2019, 59, 4893–4905. 10.1021/acs.jcim.9b00460. [DOI] [PubMed] [Google Scholar]
- Vo A. H.; Van Vleet T. R.; Gupta R. R.; Liguori M. J.; Rao M. S. An overview of machine learning and big data for drug toxicity evaluation. Chem. Res. Toxicol. 2020, 33, 20–37. 10.1021/acs.chemrestox.9b00227. [DOI] [PubMed] [Google Scholar]
- Ntie-Kang F. An in silico evaluation of the ADMET profile of the StreptomeDB database. SpringerPlus 2013, 2, 353. 10.1186/2193-1801-2-353. [DOI] [PMC free article] [PubMed] [Google Scholar]
- Ntie-Kang F.; Zofou D.; Babiaka S. B.; Meudom R.; Scharfe M.; Lifongo L. L.; Mbah J. A.; Mbaze L. M.; Sippl W.; Efange S. M. N. AfroDb: a select highly potent and diverse natural product library from African medicinal plants. PLoS One 2013, 8, e78085 10.1371/journal.pone.0078085. [DOI] [PMC free article] [PubMed] [Google Scholar]
- Wishart D. S.; Feunang Y. D.; Guo A. C.; Lo E. J.; Marcu A.; Grant J. R.; Sajed T.; Johnson D.; Li C.; Sayeeda Z.; Assempour N.; Iynkkaran I.; Liu Y.; Maciejewski A.; Gale N.; Wilson A.; Chin L.; Cummings R.; Le D.; Pon A.; Wilson M.; et al. DrugBank 5.0: a major update to the DrugBank database for 2018. Nucleic Acids Res. 2018, 46, D1074–D1082. 10.1093/nar/gkx1037. [DOI] [PMC free article] [PubMed] [Google Scholar]
- Chen C. Y.-C. TCM Database@Taiwan: the world’s largest traditional Chinese medicine database for drug screening in silico. PLoS One 2011, 6, e15939 10.1371/journal.pone.0015939. [DOI] [PMC free article] [PubMed] [Google Scholar]
- Gadaleta D.; Lombardo A.; Toma C.; Benfenati E. A new semi-automated workflow for chemical data retrieval and quality checking for modeling applications. J. Cheminf. 2018, 10, 60 10.1186/s13321-018-0315-6. [DOI] [PMC free article] [PubMed] [Google Scholar]
- Cook D.; Brown D.; Alexander R.; March R.; Morgan P.; Satterthwaite G.; Pangalos M. N. Lessons learned from the fate of AstraZeneca’s drug pipeline: a five-dimensional framework. Nat. Rev. Drug Discovery 2014, 13, 419–431. 10.1038/nrd4309. [DOI] [PubMed] [Google Scholar]
- Bergström C. A. S.; Larsson P. Computational prediction of drug solubility in water-based systems: Qualitative and quantitative approaches used in the current drug discovery and development setting. Int. J. Pharm. 2018, 540, 185–193. 10.1016/j.ijpharm.2018.01.044. [DOI] [PMC free article] [PubMed] [Google Scholar]
- Jia C.-Y.; Li J.-Y.; Hao G.-F.; Yang G.-F. A drug-likeness toolbox facilitates ADMET study in drug discovery. Drug Discovery Today 2020, 25, 248–258. 10.1016/j.drudis.2019.10.014. [DOI] [PubMed] [Google Scholar]
- Shin H. K.; Kang Y.-M.; No K. T.. Predicting ADME Properties of Chemicals. In Handbook of Computational Chemistry; Leszczynski J.; Kaczmarek-Kedziera A.; Puzyn T.; G. Papadopoulos M.; Reis H.; K. Shukla M., Eds.; Springer International Publishing: Cham, 2017; pp 2265–2301. ISBN 978-3-319-27281-8. [Google Scholar]
- Raies A. B.; Bajic V. B. In silico toxicology: computational methods for the prediction of chemical toxicity. Wiley Interdiscip. Rev.: Comput. Mol. Sci. 2016, 6, 147–172. 10.1002/wcms.1240. [DOI] [PMC free article] [PubMed] [Google Scholar]
- Lagorce D.; Douguet D.; Miteva M. A.; Villoutreix B. O. Computational analysis of calculated physicochemical and ADMET properties of protein-protein interaction inhibitors. Sci. Rep. 2017, 7, 46277 10.1038/srep46277. [DOI] [PMC free article] [PubMed] [Google Scholar]
- Daina A.; Michielin O.; Zoete V. SwissADME: a free web tool to evaluate pharmacokinetics, drug-likeness and medicinal chemistry friendliness of small molecules. Sci. Rep. 2017, 7, 42717 10.1038/srep42717. [DOI] [PMC free article] [PubMed] [Google Scholar]
- Radchenko E. V.; Dyabina A. S.; Palyulin V. A.; Zefirov N. S. Prediction of human intestinal absorption of drug compounds. Russ. Chem. Bull. 2016, 65, 576–580. 10.1007/s11172-016-1340-0. [DOI] [Google Scholar]
- Ruiz Gómez M. J.; Souviron Rodríguez A.; Martínez Morillo M. La glicoproteína-P una bomba de membrana que representa una barrera a la quimioterapia de los pacientes con cáncer. An. Med. Interna 2002, 19, 477–485. 10.4321/S0212-71992002000900011. [DOI] [PubMed] [Google Scholar]
- Wang Z.; Yang H.; Wu Z.; Wang T.; Li W.; Tang Y.; Liu G. In silico prediction of blood-brain barrier permeability of compounds by machine learning and resampling methods. ChemMedChem 2018, 13, 2189–2201. 10.1002/cmdc.201800533. [DOI] [PubMed] [Google Scholar]
- Principles of Drug Therapy, Dosing, and Prescribing in Chronic Kidney Disease and Renal Replacement Therapy. In Comprehensive Clinical Nephrology; Floege J.; Johnson R. J.; Feehally J., Eds.; Saunders/Elsevier, 2010; pp 871–893. ISBN 978-0-323-05876-6. [Google Scholar]
- Zhang Z.; Tang W. Drug metabolism in drug discovery and development. Acta Pharm. Sin. B 2018, 8, 721–732. 10.1016/j.apsb.2018.04.003. [DOI] [PMC free article] [PubMed] [Google Scholar]
- Issa N. T.; Wathieu H.; Ojo A.; Byers S. W.; Dakshanamurthy S. Drug metabolism in preclinical drug development: A survey of the discovery process, toxicology, and computational tools. Curr. Drug Metab. 2017, 18, 556–565. 10.2174/1389200218666170316093301. [DOI] [PMC free article] [PubMed] [Google Scholar]
- Dresser G. K.; Spence J. D.; Bailey D. G. Pharmacokinetic-pharmacodynamic consequences and clinical relevance of cytochrome P450 3A4 inhibition. Clin. Pharmacokinet. 2000, 38, 41–57. 10.2165/00003088-200038010-00003. [DOI] [PubMed] [Google Scholar]
- Thorn C. F.; Aklillu E.; Klein T. E.; Altman R. B. PharmGKB summary: very important pharmacogene information for CYP1A2. Pharmacogenet. Genomics 2012, 22, 73–77. 10.1097/FPC.0b013e32834c6efd. [DOI] [PMC free article] [PubMed] [Google Scholar]
- Daly A. K.; Rettie A. E.; Fowler D. M.; Miners J. O. Pharmacogenomics of CYP2C9: functional and clinical considerations. J. Pers. Med. 2017, 8, 1 10.3390/jpm8010001. [DOI] [PMC free article] [PubMed] [Google Scholar]
- Del Tredici A. L.; Malhotra A.; Dedek M.; Espin F.; Roach D.; Zhu G.-D.; Voland J.; Moreno T. A. Frequency of CYP2D6 alleles including structural variants in the United States. Front. Pharmacol. 2018, 9, 305 10.3389/fphar.2018.00305. [DOI] [PMC free article] [PubMed] [Google Scholar]
- Berellini G.; Waters N. J.; Lombardo F. In silico prediction of total human plasma clearance. J. Chem. Inf. Model. 2012, 52, 2069–2078. 10.1021/ci300155y. [DOI] [PubMed] [Google Scholar]
- Pires D. E. V.; Blundell T. L.; Ascher D. B. PkCSM: Predicting small-molecule pharmacokinetic and toxicity properties using graph-based signatures. J. Med. Chem. 2015, 58, 4066–4072. 10.1021/acs.jmedchem.5b00104. [DOI] [PMC free article] [PubMed] [Google Scholar]
- Sato T.; Yuki H.; Ogura K.; Honma T. Construction of an integrated database for hERG blocking small molecules. PLoS One 2018, 13, e0199348 10.1371/journal.pone.0199348. [DOI] [PMC free article] [PubMed] [Google Scholar]
- Yu H. B.; Zou B.; Wang X.; Li M. Investigation of miscellaneous hERG inhibition in large diverse compound collection using automated patch-clamp assay. Acta Pharmacol. Sin. 2016, 37, 111–123. 10.1038/aps.2015.143. [DOI] [PMC free article] [PubMed] [Google Scholar]
- Omidi M.; Fatehinya A.; Farahani M.; Akbari Z.; Shahmoradi S.; Yazdian F.; Tahriri M.; Moharamzadeh K.; Tayebi L.; Vashaee D.. Characterization of Biomaterials. In Biomaterials for Oral and Dental Tissue Engineering; Elsevier, 2017; pp 97–115. [Google Scholar]
- He S.; Ye T.; Wang R.; Zhang C.; Zhang X.; Sun G.; Sun X. An in silico model for predicting drug-induced hepatotoxicity. Int. J. Mol. Sci. 2019, 20, 1897 10.3390/ijms20081897. [DOI] [PMC free article] [PubMed] [Google Scholar]
- Medina-Franco J. L. Towards a Unified Latin American Natural Products Database: LANaPD. Future Sci. OA 2020, FSO597 10.2144/fsoa-2020-0068. [DOI] [PMC free article] [PubMed] [Google Scholar]
Associated Data
This section collects any data citations, data availability statements, or supplementary materials included in this article.


