

Optimizing cytokinin distribution patterns is a promising strategy for simultaneously enhancing grain yield, grain quality, and stress resistance in plants, as observed in ARGONAUTE2-overexpressing rice.
Abstract
Maintaining stable, high yields under fluctuating environmental conditions is a long-standing goal of crop improvement but is challenging due to internal trade-off mechanisms, which are poorly understood. Here, we identify ARGONAUTE2 (AGO2) as a candidate target for achieving this goal in rice (Oryza sativa). Overexpressing AGO2 led to a simultaneous increase in salt tolerance and grain length. These benefits were achieved via the activation of BIG GRAIN3 (BG3), encoding a purine permease potentially involved in cytokinin transport. AGO2 can become enriched on the BG3 locus and alter its histone methylation level, thus promoting BG3 expression. Cytokinin levels decreased in shoots but increased in roots of AGO2-overexpressing plants. While bg3 knockout mutants were hypersensitive to salt stress, plants overexpressing BG3 showed strong salt tolerance and large grains. The knockout of BG3 significantly reduced grain length and salt tolerance in AGO2-overexpressing plants. Both genes were transcriptionally suppressed by salt treatment. Salt treatment markedly increased cytokinin levels in roots but decreased them in shoots, resulting in a hormone distribution pattern similar to that in AGO2-overexpressing plants. These findings highlight the critical roles of the spatial distribution of cytokinins in both stress responses and grain development. Therefore, optimizing cytokinin distribution represents a promising strategy for improving both grain yield and stress tolerance in rice.
INTRODUCTION
With the global human population growing and the availability of arable land decreasing, grain yield per unit area must increase in order to meet food demands. An alternative strategy for tackling this problem is to exploit inferior soil in salinized or desert land. Both solutions demand the development of superior crop cultivars with both high yields and high biotic/abiotic stress resistance. Environmental deterioration and climate change compound the urgent requirement for dependable crops with stable, high yields (Kissoudis et al., 2016). However, this represents a tremendous challenge for crop breeding because high yields and high biotic/abiotic resistance are usually incompatible due to internal trade-off mechanisms in plants (Deng et al., 2017). The genetic basis underlying this incongruity is largely unclear, impeding molecular breeding (Qian et al., 2016).
One determinant of grain yield, grain weight, is affected by grain size and grain filling. Increased grain length not only contributes to grain size and weight but also is associated with superior grain quality (Liu et al., 2018b; Zhao et al., 2018). Numerous genes associated with grain size and/or weight have been identified and characterized, including many quantitative trait loci. Many of these genes are related to phytohormones, including brassinosteroids (Che et al., 2015; Duan et al., 2015; Hu et al., 2015; Liu et al., 2017), auxins (Ishimaru et al., 2013; Hu et al., 2018; Xia et al., 2018; Ying et al., 2018), and cytokinins (Zuo and Li, 2014; Li and Li, 2016; Xiao et al., 2019). In addition to regulating plant growth and development under normal conditions, hormones play important roles in regulating stress responses. Besides the well-known stress hormone abscisic acid (ABA), other phytohormones such as cytokinins and brassinosteroids are also involved in regulating plant resistance to stress, including salt stress (Nishiyama et al., 2011; Sharma et al., 2013; Chen et al., 2017).
Cytokinins naturally exist in the plant in free-base form, which are thought to be the major bioactive forms, such as N6-(△2-isopentenyl)adenine (iP), trans-zeatin (tZ), and cis-zeatin (cZ), or in conjugated form, such as iPR, tZR, and cZR (R, riboside; Mok and Mok, 2001; Sakakibara, 2006). The proper functions of cytokinins rely on a complicated transport system involving at least three transporter families including PURINE PERMEASE (PUP), EQUILIBRATE NUCLEOSIDE TRANSPORTER (ENT), and ATP BINDING CASSETTE G (ABCG; Bürkle et al., 2003; Hirose et al., 2005; Ko et al., 2014; Zhang et al., 2014). However, to date, only a limited number of these proteins have been functionally characterized. Among these, BIG GRAIN3 (BG3), a PUP family member (OsPUP4), regulates leaf length and grain size in rice (Oryza sativa; Xiao et al., 2019). BG3, a putative cytokinin transporter, is localized to the plasma membrane and might be involved in the shoot-to-root transport of cytokinins together with its closest homolog OsPUP7 (Qi and Xiong, 2013; Xiao et al., 2019). While the ospup4 single mutant and ospup4 ospup7 double mutant show no morphologic differences compared to the wild type, overexpressing either BG3 or OsPUP7 led to elongated leaves and enlarged grain size (Xiao et al., 2019). OsABCG18 was recently shown to direct cytokinin transport from root to shoot in rice (Zhao et al., 2019), playing a similar role to its ortholog ABCG14 in Arabidopsis (Arabidopsis thaliana; Ko et al., 2014; Zhang et al., 2014). Knockout or overexpression of OsABCG18 resulted in pleiotropic developmental phenotypes including altered grain size (Zhao et al., 2019). These findings suggest that cytokinin transport plays an important role in plant growth and development. However, the role of cytokinin translocation in stress responses remains largely unclear.
ARGONAUTE (AGO) proteins are associated with small RNA activity, primarily functioning in gene silencing by forming RNA-induced silencing complexes (Hutvagner and Simard, 2008). These complexes suppress gene expression via multiple mechanisms, such as RNA cleavage, translation inhibition, and DNA methylation, in a small RNA- and AGO-dependent manner (Zhang et al., 2015). In addition to these canonical mechanisms, AGO1 associates with chromatin to act as a transcriptional transactivator in Arabidopsis (Liu et al., 2018a). Using these different mechanisms, AGO proteins regulate various biological processes including growth and development, stress and defense responses, alternative splicing, DNA repair, and others (Fang and Qi, 2016). For example, in Arabidopsis, AGO1 plays important roles in leaf development (Bohmert et al., 1998) as well as responses to stimuli (Liu et al., 2018a), and AGO2 is involved in plant immunity to both bacterial and viral diseases (Wang et al., 2011; Zhang et al., 2011; Carbonell et al., 2012).
Rice contains 19 AGO family members that are divided into four clades: AGO1, AGO4, MEL1, and ZIPPY (Nonomura et al., 2007; Kapoor et al., 2008). Several members of these clades have been functionally characterized. Simultaneously knockdown of several AGO1 homologs (AGO1a-1d) or the knockdown of PNH1, another AGO1 homolog, led to severe developmental defects (Nishimura et al., 2002; Wu et al., 2009). MEL1 is involved in meiosis during sporogenesis, and the mel1 mutant is sterile (Nonomura et al., 2007). Loss of function of AGO7 resulted in failed shoot development, while plants overexpressing AGO7 had curled and erect leaves (Nagasaki et al., 2007; Shi et al., 2007). ago2 mutants exhibit low pollen fertility due to the de-repression of HEXOKINASE1 (HXK1; Zheng et al., 2019). In addition, overexpression of AGO17 improves grain size and plant growth by promoting the accumulation of the microRNA miR397b (Zhong et al., 2019).
In this study, we found that overexpressing AGO2 simultaneously increased grain size and salt resistance. These benefits were obtained via the epigenetic activation of BG3 expression. We showed that salt stress can alter cytokinin distribution patterns in shoots and roots and suggested that BG3 functions in the establishment of cytokinin distribution patterns, which plays a crucial role in stress responses as well as grain development. Optimizing cytokinin distribution patterns in plants represents a promising strategy for simultaneously enhancing grain yield, grain quality, and stress resistance, as exemplified by AGO2-overexpressing (A2OX) plants.
RESULTS
AGO2 Overexpression Increases Grain Length
To analyze the role of AGO2 in plants, we produced several allelic ago2 mutants as well as ago2 ago3 double mutants by clustered regularly interspaced short palindromic repeats (CRISPR)/ Cas9. However, these mutants showed few morphological changes compared to wild-type rice (Supplemental Figure 1). We performed transgenic analysis by overexpressing either the AGO2 coding sequence or an AGO2-Flag fusion under the control of the cauliflower mosaic virus 35S promoter in the wild-type rice. Strikingly, we obtained several independent transgenic lines showing markedly increased grain length and 1000-grain weight, but unaltered grain width, accompanied by elevated AGO2 expression (Figures 1A to 1F; Supplemental Figures 2 to 4). In general, the A2OX plants exhibited much stronger phenotypes than AGO2-Flag–overexpressing (A2FOX) plants in terms of leaf and grain length as well as grain number (Figures 1A to 1F; Supplemental Figure 5). It appears that the tag fusion at the C terminus of AGO2 impaired, but did not abolish, protein function, indicating that this approach could be utilized as a strategy for protein manipulation in transgenic analysis. Statistical analysis showed that grain yield per plant was significantly higher in A2FOX than in the wild type but unaltered in A2OX due to decreased grain number (Figure 1G; Supplemental Figure 5), suggesting that AGO2 could be a valuable target for breeding to improve grain yield and/or grain quality (grain length).
Figure 1.

Overexpression of AGO2 Increases Grain Length and Yield.
(A) Comparison of grain length in A2OX and the wild-type (WT) plants. Bar = 5 mm.
(B) Comparison of grain length in A2FOX and the wild type (WT). Bar = 5 mm.
(C) Gross morphology of A2OX and the wild type (WT).
(D) Gross morphology of A2FOX and the wild type (WT).
(E) Expression of AGO2 in the wild-type (WT) and the transgenic plants as indicated (n = 3, means ± sd). Seedling shoots of 10-d-old plants were used for analysis.
(F) and (G) Statistical data for grain length (see [F]; n > 40) and grain yield per plant (see [G]; n = 18) of the indicated plants. Means ± sd.
Different letters on the histograms indicate statistically significant differences at P < 0.05 by pairwise multiple comparison followed with Tukey test.
AGO2 Improves Salt Stress Tolerance and Positively Regulates ABA Responses
AGO2 expression is affected by various stresses, as revealed by microarray analysis (Kapoor et al., 2008), suggesting the involvement of AGO2 in stress responses. Indeed, A2OX plants also showed greatly enhanced salt tolerance (Figures 2A to 2D; Supplemental Figure 6). In the two lines tested, survival frequencies remained above 50%, whereas nearly all wild-type plants died after a durable exposure (9 d) to high salinity (200 mM NaCl). A2FOX plants also showed increased salt tolerance (Figures 2E to 2H), although to a lesser extent than A2OX. Malondialdehyde (MDA) is an end product of lipid peroxidation associated with salt stress (Sharma et al., 2013; Ma et al., 2019). Under normal growth conditions, MDA contents were comparable in A2OX and the wild type (Figure 2I). Upon salt treatment, however, the MDA contents were much lower in A2OX than in the wild type (Figure 2I), further supporting the positive role of AGO2 in regulating stress resistance. To explore the underlying mechanism, we analyzed plant responses to ABA, a well-known stress hormone. A2OX plants showed significantly increased ABA sensitivity in terms of both shoot and root growth (Figures 2J to 2L), implying that AGO2 positively regulates ABA responses to improve stress tolerance in rice.
Figure 2.
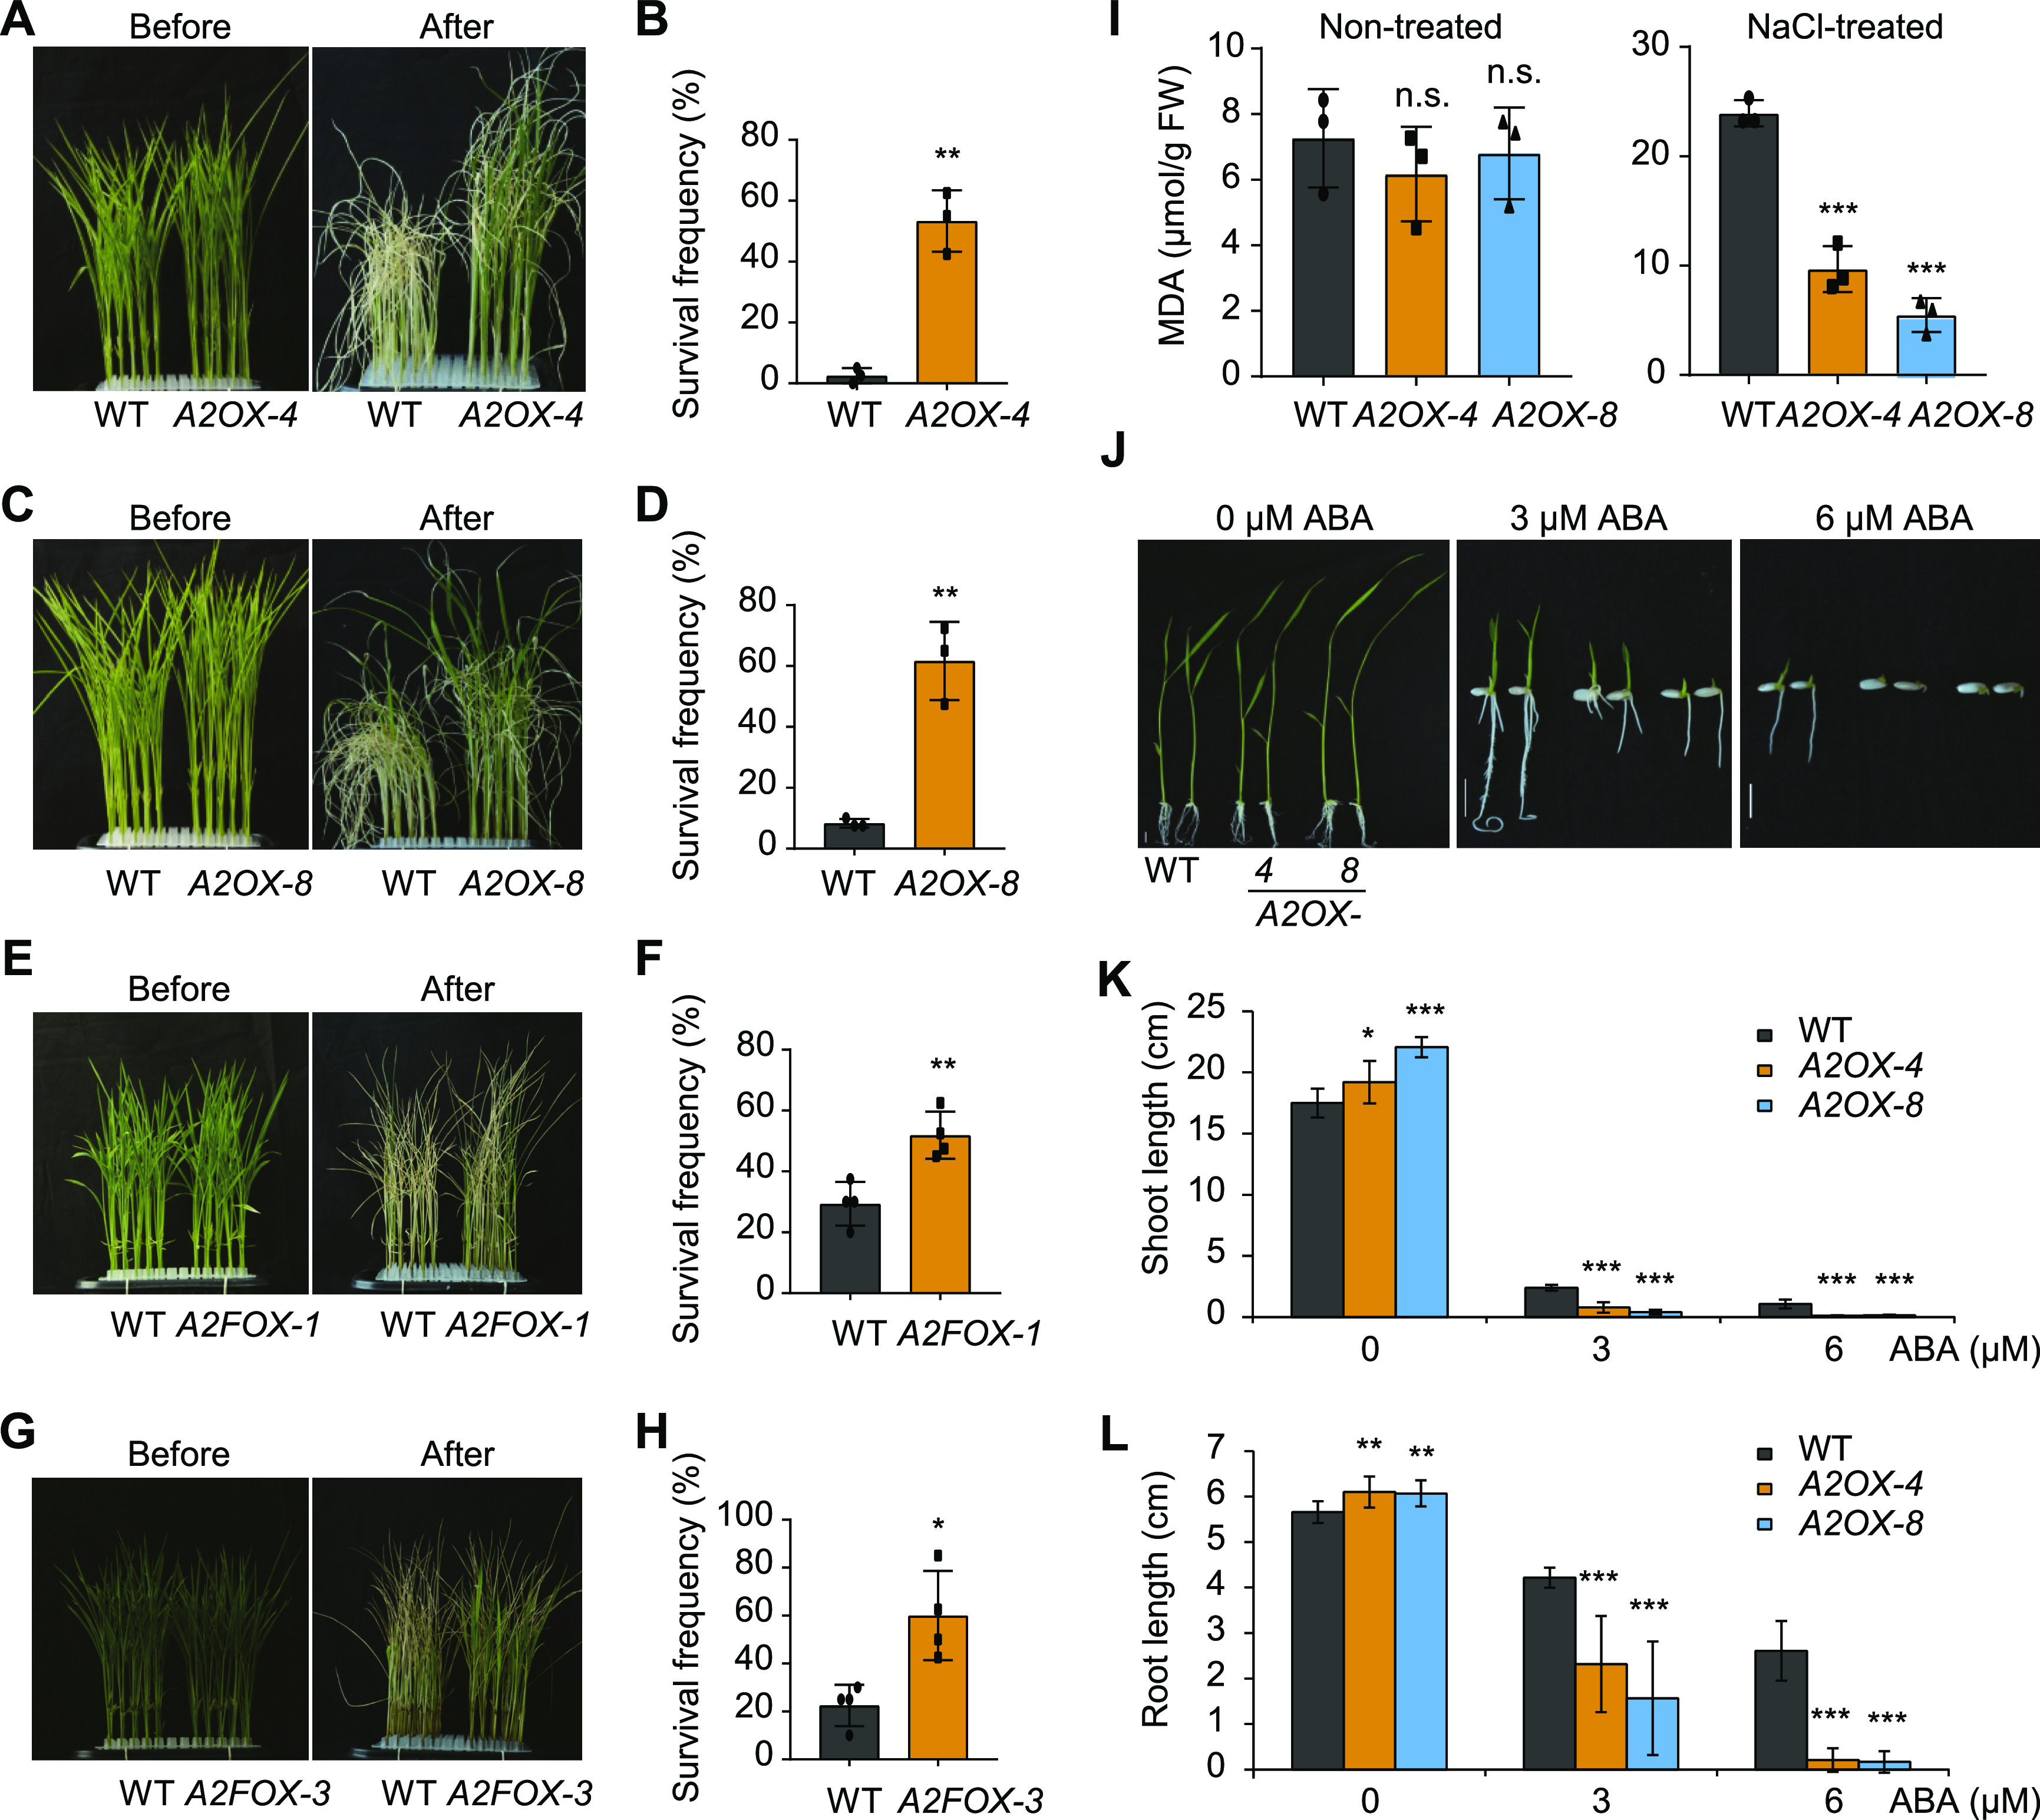
AGO2 Positively Regulates Salt Tolerance and ABA Responses.
(A) to (H) Gross morphology of the indicated plants before and after salt treatment (see [A], [C], [E], and [G]) and statistical data for survival frequencies (see [B], [D], [F], and [H]). Data are means ± sd, n = 3 in (B) and (D) and n = 4 in (F) and (H). Asterisks indicate significant difference compared with the wild type (WT), with *P < 0.05 and **P < 0.01 by Student’s two-tailed t test. One-week-old seedlings were treated with 200 mM NaCl. Photographs after treatment were taken following 9-d treatment in (A) to (D) and 8-d treatment in (E) to (H). Survival frequencies were calculated after an additional 2-d recovery in (B) and (D) and after an additional 5-d recovery in (F) and (H).
(I) MDA contents in A2OX plants grown under normal conditions (nontreated) or under salt stress conditions (200 mM NaCl for 6 d). Data are means ± sd, n = 3. Asterisks indicate significant difference compared with the wild type (WT), with ***P < 0.001 by Student’s two-tailed t test. FW, fresh weight; n.s., not significant.
(J) to (L) Gross morphology of the indicated plants with or without ABA treatment (J) and corresponding statistical data for shoot length (K) and root length (L). Data are means ± sd, n = 12. Asterisks indicate significant difference compared with the wild type (WT), with *P < 0.05, **P < 0.01, and ***P < 0.001 by Student’s two-tailed t test.
AGO2 Overexpression Activates BG3 to Promote Gene Expression
Transcriptome analysis using A2OX-4 and the wild-type plants identified 1514 upregulated and 584 downregulated differentially expressed genes (DEGs; (Figure 3A; Supplemental Data Set 1), indicating that AGO2 likely promotes gene expression. These DEGs were markedly enriched in stress-related processes, such as response to stress (P = 2.2 × 10⁻³) and response to oxidative stress (P = 1 × 10⁻⁶), as revealed by gene ontology (GO) analysis (Supplemental Figure 7). However, a number of additional GO terms, such as chromatin assembly (P = 6.5 × 10⁻⁸) and regulation of transcription (P = 4.5 × 10⁻⁴), were also detected (Supplemental Figure 6). Among the highly activated genes, we identified BG3 (Supplemental Data Set 1), which was recently shown to regulate grain size (Xiao et al., 2019). The enhanced expression of BG3 was confirmed by RT-qPCR analysis of two A2OX lines (Figure 3B). Both bg3-D, a dominant mutant with activated BG3 expression, and BG3-overexpressing (BG3OX) plants showed enlarged grain size and increased leaf growth (Xiao et al., 2019), strongly resembling the phenotypes of A2OX (Figure 3C; Supplemental Figure 8). These results suggest that AGO2 functions by activating BG3 expression.
Figure 3.

AGO2 Activates BG3 to Regulate Gene Expression.
(A) Numbers of upregulated (UP) and downregulated (DN) DEGs in A2OX-4 compared with the wild type (WT).
(B) Increased expression of BG3 in A2OX plants. Data are means ± sd. Asterisks indicate significant difference compared with the wild type (WT), with **P < 0.01 and ***P < 0.001 by Student’s two-tailed t test.
(C) Comparison of grain length in the wild-type (WT) and BG3-overexpressing plants. Bar = 5 mm.
(D) Expression analysis of four upregulated DEGs, with gene name listed above each graph, in the wild-type (WT), A2OX, and BG3OX plants. Data are means ± sd, n = 3. Asterisks indicate significant difference compared with WT, with **P < 0.01 and ***P < 0.001 by Student’s two-tailed t test.
(E) Venn diagram showing the overlap of AGO2- and BG3-regulated genes. The number of DEGs regulated in a consistent direction is highlighted. This Venn diagram was generated online (https://bioinfogp.cnb.csic.es/tools/venny/). DN, downregulated; UP, upregulated.
We selected four additional DEGs upregulated in A2OX-4 for verification and found that all had greatly increased expression in both A2OX and BG3OX (Figure 3D; Supplemental Data Set 1). Further global transcriptome analysis revealed that, of the DEGs identified from bg3-D, 55.9% (301/538) were also differentially expressed in A2OX (Figure 3E; Supplemental Data Set 1). Among these, 99.3% (299/301) were regulated in a consistent direction, and 93.3% (279/301) were upregulated by both BG3 and AGO2 (Figure 3E), strongly suggesting that BG3 mediates the AGO2-induced regulation of a subset of genes.
BG3 Positively Regulates Salt Stress Tolerance and ABA Responses
In addition to increased grain size, both bg3-D and BG3OX showed strong salt tolerance (Figures 4A to 4D; Supplemental Figure 9). After durable salt treatment (10 d), their survival frequencies remained above 80%, while nearly all wild-type plants died. By contrast, bg3 knockout mutants showed hypersensitivity to salt treatment (Figures 4E to 4H), indicating that BG3 plays a role in regulating the salt stress response. We tested the responses of these plants to ABA. While bg3 exhibited slightly reduced ABA sensitivity (Supplemental Figure 10), bg3-D and BG3OX showed significantly increased ABA sensitivity in terms of both shoot and root growth (Figures 4I to 4K), implying that BG3 also participates in regulating ABA responses.
Figure 4.

BG3 Positively Regulates Salt Stress Tolerance and ABA Responses.
(A) to (D) Gross morphology of BG3-overexpressing plants before and after salt treatment (see [A] and [C]) and statistical data for survival frequencies (see [B] and [D]; n = 4, means ± sd). Asterisks indicate significant difference compared with the wild type (WT), with ***P < 0.001 by Student’s two-tailed t test. One-week-old seedlings were treated with 200 mM NaCl. Photographs after treatment were taken following 10-d treatment. Survival frequencies were calculated after an additional 5-d recovery.
(E) to (H) Gross morphology of the BG3-knockout plants before and after salt treatment (see [E] and [G]) and statistical data for survival frequencies (see [F] and [H]; n = 4, means ± sd). Asterisks indicate significant difference compared with the wild type (WT), with *P < 0.05 by Student’s two-tailed t test. One-week-old seedlings were treated with 200 mM NaCl. Photographs after treatment were taken following 6-d treatment and 3-d recovery, and survival frequencies were calculated at this time as well.
(I) to (K) Gross morphology of the indicated plants with or without ABA treatment (I) and corresponding statistical data for shoot length (J) and root length (K). Data are means ± sd, n = 12 in (J) and (K). Asterisks indicate significant difference compared with the wild type (WT), with **P < 0.01 and ***P < 0.001 by Student’s two-tailed t test.
BG3 Is Required for the Role of AGO2 in Promoting Grain Size and Salt Tolerance
Compared to A2OX, the grain size of bg3-D was much larger and its stress tolerance was much stronger, which is consistent with the much higher expression level of BG3 in bg3-D. These results strongly suggest that AGO2 functions by promoting BG3 expression to regulate both grain size and stress tolerance. To confirm this speculation, we edited BG3 in A2OX-8 by CRISPR/Cas9 and obtained a number of independent knockout lines (Supplemental Figure 11). Compared to the A2OX-8 line, all of these lines showed significantly reduced grain length and decreased plant height (Figures 5A and 5B). We used two representative lines for salt stress tests and found that both showed compromised salt tolerance compared to A2OX-8 (Figures 5C to 5F). It should be mentioned that the edited plants still had slightly longer grains and increased salt tolerance than the wild type (Figures 5A and 5B; Supplemental Figure 12), perhaps due to redundant functions among BG3 homologs (Xiao et al., 2019). Alternatively, perhaps AGO2 activity does not rely solely on BG3. These results demonstrate that BG3 participates in, and is at least partially required for, the role of AGO2 in promoting grain length and salt tolerance.
Figure 5.

BG3 Is Required for AGO2 Function.
(A) Comparison of grain length in A2OX-8– and BG3-knockout plants. Bar = 5 mm. WT, wild type.
(B) Statistical data for grain length in the indicated plants (n = 30, means ± sd). Different letters on the histograms indicate statistically significant difference at P < 0.05 by pairwise multiple comparison followed with Tukey test.
(C) to (F) Gross morphology of A2OX-8– and BG3-knockout plants before and after salt treatment (see [C] and [E]) and statistical data for survival frequencies (see [D] and [F]). Data are means ± sd, n = 3 in (D) and n = 4 in (F). Asterisks indicate significant difference compared with A2OX-8, with *P < 0.05 and **P < 0.01 by Student’s two-tailed t test. One-week-old seedlings were treated with 200 mM NaCl. Photographs after treatment were taken following 9-d treatment and 6-d recovery. Survival frequencies were calculated at this time as well.
AGO2 Activates BG3 Expression via Epigenetic Modification
Strikingly, both AGO2 and BG3 were significantly suppressed by salt treatment, especially BG3, whose expression level decreased rapidly upon salt treatment (Figures 6A and 6B; Supplemental Figure 13). However, BG3 was still strongly suppressed by salt in A2OX plants in which AGO2 was constitutively overexpressed (Supplemental Figure 14), suggesting that the inhibition of BG3 expression by salt might be partially independent of AGO2. Chromatin immunoprecipitation sequencing (ChIP-seq) analysis revealed that AGO2-Flag tended to accumulate within the BG3 region (Supplemental Figure 15). This result was further confirmed by ChIP-qPCR analysis, which showed that AGO2-Flag was markedly enriched on the BG3 promoter region, as well as the coding region to a lesser extent, in A2FOX plants versus the wild type (Figure 6C).
Figure 6.

AGO2 Regulates BG3 Expression by Epigenetic Modifications.
(A) and (B) Effects of salt on the expression of AGO2 (A) and BG3 (B) in the wild-type (WT) plants (n = 3, means ± sd). Asterisks indicate significant difference compared with the values at the starting time, with **P < 0.01 and ***P < 0.001 by Student’s two-tailed t test. See Supplemental Figure 13 for controls.
(C) Detection of AGO2-Flag association on different regions of the BG3 locus (corresponding to primers P1 to P10; Supplemental Table 5) by ChIP-qPCR using A2FOX-1 (n = 3, means ± sd). Asterisks indicate significant difference compared with no antibody as control (NoAb) within one group, with **P < 0.01 and ***P < 0.001 by Student’s two-tailed t test.
(D) and (E) Detection of histone methylation status within the BG3 region by ChIP-qPCR using A2OX-8 (n = 3, means ± sd). Asterisks indicate significant difference compared with the wild type (WT) at the corresponding locus, with *P < 0.05 and **P < 0.01 by Student’s two-tailed t test.
AGO proteins might regulate gene transcription via epigenetic modification (Janowski et al., 2006; Taliaferro et al., 2013; Liu et al., 2018a). We thus examined both DNA methylation and histone methylation on BG3 in the wild-type and A2OX plants. While the DNA methylation levels on the BG3 promoter region were similar between A2OX and the wild type (Supplemental Figure 16), we observed marked changes in the histone methylation level of the BG3 locus in A2OX (Figures 6D and 6E). Compared to the wild type, the level of H3K4me3, a well-known epigenetic marker of gene activation, was elevated in A2OX plants (Figure 6D), whereas the level of H3K27me3, an epigenetic marker of gene repression, was reduced in these plants (Figure 6E). Therefore, it is highly likely that AGO2 becomes enriched on the BG3 locus, facilitating epigenetic modifications to activate gene expression. Importantly, a similar mechanism has been revealed for AGO1 activity in Arabidopsis (Liu et al., 2018a). Based on these results, we speculate that AGO2 acts as a transcriptional activator by regulating chromatin modification, with BG3 representing a major target of this protein.
Cytokinin Distribution Is Altered in A2OX Plants
Since BG3 encodes a putative cytokinin transporter thought to promote the shoot-to-root transport of cytokinin (Xiao et al., 2019), we measured the contents of various cytokinins in both the shoots and roots of A2OX and the wild-type plants (Figures 7A and 7B; Supplemental Table 1). In shoots, the levels of iP, tZ, and cZ, as well as several of their conjugated forms, were significantly lower in A2OX plants than in the wild type. By contrast, in roots, we observed an increase in the levels of several cytokinin forms in A2OX. In detail, iP was not detected in either plants; tZ levels did not significantly differ between plants; and abundant cZ was detected, with much higher levels in A2OX versus the wild type. Of the conjugated forms, the levels of iPR and cZ O-glucoside were reduced in A2OX, whereas iPR 7-glucoside (iP7G), tZ 9-glucoside, and cZR levels were significantly higher in this line than in the wild type. When we examined the combined levels of the three major active forms of cytokinin, we observed a clear decrease in cytokinin levels in the shoots but a corresponding increase in roots of A2OX versus the wild type (Figures 7C and 7D). These results further reinforce the idea that AGO2 promotes BG3 expression, which alters cytokinin distribution in plants, thereby regulating grain size and stress responses. Intriguingly, BG3 was activated only in shoots and not in roots of A2OX (Supplemental Figure 17), suggesting that this regulation occurs in a tissue-dependent manner, which might explain the somewhat different cytokinin distribution patterns between A2OX and bg3-D (Xiao et al., 2019).
Figure 7.
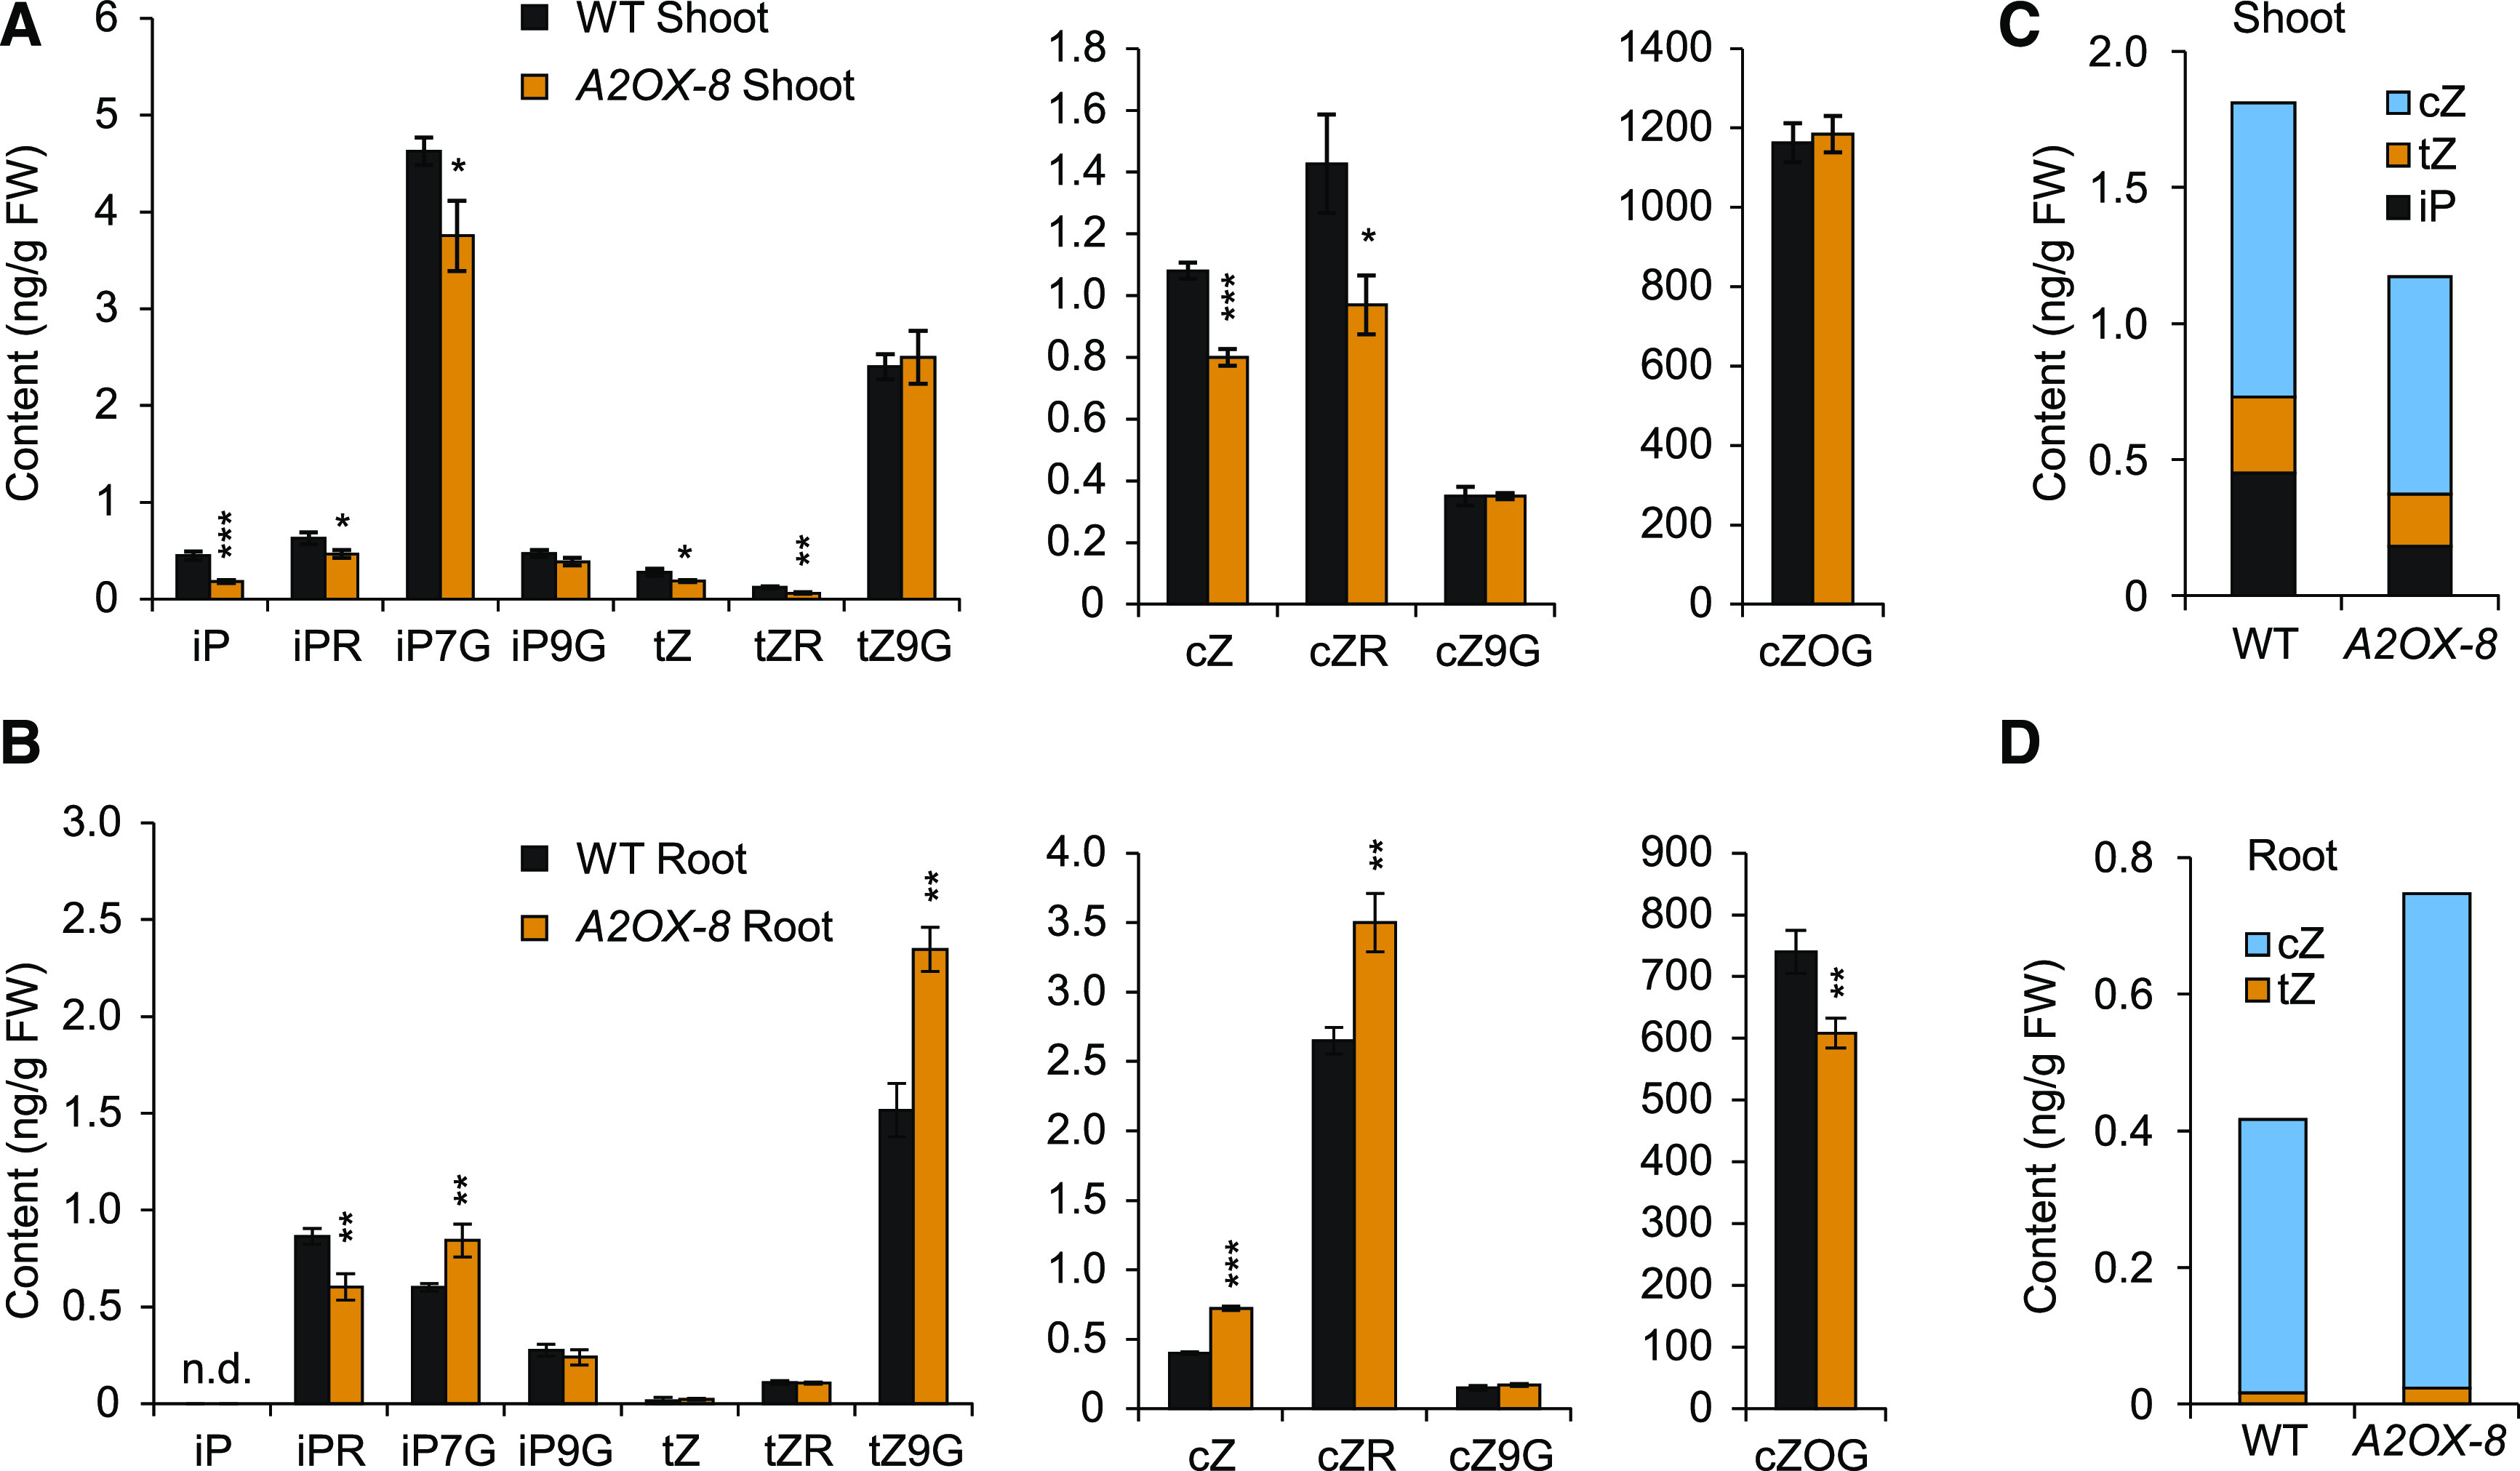
AGO2 Regulates Cytokinin Distribution.
(A) and (B) Quantification of various cytokinin forms in shoots (A) and roots (B) of the wild-type (WT) and A2OX-8 seedlings (n = 3, means ± sd). See Supplemental Table 1 for individual values and the full name of each cytokinin form. Different forms were grouped according to the content range. Asterisks indicate significant difference compared with the wild type (WT), with *P < 0.05, **P < 0.01, and ***P < 0.001 by Student’s two-tailed t test. FW, fresh weight.
(C) and (D) Total amounts of the three major active cytokinin forms in shoots (C) and roots (D).
Salt Stress Alters the Spatial Distribution Pattern of Cytokinins
Based on these results, we reasoned that the improved salt tolerance of both A2OX and BG3OX might be attributed to the altered cytokinin distribution in these plants. We thus investigated whether the distribution of cytokinin is involved in salt stress responses. Two component signaling sensor new (TCSn) is a synthetic gene promoter that is sensitive to cytokinins in Arabidopsis and maize (Zea mays; Zürcher et al., 2013). To evaluate the effect of salt stress on cytokinin distribution, we generated a cytokinin reporter line by introducing the TCSn:GUS vector into the wild-type rice. Upon salt treatment (200 mM NaCl for 4 h), β-glucuronidase (GUS) staining was markedly enhanced in the root cap and vascular cylinder of the primary root compared to the untreated control (Figures 8A and 8B). Notably, a darkly stained region was detected in the elongation/differentiation zone of the primary root only in salt-treated plants (Figure 8B). By contrast, the GUS expression region was significantly reduced in shoot tips under salt treatment (Figures 8A and 8C). These results suggest that salt stress induces an increase in cytokinin levels in roots but a decrease in shoots, a pattern reminiscent of A2OX plants.
Figure 8.

Salt Stress Alters the Spatial Distribution of Cytokinins.
(A) to (C) GUS staining of TCSn:GUS transgenic plants with (200 mM NaCl for 4 h) or without NaCl treatment (control). Gross morphology (A). Enlarged images of primary roots (B) and shoots (C). Bar in (A) = 1 cm; bar in (B) and (C) = 1 mm.
(D) and (E) Quantification of various cytokinin forms in shoots (D) and roots (E) of nontreated (control) and the NaCl-treated wild-type (WT) seedlings (n = 3, means ± sd). See Supplemental Table 2 for individual values and the full name of each cytokinin form. Different forms were grouped according to the content range. Asterisks indicate significant difference compared with WT, with *P < 0.05, **P < 0.01, and ***P < 0.001 by Student’s two-tailed t test. FW, fresh weight.
(F) and (G) Total amounts of the three major active cytokinin forms in shoots (D) and roots (E).
(H) In response to external high salinity, plants adjust the internal cytokinin distribution, possibly by mobilizing hormone transport to enhance stress adaptability. The changes in cytokinin distribution not only affect plant growth and development such as grain size but also stimulate stress-responsive processes such as ABA responses. While high salinity suppresses the transcription of both AGO2 and BG3, the activation of either gene enhances plant growth and stress tolerance simultaneously.
To verify these results, we directly quantified the contents of various cytokinins in shoots and roots of salt-treated (200 mM NaCl for 4 h) and untreated plants (Figures 8D and 8E; Supplemental Table 2). Compared to untreated plants, while iP7G levels increased in the shoots of salt-treated plants, iP, iPR, tZ, and tZR levels significantly decreased in the shoots of these plants, and the levels of other cytokinins, including cZ, changed little in these shoots. By contrast, in roots, iP and tZ levels showed little change in response to salt treatment, whereas cZ levels greatly increased in salt-treated plants. Among the conjugated forms of cytokinin with altered contents, the levels of iPR and cZ O-glucoside decreased under salt treatment while the levels iP7G, tZR, and cZR increased. Overall, this distribution pattern is highly similar to that in A2OX plants. The most significant changes in salt-treated plants, including decreases in iP and tZ levels in shoots and increases in cZ levels in roots, were basically the same as those observed in A2OX plants, as revealed by combining the three major active forms of cytokinin for comparison (Figures 8F and 8G). These results, together with the results of reporter analysis, strongly suggest that altered cytokinin distribution is a major plant response to salt stress.
DISCUSSION
We propose that, in response to the external high salinity, plants adjust the internal cytokinin distribution pattern to enhance adaptability to stress (Figure 8H). This idea is supported by the similar cytokinin distribution patterns in A2OX-8, bg3-D, and salt-treated plants: iP levels strongly decreased in shoots, but cZ levels strongly increased in roots. Considering that BG3 is a potential cytokinin transporter, it is likely that the changes in the spatial distribution pattern of cytokinin in response to salt stress are implemented by mobilizing the hormone transport system, although we cannot exclude the possibility that cytokinin metabolism is also involved in this process. Given the strong resistance of both A2OX and bg3-D to high salinity, this common feature (the distribution pattern) is likely the main reason that these plants are highly resistant to salt stress, suggesting that cytokinin distribution plays an essential biological role in stress responses (Figure 8H). However, since BG3 is thought to promote the shoot-to-root translocation of cytokinins but its transcription is suppressed by salt, it is likely that BG3 does not play a direct role in salt-induced changes in cytokinin distribution patterns between the shoot and root. Other cytokinin transporters might be involved in this process (Figure 8H). In support of this hypothesis, expression analysis of roots revealed that OsPUP7, the closest homolog of BG3 (Qi and Xiong, 2013; Xiao et al., 2019), is markedly induced by salt, whereas OsABCG18, encoding a transporter that directs cytokinin translocation from root to shoot (Zhao et al., 2019), is significantly suppressed by salt (Supplemental Figure 18). Thus, both genes represent candidate targets for modulating the cytokinin distribution pattern in response to salt stress, a notion that requires further investigation. Our study opens avenues for understanding the physiological role of cytokinin transport in plants.
It should be mentioned that changes in cZ levels in the shoots differed among the three plants: cZ levels increased in bg3-D shoots but decreased in A2OX-8 shoots and were unaltered in the shoot of salt-treated plants. As mentioned above, the activation of BG3 in A2OX plants occurred only in shoots, which may partially contribute to this difference. In addition, the cytokinin forms whose levels decreased in shoots are primarily iP- and tZ-type cytokinins, whereas those whose levels increased in roots are primarily cZ type, suggesting that the conversion of different cytokinins might occur within certain tissues.
Changes in cytokinin distribution not only affect stress responses but also modulate plant growth and development. Indeed, our study identified AGO2-BG3 as a genetic module that modulates cytokinin distribution to regulate both grain length and salt resistance (Figure 8G). While stress suppressed the transcription of both genes, overexpressing either gene increased grain length and salt tolerance simultaneously. Since grain length determines both grain yield and quality, these genes could be valuable targets for simultaneously improving grain yield, abiotic stress resistance, and grain quality. Several reports have indicated that fusing different tags at different termini could have variable and unpredictable effects on protein function (Stadler et al., 2013; Georgieva et al., 2015; Hurst et al., 2018), a phenomenon known as the tag effect. Here, we showed that two A2FOX lines simultaneously had enhanced grain length, grain yield, and salt tolerance, suggesting that the tag effect could be adopted as a strategy for protein manipulation. In addition to transgenic methods, more effective utilization of these genes might be achieved by precise manipulation via genome editing (Rodríguez-Leal et al., 2017) and allele mining or engineering.
Among all AGO family members in rice, only AGO2 is regulated by stresses such as salt, drought, and cold (Kapoor et al., 2008). Nevertheless, two studies in Arabidopsis have demonstrated the involvement of AGO1 in salt stress (Dolata et al., 2016; Liu et al., 2018a), suggesting that members of this family play redundant roles in stress responses, which might explain the silent phenotypes of ago2 and ago2 ago3. AGO2 modifies the histone methylation status of BG3 and activates its expression. Interestingly, it appears that AGO2 tended to be predominantly enriched at the promoter region of BG3, but histone methylation mainly occurred at the coding region of this gene, suggesting that additional chromatin modifiers are involved in this process. One possibility is that AGO2 enrichment triggered a series of events, including chromatin remodeling of the BG3 coding region, ultimately activating its transcription. Consistently, GO analysis indicated that several DEGs identified in A2OX are involved in chromatin-related processes. A similar mechanism has been revealed for AGO1 function in Arabidopsis, that is, SWI/SNF chromatin remodeling complexes are required for AGO1-regulated transcription activation (Liu et al., 2018a). Similarly, a recent study revealed that AGO2 represses HEXOKINASE1 expression by modulating DNA methylation (Zheng et al., 2019). These findings suggest that AGO2 might function as a transcriptional modulator through epigenetic regulation, possibly via different mechanisms.
In Arabidopsis, cytokinin negatively regulates seed size and salt stress tolerance (Werner et al., 2003; Miyawaki et al., 2006; Riefler et al., 2006; Deng et al., 2010; Nishiyama et al., 2011). By contrast, several studies have indicated that cytokinin positively regulates grain size and salinity stress tolerance in rice (Gao et al., 2014; Sun et al., 2014; Joshi et al., 2018). We recently showed that the activation of BG3 enlarges grain size, suggesting that cytokinin transport might be involved in regulating grain size (Xiao et al., 2019). In this study, we showed that while bg3 loss-of-function mutants are salt sensitive, BG3 gain-of-function plants show durably strong resistance to high salinity, highlighting the important role of cytokinin distribution in enhancing stress tolerance and grain development. Compared to hormone metabolism, this might represent a more economical solution used by plants to deal with dynamic environmental conditions as well as internal demands. Thus, plants have developed an elaborate system involving multiple mechanisms to modulate cytokinin transport (Ko et al., 2014; Zhang et al., 2014; Zürcher et al., 2016; Xiao et al., 2019). Optimizing cytokinin distribution in plant tissues or cells could be crucial for balancing yield, quality, and resistance and thus should be considered as a strategy for simultaneously enhancing grain yield, grain quality, and resistance to various abiotic/biotic stresses.
METHODS
Plant Materials, Cultivation, and Agronomic Trait Analysis
The japonica rice (Oryza sativa) cv ‘Zhonghua11’ was used as the wild type for all analyses. For field trials, plants were grown at a density 20 × 20 cm at two experimental stations located in Beijing (40° 06′ N) and Hainan province (18° 30′ N), respectively. For seedling analysis, plants were cultivated in a growth chamber (GXZ-800D; Ningbo) with the following settings: 30°C day and 28°C night, 10-h-light/14-h-dark cycle, and light intensity of 600 μmol m−2 s−1. Half-strength Murashige and Skoog basal salt mixture (MS) was used as a nutrient source. Seeds were harvested and dried for grain size measurement using an Seed Counter-G system (WSeen).
Stress and ABA Treatments
One-week-old seedlings were treated with 200 mM NaCl for 6 to 10 d, depending on plant sensitivity, until a response to salt was observed. After recovery, seedlings that developed new leaves were counted as survivors. Plants were cultured in a 96-well bottomless PCR plate containing the wild type and one single transgenic line (or mutant line in 50% of cases) for evaluation. Sterilized seeds were sown on half strength MS agar medium with or without ABA (Sigma-Aldrich) supplementation and grown for 12 d prior to root and shoot measurements.
Vector Construction, Genome Editing, and Plant Transformation
The vectors constructed in this study are listed in Supplemental Table 3, including the primers and restriction enzyme sites. p2300-35S-AGO2 was used to produce A2OX plants, and p1300-35S-AGO2-Flag was used to produce A2FOX plants. The full-length AGO2 cDNA was obtained from the National Institute of Agrobiological Sciences DNA Bank (http://www.dna.affrc.go.jp/) and used as a template for PCR amplification. This cDNA contained a G-A variation compared with the reference genome at site 2842. As this variation also exists in some other cultivars (e.g., ‘9311’, an indica cultivar), it was ignored here. AGO2-knockout lines were created using the CRISPR/Cas9 system (Wang et al., 2015). Briefly, the targeting sequence (5′-TGGAGCACGAGCGCGGTGG-3′, nucleotides 2 to 20 of AGO2 cDNA) was synthesized, ligated into SK-gRNA, and introduced into p1300-Cas9, resulting in p1300-Cas9-AGO2, which was used for transformation. To create the ago2 ago3 double mutant, AGO2 and AGO3 were coedited by targeting 5′-GGACGTGGGTATGAATCCGG-3′ (nucleotides 289 to 308 of AGO2 cDNA) and 5′-GGCTACGGGTACCCGAGAGG-3′ (nucleotides 46 to 65 of AGO3 cDNA), as described previously (Lu et al., 2017). BG3 editing was performed by targeting 5′- AACCGGTGGGTGGCCACGC-3′ (nucleotides 193 to 211 of BG3 cDNA). Knockout lines were confirmed by PCR sequencing with primers listed in Supplemental Table 4. The TCSn promoter was amplified from the TCSn:LUC vector (Zürcher et al., 2013) and introduced into the pCAMBIA2391Z vector, resulting in the TCSn:GUS vector. Transgenic plants were produced by a standard Agrobacterium tumefaciens–mediated method.
Gene Expression Analysis
RNA was isolated from the plants using TRIzol (Invitrogen), and cDNA was prepared using an RT kit (Toyobo) following the product instructions. RT-qPCR was performed on a LightCycler 96 system (Roche) using SYBR Green PCR mix (Roche). The rice Ubiquitin gene was used as an internal reference for normalization. Primers used for analysis are listed in Supplemental Table 4.
Measuring MDA Content
Tissue from the aerial parts of plants (0.2 g) was homogenized in 1 mL of 10% (w/v) trichloroacetic acid and centrifuged at 1500g for 10 min at room temperature. The supernatant (0.5 mL) was reacted with 0.5 mL of 0.67% (w/v) thiobarbituric acid. The mixture was heated in a boiling water bath for 15 min and cooled in an ice bath. Following centrifugation at 2350g for 10 min at room temperature, the absorbance (A) of the supernatant was measured at 450, 532, and 600 nm. The MDA content was calculated as follows:
GUS Staining
Plants were cultured for 6 d and treated with 200 mM NaCl for 4 h. Whole treated or nontreated plants were incubated overnight in a solution containing 50 mM NaPO4 buffer, pH 7.0, 5 mM K3Fe(CN)6, 5mM K4Fe(CN)6, 0.1% (v/v) Triton X-100, and 1 mM 5-bromo-4-chloro-3-indolyl-beta-D-glucuronic acid at 37°C (Jefferson, 1989). The samples were destained in 70% (v/v) ethanol prior to analysis.
RNA-Sequencing Analysis
To identify DEGs in each mutant or transgenic line, an independent wild-type plant grown at the same time under the same conditions was always included and used as a reference for comparison. The aerial parts of 10-d-old seedlings grown in 1/2MS hydroponic medium were harvested for total RNA extraction. The purified RNAs were used for library construction using an NEBNext Ultra RNA Library Prep Kit for Illumina (NEB). Three biological replicate libraries were prepared for A2OX-4 and one for the other lines. Clustering of index-coded samples was performed on a cBot Cluster Generation System using a Nova-seq Cluster Kit (Illumina). The libraries were sequenced on the Illumina NovaSeq S6000 platform, and 150-bp paired-end reads were generated. False discovery rate or P-value < 0.05 and absolute value of log2(fold change) ≥ 1 were used to identify DEGs. Analysis of overlapping DEGs was performed online using Venny (http://bioinfogp.cnb.csic.es/tools/venny/), and GO analysis was performed using agriGO (http://systemsbiology.cau.edu.cn/agriGOv2/).
Hormone Measurements
Seeds were germinated and grown in half strength MS hydroponic medium for 10 d in a growth chamber. Approximately 0.5 g of shoot or root tissue was harvested from rice seedlings and used to measure cytokinin levels as described previously (Cai et al., 2014).
ChIP-Seq, ChIP-qPCR, and DNA Pyrosequencing
Approximately 2 g of tissue from 2-week-old seedlings was ground in liquid nitrogen. The samples were fixed with 1% (v/v) formaldehyde. After nucleus precipitation and lysis, chromatin was extracted and sonicated to form DNA fragments with a size centering at ∼500 bp. The chromatin solution was incubated with the following antibodies: anti-Flag (F1804; Sigma-Aldrich), anti-H3K4me3 (05-745R; Millipore), and anti-H3K27me3 (07-449; Millipore). The above-mentioned steps were conducted at 4°C. The immunoprecipitated DNA was recovered and subjected to qPCR or sequencing analysis. For ChIP-seq, raw data were filtered using Trimmomatic (Bolger et al., 2014) and mapped to the reference genome (http://rice.plantbiology.msu.edu/) with Burrows–Wheeler Alignment tool (Li and Durbin, 2009). The ChIP-seq peaks were called by Model-Based Analysis of ChIP-Seq 2 with default parameters (Zhang et al., 2008). The binding pattern around BG3 was visualized using Integrative Genomics Viewer software (Robinson et al., 2011). For ChIP-qPCR, enrichment of target DNA was represented as a percentage of input DNA. Enrichment of histone methylation was further normalized to Ubiquitin as an internal control. For DNA pyrosequencing, genomic DNA from the wild-type and A2OX-8 plants was extracted and subjected to bisulfite treatment. The bisulfite-treated DNA was then purified. Two regions of the BG3 promoter containing CpG sequences were selected for PCR amplification. Sample preparation and pyrosequencing were performed using PyroMark Q96 ID (Qiagen) following the manufacturer’s instructions. Primers used for PCR amplification and pyrosequencing are listed in Supplemental Table 5.
Statistical Analyses
Student’s two-tailed t test was used for significant difference analysis between two samples. One-way ANOVA followed with Tukey test (P < 0.05) was used for pairwise multiple comparisons. All the analyses were performed with SigmaStat software. Data for all statistical analyses are shown in Supplemental Data Set 2.
Accession Numbers
Sequence information can be found in the Rice Genome Annotation Project (http://rice.plantbiology.msu.edu/) under the following accession numbers: LOC_Os04g52540 (AGO2), LOC_Os01g48800 (BG3), LOC_Os05g48300 (OsPUP7), LOC_Os08g07010 (OsABCG18), and LOC_Os04g52550 (AGO3). The RNA-seq and ChIP-seq data (BioProject PRJCA001920) can be found in the Beijing Institute of Genomics Data Center (http://bigd.big.ac.cn) under accession numbers CRA002105, CRA002106, CRA002107, and CRA002109.
Supplemental Data
Supplemental Figure 1. Identification and phenotypic analysis of ago2 and ago2 ago3 mutants.
Supplemental Figure 2. Identification of A2OX transgenic lines.
Supplemental Figure 3. Screening and identification of A2FOX transgenic lines.
Supplemental Figure 4. Statistical data for grain width and 1000-grain weight of A2OX and A2FOX transgenic plants.
Supplemental Figure 5. Statistical data for agronomic traits of A2OX and A2FOX transgenic lines.
Supplemental Figure 6. A2OX plants show strong resistance to salt stress.
Supplemental Figure 7. GO enrichment analysis of DEGs between A2OX-4 and the wild type.
Supplemental Figure 8. A2OX- and BG3-overexpressing plants have similar phenotypes.
Supplemental Figure 9. BG3-overexpressing plants show strong resistance to salt stress.
Supplemental Figure 10. bg3 mutants show slightly reduced ABA sensitivity.
Supplemental Figure 11. Mutation information for BG3-edited plants.
Supplemental Figure 12. Salt stress test of the wild type and BG3 knockout plants in the A2OX-8 background.
Supplemental Figure 13. Positive and negative controls for expression analysis of the effects of salt on gene transcription.
Supplemental Figure 14. Effects of salt on BG3 expression in A2OX plants.
Supplemental Figure 15. AGO2 binds to BG3.
Supplemental Figure 16. Detection of DNA methylation levels on various BG3 promoter regions.
Supplemental Figure 17. Expression of AGO2 and BG3 in the roots of the wild type and A2OX plants.
Supplemental Figure 18. Effects of salt on the expression of OsPUP7 and OsABCG18 in the roots of wild-type plants.
Supplemental Table 1. Quantification of cytokinin levels in the wild type and A2OX-8.
Supplemental Table 2. Quantification of cytokinin levels in non-treated (control) and NaCl-treated wild-type seedlings.
Supplemental Table 3. Vectors and primers used for vector construction.
Supplemental Table 4. Primers used for mutation identification and RT-qPCR.
Supplemental Table 5. Primers used for ChIP-qPCR and methylation analyses.
Supplemental Data Set 1. List of DEGs identified by RNA-sequencing in A2OX-4 and bg3-D compared to the wild type.
Supplemental Data Set 2. Data for all statistical analyses performed in this study.
DIVE Curated Terms
The following phenotypic, genotypic, and functional terms are of significance to the work described in this paper:
Acknowledgments
We thank Bruno Müller (University of Zürich, Switzerland) for providing the TCSn:LUC vector and Kejian Wang (China National Rice Research Institute) for providing the CRISPR/Cas9 vectors. Full-length AGO2 cDNA was provided by the National Institute of Agrobiological Sciences DNA Bank. This work was supported by the National Natural Science Foundation (grants 91735302, 31871587, 31722037, and 91435106) and Fundamental Research Funds for Central Non-Profit of Institute of Crop Sciences, Chinese Academy of Agricultural Sciences (grant 2060302).
AUTHOR CONTRIBUTIONS
H.T. conceived and designed the study. W.Y. and H.T. performed most of the experiments. Y.X., M.N., W.M., L.L., X.Z., D.L., G.Z., Z.S., R.H., and S.W. provided assistance. Y.Q. generated transgenic plants. H.T., W.Y., Y.X., and C.C. analyzed the data and wrote the article. H.T., C.C., and C.-M. L. co-supervised the study.
Footnotes
Articles can be viewed without a subscription.
References
- Bohmert K., Camus I., Bellini C., Bouchez D., Caboche M., Benning C.(1998). AGO1 defines a novel locus of Arabidopsis controlling leaf development. EMBO J. 17: 170–180. [DOI] [PMC free article] [PubMed] [Google Scholar]
- Bolger A.M., Lohse M., Usadel B.(2014). Trimmomatic: A flexible trimmer for Illumina sequence data. Bioinformatics 30: 2114–2120. [DOI] [PMC free article] [PubMed] [Google Scholar]
- Bürkle L., Cedzich A., Döpke C., Stransky H., Okumoto S., Gillissen B., Kühn C., Frommer W.B.(2003). Transport of cytokinins mediated by purine transporters of the PUP family expressed in phloem, hydathodes, and pollen of Arabidopsis. Plant J. 34: 13–26. [DOI] [PubMed] [Google Scholar]
- Cai B.D., Zhu J.X., Gao Q., Luo D., Yuan B.F., Feng Y.Q.(2014). Rapid and high-throughput determination of endogenous cytokinins in Oryza sativa by bare Fe3O4 nanoparticles-based magnetic solid-phase extraction. J. Chromatogr. A 1340: 146–150. [DOI] [PubMed] [Google Scholar]
- Carbonell A., Fahlgren N., Garcia-Ruiz H., Gilbert K.B., Montgomery T.A., Nguyen T., Cuperus J.T., Carrington J.C.(2012). Functional analysis of three Arabidopsis ARGONAUTES using slicer-defective mutants. Plant Cell 24: 3613–3629. [DOI] [PMC free article] [PubMed] [Google Scholar]
- Che R., Tong H., Shi B., Liu Y., Fang S., Liu D., Xiao Y., Hu B., Liu L., Wang H., Zhao M., Chu C.(2015). Control of grain size and rice yield by GL2-mediated brassinosteroid responses. Nat. Plants 2: 15195. [DOI] [PubMed] [Google Scholar]
- Chen J., Nolan T.M., Ye H., Zhang M., Tong H., Xin P., Chu J., Chu C., Li Z., Yin Y.(2017). Arabidopsis WRKY46, WRKY54, and WRKY70 transcription factors are involved in brassinosteroid-regulated plant growth and drought responses. Plant Cell 29: 1425–1439. [DOI] [PMC free article] [PubMed] [Google Scholar]
- Deng Y., Dong H., Mu J., Ren B., Zheng B., Ji Z., Yang W.C., Liang Y., Zuo J.(2010). Arabidopsis histidine kinase CKI1 acts upstream of histidine phosphotransfer proteins to regulate female gametophyte development and vegetative growth. Plant Cell 22: 1232–1248. [DOI] [PMC free article] [PubMed] [Google Scholar]
- Deng Y., et al. (2017). Epigenetic regulation of antagonistic receptors confers rice blast resistance with yield balance. Science 355: 962–965. [DOI] [PubMed] [Google Scholar]
- Dolata J., Bajczyk M., Bielewicz D., Niedojadlo K., Niedojadlo J., Pietrykowska H., Walczak W., Szweykowska-Kulinska Z., Jarmolowski A.(2016). Salt stress reveals a new role for ARGONAUTE1 in miRNA biogenesis at the transcriptional and posttranscriptional levels. Plant Physiol. 172: 297–312. [DOI] [PMC free article] [PubMed] [Google Scholar]
- Duan P., Ni S., Wang J., Zhang B., Xu R., Wang Y., Chen H., Zhu X., Li Y.(2015). Regulation of OsGRF4 by OsmiR396 controls grain size and yield in rice. Nat. Plants 2: 15203. [DOI] [PubMed] [Google Scholar]
- Fang X., Qi Y.(2016). RNAi in plants: An Argonaute-centered view. Plant Cell 28: 272–285. [DOI] [PMC free article] [PubMed] [Google Scholar]
- Gao S., Fang J., Xu F., Wang W., Sun X., Chu J., Cai B., Feng Y., Chu C.(2014). CYTOKININ OXIDASE/DEHYDROGENASE4 integrates cytokinin and auxin signaling to control rice crown root formation. Plant Physiol. 165: 1035–1046. [DOI] [PMC free article] [PubMed] [Google Scholar]
- Georgieva M.V., et al. (2015). Inntags: Small self-structured epitopes for innocuous protein tagging. Nat. Methods 12: 955–958. [DOI] [PubMed] [Google Scholar]
- Hirose N., Makita N., Yamaya T., Sakakibara H.(2005). Functional characterization and expression analysis of a gene, OsENT2, encoding an equilibrative nucleoside transporter in rice suggest a function in cytokinin transport. Plant Physiol. 138: 196–206. [DOI] [PMC free article] [PubMed] [Google Scholar]
- Hu J., et al. (2015). A rare allele of GS2 enhances grain size and grain yield in rice. Mol. Plant 8: 1455–1465. [DOI] [PubMed] [Google Scholar]
- Hu Z., et al. (2018). A novel QTL qTGW3 encodes the GSK3/SHAGGY-like kinase OsGSK5/OsSK41 that interacts with OsARF4 to negatively regulate grain size and weight in rice. Mol. Plant 11: 736–749. [DOI] [PubMed] [Google Scholar]
- Hurst C.H., Turnbull D., Myles S.M., Leslie K., Keinath N.F., Hemsley P.A.(2018). Variable effects of C-terminal fusions on FLS2 function: Not all epitope tags are created equal. Plant Physiol. 177: 522–531. [DOI] [PMC free article] [PubMed] [Google Scholar]
- Hutvagner G., Simard M.J.(2008). Argonaute proteins: Key players in RNA silencing. Nat. Rev. Mol. Cell Biol. 9: 22–32. [DOI] [PubMed] [Google Scholar]
- Ishimaru K., Hirotsu N., Madoka Y., Murakami N., Hara N., Onodera H., Kashiwagi T., Ujiie K., Shimizu B., Onishi A., Miyagawa H., Katoh E.(2013). Loss of function of the IAA-glucose hydrolase gene TGW6 enhances rice grain weight and increases yield. Nat. Genet. 45: 707–711. [DOI] [PubMed] [Google Scholar]
- Janowski B.A., Huffman K.E., Schwartz J.C., Ram R., Nordsell R., Shames D.S., Minna J.D., Corey D.R.(2006). Involvement of AGO1 and AGO2 in mammalian transcriptional silencing. Nat. Struct. Mol. Biol. 13: 787–792. [DOI] [PubMed] [Google Scholar]
- Jefferson R.A.(1989). The GUS reporter gene system. Nature 342: 837–838. [DOI] [PubMed] [Google Scholar]
- Joshi R., Sahoo K.K., Tripathi A.K., Kumar R., Gupta B.K., Pareek A., Singla-Pareek S.L.(2018). Knockdown of an inflorescence meristem-specific cytokinin oxidase - OsCKX2 in rice reduces yield penalty under salinity stress condition. Plant Cell Environ. 41: 936–946. [DOI] [PubMed] [Google Scholar]
- Kapoor M., Arora R., Lama T., Nijhawan A., Khurana J.P., Tyagi A.K., Kapoor S.(2008). Genome-wide identification, organization and phylogenetic analysis of Dicer-like, Argonaute and RNA-dependent RNA Polymerase gene families and their expression analysis during reproductive development and stress in rice. BMC Genomics 9: 451. [DOI] [PMC free article] [PubMed] [Google Scholar]
- Kissoudis C., van de Wiel C., Visser R.G.F., van der Linden G.(2016). Future-proof crops: Challenges and strategies for climate resilience improvement. Curr. Opin. Plant Biol. 30: 47–56. [DOI] [PubMed] [Google Scholar]
- Ko D., et al. (2014). Arabidopsis ABCG14 is essential for the root-to-shoot translocation of cytokinin. Proc. Natl. Acad. Sci. USA 111: 7150–7155. [DOI] [PMC free article] [PubMed] [Google Scholar]
- Li H., Durbin R.(2009). Fast and accurate short read alignment with Burrows-Wheeler transform. Bioinformatics 25: 1754–1760. [DOI] [PMC free article] [PubMed] [Google Scholar]
- Li N., Li Y.(2016). Signaling pathways of seed size control in plants. Curr. Opin. Plant Biol. 33: 23–32. [DOI] [PubMed] [Google Scholar]
- Liu C., Xin Y., Xu L., Cai Z., Xue Y., Liu Y., Xie D., Liu Y., Qi Y.(2018a). Arabidopsis ARGONAUTE 1 binds chromatin to promote gene transcription in response to hormones and stresses. Dev. Cell 44: 348–361.e7. [DOI] [PubMed] [Google Scholar]
- Liu J., et al. (2017). GW5 acts in the brassinosteroid signalling pathway to regulate grain width and weight in rice. Nat. Plants 3: 17043. [DOI] [PubMed] [Google Scholar]
- Liu Q., et al. (2018b). G-Protein βγ subunits determine grain size through interaction with MADS-domain transcription factors in rice. Nat. Commun. 9: 852. [DOI] [PMC free article] [PubMed] [Google Scholar]
- Lu Y., Ye X., Guo R., Huang J., Wang W., Tang J., Tan L., Zhu J.K., Chu C., Qian Y.(2017). Genome-wide targeted mutagenesis in rice using the CRISPR/Cas9 system. Mol. Plant 10: 1242–1245. [DOI] [PubMed] [Google Scholar]
- Ma Q., Xia Z., Cai Z., Li L., Cheng Y., Liu J., Nian H.(2019). GmWRKY16 enhances drought and salt tolerance through an ABA-mediated pathway in Arabidopsis thaliana. Front Plant Sci 9: 1979. [DOI] [PMC free article] [PubMed] [Google Scholar]
- Miyawaki K., Tarkowski P., Matsumoto-Kitano M., Kato T., Sato S., Tarkowska D., Tabata S., Sandberg G., Kakimoto T.(2006). Roles of Arabidopsis ATP/ADP isopentenyltransferases and tRNA isopentenyltransferases in cytokinin biosynthesis. Proc. Natl. Acad. Sci. USA 103: 16598–16603. [DOI] [PMC free article] [PubMed] [Google Scholar]
- Mok D.W., Mok M.C.(2001). Cytokinin metabolism and action. Annu. Rev. Plant Physiol. Plant Mol. Biol. 52: 89–118. [DOI] [PubMed] [Google Scholar]
- Nagasaki H., Itoh J., Hayashi K., Hibara K., Satoh-Nagasawa N., Nosaka M., Mukouhata M., Ashikari M., Kitano H., Matsuoka M., Nagato Y., Sato Y.(2007). The small interfering RNA production pathway is required for shoot meristem initiation in rice. Proc. Natl. Acad. Sci. USA 104: 14867–14871. [DOI] [PMC free article] [PubMed] [Google Scholar]
- Nishimura A., Ito M., Kamiya N., Sato Y., Matsuoka M.(2002). OsPNH1 regulates leaf development and maintenance of the shoot apical meristem in rice. Plant J. 30: 189–201. [DOI] [PubMed] [Google Scholar]
- Nishiyama R., et al. (2011). Analysis of cytokinin mutants and regulation of cytokinin metabolic genes reveals important regulatory roles of cytokinins in drought, salt and abscisic acid responses, and abscisic acid biosynthesis. Plant Cell 23: 2169–2183. [DOI] [PMC free article] [PubMed] [Google Scholar]
- Nonomura K., Morohoshi A., Nakano M., Eiguchi M., Miyao A., Hirochika H., Kurata N.(2007). A germ cell specific gene of the ARGONAUTE family is essential for the progression of premeiotic mitosis and meiosis during sporogenesis in rice. Plant Cell 19: 2583–2594. [DOI] [PMC free article] [PubMed] [Google Scholar]
- Qi Z., Xiong L.(2013). Characterization of a purine permease family gene OsPUP7 involved in growth and development control in rice. J. Integr. Plant Biol. 55: 1119–1135. [DOI] [PubMed] [Google Scholar]
- Qian Q., Guo L.B., Smith S.M., Li J.Y.(2016). Breeding high-yield superior quality hybrid super rice by rational design. Natl. Sci. Rev. 3: 283–294. [Google Scholar]
- Riefler M., Novak O., Strnad M., Schmülling T.(2006). Arabidopsis cytokinin receptor mutants reveal functions in shoot growth, leaf senescence, seed size, germination, root development, and cytokinin metabolism. Plant Cell 18: 40–54. [DOI] [PMC free article] [PubMed] [Google Scholar]
- Robinson J.T., Thorvaldsdóttir H., Winckler W., Guttman M., Lander E.S., Getz G., Mesirov J.P.(2011). Integrative genomics viewer. Nat. Biotechnol. 29: 24–26. [DOI] [PMC free article] [PubMed] [Google Scholar]
- Rodríguez-Leal D., Lemmon Z.H., Man J., Bartlett M.E., Lippman Z.B.(2017). Engineering quantitative trait variation for crop improvement by genome editing. Cell 171: 470–480.e8. [DOI] [PubMed] [Google Scholar]
- Sakakibara H.(2006). Cytokinins: Activity, biosynthesis, and translocation. Annu. Rev. Plant Biol. 57: 431–449. [DOI] [PubMed] [Google Scholar]
- Sharma I., Ching E., Saini S., Bhardwaj R., Pati P.K.(2013). Exogenous application of brassinosteroid offers tolerance to salinity by altering stress responses in rice variety Pusa Basmati-1. Plant Physiol. Biochem. 69: 17–26. [DOI] [PubMed] [Google Scholar]
- Shi Z., Wang J., Wan X., Shen G., Wang X., Zhang J.(2007). Over-expression of rice OsAGO7 gene induces upward curling of the leaf blade that enhanced erect-leaf habit. Planta 226: 99–108. [DOI] [PubMed] [Google Scholar]
- Stadler C., Rexhepaj E., Singan V.R., Murphy R.F., Pepperkok R., Uhlén M., Simpson J.C., Lundberg E.(2013). Immunofluorescence and fluorescent-protein tagging show high correlation for protein localization in mammalian cells. Nat. Methods 10: 315–323. [DOI] [PubMed] [Google Scholar]
- Sun L., Zhang Q., Wu J., Zhang L., Jiao X., Zhang S., Zhang Z., Sun D., Lu T., Sun Y.(2014). Two rice authentic histidine phosphotransfer proteins, OsAHP1 and OsAHP2, mediate cytokinin signaling and stress responses in rice. Plant Physiol. 165: 335–345. [DOI] [PMC free article] [PubMed] [Google Scholar]
- Taliaferro J.M., Aspden J.L., Bradley T., Marwha D., Blanchette M., Rio D.C.(2013). Two new and distinct roles for Drosophila Argonaute-2 in the nucleus: alternative pre-mRNA splicing and transcriptional repression. Genes Dev. 27: 378–389. [DOI] [PMC free article] [PubMed] [Google Scholar]
- Wang C., Shen L., Fu Y., Yan C., Wang K.(2015). A simple CRISPR/Cas9 system for multiplex genome editing in rice. J. Genet. Genomics 42: 703–706. [DOI] [PubMed] [Google Scholar]
- Wang X.B., Jovel J., Udomporn P., Wang Y., Wu Q., Li W.X., Gasciolli V., Vaucheret H., Ding S.W.(2011). The 21-nucleotide, but not 22-nucleotide, viral secondary small interfering RNAs direct potent antiviral defense by two cooperative argonautes in Arabidopsis thaliana. Plant Cell 23: 1625–1638. [DOI] [PMC free article] [PubMed] [Google Scholar]
- Werner T., Motyka V., Laucou V., Smets R., Van Onckelen H., Schmülling T.(2003). Cytokinin-deficient transgenic Arabidopsis plants show multiple developmental alterations indicating opposite functions of cytokinins in the regulation of shoot and root meristem activity. Plant Cell 15: 2532–2550. [DOI] [PMC free article] [PubMed] [Google Scholar]
- Wu L., Zhang Q., Zhou H., Ni F., Wu X., Qi Y.(2009). Rice MicroRNA effector complexes and targets. Plant Cell 21: 3421–3435. [DOI] [PMC free article] [PubMed] [Google Scholar]
- Xia D., Zhou H., Liu R., Dan W., Li P., Wu B., Chen J., Wang L., Gao G., Zhang Q., He Y.(2018). GL3.3, a novel QTL encoding a GSK3/SHAGGY-like kinase, epistatically interacts with GS3 to produce extra-long grains in rice. Mol. Plant 11: 754–756. [DOI] [PubMed] [Google Scholar]
- Xiao Y., Liu D., Zhang G., Gao S., Liu L., Xu F., Che R., Wang Y., Tong H., Chu C.(2019). Big Grain3, encoding a purine permease, regulates grain size via modulating cytokinin transport in rice. J. Integr. Plant Biol. 61: 581–597. [DOI] [PubMed] [Google Scholar]
- Ying J.Z., Ma M., Bai C., Huang X.H., Liu J.L., Fan Y.Y., Song X.J.(2018). TGW3, a major QTL that negatively modulates grain length and weight in rice. Mol. Plant 11: 750–753. [DOI] [PubMed] [Google Scholar]
- Zhang H., Xia R., Meyers B.C., Walbot V.(2015). Evolution, functions, and mysteries of plant ARGONAUTE proteins. Curr. Opin. Plant Biol. 27: 84–90. [DOI] [PubMed] [Google Scholar]
- Zhang K., Novak O., Wei Z., Gou M., Zhang X., Yu Y., Yang H., Cai Y., Strnad M., Liu C.J.(2014). Arabidopsis ABCG14 protein controls the acropetal translocation of root-synthesized cytokinins. Nat. Commun. 5: 3274. [DOI] [PubMed] [Google Scholar]
- Zhang X., Zhao H., Gao S., Wang W.C., Katiyar-Agarwal S., Huang H.D., Raikhel N., Jin H.(2011). Arabidopsis Argonaute 2 regulates innate immunity via miRNA393(*)-mediated silencing of a Golgi-localized SNARE gene, MEMB12. Mol. Cell 42: 356–366. [DOI] [PMC free article] [PubMed] [Google Scholar]
- Zhang Y., Liu T., Meyer C.A., Eeckhoute J., Johnson D.S., Bernstein B.E., Nusbaum C., Myers R.M., Brown M., Li W., Liu X.S.(2008). Model-based analysis of ChIP-seq (MACS). Genome Biol. 9: R137. [DOI] [PMC free article] [PubMed] [Google Scholar]
- Zhao D.S., Li Q.F., Zhang C.Q., Zhang C., Yang Q.Q., Pan L.X., Ren X.Y., Lu J., Gu M.H., Liu Q.Q.(2018). GS9 acts as a transcriptional activator to regulate rice grain shape and appearance quality. Nat. Commun. 9: 1240. [DOI] [PMC free article] [PubMed] [Google Scholar]
- Zhao J., Yu N., Ju M., Fan B., Zhang Y., Zhu E., Zhang M., Zhang K.(2019). ABC transporter OsABCG18 controls the shootward transport of cytokinins and grain yield in rice. J. Exp. Bot. 70: 6277–6291. [DOI] [PMC free article] [PubMed] [Google Scholar]
- Zheng S., Li J., Ma L., Wang H., Zhou H., Ni E., Jiang D., Liu Z., Zhuang C.(2019). OsAGO2 controls ROS production and the initiation of tapetal PCD by epigenetically regulating OsHXK1 expression in rice anthers. Proc. Natl. Acad. Sci. USA 116: 7549–7558. [DOI] [PMC free article] [PubMed] [Google Scholar]
- Zhong J., He W., Peng Z., Zhang H., Li F., Yao J.(2019). A putative AGO protein, OsAGO17, positively regulates grain size and grain weight through OsmiR397b in rice. Plant Biotechnol. J.. [DOI] [PMC free article] [PubMed] [Google Scholar]
- Zuo J., Li J.(2014). Molecular genetic dissection of quantitative trait loci regulating rice grain size. Annu. Rev. Genet. 48: 99–118. [DOI] [PubMed] [Google Scholar]
- Zürcher E., Liu J., di Donato M., Geisler M., Müller B.(2016). Plant development regulated by cytokinin sinks. Science 353: 1027–1030. [DOI] [PubMed] [Google Scholar]
- Zürcher E., Tavor-Deslex D., Lituiev D., Enkerli K., Tarr P.T., Müller B.(2013). A robust and sensitive synthetic sensor to monitor the transcriptional output of the cytokinin signaling network in planta. Plant Physiol. 161: 1066–1075. [DOI] [PMC free article] [PubMed] [Google Scholar]