

SUMMARY
Heart regeneration requires cardiomyocyte proliferation. It is thought that formation of polyploid nuclei establishes a barrier for cardiomyocyte proliferation, but the mechanisms are largely unknown. Here we show that the nuclear lamina filament Lamin B2 (Lmnb2), whose expression decreases in mice after birth, is essential for nuclear envelope breakdown prior to progression to metaphase and subsequent division. Inactivating Lmnb2 decreased metaphase progression, which led to formation of polyploid cardiomyocyte nuclei in neonatal mice, which, in turn, decreased myocardial regeneration. Increasing Lmnb2 expression promoted cardiomyocyte M-phase progression and cytokinesis, and improved indicators of myocardial regeneration in neonatal mice. Inactivating LMNB2 in human iPS cell-derived cardiomyocytes reduced karyokinesis and increased formation of polyploid nuclei. In primary cardiomyocytes from human infants with heart disease, modifying LMNB2 expression correspondingly altered metaphase progression and ploidy of daughter nuclei. In conclusion, Lmnb2 expression is essential for karyokinesis in mammalian cardiomyocytes and heart regeneration.
eTOC Blurb
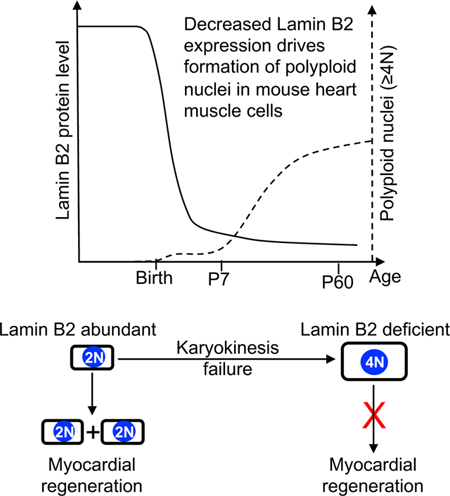
Polyploid nuclei in heart muscle cells are thought to be a barrier for heart regeneration, but how they are generated is unknown. Han et al. demonstrate that low Lamin B2 levels trigger formation of polyploid nuclei in mouse and human heart muscle cells, which decreases heart regeneration.
Graphical Abstract
INTRODUCTION
The inability of adult mammalian heart muscle cells (cardiomyocytes) to proliferate is a barrier for myocardial regeneration (Tzahor and Poss, 2017). In contrast, fetal and neonatal hearts can regenerate by cardiomyocyte proliferation (Polizzotti et al., 2015; Tzahor and Poss, 2017). The transition of cardiomyocytes from the proliferative to the non-proliferative phenotype is considered to be a critical step restricting post-natal mammalian heart regeneration, yet the mechanisms remain incompletely characterized.
Cardiomyocytes can be mono-, bi-, or multi-nucleated, and their nuclei can become polyploid. Current research in cardiomyocyte proliferation focuses on understanding the block at cell cycle entry and the mechanisms inhibiting the completion of cytokinesis (Soonpaa et al., 1996; Liu et al., 2019). However, the existence of polyploid nuclei in mono- and binucleated cardiomyocytes indicates that, besides the cell cycle blocks at entry and cytokinesis, additional cell cycle mechanisms exist that generate polyploid nuclei. This paper advances the understanding of how mouse and human cardiomyocytes form polyploid nuclei and how this relates to myocardial regeneration in neonatal mice.
Studies of various species offer clues about the relationship between nucleation, ploidy, and capacity for proliferation. It is thought that myocardial regeneration requires proliferation of mononucleated cardiomyocytes with diploid nuclei because both observations and experimental studies in various species have shown that increased polyploidy reduces heart regeneration (Gonzalez-Rosa et al., 2018; Hirose et al., 2019; Liu et al., 2019; Patterson et al., 2017). In mice, the prevalence of cardiomyocytes with polyploid nuclei increases within 3 weeks after birth (Alkass et al., 2015; Walsh et al., 2010). In humans, approximately 70% of cardiomyocytes are mononucleated, and 50% of those acquire polyploid nuclei within 10 years after birth (Bergmann et al., 2009; Bergmann et al., 2015; Mollova et al., 2013). Unlike mammals, zebrafish exhibit a very low percentage of cardiomyocytes with polyploid nuclei and consequently regenerate myocardium. Forcing the formation of polyploid nuclei and binucleated cardiomyocytes in zebrafish inhibited myocardial regeneration (Gonzalez-Rosa et al., 2018). In mice, altering troponin I3 kinase levels (Patterson et al., 2017) or thyroid hormone signaling (Hirose et al., 2019) changed the percentages of polyploid cardiomyocyte nuclei and multi-nucleated cardiomyocytes, which altered myocardial regeneration. Thus, although a higher percentage of cardiomyocytes with polyploid nuclei is associated with decreased heart regeneration in zebrafish and mice, the processes generating them are largely unknown. We set out to discover the mechanisms by which mammalian cardiomyocytes generate polyploid nuclei, examined their relationship to formation of binucleated cardiomyocytes, determined the significance for heart regeneration in mice, and demonstrated that these mechanisms are also active in human cardiomyocytes.
RESULTS
Lmnb2 is a functional cell cycle regulator in cardiomyocytes
We sought to identify genes whose expression is downregulated when cardiomyocytes form polyploid nuclei. We validated the use of genetically engineered mice expressing the Azami- Green Geminin (AG-Gem) live cell reporter in a previous publication and with new experiments (Liu et al., 2019) (Fig. 1A, Suppl. Fig. S1, Suppl. Video S1). We used AG-Gem to isolate single cycling and non-cycling cardiomyocytes at embryonic day 14.5 (E14.5), postnatal day 5 (P5), and postnatal day 19 (P19) by flow cytometry. To identify cardiomyocytes, we selected cells that expressed troponin T (Tnnt2, a cardiomyocyte marker) and were negative for PDGFRβ in order to eliminate vascular smooth muscle cells and pericytes (Armulik et al., 2011; Liu et al., 2019). We performed single cell transcriptome sequencing using the Eberwine method, which accurately represents low-abundance transcripts (Kim et al., 2011a). We achieved an average depth of 27 million uniquely aligned exonic reads per cardiomyocyte (range 8 – 60 million), allowing us to detect on average 8,500 genes per cardiomyocyte (range 6,000 – 11,000). The cardiomyocytes showed three distinct populations corresponding to the analyzed E14.5 (n = 16), P5 (n =12), and P19 (n = 9) points in development (Fig. 1B). Gene ontology analysis showed differential regulation of diverse cellular processes (Suppl. Fig. S2A). Embryonic cardiomyocytes are known to divide, whereas postnatal cardiomyocytes have an increased propensity for karyokinesis failure. To identify the set of genes that are associated with cardiomyocyte division, we compared cycling (Gem+) with non-cycling (Gem-) cardiomyocytes at E14.5, which identified 163 genes with at least two-fold abundance changes (false discovery rate ≤ 10%, Fig. 1C, Suppl. Tab. S1). Functional classification of these 163 genes showed that 52% were known to be associated with the cell cycle (Fig. 1D). Of these, 57% were involved in regulating G2/M-phase and cytokinesis. To identify genes whose decreased expression correlates with karyokinesis failure, we selected genes that were consistently expressed in cycling E14.5, but not in P19 cardiomyocytes (Fig. 1E). Because karyokinesis involves changes of the nuclear membranes, we filtered these genes for known membrane association, which resulted in 11 candidates that were previously not associated with the cell cycle. To assess the functional relevance of these candidate genes, we expressed their cDNA in neonatal mouse cardiomyocytes and determined cell cycle activity using the AG-Gem reporter. Because Lmnb2 induced the highest increase of cycling cardiomyocytes (Fig. 1F, G, p < 0.01), we proceeded with mechanistic studies on this gene. We first examined the Lmnb2 mRNA expression in cardiomyocytes with real-time PCR. Consistent with single-cell transcriptome analysis, the abundance of Lmnb2 mRNA in fetal (E18.5) and neonatal cardiomyocytes (P0 and P4) was decreased 14 days after birth (Fig. 1H). In agreement with Lmnb2 mRNA expression, Western blotting of cardiomyocyte lysate showed that Lamin B2 protein levels decreased after birth, reaching a minimum 14 days after birth without a further significant decrease between P14 and P60 (Fig. 1I, Suppl. Fig. S2B). In conclusion, these results show that Lmnb2 expression declines during cardiomyocyte terminal differentiation and suggest an unexpected function in the cell cycle (Butin-Israeli et al., 2012; Ho and Lammerding, 2012).
Figure 1. Reporter-directed single cell transcriptional analysis indicates Lmnb2 as a functional cell cycle regulator in cardiomyocytes.

(A) The live cell cycle reporter consisting of a fusion construct of monomeric Azami Green (mAG) and 1–110 amino acids of human Geminin (hGem) is expressed as transgene under the control of cytomegalovirus-β-actin (CAG) promoter and identifies S/G2/M cells. See also Figure S1 and Video S1 for validation. (B) tSNE profile of developmental ages E14.5, P5, and P19 shows that cycling and non-cycling cardiomyocytes of the same developmental age cluster together. n=37 cardiomyocytes analyzed. See also Figure S2C–D. (C) Single-cell transcriptional analysis reveals 163 differentially expressed genes between cycling (Gem+, green) and non-cycling (Gem-, black) embryonic (E14.5) cardiomyocytes. See Table S1 for list of differentially expressed genes. (D) Classification of 163 differentially expressed genes shows that more than 52% genes were known to be associated with cell cycle. See also Figure S2A for gene ontology analysis. (E) Eleven candidate genes show high expression in cycling embryonic cardiomyocytes. Red arrow indicates Lmnb2. (F) Adenoviral transduction with candidate gene cDNA shows that Lmnb2 induces the highest fold increase of Gem+ neonatal mouse cardiomyocytes. Mean ± SEM of six independent experiments shown. (G) Workflow from single-cell gene discovery via functional characterization to prioritizing Lmnb2. (H) Lmnb2 mRNA expression in cardiomyocytes decreased after P4. Real- time PCR quantified Lmnb2 mRNA, normalized to ACTB, and graphed as percent of E18.5. n=3 hearts per timepoint. (I) Western blot shows decreased Lamin B2 protein level in cardiomyocytes after P4 (15 μg lysate from isolated cardiomyocytes per lane). Quantification of Lamin B2 protein normalized to GAPDH and graphed as percent of E18.5. n=3 hearts per time point. Lines (H, I) generated by fitting with variable slope Sigmoidal. See also Figure S2B for Western blot result. (J) Lmnb2 mRNA was decreased by 56% 48 hours after addition of 10 nM siRNA in fetal cardiomyocytes. (K, L) Lmnb2 knockdown with siRNA decreased H3P-positive fetal cardiomyocytes (K) and total number of cardiomyocytes (L). (M-O) Adenoviral transduction of Lmnb2 in neonatal cardiomyocytes stimulated M-phase of cell cycle, quantified by H3P staining (M), cytokinesis, quantification by Aurora B kinase (N), and proliferation, quantified by cell numbers (O). See also Video S2. Scale bars 50 μm (K, M), 10 μm (N). Statistical significance tested with two-tailed Student’s t-test (J, K, L, M, N, O), and one-way ANOVA followed by Bonferroni’s multiple comparison test (F). Error bars represent mean ± SEM.
Lamins are type V intermediate filament proteins that constitute the nuclear lamina (Dechat et al., 2008). In light of the unique expression profile of Lmnb2, we examined the expression of the other lamin genes in our single cell transcriptome profiles (Suppl. Fig. S2C–D). Embryonic (E14.5) cardiomyocytes expressed both Lmnb1 and Lmnb2, but only Lmnb2 was uniquely expressed in the cell cycle. Lmna was expressed at P19, which is consistent with previous findings of Lamin A/C protein expression and function in differentiated cardiomyocytes (Rober et al., 1989; Stewart and Burke, 1987). This indicates that Lmnb2 could have functions distinct from those of other lamins in cardiomyocytes, and its decreased expression may be significant for karyokinesis failure.
To determine whether Lmnb2 is required for cardiomyocyte proliferation, we used siRNA knockdown. Lmnb2 siRNA decreased Lmnb2 mRNA expression in cultured fetal cardiomyocytes by 56% (Fig. 1J). This decreased the percentage of fetal cardiomyocytes in M- phase, as visualized with phospho-histone H3-staining (H3P, 1.1 ± 0.1% to 0.4 ± 0.1%, p = 0.001, Fig. 1K), leading to a 15% decrease in the number of cardiomyocytes (Fig. 1L). We next asked whether increasing Lmnb2 would be sufficient to drive cardiomyocyte proliferation. We used adenoviral gene transfer to express Lmnb2 in cultured neonatal mouse cardiomyocytes. Neonatal (P1) mouse cardiomyocytes transduced with Ad-Lmnb2 showed significantly more (0.56 ± 0.04% to 1.97 ± 0.1%, p= 0.0004) H3P-positive cardiomyocytes compared with Ad- LacZ controls (Fig. 1M). Ad-Lmnb2 induced a significant increase of cardiomyocytes with midbodies, indicating that they progressed to cytokinesis (0.04 ± 0.01% to 0.8 ± 0.06%, p = 0.04, Fig. 1N). We used live cell imaging to examine Lmnb2-induced cardiomyocyte divisions. To this end, we applied a cell cycle reporter in which a fluorescent mCherry-hGeminin cassette was conditionally expressed after resection of a loxP-stop-loxP cassette with Tnnt2-Cre(Jiao et al., 2003). Of all neonatal cardiomyocytes (P1) that entered the cell cycle, Ad-Lmnb2-transduced cardiomyocytes showed a 7-fold increase in complete cell divisions (32%, n= 64 cells) compared with LacZ control (4.5%, n= 67 cells, p <0.0001, Fischer’s exact test, Suppl. Video S2), resulting in an increased cardiomyocyte number (Fig. 1O). Collectively, these results show that Lmnb2 is required for cardiomyocyte proliferation, and its overexpression increases proliferation of cultured neonatal cardiomyocytes.
αMHC-Cre-induced Lmnb2 KO inhibits prometaphase to metaphase transition
We next determined cardiomyocyte cell cycle activity after Lmnb2 gene inactivation in vivo. We generated cardiomyocyte-specific Lmnb2 knockout mice by crossing Lmnb2flox/flox with αMHC- Cre mice(Coffinier et al., 2011). Western blot showed 43.5% reduction of Lamin B2 protein in αMHC-Cre, Lmnb2flox/flox at E18.5 and 77.4% at P5 (Fig. 2A, B). Immunofluorescence microscopy showed that 80.5% of cardiomyocytes in Lmnb2 KO had Lamin B2 protein levels less than 1 standard deviation below the mean of control at P2 (Fig. 2C). Lamin B1 and Lamin A/C localization and amount in the nuclear lamina were not altered by Lmnb2 gene inactivation (Suppl. Fig. S2E). Consistent with a previous report, Lmnb2 KO cardiomyocytes did not show micronuclei (Dechat et al., 2008) (Fig. 2C, Suppl. Fig. S2E). We examined DNA synthesis by labeling BrdU incorporation in P2 pups. Lmnb2 KO did not alter DNA synthesis in cardiomyocytes in vivo (Fig. 2D). However, analysis of H3P staining showed a decrease of M- phase activity in Lmnb2 KO cardiomyocytes at P2 (36.9 ± 3.7 to 16.8 ± 1.3 mm-2, p<0.0001, Fig. 2E), suggesting a function for Lmnb2 in M-phase. To define Lmnb2 function in the progression of mitosis, we quantified the prevalence of different sub-phases, which we characterized based on distinct morphology of chromatin and H3P staining, on sections of P2 hearts (Fig. 2F, Suppl. Fig. S3A). The percentages of metaphase and anaphase decreased, while the percentage of prometaphase increased in Lmnb2 KO cardiomyocytes (Fig. 2F). Western blotting showed a decrease of Cyclin B1 protein and Cyclin B1 phosphorylation levels, indicative of decreased Cyclin B1 activation, which is consistent with decreased M-phase progression (Fig. 2G, Suppl. Fig. S3B). In conclusion, Lmnb2 KO reduces the progression from prometaphase to metaphase.
Figure 2. Lmnb2 is required for prometaphase-to-metaphase transition.

Experiments were performed in αMHC-cre, Lmnb2f/f (Lmnb2 KO) and αMHC-cre, Lmnb2wt/wt (Control) mice. (A–B) Western blot (15 μ g lysate from isolated cardiomyocytes per lane) shows reduced Lamin B2 protein after birth. Lamin B2 protein normalized to GAPDH of corresponding controls. Three pups per group. (C) Quantification showed that Lamin B2 intensity decreased in Lmnb2 KO cardiomyocytes at P2. Scale bar 10 μm. Error bars represent mean ± SD. (D–E) Immunofluorescence microscopy analysis of BrdU-uptake shows that Lmnb2 KO does not alter S-phase (D), but decreases M-phase in P2 cardiomyocytes in vivo (E). n=3 hearts per group, 3–4 sections from each heart analyzed with composite images. Scale bar 200 μm for whole heart images, 10 μm for orthogonal reconstituted images. (F) Analysis of mitotic sub-phases shows significant decrease of metaphase in P2 Lmnb2 KO heart sections. n=613 for WT and n=320 for Lmnb2 KO mitotic cardiomyocytes counted from four hearts (10 sections) per group. Scale bar 5 μm. See also Figure S3A for field and volume views. (G) Western blot shows decreased cyclin B1 and cyclin B1 phosphorylation in Lmnb2 KO cardiomyocytes, indicating decreased M-phase activity. n=7 hearts per group. See also Figure S3B for additional Western blot results. Statistical significance tested with unpaired t-test (B, C, D, E, G) and two-way ANOVA followed by Bonferroni’s multiple comparison test (F). Error bars represent mean ± SEM.
αMHC-Cre-induced Lmnb2 KO prevents nuclear envelope removal and microtubule attachment to centromeres
A critical event in M-phase is spindle formation, which involves nuclear envelope breakdown (NEB). In prometaphase, spindle microtubules tear the nuclear envelope and lamina to give full access for capturing and aligning chromosomes in the metaphase plate (Beaudouin et al., 2002; Georgatos et al., 1997; Salina et al., 2002; Tanenbaum and Medema, 2010). We assessed NEB by examining the localization of lamina-associated protein 2 (LAP2), a commonly used protein marker of the inner nuclear membrane (INM) (Beaudouin et al., 2002; Foisner and Gerace, 1993; Furukawa and Kondo, 1998; Salina et al., 2002). LAP2 was highly colocalized with DNA in both control and Lmnb2 KO cardiomyocytes during interphase (Fig. 3A). As cardiomyocytes proceed to prometaphase, condensed chromosomes exhibited a classical toroidal arrangement (Fig. 3B)(Magidson et al., 2011). Control cardiomyocytes showed significantly reduced colocalization of LAP2 and DNA, indicating removal of the NE (Fig. 3B). In contrast, Lmnb2 KO cardiomyocytes had significantly higher LAP2/DNA colocalization, indicating incomplete NEB (Fig. 3B).
Figure 3. αMHC-Cre-induced Lmnb2 KO reduces nuclear envelope breakdown and microtubule attachment to centromeres.

Experiments were performed in αMHC-cre, Lmnb2f/f (Lmnb2 KO) and αMHC-cre, Lmnb2wt/wt (Control) mice. (A, B) Assessment of nuclear envelope breakdown (NEB) by analysis of LAP2 localization. In interphase, Lmnb2 KO cardiomyocytes have the same LAP2 localization around chromosomes as control (A). In prometaphase (B, indicated by characteristic toroidal arrangement of chromosomes, Lmnb2 KO cardiomyocytes show higher LAP2 protein colocalization with DNA, indicating decreased NEB. Distance between DNA and LAP2 indicated by gap between interrupted lines shows region of NEB in control cardiomyocytes. Colocalization quantified by Pearson’s correlation between LAP2 and DAPI intensities on z-stack images. Lmnb2 KO: n=19; WT: n=25, three experiments. Scale bar 5 μm. (C-E) Lmnb2 KO cardiomyocytes isolated from E18.5 pups show mitotic spindles with altered structure (C), decreased microtubules (D, determined by digital thresholding and quantification of α-tubulin intensity), with bipolar spindle poles (E). n=90 mitotic cardiomyocytes per group, three experiments. Scale bar 5 μm. (F, G) Assessment of localization and intensity of the chromosomal passenger protein Aurora B kinase shows that Lmnb2 KO cardiomyocytes have decreased centromere engagement by microtubules in prometaphase (F) and metaphase (G). Confocal z-stacks were reconstructed to show maximum intensity projections along the spindle axis. Scale bars for maximum intensity projections 5 μm (F) and 20μm (G). The same confocal stacks were reconstructed in magnified volume views (scale bars 2μm) with 45° angles between the spindle axis and the image plane. Volume views were used for digital thresholding and quantification of Aurora B kinase protein at centromeres. Volume views in G correspond to Videos S3, n=14 cardiomyocytes for each condition in F; n=10, 11 cardiomyocytes for WT and Lmnb2 KO in G, three independent experiments. Significance tested with unpaired t-test. Error bars represent mean ± SEM.
We next examined how Lmnb2 KO affects mitotic spindle structure (Fig. 3C). Lmnb2 KO cardiomyocytes showed a larger percentage of abnormal spindles with lower α-tubulin intensity (Fig. 3C, D). Nevertheless, the majority of M-phase Lmnb2 KO cardiomyocytes had bipolar spindles (Fig. 3E), suggesting that the observed spindle changes did not involve the spindle poles. Based on these observations, we hypothesized that the NEB defects in Lmnb2 KO cardiomyocytes may prevent spindle microtubule attachment to centromeres. To test this, we visualized Aurora B kinase, a chromosomal passenger protein located at properly attached centromeres during metaphase(Ditchfield et al., 2003; Hauf et al., 2003). Decreased Aurora B kinase at centromeres indicates failure of proper microtubule attachment to chromosomes(Ditchfield et al., 2003; Hauf et al., 2003). Our results showed that Lmnb2 KO cardiomyocytes had decreased Aurora B kinase localization at centromeres in both prometaphase (Fig. 3F) and metaphase (Fig. 3G, Suppl. Video 3), indicating decreased microtubule attachment to centromeres(Wei et al., 1999). The decreased Aurora B kinase signal is consistent with decreased H3P (Fig. 2E), since Aurora B kinase phosphorylates histone-H3 on serine 10 during mitosis(Hsu et al., 2000). Together, these results demonstrate that cardiomyocytes require Lmnb2 expression for metaphase progression.
Lmnb2 gene inactivation increases ploidy of cardiomyocyte nuclei in vivo
We predicted that the decreased metaphase progression in Lmnb2 KO cardiomyocytes would increase the DNA content of the daughter nuclei, i.e., would lead to polyploidy. We determined ploidy with confocal microscopy of heart sections, which enabled quantification of DNA content in individual cardiomyocyte nuclei (Fig. 4A). Taking non-cardiomyocytes as reference for 2N nuclei, Lmnb2 KO cardiomyocyte nuclei showed a 60% increase in the mean ploidy at P60 (Fig. 4B), supporting the conclusion that decreased metaphase progression in Lmnb2 KO cardiomyocytes increased ploidy. To understand how and when Lmnb2 KO changed ploidy in the mono- and binucleated cardiomyocyte populations separately, we determined ploidy in isolated cardiomyocytes at P7. We used imaging flow cytometry (Amnis ImageStream, Luminex), which combines the advantages of traditional flow cytometry and microscopy (Fig. 4C, D, E, F). Lmnb2 KO P7 cardiomyocytes showed a doubling of 4N nuclei in mono- and binucleated cardiomyocytes, indicating that Lmnb2 gene inactivation reduced karyokinesis, and thereby increased ploidy (Fig. 4D). In αMHC-Cre control mice, the proportion of polyploid cardiomyocyte nuclei increased from P7 to P60, consistent with published findings (Fig. 4D,F) (Alkass et al., 2015; Soonpaa et al., 1996; Walsh et al., 2010). At P60, Lmnb2 KO mice exhibited 53.4% polyploid (4N and >4N) mononucleated cardiomyocytes, a 1.5-fold increase, and 57.6% polyploid binucleated cardiomyocytes, a 2.2-fold increase (Fig. 4F). These results show that karyokinesis failure caused by Lmnb2 inactivation with αMHC-Cre induced a more pronounced polyploidization of nuclei in binucleated than mononucleated cardiomyocytes in vivo. We quantified the percentage of binucleated cardiomyocytes in Lmnb2 KO and found it was unchanged at both P5 (Fig. 4G) and P60 (Fig. 4H), supporting the conclusion that Lmnb2 inactivation has a specific function in M-phase and not in cytokinesis. The appropriate formation of binucleated cardiomyocytes in Lmnb2 KO also indicates that the increase of karyokinesis failure did not occur in a sufficiently large percentage of cardiomyocytes to prevent progression to cytokinesis failure and formation of binucleated daughter cardiomyocytes.
Figure 4. αMHC-Cre-induced Lmnb2 gene inactivation increases ploidy of cardiomyocyte nuclei in vivo.

αMHC-cre, Lmnb2f/f (Lmnb2 KO) and αMHC-cre (Control) mice were analyzed. (A–B) Confocal microscopy of sectioned Lmnb2 KO hearts shows increased ploidy of cardiomyocyte nuclei at P60. Ploidy was normalized with reference cells (non-cardiomyocytes) in the same heart. White boxes indicate diploid and polyploid cardiomyocytes (CM); yellow box indicates CD31 positive endothelial cell (EC) and correspond to high-resolution volume views on the right. n=5 hearts per group. WT: 853 cells; Lmnb2 KO: 809 cells. (C–F) Example photomicrographs of isolated cardiomyocytes from Lmnb2 KO pups and quantification of ploidy with Imagestream at P7 (C, D) and P60 (E, F). Lmnb2 KO have increased ploidy at P7 (D, n = 5 hearts per group) and P60 (F, n = 5 hearts per group). (G–H) Lmnb2 KO does not alter the percentage of mono- and binucleated cardiomyocytes at P5 (G) and P60 (H). n = 6 hearts per group at P5. n = 6 hearts per group at P60. Scale bars 20 μm (A), 20 μm (C, E). Statistical significance tested by Student’s t-test (B), and two-way ANOVA followed by Sidak’s multiple comparisons test (D–H). Error bars represent mean ± SEM.
Mice were reported to form binucleated cardiomyocytes before polyploid nuclei (Alkass et al., 2015). We asked what would happen if we increased nuclear ploidy before formation of binucleated cardiomyocytes. To this end, we inactivated the Lmnb2 gene using Tnnt2-Cre(Jiao et al., 2003), which induced a 94% reduction of Lamin B2 protein levels at P0 (Fig. 5A), lower at an earlier point than gene inactivation with αMHC-Cre (Fig. 2B). Immunofluorescence microscopy showed that 98.8% of Tnnt2-Cre; Lmnb2f/f cardiomyocyte nuclei had Lamin B2 protein levels lower than 1 SD below the average of control cardiomyocyte nuclei (Fig. 5B). There was no compensatory change of protein levels of the other nuclear lamina Lamin B1 and A/C (Suppl. Fig. S3C). Control mice increased polyploid nuclei in mononucleated cardiomyocytes 2.6-fold between P1 and P7 and 3.9-fold between P7 and P60 (Fig. 5C–J). Compared to P1 Tnnt2-Cre wildtype pups, Tnnt2-Cre; Lmnb2f/f showed a 3.4-fold increase of polyploid mononucleated cardiomyocytes (4N) to 8.5% (Fig. 5C, D, I). At P7, Tnnt2-Cre; Lmnb2f/f induced an increase of the percentage of polyploid (4N and >4N) mononucleated cardiomyocytes from 6.5% to 30.3% and of the percentage of binucleated cardiomyocytes with polyploid nuclei from 4.1% to 13.6% (Fig. 5E, F, I, J). At P60, Tnnt2-Cre; Lmnb2f/f hearts exhibited 43.5% polyploid mononucleated cardiomyocytes, 1.7-fold higher than control, and 24.5% binucleated cardiomyocytes with polyploid nuclei, a 1.6-fold increase over controls (Fig. 5G, H, I, J). Tnnt2-Cre; Lmnb2f/f reduced the percentage of binucleated cardiomyocytes at P7 from 67.3% to 56.8% (Fig. 5K) and at P60 from 68.2% to 55.4% (Fig. 5L), suggesting that forcing generation of more polyploid nuclei earlier in development reduced subsequent formation of binucleated cardiomyocytes. The increase in the proportion of cardiomyocytes with two 4N nuclei corresponds to the decrease in cardiomyocytes with four 2N nuclei at P60 (Fig. 5F, H). This supports the conclusion that formation of polyploid nuclei in binucleated cardiomyocytes prevents further cell cycle entry and progression to cytokinesis failure. Because reducing Lamin B2 levels induced karyokinesis failure in mononucleated cardiomyocytes, we conclude that karyokinesis failure does not require prior cytokinesis failure.
Figure 5. Tnnt2-Cre-induced Lmnb2 gene inactivation increases ploidy of nuclei and decreases formation of binucleated cardiomyocytes in vivo.

Tnnt2-cre, Lmnb2f/f (Lmnb2 KO) and Tnnt2-cre (Control) mice were analyzed. (A) Western blot shows that Tnnt2-Cre-induced Lmnb2 KO reduces Lamin B2 protein at P0. Fifteen μ g lysate from one heart loaded per lane and normalized against GAPDH. See also Figure S2E for Lamin B1 and Lamin A/C protein level. (B) Isolated cardiomyocytes exhibited Lamin B2 protein reduction in the majority of Tnnt2-Cre, Lmnb2 KO cardiomyocytes at P0. Scale bar 10 μm. Horizontal red lines represent mean ± SD. (C-J) Example photomicrographs of isolated cardiomyocytes and quantification of ploidy with ImageStream show increased ploidy in Lmnb2 KO cardiomyocyte nuclei at P1 (C-D, scale bar 10 μm, n = 7 hearts for WT, and n=5 for KO), P7 (E-F, scale bar 10 μm, n = 3 hearts per group), and P60 (G-H, scale bar 10 μm, n=3 hearts per group). (I, J) Summary of percentages of polyploid nuclei in mono- (I) and binucleated (J) cardiomyocytes shown in (Figure 5D, F, H). (K, L) Lmnb2 KO decreases the percentage of binucleated cardiomyocytes at P7 (K) and P60 (L). Control n=6, KO n=4. Statistical significance tested with Student’s t-test (A, B) and two- way ANOVA followed by Sidak’s multiple comparisons test (D, F, H, K, L). Error bars represent mean ± SEM.
Lmnb2 gene inactivation decreases myocardial regeneration in neonatal mice
An increased proportion of polyploid cardiomyocyte nuclei was reported to be associated with decreased heart regeneration after injury(Gonzalez-Rosa et al., 2018). Accordingly, we determined cardiomyocyte ploidy changes in neonatal mice, which were reported to regenerate myocardium, using an injury model that does not regenerate, i.e., neonatal cryoinjury(Polizzotti et al., 2015). We induced cryoinjury in pups 24 hours after birth and examined ploidy at 7 days post injury (dpi) by microscopy (Fig. 6A). Both injury and border zones showed a 2-fold increase in the mean ploidy of cardiomyocyte nuclei (Fig. 6B). Expression of Lamin B2 protein was decreased in both injury and border zones, but not in the remote zone (Fig. 6C), matching the area of increased ploidy. These findings indicate that myocardial injury increases formation of polyploid cardiomyocyte nuclei and decreases Lamin B2 protein levels. We hypothesized that Lmnb2 gene inactivation may compromise heart regeneration in neonatal mice. We performed an experiment in which we induced cryoinjury in Tnnt2-Cre; Lmnb2flox mice and injected recombinant NRG1, which induces cardiomyocyte proliferation in mice (Polizzotti et al., 2015) and is a heart regeneration gene in zebrafish (Gemberling et al., 2015) (Fig. 6D). We predicted that Tnnt2-Cre; Lmnb2flox/flox mice would show lower NRG1-stimulated cardiomyocyte cell cycle activity because they have a higher degree of polyploidization. Tnnt2-Cre; Lmnb2f/f pups exhibited a 2.3-fold decrease in phosphorylated histone H3-positive (H3P+) cardiomyocytes in the injury border zone, indicating decreased M-phase activity (Fig. 6E). Cardiac MRI showed lower ejection fraction (Fig. 6F, G, Suppl. Video S4) and increased hypokinetic myocardium in Tnnt2-Cre; Lmnb2f/f hearts 9 days following neonatal cryoinjury (Fig. 6H). By using late gadolinium enhancement MRI, we quantified the scar tissue, which was significantly larger in Lmnb2 KO hearts (Fig. 6F, I). We further validated scar formation with histological sections and found an increased scar size in Lmnb2 KO hearts (Fig. 6J, Suppl. Fig. S4A–B).
Figure 6. Cryoinjury increases ploidy of cardiomyocyte nuclei, decreases Lamin B2 protein in vivo, and Lmnb2 gene inactivation reduces myocardial regeneration in neonatal mice.

(A) Experimental design with cryoinjury at P1. (B) Ploidy of cardiomyocyte nuclei was increased in border and injury zone at 7 dpi. Composite image depicting the entire heart in cross-section shown on the left. Areas corresponding to the injury and border zones indicated by squares and shown on the right. n = 4 hearts per group. Sham 1,311; border 684; and injury 208 cardiomyocytes analyzed. (C) Western blot at 3 dpi shows decreased Lamin B2 protein levels in injury and border zones. (D) Design of experiment in Tnnt2-cre, Lmnb2fl/fl pups with cryoinjury at P1. (E) Lmnb2 KO hearts show decreased H3P+ cardiomyocytes in injury border zone at 9 dpi. Orthogonal reconstruction indicated H3P+ cardiomyocyte with yellow arrowheads. n=6 pups per group. (F–I) Cardiac MRI shows decreased ejection fraction (EF) in Lmnb2 KO mice at 9 dpi (F). Slices taken at the same distance from apex are shown, LV and RV indicated (F). Late Gadolinium enhancement (LGE) reveals scar indicated by arrows (F). Quantification of EF (G, see also Video S4). Myocardial ventricular wall motion examined by quantification of hypokinetic myocardial volume with cMRI (H). Scar area quantified by LGE cMRI (I, n=16 hearts per group). (J) Lmnb2 KO increases scar size as visualized by AFOG staining at 9 dpi (n=9 hearts per group). See also Figure S4 for additional example. Statistical significance tested with Student’s t-test (E, G, H, I, J) and one-way ANOVA analysis followed by Bonferroni’s multiple comparison test (B). ns, not significant. Error bars represent mean ± SEM. Scale bars 100 μm; 10 μm for magnifications (B), 100 μm for orthogonal reconstructions (E), 500 μm (J). dpi, days post injury.
Increasing Lmnb2 expression improves myocardial regeneration in neonatal mice
We next asked whether increasing Lmnb2 expression would improve myocardial regeneration following neonatal cryoinjury. We increased Lmnb2 expression with adenoviral gene transfer in vivo and examined cardiomyocyte cell cycle progression. We injected adenovirus encoding Lmnb2 (test) or LacZ (control) to newborn pups within one day of birth (Fig. 7A). Western blot (Fig. 7B) and immunofluorescence microscopy showed increased Lamin B2 protein, which was appropriately located in the nucleus (Suppl. Fig. S5A) in vivo. Quantification of H3-positive cardiomyocytes showed increased M-phase activity in Lmnb2 gene transferred mice (Fig. 7C). Lmnb2 gene transfer induced cardiomyocyte cytokinesis, which was undetectable in control mice at this age (Fig. 7D, Suppl. Video S5). Lmnb2 gene transfer did not alter the heart/body weight ratio (Fig. 7E). Next, we examined whether Lmnb2 overexpression reduced polyploidization. We measured ploidy 21 days after Lmnb2 gene transfer to newborn pups and found about 2-fold decrease of polyploid nuclei in Lmnb2 gene transferred mononucleated cardiomyocytes (9.4%) compared to GFP group (19%, Fig. 7F, G). In binucleated cardiomyocytes, Lmnb2 gene transfer reduced polyploid nuclei from 9.7% to 5.6% (Fig. 7F, G). Altogether, our results suggest that overexpression of Lmnb2 can overcome the karyokinesis failure of diploid cardiomyocytes during development. To examine the effect of Lmnb2 overexpression on heart regeneration, we followed Lmnb2 gene transfer with cryoinjury at day 1 after birth (Fig. 7H). We then examined cardiomyocyte cell cycle activity in the injury zone. Analysis of H3P+ cardiomyocytes showed a 4.8-fold increase in Ad-Lmnb2 treated mice (from 0.49 ± 0.09 H3P+ cardiomyocyte mm−2 to 2.34 ± 0.25 H3P+ cardiomyocyte mm−2, p =0.0005, Fig. 7I). The number of cardiomyocytes in cytokinesis was significantly increased in Ad-Lmnb2 treated hearts (Fig. 7J, 0.34 ± 0.06 Aurora B+ cardiomyocytes mm−2) compared to control hearts (0.06 ± 0.01, p = 0.0104). In conclusion, increasing Lmnb2 expression promoted cardiomyocyte M-phase progression to cytokinesis after myocardial injury.
Figure 7. Overexpression of Lmnb2 decreases cardiomyocyte nuclear ploidy and improves myocardial regeneration in neonatal mice.

(A–E) Experiments to assess the effect of Lmnb2 gene transfer on overcoming the decreased metaphase progression in neonatal mice in vivo. Experimental design (A). Western blot shows increased Lamin B2 protein levels in cardiomyocytes after Lmnb2 gene transfer (B). Lmnb2 overexpression in vivo increases H3P+ (C) and Aurora B+ (D) cardiomyocytes, indicating increased M-phase progression. See also Video S5. Ad-LacZ and Ad-Lmnb2 n=3 hearts each. Lmnb2 gene transfer does not alter heart/body weight ratio (E) n=4 hearts. (F) Examples of isolated cardiomyocytes from pups at P21. (G) Quantification with ImageStream shows that Lmnb2 overexpression decreases ploidy at P21. n = 6 hearts per group. (H) Experimental design of heart regeneration experiment. (I) Ad-Lmnb2 hearts show higher H3P+ cardiomyocytes in injury border zone at 9 dpi. Orthogonal reconstruction indicated with yellow arrowheads. n=4 hearts per group. (J) Ad-Lmnb2 increased cytokinesis demonstrated by Aurora B kinase staining in midbodies and quantification at 9 dpi. n=4 hearts per group. See also Figure S5 for validation of Lmnb2 overexpression. (K–L) Cardiac MRI shows increased ejection fraction in Ad-Lmnb2 mice at 34 dpi. LV and RV indicated. Slices with the same distance from apex are shown. Late Gadolinium enhancement reveals scar indicated by arrows (K). Quantification of ejection fraction (L) n=5, 8 hearts for Ad- GFP and Ad-Lmnb2. See also Video S6 for cardiac MRI. (M, N) MRI tagging (M) followed by Harmonal Phase Analysis (HARP) visualizes peak Eulerian circumferential strain (Ecc, N). White arrows indicate injury. (O) Ecc in the injury and border zones indicate significantly improved strain induced by Lmnb2 adenoviral gene transfer. See also Video S7. (P) Lmnb2 adenoviral gene transfer reduces scar size as visualized by AFOG staining at 34 dpi. Each group has n=6 hearts. See also Figure S5 for additional example of heart sections. Statistical significance tested with Student’s t-test (C, D, E, I, J, L, P) and one-way ANOVA analysis followed by Bonferroni’s multiple comparison test (G, O). ns, not significant. Error bars represent mean ± SEM. Scale bars 10 μm for orthogonal reconstructed images (C, D, I, J), 5 μm (F), 500 μm (P). Ad- Adenovirus and dpi, days post injury.
Cardiac MRI (cMRI) showed that Lmnb2 gene transfer improved the heart function after neonatal cryoinjury, quantified as ejection fraction, at 34 dpi (50.7 ± 5.1 to 67 ± 4.1, Fig. 7K, L). To examine the relationship between the Lmnb2-induced increase in cardiomyocyte proliferation in the border zone and myocardial function, we performed MRI tagging, which enables measuring local myocardial contraction (Eulerian circumferential strain, Ecc (Zerhouni, 1993)) in the border zone. We identified the border zone by locating the scar with late gadolinium enhancement (indicated with white arrows, Fig. 7K, Suppl. Video S6). Harmonic Phase Strain Analysis (HARP) of the MRI tagging results (Fig. 7M, Suppl. Video S7) yielded peak Eulerian circumferential strain (Ecc), which we displayed as a heat map (Fig. 7N). Ecc in the border zone immediately adjacent to the scar (Fig. 7N) was significantly higher in Ad-Lmnb2 treated mice, indicating improved local contractility (Fig. 7O). To compare myocardial function in the border with the remote zone, we examined strain values in the entire cross-section. Ad-Lmnb2 treated mice showed improved peak strain in the injury and border zone, but not in the remote zone (Fig. 7O). Thus, increasing Lmnb2 expression improved myocardial function in the region corresponding to the region of increased cardiomyocyte proliferation. We next quantified scar formation on histological sections at 70 dpi and found a small but significant decrease of the scar size (Fig. 7P, Suppl. Fig. S5B–C). In summary, the increased cardiomyocyte M-phase activity and cytokinesis and the structural and functional improvements in the border zone support the conclusion that increasing Lmnb2 expression promotes myocardial regeneration.
The abundance of Lmnb2 protein regulates karyokinesis failure and ploidy in human and zebrafish cardiomyocytes
We examined the connection between Lamin B2 protein expression, karyokinesis failure, and ploidy of cardiomyocyte nuclei in other species. Formation of polyploid nuclei is more prominent in human than in mouse cardiomyocytes(Bergmann et al., 2015; Mollova et al., 2013). Consequently, we examined the cellular mechanisms of Lamin B2 function in human cardiomyocytes. To this end, we generated a CRISPR-Cas9 mediated LMNB2 knockout in human induced pluripotent stem cells (hiPSCs, Suppl. Fig. S6A–F). The cardiomyocyte specification efficiency of wildtype, Cas9 control, and two LMNB2 knockout clones was similar, indicating that LMNB2 is not required for cardiomyocyte specification (Suppl. Fig. S7A–B). This result is consistent with the report that Lmnb2 knockout mice develop all organs and are viable to birth (Coffinier et al., 2011; Kim et al., 2011b). Analysis of H3P showed a decrease in LMNB2−/− hiPSC-cardiomyocytes (Fig. 8A). To enrich for metaphase, we utilized a Nocodazole block (Suppl. Fig. S7C). Compared to the Cas9 control, LMNB2−/− hiPSC- cardiomyocytes (hiPSC-CMs) showed increased spindle defects (31.2% vs. 5.6%, p=0.02, Fig. 8B, Suppl. Fig. S7D) and markedly decreased Aurora-B kinase localization at centromeres, indicating decreased spindle microtubule binding to centromeres (Fig. 8C, Suppl. Fig. S7E). These results are consistent with the findings from Lmnb2 gene inactivation in mice and indicate a function of human LMNB2 in metaphase progression. To understand LMNB2 function on polyploidization in human iPSC-CMs, we quantified polyploid nuclei in EdU-labeled cardiomyocytes (Suppl. Fig. S7A). LMNB2−/− hiPSC-CMs formed more polyploid nuclei than control (from 3.8% to 9.1%, Fig. 8D, Suppl. Fig. S7F). Adenoviral Lmnb2 transduction in hiPSC-CMs decreased the formation of polyploid nuclei in cardiomyocytes from 3.8% to 0.9% (Fig. 8D, Suppl. Fig. S7G). The low percentage of polyploidy in iPSC-CMs may be due to the short culture time and the immature characteristic of iPSC-CMs. These results agree with the mouse in vivo observation (Fig. 4C–F, 5C–H), indicating similar function of Lamin B2 in cardiomyocyte polyploidization. We noted that LMNB2 KO hiPSC-CMs accumulated the cytokinesis protein anillin in the cytoplasm during metaphase (Suppl. Fig. S7H). In contrast with control, LMNB2 KO hiPSC-CM did proceed to telophase but could not translocate anillin to the cleavage furrow (Suppl. Fig. S7I).
Figure 8. Altering LMNB2 gene expression in human iPSC-derived and primary cardiomyocytes changes ploidy; zebrafish expresses high level of lamin B2 in adult cardiomyocytes,
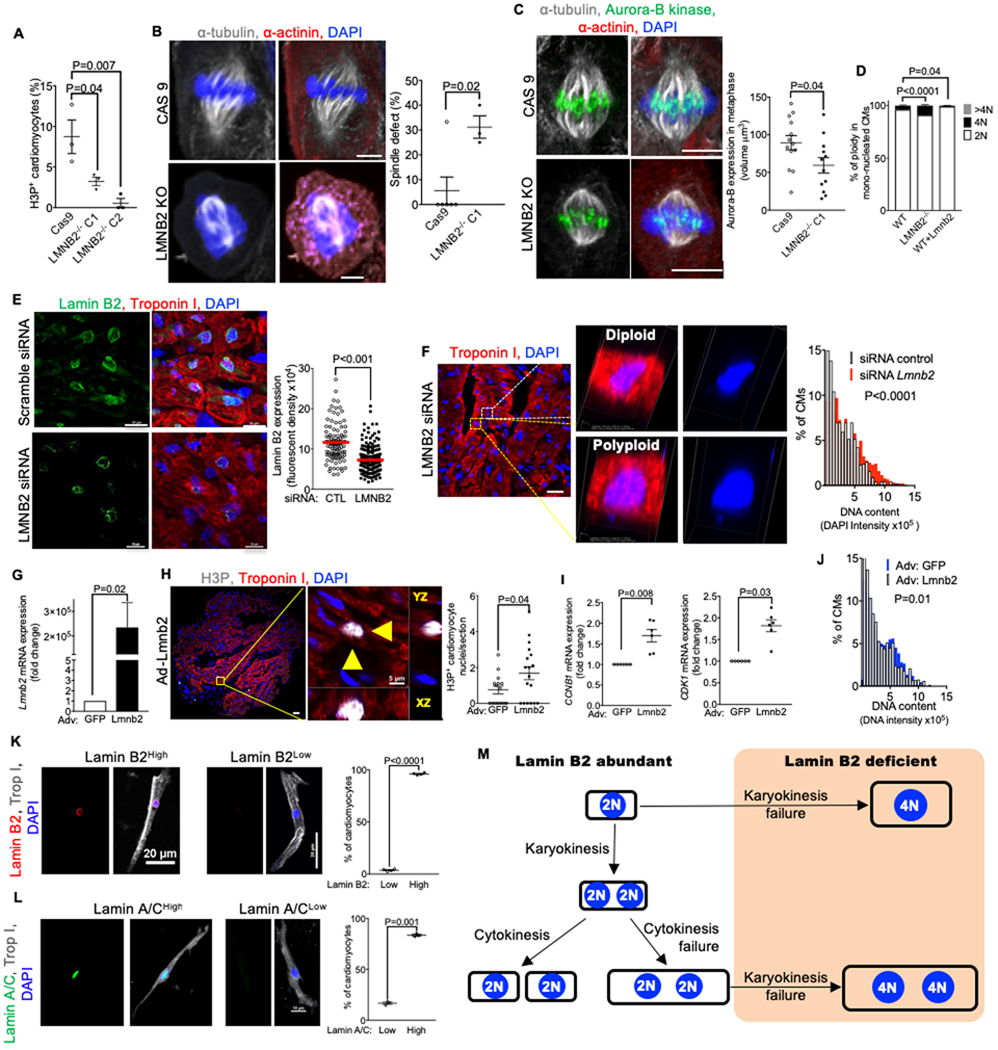
(A–D) Related to Fig. S6. The LMNB2 gene was inactivated in hiPSCs using CRISPR-Cas9 (LMNB2 KO); control is hiPSCs transfected with Cas9 without specific guide RNA (Cas9). (A) LMNB2 gene inactivation decreases H3P+ hiPSC-CMs. (B) LMNB2 KO hiPSC-CMs have disorganized spindles. Cas9 control: 25 cells; LMNB2 KO: 20 cells from 6 experiments. (C) Expression of Aurora B kinase, a chromosomal passenger protein, is decreased on centromeres in LMNB2 KO hiPSC-CMs indicating decreased microtubule attachment in metaphase. Cas9 control: n=13 cells; LMNB2 KO: n=12 cells. (D) LMNB2 gene inactivation increases and overexpression of Lmnb2 decreases nuclear ploidy in hiPSC-CMs. (E) Patient myocardium treated with LMNB2 siRNA shows decreased Lamin B2 protein expression. (F) Immunofluorescent microscopy of tissue section and volume view images of diploid and polyploid cardiomyocytes shows that LMNB2 knockdown by siRNA increases DNA content. (G) Adenoviral-induced LMNB2 overexpression in patient myocardium was confirmed by RT-PCR. Adv-GFP is used as control for normalization. (H) LMNB2 overexpression in organotypic myocardial cultures from patients increases H3P+ cardiomyocytes. n=4 hearts, 4–5 sections per heart. (I) LMNB2 overexpression in patient myocardium shows increased expression of cell cycle genes CCNB1 and CDK1, indicating M-phase progression. n=6 hearts (J) Adenoviral- induced LMNB2 overexpression in patient myocardium decreases DNA content. (K, L) Isolated adult zebrafish cardiomyocytes show high prevalence of Lamin B2High (K, n = 1,000 cardiomyocytes per group, n=4 hearts) and Lamin A/CHigh cardiomyocytes (L, 1,000 cardiomyocytes per group, n=4 hearts). (M) Diagram relating Lamin B2 abundance to formation of polyploid nuclei. Statistical significance tested with Student’s t-test (A-C, E-L), one-way ANOVA analysis followed by Bonferroni’s multiple comparison test (D). Error bars represent mean ± SEM. Scale bars 5 μm (B, H right panel), 20 μm (C, F left panel, K), 10 μm (E, L), 100 μm (H, left).
We asked whether LMNB2 could regulate polyploidization and proliferation in organotypic cultures of myocardium from human infants. We decreased LMNB2 with siRNA knockdown, which lowered Lamin B2 protein (Fig. 8E) and increased DNA content in cardiomyocyte nuclei (Fig. 8F). Ad-Lmnb2 gene transfer in human heart tissue induced Lmnb2 gene overexpression, resulting in a 2.3-fold increase of H3P+ cardiomyocytes (Fig. 8G, H). Ad- Lmnb2 increased the expression of M-phase markers CDK1 and CCNB1 (Fig. 8I) and decreased polyploid nuclei in cardiomyocytes (Fig. 8J). These results indicate that Lamin B2 levels determine M-phase progression and subsequently affect polyploidization in human cardiomyocytes.
Our results predict that zebrafish, which regenerates myocardium on the basis of proliferation of mononucleated cardiomyocytes with diploid nuclei, should have more cardiomyocytes with high expression of Lmnb2 (Wills et al., 2008). Indeed, we found that nearly all zebrafish cardiomyocyte nuclei expressed high levels of Lamin B2 and Lamin A/C levels (Fig. 8K–L).
DISCUSSION
We have identified downregulation of Lmnb2 gene expression as a critical event for generation of polyploid cardiomyocyte nuclei during heart growth and after myocardial injury in neonatal mice. Low protein levels of Lamin B2 reduce NEB, which creates a barrier for prometa- to metaphase progression. This results in karyokinesis failure and polyploid daughter nuclei. We have experimentally decreased Lamin B2 expression levels, which decreased cardiomyocyte cell cycle activity and decreased regenerative activity. Conversely, increasing Lamin B2 expression improved myocardial regeneration.
This mechanistic insight helps to separate the mechanisms forming polyploid nuclei from those forming binucleated cardiomyocytes (Fig. 8M). While formation of binucleated cardiomyocytes involves cytokinesis failure, polyploid nuclei are formed by karyokinesis failure. Both processes occur independently. However, our results also show that increased formation of polyploid nuclei decreases cell cycle re-entry potential, which prohibits formation of bi- and multinucleated cardiomyocytes. As such, our results identify polyploid nuclei as an important feature of terminally differentiated mammalian cardiomyocytes, which characteristically do not enter the cell cycle. This conclusion is consistent with work demonstrating that a decreased prevalence of mononucleated diploid cardiomyocytes is associated with decreased cell cycle potential and heart regeneration (Patterson et al., 2017). The detailed mechanisms enforcing the decreased cell cycle potential of polyploid cardiomyocyte nuclei remain to be determined.
Formation of polyploid (4N) mononucleated cardiomyocytes is likely to be a significant mechanism of terminal cardiomyocyte differentiation in humans in whom 70% of cardiomyocytes are mononucleated, of which half form polyploid nuclei (Bergmann et al., 2015; Mollova et al., 2013). This notion is supported by our results demonstrating that altering Lamin B2 protein levels changes the progression beyond prometaphase and ploidy in human cardiomyocytes (Fig. 8A–J). In mice, a large percentage of binucleated cardiomyocytes has diploid nuclei, suggesting that cytokinesis failure is not sufficient for formation of polyploid nuclei(Alkass et al., 2015; Soonpaa et al., 1996). Our results show that Lmnb2 gene inactivation decreases metaphase progression in some binucleated cardiomyocytes. This also supports the conclusion that prior cytokinesis failure is not sufficient for subsequent karyokinesis failure. Increasing karyokinesis failure decreases subsequent formation of binucleated cardiomyocytes (Fig. 5K, L), supporting the conclusion that karyokinesis failure may be the last step in the process generating terminally differentiated cardiomyocytes, leading to the inability to progress in further cell cycles to cytokinesis. Together, these results suggest a model of distinct regulation of cardiomyocyte cell cycle entry, formation of binucleated cardiomyocytes, and formation of polyploid nuclei (Fig. 8M). The temporally distinct activity of these separate mechanisms could explain how different species generate different percentages of polyploid nuclei in mono- and binucleated cardiomyocytes.
Although the suggestion that formation of binucleated cardiomyocytes is associated with cell cycle withdrawal in mice and rats was originally made in 1996 (Li et al., 1996; Soonpaa et al., 1996), the underlying mechanisms have only recently begun to be addressed. Various molecular mechanisms have been proposed to be involved with regulating cardiomyocyte ploidy, including altered expression of cyclin G1, increased expression of troponin I3 kinase and a surge in thyroid hormone (Hirose et al., 2019; Liu et al., 2010; Patterson et al., 2017). However, the molecular interventions in these studies altered formation of both binucleated cardiomyocytes and polyploid nuclei, without revealing the underlying cellular mechanisms. As such, they did not separate the mechanisms that regulate cytokinesis failure from those regulating karyokinesis failure. We have recently reported that β-adrenergic receptor signaling, via repression of Ect2 gene transcription, induces cytokinesis failure in mouse and human cardiomyocytes (Liu et al., 2019). This did not alter ploidy of cardiomyocyte nuclei. The insight about decreased Lamin B2 protein levels driving karyokinesis failure allowed us to test the connection between an increased percentage of cardiomyocytes with polyploid nuclei, cell cycle activity, and myocardial regeneration. Our results clearly show that Lmnb2 gene inactivation increases karyokinesis failure, and when this happens in a sufficiently large portion of cardiomyocytes, it decreases subsequent progression to cytokinesis, resulting in a decrease of formation of binucleated cardiomyocytes (Fig. 5K, L). In conclusion, karyokinesis failure and cytokinesis failure are controlled by different molecular mechanisms (Fig. 8M), which await further characterization.
The small, but statistically significant, increase of the percentage of polyploid cardiomyocyte nuclei in Tnnt2-Cre; Lmnb2flox/flox pups at P1 (Fig. 5D) contrasts with the larger decrease of myocardial regeneration (Fig. 6). In this regeneration experiment, three processes increased the percentage of polyploid cardiomyocyte nuclei, which in combination create a barrier for regeneration: (i) Developmental increase of polyploid cardiomyocyte nuclei between P1 and P7 (Fig. 5I, J). (ii) Increase of polyploid cardiomyocyte nuclei due to Lmnb2 KO, which was 3.4-fold at P1 and 4.7-fold at P7 (Fig. 5I, J). (iii) Increase of polyploidy of cardiomyocyte nuclei in the injury and border zone (Fig. 6B). Similarly, in zebrafish, it was noted that an increase of the percentage of polyploid cardiomyocytes from 1% to 25% did not inhibit heart regeneration, but an increase from 25% to 50% inhibited heart regeneration, resulting in fibrosis(Gonzalez-Rosa et al., 2018). This observation is also consistent with the finding that the small differences of the prevalence of mononucleated diploid cardiomyocytes between inbred mouse strains correlate with larger differences of myocardial regenerative activity (Patterson et al., 2017). Thus, the literature agrees with the notion that the degree of increase of polyploid cardiomyocyte nuclei does not linearly correlate with the decrease of myocardial regeneration. This apparent discrepancy could be explained based on considering the existence of cardiomyocyte subpopulations with different proliferative capacity. Under this assumption, the subpopulation with higher cell cycle potential would preferentially undergo karyokinesis failure and becoming polyploid, which would reduce the abundance of cardiomyocytes available for regeneration. The presented results in mouse, human, and zebrafish suggest that one characteristic of a proliferative cardiomyocyte subpopulation would be higher expression levels of Lamin B2 protein. It remains to be determined to what degree increasing Lamin B2 protein expression levels would alter heart regeneration in adult mice.
The classically described function of lamins in mechanotransduction between the cytoskeleton and the nucleus originates from the finding that inactivation of the Lmna genes alters the shape of nuclei (Kirby and Lammerding, 2018). We did not find evidence for altered nuclear shapes, nuclear blebs, or micronuclei in Lmnb2 KO cardiomyocytes. This is consistent with the finding that low levels of Lamin A/ C, but not of Lamin B1, are associated with altered nuclear shape (Lammerding et al., 2006). However, Lmnb1 germline KO mice were reported to have grossly altered nuclear shapes with increased ploidy, although the underlying mechanisms remain unknown (Vergnes et al., 2004). The altered spindle microtubule attachment that we found in Lmnb2 KO relates to the previously proposed requirement of B-type lamins for the function of the spindle matrix, but the altered NEB is distinct (Ma et al., 2009; Tsai et al., 2006). A function of Lmnb2 in spindle formation and chromosome segregation in cancer has been described (Kuga et al., 2014), consistent with the accepted model of faulty M-phase progression in cancer. In conclusion, our results in cardiomyocytes with altered Lmnb2 expression are distinct from prior reports and identify a previously unknown function of Lamin B2 in NEB during cardiomyocytes differentiation. The different phenotypes of lamin gene inactivation described in the literature could be explained with tissue-specificity of function and redundancy of the different lamin genes and subtypes. Our results in LMNB2 KO hiPSC-CM show presence of anillin in the cytoplasm (Suppl. Fig. S7), suggesting that components of the cytokinesis machinery are present and await further cell cycle signals to progress beyond the prometaphase block.
Recent development of high-throughput single cell transcriptomics has resulted in an unprecedented power to discover novel cell types and to monitor systematic changes in cell subpopulation compositions. Thus, one potential limitation of our gene discovery approach is the small number of cardiomyocytes analyzed by single-cell transcriptional profiling. However, as we show here, individual RNA recovery reactions with deep coverage can yield more than 10 times the number of genes in a quantitative manner, which can be key to using scRNAseq for mechanism discovery. The more efficient RNA recovery and large sequencing depth (average 27 million uniquely aligned exonic reads per cardiomyocyte), with which we have performed single-cell transcriptional profiling, resulted in the detection of up to 11,000 genes (average 8,500) in each analyzed cardiomyocyte. We have previously reported the analysis of parts of this dataset (Dueck et al., 2015) and used other parts for identifying the molecular mechanisms of cardiomyocyte cytokinesis failure (Liu et al., 2019). Together with the current paper, this highlights the power of deep single cell transcriptional profiling for gene discovery.
STAR Methods
LEAD CONTACT AND MATERIALS AVAILABILITY
Further information and requests for resources and reagents should be directed to and will be fulfilled by the Lead Contact, Bernhard Kuhn, Bernhard.kuhn2@CHP.edu.
All unique/stable reagents generated in this study are available from the Lead Contact without restriction.
EXPERIMENTAL MODELS AND SUBJECT DETAILS
Mice
Animal were housed under a 12-h light, 12-h dark cycle in the Laboratory Animal Research Center at the Children’s hospital Rangos Research Center. Animal experiments were approved by the Institutional Animal Care and Use Committee (IACUC). The study design, including number of animals, type, and time points of analyses, were predefined by the investigators. The mice used were backcrossed and maintained on a C57BL/6N background. Only male mice were used for Ad-Lmnb2 overexpression with cryoinjury. Mice used for other analysis before and after weaning were sex balanced and analyzed at indicated time points. Littermates of the same sex were randomly assigned to experimental groups. Assignment to Ad-GFP or Ad-Lmnb2 administration group was performed by S.C., N.A., and L.H. Neonatal mouse cryoinjury was independently performed by B.G and N.A. in a blinded manner without knowledge of groups. Cardiac MRI was performed and analyzed in a blinded manner by Y.W. Outliers were not excluded from results. The number of biological and technical replicates is provided in the figure legends.
Human
Research involving human hearts was approved by the Institutional Review Board (IRB). Myocardium was resected as part of standard care. Resected RV myocardium from seven patients with Tetralogy of Fallot (ToF) were used. Subject #1 was 5 days old; subject #2 was 9 days old, female; subject #3 was 10 days old, male; subject #4 was 2 weeks old; subject #5 was 2.5 weeks old; subject #6 was 2 months old, female; subject #7 was 22 days old, female.
Zebrafish
Zebrafish experiments were performed according to a protocol approved by the Institutional Animal Care and Use Committee (IACUC) at the University of Pittsburgh. Both male and female fish with an age range of 6 months to 1 year were used. Adult zebrafish were maintained at a density of approximately 8–10 L−1. Fish were fed with standard flake food and brine shrimp three times per day. The water temperature was maintained at ~28.5 °C. We have used the Tg(myl7:EGFP) transgenic line.
Human pluripotent stem cell line
CiPS001–13, male hiPS cells generously donated by Drs. Kevin Bersell and Dan Roden (Vanderbilt University) were maintained in mTESR 1 media (StemTechnologies 8580) supplemented with 1% Antibiotic-Antimycotic (Life Technologies 15240062) on BD hESC- qualified Matrigel (Fisher 08–774-552 Corning 354277 diluted according to the manufacturer’s COA). Cells were passaged every 5 days using ReLeSR dissociation reagent (Stem Cell Technologies 5872) according to the manufacturer’s protocol. 10 μM of Rho-associated kinase inhibitor (ROCK) Y27632 (EMD 68000) was added to the media for the first 24 hours after passaging. iPS cells grown at 37oC 5% CO2 and were maintained in 2 mL of mTESR media with changes every 48 hours until day of passage. The cell line has not been authenticated.
METHOD DETAILS:
Cryoinjury
Cryoinjury was performed by cooling a 1.5 mm metal cryoprobe for approximately 20 mins in liquid nitrogen, and applied to the surface of the left ventricle on the heart for 3 secs(Polizzotti et al., 2015). Transgenic mice expressing the fluorescent ubiquitination-based cell cycle indicator (“Fucci”) probe mAG-hGem (1/110) driven by the ubiquitously expressed cytomegalovirus (CMV) promoter were imported from RIKEN BioResource Centre (BRC), Japan(Sakaue-Sawano et al., 2008). Male hemizygous transgenic adult mice were backcrossed with female wildtype C57/BL6 (obtained from Charles River Laboratories, Wilmington, MA) to generate F1 transgenic and wildtype control littermates. Transgenic embryos (E14.5) and neonates (1–5 days old) were phenotyped by visualizing whole body green fluorescence using a green LED flashlight. Genotypes were determined by Transnetyx Inc. by PCR amplification using the forward: CTTCTTCTACG ACATCAGGTT and reverse: GCATCTAGATTACAGCGCCTTTCTCCGTTTTTCTGC primers. Lmnb2 flox mice were imported from the lab of Dr. Stephen Young (University of California Los Angeles) and were described previously(Coffinier et al., 2011).
Breeding of Fucci Transgenic mice
Transgenic mice expressing the fluorescent ubiquitination-based cell cycle indicator (“Fucci”) probe mAG-hGem (1/110) driven by the ubiquitously expressed cytomegalovirus (CMV) promoter were imported from RIKEN BioResource Centre (BRC), Japan(Sakaue-Sawano et al., 2008). Male hemizygous transgenic adult mice were backcrossed with female wildtype C57/BL6 (obtained from Charles River Laboratories, Wilmington, MA) to generate F1 transgenic and wildtype control littermates. Transgenic embryos (E14.5) and neonates (1–5 days old) were phenotyped by visualizing whole body green fluorescence using a green LED flashlight. Genotypes were determined by Transnetyx Inc.
Inactivation of Lmnb2flox gene in vivo and genotyping
The Lmnb2flox gene was inactivated using both αMHC-Cre(Agah et al., 1997) and Tnnt2- Cre(Jiao et al., 2003). For αMHC-Cre-induced Lmnb2 gene inactivation, we bred αMHC-Cre+/−; Lmnb2flox/wt mice with Lmnb2flox/wt. For Tnnt2-Cre-induced Lmnb2 gene inactivation, we bred Tnnt2-Cre+/−; Lmnb2flox/wt mice with Lmnb2flox/wt. We used both male and female mice for experiments. Littermate controls were used for experiments and data analysis.
Conditional mCherry-hGeminin cell cycle reporter
This mouse strain was provided by Dr. Rene Maehr (University of Massachusetts Medical School). The insert used for homologous recombination contained a CMV enhancer/chicken β- actin promoter followed by a floxed STOP cassette and a fusion protein of mCherry and human Geminin. This construct was in pR26-BigC flanked by ~1 kb 5’-flanking and ~4 kb 3’-flanking sequences corresponding to the Rosa 26 locus. The reporter was conditionally expressed in cardiomyocytes after resection of a loxP cassette with Tnnt2-Cre. Mouse genotype was determined by Transnetyx Inc. for DNA using 3 probes for mRFP, Rosa WT and Tnnt2-Cre. mRFP primer: 5’-AGCGCGTGATGAACTTCGA-3’ (forward) and 5’- GCGCAGCTTCACCTTGTAGAT-3” (reverse) with a reporter sequence 5’- ACCCAGGACTCCTCC-3’. Rosa WT primer: 5’-TTCCCTCGTGATCTGCAACTC-3’ (forward); 5’-CTTTAAGCCTGCCCAGAAGACT-3’ (reverse) with a reporter sequence 5’- CCGCCCATCTTCTAGAAAG-3’. Tnnt2-Cre primer: 5’-GCTGAGGCTGAGCAGACA-3’ (forward); 5’-GTGGTTCTCCTGTCAGTTTCGA-3’ (reverse) with a reporter sequence: 5’- CTGAGTGTCTAGAGTCAACC-3’.
Embryonic (E14.5) and neonatal mouse cardiomyocyte isolation
Embryonic ventricular cardiomyocytes were isolated from 14.5 days old (E14.5) hemizygous Fucci embryos and wildtype littermates (for control of background fluorescence). We used a the Neomyts cardiomyocyte isolation kit (Cellutron Life Technologies NC9073658) and neonatal cardiomyocyte isolation kit (Miltenyi Biotec 130–100-825) according to manufacturer protocols. The final pellet of cells was resuspended in 500 μL of PBS, supplemented with 5% FBS, and filtered through a 100 μm Nylon mesh to remove remaining tissue chunks. For both E14.5 and neonatal groups, single-cell analysis used samples from the same litter in each experiment, whereas the collection of pooled cells and tissue samples involved the combination of 2 litters for optimal RNA yields.
Langendorff isolation of adult mouse ventricular cardiomyocytes
Ventricular cardiomyocytes were isolated from 19-day old mice. Hearts were retrogradely perfused through the aorta. The atria were removed, and the ventricles were placed in 5 mL of digestion buffer (40 ml Perfusion buffer, 2 ug/ml Collagenase II, 10 u/50ml Neutral Protease) prewarmed to 37oC and incubated for approximately 40mins at room temperature. Ventricular tissue was gently dispersed into cell suspension along with 5 mL of a stop buffer (perfusion buffer (113 nM NaCl, 4.7 mM KCL, 0.6 mM potassium phosphate monobasic, 0.7 mM Sodium phosphate monobasic, 1.2 mM MgSO4, 12 mM Sodium bicarbonate, 10 mM Potassium bicarbonate,10 mM HEPES, 30 mM Taurine, 10 mM BDM, 5.5 mM Glucose) supplemented with 10% FBS and 12.5 μM CaCl2). The cell suspension was filtered using a 100-μm filter and centrifuged at 50 x g for 3 minutes. The final cell pellet was filtered through a 100-μm Nylon mesh and single cells were sorted using flow cytometry.
Isolation of adult zebrafish cardiomyocytes
For isolation of zebrafish cardiomyocytes, adult hearts were extracted and washed in dissection buffer (0.3% bovine serum albumin and 20 mM glucose in 1X PBS). The ventricle was treated with digestion solution (0.2% trypsin, 0.8 mM EDTA, 20 mM glucose, 10mM BDM (2,3- butanedione monoxime) in 1X PBS) for 15 minutes with gentle agitation while on ice followed by washing with dissection buffer and 10mM BDM. Ventricular tissue was digested Accumax solution (20 mM glucose and 10 mM BDM in Accumax (SCR006, EMD Millipore)) for 45 min at room temperature with mild agitation. Ventricles were dissociated via gentle pipetting and the suspension was spun down at 400 x g for 5 minutes before the supernatant could be removed. Pellets were resuspended in 4% PFA for 1 hour at room temperature, and then they were spun down again and resuspended in 1X PBS. Cells in PBS were spread onto SuperFrost Plus slides that were outlined with a hydrophobic barrier pen and were allowed to air dry overnight(Gonzalez-Rosa et al., 2018).
FACS sorting of single cardiomyocytes
Freshly isolated cardiac cell suspensions obtained from embryonic and neonatal mAG-hGeminin ventricles were sorted on a FACSAria (20 psi, 100-μm nozzle, Becton Dickenson Biosciences). Cardiac cells expressing mAG-hGeminin transgene (G+) were identified using a sequential gating strategy. Initial size gates for forward scatter (FSC) vs. side scatter (SSC) were set to select the large cardiomyocytes with high FSC and SSC corresponding to larger and more granular cells. Cell doublet discrimination was performed by a combination of high forward scatter height and area FSC-H/FSC-A and SSC-H vs. SSC-W plots. Live cells were selected by 7-aminoactinomycin D (7AAD, 1 μg/mL final concentration, Invitrogen) live/dead cell distinction staining. Finally, live 7AAD negative cells were distinguished for their mAG fluorescence intensity using the FACSAria 488-nm excitation laser. The G+ and G- cell fractions were collected separately for further downstream analyses. FACS Diva Software was used for data acquisition and analysis.
Validation of Gem+ cardiac cells
For Hoechst profiling, cells were stained using Hoechst 33342 (Invitrogen Life Technologies H3570) at a concentration of 5 μg/mL at 37°C for 45 minutes, in a PBS buffer and then sorted for Hoechst fluorescence detected by the BD LSR II cytometer. DNA histograms of Hoechst 33342 fluorescence were analyzed using the FACSDiva 6.1 software (BD Biosciences).
RNA isolation and cDNA synthesis from mAG-hGeminin myocardial cell populations
For gene expression analysis of pooled cells, RNA from freshly dissociated myocardial cells was extracted using RNeasy Plus micro kit (Qiagen 74034). The G+ and G- cell populations were sorted directly into tubes containing 350 μL of the kit lysis buffer RLT. The concentrated RNA sample was eluted using 14 μL of RNase-free water. First-strand cDNA was synthesized with SuperScript III first-strand cDNA synthesis kit (Invitrogen 18080–051) per the manufacturer’s recommendations. Single-stranded cDNA quality and yield was determined using a nanodrop spectrophotometer.
Cardiomyocyte identification
The molecular identity of the sorted single cells was confirmed by PCR for positive expression of the cardiomyocyte-specific gene Tnnt2 (troponin T2) and negative expression of Pdgfrb (platelet-derived growth factor receptor, β) to exclude potential contamination by other cardiac cell types. PCR confirmation involved two rounds of amplification using the Taq PCR core kit (Qiagen 201203) according to the manufacturer’s protocol. PCR primers for Tnnt2 (forward primer: 5´- TTGGCACCCAATGCAGACTCCTGTTT −3´ and reverse primer: 5´- CCCGCACTATGCCAGC AATAAA −3´) and Pdgfrb (forward primer: 5´- GGGAGTACTGCTCACAATGGTA −3´ and reverse primer: 5´- AATAGCACTTCCGGTG TCTAAATGTGGG −3´) were designed using Integrated DNA Technologies (IDT) PrimerQuest. The PCR program was 94°C for 3 minutes, 30 cycles of 94°C for 30 seconds, 55°C for 30 seconds, 72°C for 1 minute, and 72°C for 10 minutes.
First strand cDNA synthesis
Single cells were sorted individually into 96-well plates containing 5.25 μL of cold reverse transcription buffer [dNTPs (2.5 mM each), 5x first strand buffer, DTT (100 mM), and T7-oligo (dT) primer (100 ng/μ L)]. Cell lysis was performed by incubating at 70°C for 5 minutes in a PCR machine and immediately placing the plate on ice for at least 5 minutes. The volume of the reaction was adjusted to 10.25 μ L with nuclease-free water, and 1.75 μ L of enzyme mixture [Superscript III (200 U/μL) and RNase (40 U/ μL)] was added, followed by incubation at room temperature for 10 minutes. First-strand cDNA synthesis was performed at 42°C for one hour and the reaction was terminated by heat-inactivation at 70°C for 15 minutes.
Linear amplification
The product was subjected to linear T7-based antisense RNA (aRNA) amplification. Priming for second-strand cDNA synthesis was done by RNA nicking. Second-strand cDNA synthesis was carried out with E. coli DNA polymerase I (Invitrogen 18010025) followed by blunt-ending with T4 DNA polymerase to produce double-stranded cDNA that was purified with a MinElute PCR purification kit (Qiagen 28004). Linear T7-based in vitro aRNA synthesis from the sense strand was performed by T7 RNA polymerase using the Ambion MEGAscript T7 kit (Thermo Fisher AM1334). The RNA transcript reactions were cleaned using the Ambion Megaclear kit (Thermo Fisher AM1908) per the manufacturer’s instructions with some modifications, as described previously(Dueck et al., 2015). Synthesized aRNA was used in a second round of amplification for first-strand cDNA synthesis using random primers and second-strand cDNA synthesis with T7 promoter primer. This second round was repeated to achieve three rounds of amplification from each single cell. The RNA yield was quantified using a NanoDrop ND-1000 spectrophotometer (NanoDrop technologies).
Illumina Truseq RNA library preparation and sequencing
Following three rounds of amplification, the aRNA was subjected to library preparation using the Illumina TruSeq sample preparation kit (Illumina FC-122–2101) according to the manufacturer’s protocol. Two successive cleanup procedures using the Agencourt AMPure XP beads (Beckman Coulter A63881) were performed according to manufacturer’s protocol after adaptor ligation, and DNA was eluted with 22.5 μ L of resuspension buffer. A 15-cycle PCR (98°C for 10 sec, 15 cycles of [98°C for 10 sec, 60°C for 30 sec, 72°C for 30 sec], 72°C for 5 min and 4°C hold) was performed to selectively enrich those DNA fragments that have adapter molecules on both ends and to amplify the amount of DNA in the library. PCR-amplified DNA was purified with AMPure XP beads and eluted in a final volume of 30 μ L of resuspension buffer. The resulting cDNA library were processed and sequenced by the Health Sciences Core Research Facilities (HSCRF) at University of Pittsburgh with Illumina HiSeq 2000 to produce 10–60 million paired- end 100 bp reads per sample.
Bioinformatics analysis
The reads were trimmed to remove residual adapters and poly A/T from either ends of each read. Any reads that were shorter than 50 nucleotides following trimming were discarded. The reads were aligned to the mouse genome RefSeq gene set using the RUM pipeline allowing up to 2 mismatches per read. Each cell had on average 27 million uniquely mapped exonic reads. Cardiomyocytes were excluded when RNA-Seq Unified Mapper (RUM) alignment was <60%. As a result, the analyzed cardiomyocytes expressed on average 11,000 genes (range 6,000 – 11,000). From the RNA-seq data, the gene expression was quantified using the program rpkmforgenes.py(Bullard et al., 2010). Gene expression was normalized using upper-quartile normalization34. A standard t-test was performed to find the genes that are differentially expressed between the two groups. Multiple testing corrections were performed using the Bioconductor package q value (http://www.bioconductor.org/packages/2.10/bioc/html/qvalue.html). The genes with a p-value of ≤ 0.05 and false discovery rate (FDR) of ≤10% were significantly different between the two groups. Eleven genes met this cutoff. Gene ontology analysis was performed using the DAVID Bioinformatics Resources 6.7 (http://david.abcc.ncifcrf.gov/).
Video microscopy
Cells were plated onto a 35-mm glass bottom dish (Fisher 81166) and cultured in phenol red-free media (DMEM/F12 containing 3% Na-Pyruvate, 1%L-Glutamine, 0.1% Vitamin C, 0.5% Insulin/Transferrin/SE, 0.5% BSA, 1% Pen Strep). Live cell imaging was performed using an Olympus IX-81 spinning disk microscope. Images were taken at an interval of 10–20 per minute. Images were processed using Slidebook and Image J.
Immunofluorescence microscopy of isolated cardiomyocytes
Cells were fixed in 4% paraformaldehyde for 20mins at room temperature, rinsed 3x in PBS, permeabilized with 0.5% Triton-X100/PBS (Fisher BP151–500) for 10mins at room temperature, followed by blocked with 3% BSA/PBS (Fisher BP9706–100) for 2hrs at room temperature. Cells were subsequently treated with primary antibodies (1:200–1:400) diluted in block and incubated at 4° C overnight. Cells were rinsed 3x in PBS for 5mins at room temperature followed by secondary antibodies diluted in PBS at 1:400 for 2 hours at room temperature. Nuclei were stained with Hoechst 33342 (Invitrogen H3570) diluted in PBS and incubated for 5 minutes at room temperature. The cells were mounted with glycerol containing 1% n-propyl gallate (Sigma P3130–100G).
Quantification of LAP2, Aurora-B kinase signal, and spindle abnormality by confocal microscopy
The isolated cardiomyocytes were imaged with a Nikon A1 confocal microscope with 60x or 100x lens. Z-stack images were taken with 0.3 μm for each step and analyzed with Nikon Elements. The colocalization of LAP2 with chromosomes was quantified by the average correlation coefficient (Pearson correlation) of each z-stack image. Volume of Aurora-B was quantified by using a Nikon Element 3D analysis module at the Center for Biologic Imaging at the University of Pittsburgh. Abnormal spindle structures were defined as mitotic spindles with splayed poles, frayed microtubules not in connection with chromosomes, and spindles with few or unsymmetrical microtubules. Note that all analysis are from mononucleated cardiomyocytes.
Microscopy of heart sections
Hearts were fixed in 4% paraformaldehyde at 4°C overnight followed by three 5 mins washes in PBS and immersion in 30% sucrose at 4°C for 24 hours. Hearts were embedded in an optimum cutting temperature (OCT) compound followed by sectioning with a Leica RM2135 microtome. The staining procedure was the same as described above. The quantification of AFOG-stained sections was performed after staining with AFOG. Photo- micrographs were taken on a TiE microscope (objective lens 10×). Areas of myocardium (red after AFOG staining) and scar (blue after AFOG staining) were quantified using ImageJ (version 1.51 s). The image was overlaid with a grid to determine area per point. The distance between selected sections was calculated (6th slide × 8 sections per slide × 15-μm section thickness). The total myocardial volume was measured by counting the number of grids on both the total myocardium and the scar region. The readout is the percentage of scar volume of the total myocardium.
Cardiomyocyte isolation by fixation-digestion
Fresh hearts were harvested and cut into 1 mm blocks and fixed with 3.7% PFA at room temperature for 2 hours. Samples were subsequently digested in enzyme solution (Collagenase B: 1.8 mg/mL; Collagenase D: 2.4 mg/mL) at 37°C, at 10 rpm. The digested cells were collected every 12–24 hours from the supernatant, until all tissue was digested. Isolated cells were combined and allowed to settle down overnight for further staining.
Ploidy quantification by Imaging Flow Cytometry
Postnatal and adult cardiomyocytes were isolated using the fixation-digestion method and stained with Hoechst (Invitrogen H3570 1:400) and the cardiomyocyte marker cardiac troponin I (Abcam ab56357 1:400). The cells were resuspended in PBS at a concentration of 2 ×10⁷ cells/mL. The DNA content was detected by an ImagestreamX MKII (Luminex) equipped with 40x objective and analyzed by image analysis software (IDEAS™). For calibration, we used non-cardiomyocytes to define 2N ploidy of a nucleus. The percentage of 2N, 4N, and >4N ploidy was determined by setting gates using the calibration with nuclei of non-cardiomyocytes at 2N. The software separated the cardiomyocytes into mono- and binucleated by utilizing brightfield, Hoechst, and Troponin I images. For binucleated cardiomyocytes, we analyzed the ploidy of the nucleus in focus.
Ploidy measurement on mouse and human heart sections by microscopy
Adult mouse hearts were cryo-sectioned on a longitudinal axis. Both mouse and human tissue was stained with cardiac troponin I (Invitrogen H3570 1:400) and Hoechst (Abcam ab56357 1:400). The images were taken with a Nikon A1 confocal microscope using the same setting of laser power, voltage, offset, and pinhole across the board. Z-stack images were taken with 1 μ m for each step, with approximately 30–40 steps per section. The individual nucleus was reconstituted by image analysis software, Elements (Nikon Instruments), equipped with a 3D volume module from Nikon, and the sum intensity of the DAPI channel was analyzed by a 3D binary mask. To calculate ploidy, we used non-cardiomyocytes from the same photomicrograph as reference cells to determine the intensity of diploid nuclei. Ploidy values were then transferred to GraphPad Prism to generate a frequency distribution histogram, which was represented as the best fitting curve.
Organotypic culture of human patient myocardium
Three myocardial pieces from infants diagnosed with Tetralogy of Fallot or cardiomyopathy were used for experiments and analyses (ages 8 days, 9 days, and 6 weeks). Fresh right ventricular myocardium, collected as part of standard care during surgical repair, was taken into organotypic culture. We used IMDM (Fisher SH3022801) media containing 10% FBS (LifeTech 10437028) and recombinant neuregulin 1 (RND 396-HB/CF, rNRG1, 100 ng/mL) for 5 days 37° 5% CO2, with administration of adenovirus with a final titer of 1×10¹⁰/mL. siRNA (GE Dharmacon, SMARTpool, ON-TARGETplus human LMNB2 siRNA Cat# L-005290–00-0005) and ON-TARGET plus Non-targeting siRNAs (GE Dharmacon, NC1269625) as control. The final concentration of the siRNA was 2 μM. Samples were collected for real time PCR and ploidy analysis.
Western blot
Hearts were lysed in RIPA buffer (Pierce Thermo Scientific 89901) containing 1X Halt protease inhibitor (Thermo Scientific 78430), followed by incubation on ice for 5 minutes. The samples were sonicated at 4°C for 30 seconds at 50% pulse. The lysate was incubated on ice for 15 minutes, followed by centrifugation at 14,000 x g. Protein concentrations were determined using Bicinchoninic acid assay (BCA, Pierce Thermo Scientific 23227). Fifteen μg of protein was loaded onto 4–20% pre-cast gradient SDS-PAGE gels (Bio-Rad 4561084. The gel was transferred using a Trans-Blot Turbo transfer system (Bio-Rad 1704158). The blots were probed with primary antibodies at 1:2000 (see Key Resources Table) in blocking buffer (PBS 0.1% Tween 20, 5% Non-fat milk) at 4° for 12 hours. Membranes were washed with PBS 3x for 5 mins and incubated with secondary antibodies (See Key Resources Table) for 1 hr at room temperature. Membrane was developed using ECL Western blotting substrate (Pierce Thermo Scientific 32106). Blots were imaged using the ChemiDoc MP imaging system (Bio-Rad).
KEY RESOURCES TABLE
| REAGENT or RESOURCE | SOURCE | IDENTIFIER |
|---|---|---|
| Antibodies | ||
| Anti-alpha Tubulin antibody - Loading Control | Abcam | Cat# ab189984 Lot# GR3197989–2 RRID:AB_10672056 |
| Anti-Anillin antibody | Abcam | Cat# ab5910; Lot# GR10341–34 RRID:AB_2058292 |
| Anti-Aurora B antibody | Abcam | Cat#ab2254; Lot# GR324273–1 RRID:AB_302923 |
| Anti-BrdU antibody [BU1/75 (ICR1)] | Abcam | Cat# ab6326; RRID:AB_305426 |
| Anti-Cardiac Troponin I antibody | Abcam | Cat# ab56357; Lot# GR313459–8 RRID:AB_880622 |
| CD31 Monoclonal Antibody (HEC7) | Invitrogen | Cat# MA3100; Lot# SA244983 RRID:AB_223516 |
| Hoechst 33342, Trihydrochloride, Trihydrate - 10 mg/mL Solution in Water | Invitrogen | Cat# H3570 Lot#1860907; RRID: N/A |
| Cyclin B1 Antibody | Abcam | Abcam Cat# ab131502 Lot# GR125065–10 RRID:AB_11157926 |
| Anti-GAPDH antibody produced in rabbit | Sigma | Cat# G9545; Lot# 127M4814V RRID:AB_796208 |
| Anti-Cyclin B1 | Abcam | Cat# ab181593; Lot# GR221841–2 RRID:AB_2820245 |
| Histone H3S10ph antibody (mAb) | Activ Motif | Cat# 61623; RRID:AB_2793707 |
| Anti-Lamin A/C Antibody, clone 14 | EMD | Cat# 05–714; RRID:AB_309928 |
| Lamin A/C (4C11) Mouse mAb #4777 | Cell Signaling | Cat# 4777S; Lot# 1 RRID:AB_10545756 |
| Anti-Lamin B1 antibody - Nuclear Envelope Marker | Abcam | Cat# ab16048; Lot# GR296836–1 RRID:AB_443298 |
| Recombinant Anti-Lamin B2 antibody [EPR9701(B)] | Abcam | Cat# ab151735, RRID: N/A |
| Anti-Lamin B2 antibody [LN43] | Abcam | Cat# Ab8983; Lot# GR141423–12 RRID:AB_306912 |
| Nanog Antibody #3580 | Cell Signaling | Cat# 3580S; RRID: AB-2150399 |
| Anti-pan Cadherin antibody | Abcam | Cat# ab16505; RRID:AB_443397 |
| Monoclonal Anti-α-Actinin (Sarcomeric) antibody produced in mouse | Sigma | Cat# A7811; Lot# 036M44861-V RRID:AB_476766 |
| TRA-1–60(S) (TRA-1–60(S)) Mouse mAb #4746 | Cell Signaling | Cat# 4746S; RRID:AB_2119059 |
| Donkey anti-Goat IgG (H+L) Cross-Adsorbed Secondary Antibody, Alexa Fluor 488 | Thermo Fisher | Cat# A11055 Lot# 682638 RRID:AB_2534102 |
| Donkey anti-Goat IgG (H+L) Cross-Adsorbed Secondary Antibody, Alexa Fluor 594 | Thermo Fisher | Cat# A11058 Lot# 1842799 RRID: AB_2534105 |
| Donkey anti-Goat IgG (H+L) Cross-Adsorbed Secondary Antibody, Alexa Fluor 647 | Thermo Fisher | Cat# A21447 Lot# 2045332 RRID: AB_141844 |
| Donkey anti-Mouse IgG (H+L) Highly Cross-Adsorbed Secondary Antibody, Alexa Fluor 488 | Thermo Fisher | Cat# A21202 Lot# 2018296 RRID: AB_141607 |
| Donkey anti-Mouse IgG (H+L) Highly Cross-Adsorbed Secondary Antibody, Alexa Fluor 568 | Thermo Fisher | Cat# A10037 Lot# 2110843 RRID: AB_2534013 |
| Donkey anti-Mouse IgG (H+L) Highly Cross-Adsorbed Secondary Antibody, Alexa Fluor 594 | Thermo Fisher | Cat# A21203 Lot# 1722995 RRID: AB_141633 |
| Donkey anti-Mouse IgG (H+L) Highly Cross-Adsorbed Secondary Antibody, Alexa Fluor 647 | Thermo Fisher | Cat# A31571 Lot# 1549801 RRID: AB_162542 |
| Donkey anti-Rabbit IgG (H+L) Highly Cross-Adsorbed Secondary Antibody, Alexa Fluor 488 | Thermo Fisher | Cat# A21206 Lot# 2072687 RRID: AB_2535792 |
| Donkey Anti-Rabbit IgG H&L (Alexa Fluor® 555) | Abcam | Cat# ab150074 Lot# GR3241278–3 RRID: AB_2636997 |
| Anti-Rat IgG (H+L), highly cross-adsorbed, CF™ 488A antibody produced in donkey | Sigma | Cat# Sab4600037 Lot# 16C0301 RRID: N/A |
| Anti-Rat IgG (H+L), highly cross-adsorbed, CF™ 568 antibody produced in donkey | Sigma | Cat# Sab4600077 Lot# 15C0723 RRID: N/A |
| Goat anti-Chicken IgY (H+L) Secondary Antibody, Alexa Fluor 568 | Thermo Fisher | Cat# A11041 Lot#1963088 RRID: AB_2534098 |
| Goat anti-Mouse IgG (H+L) Highly Cross-Adsorbed Secondary Antibody, Alexa Fluor 568 | Thermo Fisher | Cat# A11031 Lot# 1841757 RRID: AB_144696 |
| Goat anti-Mouse IgG (H+L) Highly Cross-Adsorbed Secondary Antibody, Alexa Fluor 647 | Thermo Fisher | Cat# A21236 Lot# 1977346 RRID: AB_141725 |
| Goat anti-Rabbit IgG (H+L) Highly Cross-Adsorbed Secondary Antibody, Alexa Fluor 488 | Thermo Fisher | Cat# A11034 Lot# 1885241 RRID: AB_2576217 |
| Goat anti-Rabbit IgG (H+L) Highly Cross-Adsorbed Secondary Antibody, Alexa Fluor 568 | Thermo Fisher | Cat# A11036 Lot# 1504529 RRID: AB_10563566 |
| Goat anti-Rabbit IgG (H+L) Cross-Adsorbed Secondary Antibody, Alexa Fluor 647 | Thermo Fisher | Cat# A21244 Lot# 2086730 RRID: AB_141663 |
| Goat anti-Rat IgG (H+L) Cross-Adsorbed Secondary Antibody, Alexa Fluor 488 | Thermo Fisher | Cat# A11006 Lot# 2105157 RRID: AB_2534074 |
| Goat anti-Rat IgG (H+L) Cross-Adsorbed Secondary Antibody, Alexa Fluor 546 | Thermo Fisher | Cat# A11081 Lot# 1848462 RRID: AB_141738 |
| 7-aminoactinomycin D (7-AAD) | Thermo Fisher | Cat# A1310 |
| Bacterial and Virus Strains | ||
| Ad-GFP | Applied Biological Materials Inc. | Cat# 900024A Lot# T101615A |
| Ad-Lmnb2 | Lot# T040816A(B) | |
| Ad-LacZ | Lot# G030916A | |
| Biological Samples | ||
| Human ToF heart samples | N/A | N/A |
| Chemicals, Peptides, and Recombinant Proteins | ||
| LMNB2 siRNA | GE Dharmacon | Cat# L-005290–00-0005 |
| Control siRNA | GE Dharmacon | NC1269625 |
| Critical Commercial Assays | ||
| Cellutron Neomyts cardiomyocyte isolation Kit | Thermofisher | Cat# NC9073658 |
| Neonatal Cardiomyocyte isolation kit | Milteni Biotec | Cat# 130–100-825 |
| RNeasy Plus micro kit | Qiagen | Cat# 74034 |
| SuperScript III | Invitrogen | Cat# 18080–051 |
| Quantifast SYBR green PCR kit | Qiagen | Cat# 204054 |
| Taq DNA polymerase PCR kit | Qiagen | Cat# 201203 |
| MinElute PCR purification kit | Qiagen | Cat# 28004 |
| Ambion Megaclear kit | Thermofisher | Cat# AM1908 |
| Illumina TruSeq sample preparation kit | Illumina | FC-122–2101 |
| Adeno-XTM Rapid Titer kit | Takara | Cat# 631028 |
| Ambion MEGAscript T7 transcription Kit | Thermofisher | Cat# AM1334 |
| pAd/CMV/V5-DEST™ Gateway® | Invitrogen | Cat# V49320 |
| SURVEYOR nuclease assay | Transgenomic | Cat. No. 706025 |
| AMPure XP beads | Beckman Coulter | A63881 |
| DNA polymerase I | Invitrogen | 18010025 |
| Deposited Data | ||
| Single-cell transcriptome sequencing data | GEO repository | GSE108360 |
| Single-cell transcriptome sequencing data | GEO repository | GSE56638 |
| Experimental Models: Cell Lines | ||
| Human: p56 CiPS001–13 hiPS cells | Laboratory of Drs. Dan Roden and Kevin Bersell Vanderbilt University |
N/A |
| Human: p20 CAS9 hiPS cell | This paper | N/A |
| Human: p22 Lmnb2 KO hiPS cell | This paper | N/A |
| Experimental Models: Organisms/Strains | ||
| Mouse: Lmnb2fl/fl: Lmnb2tm1.1Sgy/J | Laboratory of Dr. Stephen Young, UCLA | JAX stock #032559 |
| Mouse: conditional mCherry-hGeminin | Laboratory of Dr. Gene Maehr, Univ. Mass. Medical School | N/A |
| Mouse: Fucci-Geminin: B6.Cg-Tg(Fucci)504Bsi B6.Cg-Tg(Fucci)596Bsi |
Laboratory of Atsushi Miyawaki | RBRC 02706, RBRC 02707 |
| Mouse: Tnnt2-Cre: Tg(Tnnt2-cre)5Blh/j | Jackson lab | JAX stock #024240 |
| Mouse: αMHC-cre: Tg(Myh6-cre)2182Mds/j | Jackson lab | JAX stock #011038 |
| Mouse: αMHC-cre; Lmnb2fl/fl | This paper | N/A |
| Mouse: Tnnt2-cre; Lmnb2fl/fl | This paper | N/A |
| Zebrafish: Tg(myl7:EGFP) | ZFIN ID: ZDB-TGCONSTRCT-190206–1 | |
| Oligonucleotides | ||
| Primer: Gapdh Forward: GTGGACCTGACCTGCCGTCT Reverse: GGAGGAGTGGGTGTCGCTGT |
This paper | N/A |
| Primer: Actb Forward: GGAGGAGTGGGTGTCGCTGT Reverse: GTCATACTCCTGCTTGCTGAT |
This paper | N/A |
| Primer: Lmnb2 Forward: GAGGACATTGCCTACAAGTTCAC Reverse: TTCCACACAAGGGTTGATG |
This paper | N/A |
| Primer: CDK1 Forward: CGCGGAATAATAAGCCGGGA Reverse: CATGGCTACCACTTGACCTGT |
This paper | N/A |
| Primer: CCNB1 Forward: TGCAGCACCTGGCTAAGAAT Reverse: TAGCATGCTTCGATGTGGCA |
This paper | N/A |
| Primer: ACTB Forward: CCAACCGCGAGAAGATGA Reverse: CCAGAGGCGTACAGGGATAG |
This paper | N/A |
| Primer: Tnnt2 Forward: TTGGCACCCAATGCAGACTCCTGTTT Reverse: CCCGCACTATGCCAGC AATAAA |
This paper | N/A |
| Primer: Pdgfrb Forward: GGGAGTACTGCTCACAATGGTA Reverse: AATAGCACTTCCGGTG TCTAAATGTGGG |
This paper | N/A |
| Software and Algorithms | ||
| NIS-Elements | Nikon Instruments | N/A |
| Nikon Element 3D analysis module | CBI Univ. Pittsburgh | N/A |
| Fiji/Image J | NIH | RRID:SCR_002285 https://imagej.nih.gov/ij/ |
| FlowJo | FlowJo | RRID:SCR_000410 |
| IDEAS | Luminex | N/A |
| GraphPad Prism 7 | GraphPad Software | N/A |
| NCBI Primer Blast | NCBI | RRID:SCR_004870 |
| Integrated DNA Technologies (IDT) PrimerQuest software | Integrated DNA technologies (IDT) | https://www.idtdna.com›primerquest |
| FACSDiva 6.1 software | BD Biosciences | RRID:SCR_001456 |
| Bioconductor | Bioconductor | RRID:SCR_006442 http://www.bioconductor.org/packages/2.10/bioc/html/qvalue.html |
| DAVID | http://david.abcc.ncifcrf.gov/ |
http://david.abcc.ncifcrf.gov/ RRID: SCR_001881 |
| Slidebook | Intelligetn-imaging | https://www.intelligent-imaging.com/slidebook.php; RRID:SCR_014300 |
| RUM | Github.com |
https://github.com/itmat/rum RRID: SCR_008818 |
| rpkmforgenes.py | Sandber Lab | http://sandberg.cmb.ki.se/rnaseq/ |
| CRISPR design tool | Zhang lab | http://tools.genome-engineering.org |
| Other | ||
| Illumina cBot Cluster generation system | Illumina | N/A |
| FACSAria | BD | N/A |
Generation of adenovirus
All 11 candidate genes were cloned into pAd/CMV/V5-DEST™ Gateway® Technology (Invitrogen Life Technologies V49320) according to the manufacturer’s instructions. The expression clones were digested with Pac I (NEB RO547S) to expose the viral inverted terminal repeats (ITRs). Pac I-digested expression clones were transfected into the 293A cell line to produce a crude adenoviral stock. Lmnb2-GFP adenovirus was created by inserting a sequence encoding Lmnb2-GFP into pShuttle via the EcoRI/EcoRV restriction sites, and then into pAdenovector via the I-CeuI and PI-SecI sites. The Lmnb2-GFP virus was generated by Applied Biological Materials Inc. (Richmond, BC, Canada, catalog number 900024A).
Adenovirus titering and injection
The Adenovirus titer was calculated using an Adeno-XTM Rapid Titer Kit (Takara 631028) according to the manufacturer’s instructions. HEK 293 cells were seeded in a 12-well plate with DMEM + 10% FBS + antibiotics (Life Technologies 11965092, 10437028, 15240062). Ten-fold serial dilutions of a viral sample from 10−2 mL to 10−6 mL was prepared in DMEM. Each dilution of the virus was assayed in duplicate to ensure accuracy. Cells were incubated at 37°C in 5% CO2 for 48 hours and fixed by gently adding ice-cold 100% methanol to each well. Cells were incubated at −20°C for 10 minutes and washed with 1% BSA (Fisher BP9706–100) in PBS. Cells were incubated for one hour with mouse anti-Hexon antibody (Abcam ab8249) at 1:1,000 dilution in 1% BSA in PBS at. The cells were washed in 1% BSA in PBS, followed by incubation with a rat anti-mouse antibody (HRP conjugate Cell Signaling 7076S, 1:500 dilution in 1% BSA in PBS) for one hour. The cells were again washed with 1% BSA in PBS. DAB (substrate for HRP, Thermo Fisher 34002) was added to each well and incubated at room temperature for 10 minutes. A minimum of three fields of cells were visually examined under bright field at 20X magnification. The infectious unit (ifu/mL) was calculated using the following formula:
50 μL of 2 × 10¹² vp/mL adenoviral injection was retro-orbitally injected into neonatal pups as described previously (Yardeni et al., 2011). Adenoviral gene transfer is not cardiomyocyte specific. As such, it is possible that Adv-Lmnb2 elicited its positive effect via non- cardiomyocytes in the heart
In-vivo cardiac MRI (cMRI)
Anesthesia was induced in mice with oxygen and isoflurane mixture (3% isoflurane) and maintained with 1.5% isoflurane applied via facemask. Non-magnetic ECG leads were placed subcutaneously. Respiration was monitored using a pneumatic sensor placed between the cradle and one side of the mouse’s abdomen while core temperature was maintained with a positive- feedback controlled warm air supply coupled with rectal fiberoptic temperature sensor (SA Instruments, Stony Brook, NY). An in-vivo cardiac MRI (CMRI) was carried out on a Bruker Biospec 70/30 spectrometer (Bruker Biospin MRI, Billerica, MA USA) operating at 7 Tesla, equipped with an actively shielded gradient system and a quadrature radio-frequency volume coil with an inner-diameter of 35 mm.
A multi-slice short-axis and long-axis cine MRI was acquired with the following parameters: FOV=2.5 cm, SLTH=1 mm, in-plane resolution=0.097 mm, TE=2.26 ms, TR=12.923 ms, FA=30 degrees. A multi-slice short-axis tagging MRI22–26 with ECG and respiration gating was acquired with SPAMM sequence with the following parameters: FOV=2.5 cm, SLTH=1.1 mm, in-plane resolution=0.13 mm, tag distance=0.8 mm, tag thickness = 0.15 mm, TE=2.514 ms, TR=14.612 ms, FA=30 degrees. For late gadolinium enhancement (LGE), 0.5 mmol/kg sterile clinical grade gadobenate dimeglumine injection solution (MultiHance 529 mg/ml, Bracco Diagnostics, Monroe Township, NJ) was administered via subcutaneous (sub. Q.) injection about 30–45 minutes prior to T1-weighted cine imaging acquisition.
To determine myocardial infarction (MI), we measured the scar region of the myocardium displaying hyperintensity in the left ventricle wall of each scanned slice. The hyperkinetic volume is measured by the akinetic volume of the left ventricular wall. To quantify cardiac function from cine CMR, the left ventricular endocardial and epicardial boundaries of each imaging slice at the end-systole (ES) and the diastole (ED) were manually traced by a core staff member using the Paravision 5.1 Xtip software (Bruker Biospin MRI, Billerica, MA) to calculate the following functional parameters: left ventricular blood volume (LVV), left ventricular wall volume (LV wall), stroke volume (SV), ejection fraction (EF), longitudinal shortening, and radial shortening. LVV is calculated by summation of all short-axis slices. The ejection fraction (EF) was calculated using the following equation: , where Aies is the internal left ventricle area of slice i at end systole, Aied the internal left ventricle area of slice i at end diastole, and hi is the thickness of each scanned slice.
Strain and wall-motion analysis
Four short-axis (SA) slices were used to cover the heart from 1.5 mm below the mitral valve level to the apex. Strains were analyzed by the HARP method(Osman and Prince, 2000) with software obtained from Myocardial Solutions, Inc. (Morrisville, NC). The peak circumferential strain (Ecc) was analyzed for 6 segments for each SA slice, and 4 segments for the apex, following the AHA convention. Ecc values of the mid-wall layers were used for this analysis because the Multi-Ethnic Study of Atherosclerosis (MESA) clinical study showed that the mid- wall layer yields the best inter-observer and intra-observer consistency(Castillo et al., 2005).
Human pluripotent stem cell culture
CiPS001–13 iPS cells generously donated by Drs. Kevin Bersell and Dan Roden (Vanderbilt University) were maintained in mTESR 1 media (StemTechnologies 85850) supplemented with 1% Antibiotic-Antimycotic (Life Technologies 15240062) on BD hESC-qualified Matrigel (Fisher 08–774-552 Corning 354277 diluted according to the manufacturer’s COA). Cells were passaged every 5 days using ReLeSR dissociation reagent (Stem Cell Technologies 5872) according to the manufacturer’s protocol. 10 μM of Rho-associated kinase inhibitor (ROCK) Y27632 (EMD 68000) was added to the media for the first 24 hours after passaging. iPS cells were incubated at 37°C in 5% CO2 and maintained at in 2 mL of mTESR media with changes every 48 hours until day of passage.
CRISPR-Cas9 knockout LMNB2 in iPS cells
The Cas9 plasmid was engineered with GFP fused into lentiCRISPRv2 (Addgene 52961) and generously shared by Dr. Yi Sheng (University of Pittsburgh). The iPS cell line CiPS001–013 was transfected with CRISPR plasmid-carrying guide RNA oligos (5’- CACCGAGACGGCTCGAGAGCGTGCC-3’; 5’-AAACGGCACGCTCTCGAGCCGTCTC-3’). Single cells transiently expressing GFP were sorted by flow cytometry. The indels were detected by SURVEYOR nuclease assay (Transgenomic, Cat. No. 706025)(Ran et al., 2013). A pair of SURVEYOR PCR primers was designed to amplify one band of 451 bp DNA product containing the region of exon 2. With SURVEYOR nuclease digestion, the heterozygous mutation was detected in clones 4 and 39. DNA from the remaining clones was mixed with iPS wild-type individually, denatured, annealed, and digested with SURVEYOR nuclease. Several clones, including 35 and 103, were identified as homozygous mutations. These results were further confirmed with Sanger DNA sequencing in which one thymidine insertion was identified in clones 35 and 103. To determine off-target activity of our gRNA, we followed the instruction from the original published paper(Ran et al., 2013). We used the recommended online CRISPR Design Tool (http://tools.genome-engineering.org) to predict genomic off-target sites, and examined the potential off-target sites with score >0. All predicted exonic homologous sites were examined by DNA sanger sequencing. No off-target mutations were observed at any site.
Cardiomyocyte differentiation of hiPS cells
CiPS001–13 hiPS cells of passage number 48 were split using ReLeSR dissociation reagent as described above and seeded onto a 12-well growth-factor-reduced (GFR) Matrigel (Fisher CB-40230A Corning 356230, concentration of 0.08 mg/mL DMEM/F12 Life Tech 11330–032) coated plate at a ratio of 1:40. Cells were grown for 4 days at 37o at 5% CO2 in mTESR 1 media (StemTechnologies 85850) and allowed to reach a confluency of 80–90%. Medium was changed at 24 and 72 hours. At day 0, the differentiation start day, the media was changed to differentiation media (RPMI 1640, Life Technologies 11875–093; 2% B27minus insulin, Life Technologies A1895601; 1% Antibiotic-Antimycotic, Life Technologies 15240062) and supplemented with 12 μM of GSK3 inhibitor CHIR99021 (Selleck S2924). After 24 hours incubation, medium was replaced with 2 mL of fresh differentiation media. Cells were allowed to rest for 48 hours at 37° 5% CO2. On day 3, medium was replaced with 2 mL of fresh differentiation media supplemented with 5 μM WNT inhibitor IWR-1 (Sigma I0161) and incubated for 48 at hours at 37° 5% CO2. On Day 5, media containing IWR-1 was removed and replaced with 2 mL of fresh differentiation media and incubated at 37° 5% CO2 with media changes every other day until day of dissociation. On day 7 of differentiation, B27 minus insulin was replaced with B27 Supplement (Life Technologies 17504044). Contracting cells were observed on day 9. On day 11 post-dissociation, differentiation media was switched to RPMI 1640 without glucose (Life Technology 11879–020) containing 5 μ M sodium D-Lactate, 2% B27 supplement, and Antibiotic-Antimycotic. All subsequent incubations after day 5 were carried out at 37° 5% CO2.
Replating of hiPS cardiomyocytes
On day 15 post-differentiation, cells were re-plated onto GFR Matrigel (Fisher CB-40230A Corning 356230, concentration of 0.08 mg/mL DMEM/F12 Life Tech 11330–032) coated 35 mm Ibidi dishes (Fisher 50305809) 13mm Thermonox coverslip (Thermo Fisher 171950). Cells were briefly washed with PBS followed by an addition of 500 μ L of TrypLE (Life Technology 12605010). Plates were incubated for approximately 10–12 minutes at 37°C 5% CO2, cells were pipetted several times halfway through incubation. TrypLE was inactivated by adding an equal amount of stop media consisting of 50% DMEM (Life technology 11965092), 50% Heat Inactivated FBS (Life Technology 10437028), and 10 μ g/mL DNase (Roche 10104159001). Cell suspension was gently triturated and filtered through a 70-μm Nylon cell strainer (Fisher 352350). Cells were spun at 800 rpm for 5 minutes at room temperature. Cells were counted and plated at a density of 2–3 ×10⁵ per Ibidi dish (Fisher 81166) and 1–1.5 ×10⁵ per 13mm Thermonox coverslip (Thermo Fisher 171950) and grown in differentiation media containing glucose until day of analysis.
QUANTIFICATION AND STATISTICAL ANALYSIS
Numerical results are presented as means ± SEM. Statistical testing was performed with Student’s t-test, Fisher’s exact test, and analysis of variance (ANOVA, followed by Bonferroni or Sidak post-hoc testing) with ≥3 experiments. Correlation was assessed by calculation of Spearman’s correlation coefficient. The exact number of mice used in the different experiments is indicated in the respective figure legends. Statistical significance was achieved with a two- sided P value ≤ 0.05. Statistical analyses were performed with GraphPad Prism.
Supplementary Material
Related to Figure 1. Cardiomyocytes were isolated from mAG-hGeminin transgenic mice at P1. The last frame of the video shows cells that were fixed and stained with a cardiac marker (α-actinin) to identify cardiomyocytes. One of those two dividing cells is cardiomyocyte. This video validates the use of the geminin-based cell cycle reporter.
Related to Figure 1. Cardiomyocytes were isolated from mouse pups (P1) expressing tnnt2-Cre and loxP-STOP-loxP-mCherry-hGeminin. Cardiomyocytes were transduced with an adenovirus leading to expression of Lmnb2- GFP under control of the CMV promoter. S, G2, and M-phases of the cell cycle are indicated in cardiomyocytes by the conditional mCherry-hGeminin reporter (red nuclei). During the observation period, four cardiomyocyte nuclei are red. Of these, one divides, two undergo binucleation, and one does not undergo karyokinesis. This video shows that increasing the expression of Lmnb2 increases cardiomyocyte karyokinesis. The duration of the movie was 24 hours and photomicrographs were taken every 20 min.
Related to Figure 3. The video was reconstructed from z-stack images taken with 100x magnification, 0.3 μm for each step, Aurora-B in green and microtubule spindle in grey.
Related to Figure 6. Representative movies of cMRI frames showing late gadolinium enhancement in the injury region of the heart at 9 dpi.
Related to Figure 7. Heart sections were stained with cardiomyocyte marker α-actinin (Grey), adherens junction Pan-Cadheren (Red), midbody marker Aurora-B kinase (Green) and DAPI. The z-stack images were taken under 100x lens with confocal microscopy and reconstructed into 3D volume view.
Related to Figure 7. Representative movie of cMRI frames showing late gadolinium enhancement 2 mm from the apex of the heart at 34 dpi.
Related to Figure 7. Representative movie of cMRI tagging 2 mm from the apex of the heart at 34 dpi.
Highlights.
Lamin B2 regulates nuclear envelope breakdown and M-phase progression.
Decreased Lamin B2 levels lead to formation of polyploid nuclei.
Increased prevalence of polyploid nuclei decreases myocardial regeneration in mice.
Modifying LMNB2 expression in human cardiomyocytes alters ploidy of nuclei.
Acknowledgements
We thank Tae Kyung Kim (University of Pennsylvania) for help with initial single cell amplifications. We thank Stephen Young (University of California, Los Angeles) for providing Lmnb2 flox mice. We thank Dan Roden and Kevin Bersell for generously sharing of a human iPS cell line (both Vanderbilt University). We thank Yi Sheng (University of Pittsburgh) for generously sharing of the CRISPR plasmid. We thank Alexander von Giese for advice with retro-orbital injections, Brian D. Polizzotti for help with initial cryoinjury studies, and Gerrida M. Uys for Fucci validation experiments (Boston Children’s Hospital). We are grateful for the technical support from the Center for Biological Imaging (University of Pittsburgh) for ploidy analysis, for technical support from the flow core in the Department of Immunology (University of Pittsburgh), and the technical support from the Animal Imaging Core at Rangos Research Center (University of Pittsburgh) for MRI imaging and analysis. We thank the patients and families for participating in this research and the operating room staff and cardiac surgeons for assistance with identifying study subjects and ascertaining myocardial samples. We thank Kathryn Little for patient ascertainment and Honghai Liu, Kyla Holbrook, Katelyn Parsons for technical assistance (Children’s Hospital of Pittsburgh). We thank members of the Kuhn laboratory and Michael Tsang (University of Pittsburgh) for support, helpful discussions, and critical reading of the manuscript. This research was supported by the Richard King Mellon Foundation Institute for Pediatric Research (UPMC Children’s Hospital of Pittsburgh), by a Transatlantic Network of Excellence grant by Leducq Foundation (15CVD03), Children’s Cardiomyopathy Foundation, and NIH grant R01HL106302 (to B.K.) and Health Research Formula Funds from the Commonwealth of Pennsylvania, which had no role in study design or interpretation of data (to J.H.E.). This project was supported by AHA Career Development Awards (to Lu H., S.Ch., and Y.W.). S.C. received support from the Office of Faculty Development (Boston Children’s Hospital). The ImageStream MARKII analysis was supported by NIH grant 1S10OD019942–01.
Footnotes
Competing interests
The authors declare that they have no competing interests.
Data and Code Availability
The single-cell transcriptional profiling data have been deposited in NCBI’s Gene Expression Omnibus (GEO) with the dataset identifiers GSE56638 and GSE108360.
Publisher's Disclaimer: This is a PDF file of an unedited manuscript that has been accepted for publication. As a service to our customers we are providing this early version of the manuscript. The manuscript will undergo copyediting, typesetting, and review of the resulting proof before it is published in its final form. Please note that during the production process errors may be discovered which could affect the content, and all legal disclaimers that apply to the journal pertain.
References
- Agah R, Frenkel PA, French BA, Michael LH, Overbeek PA, and Schneider MD (1997). Gene recombination in postmitotic cells. Targeted expression of Cre recombinase provokes cardiac-restricted, site-specific rearrangement in adult ventricular muscle in vivo. J Clin Invest 100, 169–179. [DOI] [PMC free article] [PubMed] [Google Scholar]
- Alkass K, Panula J, Westman M, Wu TD, Guerquin-Kern JL, and Bergmann O (2015). No Evidence for Cardiomyocyte Number Expansion in Preadolescent Mice. Cell 163, 1026–1036. [DOI] [PubMed] [Google Scholar]
- Armulik A, Genove G, and Betsholtz C (2011). Pericytes: developmental, physiological, and pathological perspectives, problems, and promises. Dev Cell 21, 193–215. [DOI] [PubMed] [Google Scholar]
- Beaudouin J, Gerlich D, Daigle N, Eils R, and Ellenberg J (2002). Nuclear envelope breakdown proceeds by microtubule-induced tearing of the lamina. Cell 108, 83–96. [DOI] [PubMed] [Google Scholar]
- Bergmann O, Bhardwaj RD, Bernard S, Zdunek S, Barnabe-Heider F, Walsh S, Zupicich J, Alkass K, Buchholz BA, Druid H, et al. (2009). Evidence for cardiomyocyte renewal in humans. Science 324, 98–102. [DOI] [PMC free article] [PubMed] [Google Scholar]
- Bergmann O, Zdunek S, Felker A, Salehpour M, Alkass K, Bernard S, Sjostrom SL, Szewczykowska M, Jackowska T, Dos Remedios C, et al. (2015). Dynamics of Cell Generation and Turnover in the Human Heart. Cell 161, 1566–1575. [DOI] [PubMed] [Google Scholar]
- Bullard JH, Purdom E, Hansen KD, and Dudoit S (2010). Evaluation of statistical methods for normalization and differential expression in mRNA-Seq experiments. BMC Bioinformatics 11, 94. [DOI] [PMC free article] [PubMed] [Google Scholar]
- Butin-Israeli V, Adam SA, Goldman AE, and Goldman RD (2012). Nuclear lamin functions and disease. Trends in genetics : TIG 28, 464–471. [DOI] [PMC free article] [PubMed] [Google Scholar]
- Castillo E, Osman NF, Rosen BD, El-Shehaby I, Pan L, Jerosch-Herold M, Lai S, Bluemke DA, and Lima JA (2005). Quantitative assessment of regional myocardial function with MR-tagging in a multi-center study: interobserver and intraobserver agreement of fast strain analysis with Harmonic Phase (HARP) MRI. J Cardiovasc Magn Reson 7, 783–791. [DOI] [PubMed] [Google Scholar]
- Coffinier C, Jung HJ, Nobumori C, Chang S, Tu Y, Barnes RH 2nd, Yoshinaga Y, de Jong PJ, Vergnes L, Reue K, et al. (2011). Deficiencies in lamin B1 and lamin B2 cause neurodevelopmental defects and distinct nuclear shape abnormalities in neurons. Mol Biol Cell 22, 4683–4693. [DOI] [PMC free article] [PubMed] [Google Scholar]
- Dechat T, Pfleghaar K, Sengupta K, Shimi T, Shumaker DK, Solimando L, and Goldman RD (2008). Nuclear lamins: major factors in the structural organization and function of the nucleus and chromatin. Genes Dev 22, 832–853. [DOI] [PMC free article] [PubMed] [Google Scholar]
- Ditchfield C, Johnson VL, Tighe A, Ellston R, Haworth C, Johnson T, Mortlock A, Keen N, and Taylor SS (2003). Aurora B couples chromosome alignment with anaphase by targeting BubR1, Mad2, and Cenp-E to kinetochores. J Cell Biol 161, 267–280. [DOI] [PMC free article] [PubMed] [Google Scholar]
- Dueck H, Khaladkar M, Kim TK, Spaethling JM, Francis C, Suresh S, Fisher SA, Seale P, Beck SG, Bartfai T, et al. (2015). Deep sequencing reveals cell-type-specific patterns of single-cell transcriptome variation. Genome Biol 16, 122. [DOI] [PMC free article] [PubMed] [Google Scholar]
- Foisner R, and Gerace L (1993). Integral membrane proteins of the nuclear envelope interact with lamins and chromosomes, and binding is modulated by mitotic phosphorylation. Cell 73, 1267–1279. [DOI] [PubMed] [Google Scholar]
- Furukawa K, and Kondo T (1998). Identification of the lamina-associated-polypeptide-2- binding domain of B-type lamin. Eur J Biochem 251, 729–733. [DOI] [PubMed] [Google Scholar]
- Gemberling M, Karra R, Dickson AL, and Poss KD (2015). Nrg1 is an injury-induced cardiomyocyte mitogen for the endogenous heart regeneration program in zebrafish. Elife 4. [DOI] [PMC free article] [PubMed] [Google Scholar]
- Georgatos SD, Pyrpasopoulou A, and Theodoropoulos PA (1997). Nuclear envelope breakdown in mammalian cells involves stepwise lamina disassembly and microtubule-drive deformation of the nuclear membrane. J Cell Sci 110 (Pt 17), 2129–2140. [DOI] [PubMed] [Google Scholar]
- Gonzalez-Rosa JM, Sharpe M, Field D, Soonpaa MH, Field LJ, Burns CE, and Burns CG (2018). Myocardial Polyploidization Creates a Barrier to Heart Regeneration in Zebrafish. Dev Cell 44, 433–446 e437. [DOI] [PMC free article] [PubMed] [Google Scholar]
- Hauf S, Cole RW, LaTerra S, Zimmer C, Schnapp G, Walter R, Heckel A, van Meel J, Rieder CL, and Peters JM (2003). The small molecule Hesperadin reveals a role for Aurora B in correcting kinetochore-microtubule attachment and in maintaining the spindle assembly checkpoint. J Cell Biol 161, 281–294. [DOI] [PMC free article] [PubMed] [Google Scholar]
- Hirose K, Payumo AY, Cutie S, Hoang A, Zhang H, Guyot R, Lunn D, Bigley RB, Yu H, Wang J, et al. (2019). Evidence for hormonal control of heart regenerative capacity during endothermy acquisition. Science 364, 184–188. [DOI] [PMC free article] [PubMed] [Google Scholar]
- Ho CY, and Lammerding J (2012). Lamins at a glance. Journal of cell science 125, 2087–2093. [DOI] [PMC free article] [PubMed] [Google Scholar]
- Hsu JY, Sun ZW, Li X, Reuben M, Tatchell K, Bishop DK, Grushcow JM, Brame CJ, Caldwell JA, Hunt DF, et al. (2000). Mitotic phosphorylation of histone H3 is governed by Ipl1/aurora kinase and Glc7/PP1 phosphatase in budding yeast and nematodes. Cell 102, 279–291. [DOI] [PubMed] [Google Scholar]
- Jiao K, Kulessa H, Tompkins K, Zhou Y, Batts L, Baldwin HS, and Hogan BL (2003). An essential role of Bmp4 in the atrioventricular septation of the mouse heart. Genes Dev 17, 2362–2367. [DOI] [PMC free article] [PubMed] [Google Scholar]
- Kim TK, Sul JY, Peternko NB, Lee JH, Lee M, Patel VV, Kim J, and Eberwine JH (2011a). Transcriptome transfer provides a model for understanding the phenotype of cardiomyocytes. Proc Natl Acad Sci U S A 108, 11918–11923. [DOI] [PMC free article] [PubMed] [Google Scholar]
- Kim Y, Sharov AA, McDole K, Cheng M, Hao H, Fan CM, Gaiano N, Ko MS, and Zheng Y (2011b). Mouse B-type lamins are required for proper organogenesis but not by embryonic stem cells. Science 334, 1706–1710. [DOI] [PMC free article] [PubMed] [Google Scholar]
- Kirby TJ, and Lammerding J (2018). Emerging views of the nucleus as a cellular mechanosensor. Nat Cell Biol 20, 373–381. [DOI] [PMC free article] [PubMed] [Google Scholar]
- Kuga T, Nie H, Kazami T, Satoh M, Matsushita K, Nomura F, Maeshima K, Nakayama Y, and Tomonaga T (2014). Lamin B2 prevents chromosome instability by ensuring proper mitotic chromosome segregation. Oncogenesis 3, e94. [DOI] [PMC free article] [PubMed] [Google Scholar]
- Lammerding J, Fong LG, Ji JY, Reue K, Stewart CL, Young SG, and Lee RT (2006). Lamins A and C but not lamin B1 regulate nuclear mechanics. J Biol Chem 281, 25768–25780. [DOI] [PubMed] [Google Scholar]
- Li F, Wang X, Capasso JM, and Gerdes AM (1996). Rapid transition of cardiac myocytes from hyperplasia to hypertrophy during postnatal development. J Mol Cell Cardiol 28, 1737–1746. [DOI] [PubMed] [Google Scholar]
- Liu H, Zhang CH, Ammanamanchi N, Suresh S, Lewarchik C, Rao K, Uys GM, Han L, Abrial M, Yimlamai D, et al. (2019). Control of cytokinesis by beta-adrenergic receptors indicates an approach for regulating cardiomyocyte endowment. Sci Transl Med 11. [DOI] [PMC free article] [PubMed] [Google Scholar]
- Liu Z, Yue S, Chen X, Kubin T, and Braun T (2010). Regulation of cardiomyocyte polyploidy and multinucleation by CyclinG1. Circ Res 106, 1498–1506. [DOI] [PubMed] [Google Scholar]
- Ma L, Tsai MY, Wang S, Lu B, Chen R Iii, Zhu X, and Zheng Y (2009). Requirement for Nudel and dynein for assembly of the lamin B spindle matrix. Nat Cell Biol 11, 247–256. [DOI] [PMC free article] [PubMed] [Google Scholar]
- Magidson V, O’Connell CB, Loncarek J, Paul R, Mogilner A, and Khodjakov A (2011). The spatial arrangement of chromosomes during prometaphase facilitates spindle assembly. Cell 146, 555–567. [DOI] [PMC free article] [PubMed] [Google Scholar]
- Mollova M, Bersell K, Walsh S, Savla J, Das LT, Park SY, Silberstein LE, Dos Remedios CG, Graham D, Colan S, et al. (2013). Cardiomyocyte proliferation contributes to heart growth in young humans. Proc Natl Acad Sci U S A 110, 1446–1451. [DOI] [PMC free article] [PubMed] [Google Scholar]
- Osman NF, and Prince JL (2000). Visualizing myocardial function using HARP MRI. Phys Med Biol 45, 1665–1682. [DOI] [PubMed] [Google Scholar]
- Patterson M, Barske L, Van Handel B, Rau CD, Gan P, Sharma A, Parikh S, Denholtz M, Huang Y, Yamaguchi Y, et al. (2017). Frequency of mononuclear diploid cardiomyocytes underlies natural variation in heart regeneration. Nat Genet 49, 1346–1353. [DOI] [PMC free article] [PubMed] [Google Scholar]
- Polizzotti BD, Ganapathy B, Walsh S, Choudhury S, Ammanamanchi N, Bennett DG, dos Remedios CG, Haubner BJ, Penninger JM, and Kuhn B (2015). Neuregulin stimulation of cardiomyocyte regeneration in mice and human myocardium reveals a therapeutic window. Sci Transl Med 7, 281ra245. [DOI] [PMC free article] [PubMed] [Google Scholar]
- Ran FA, Hsu PD, Wright J, Agarwala V, Scott DA, and Zhang F (2013). Genome engineering using the CRISPR-Cas9 system. Nat Protoc 8, 2281–2308. [DOI] [PMC free article] [PubMed] [Google Scholar]
- Rober RA, Weber K, and Osborn M (1989). Differential timing of nuclear lamin A/C expression in the various organs of the mouse embryo and the young animal: a developmental study. Development 105, 365–378. [DOI] [PubMed] [Google Scholar]
- Sakaue-Sawano A, Kurokawa H, Morimura T, Hanyu A, Hama H, Osawa H, Kashiwagi S, Fukami K, Miyata T, Miyoshi H, et al. (2008). Visualizing spatiotemporal dynamics of multicellular cell-cycle progression. Cell 132, 487–498. [DOI] [PubMed] [Google Scholar]
- Salina D, Bodoor K, Eckley DM, Schroer TA, Rattner JB, and Burke B (2002). Cytoplasmic dynein as a facilitator of nuclear envelope breakdown. Cell 108, 97–107. [DOI] [PubMed] [Google Scholar]
- Soonpaa MH, Kim KK, Pajak L, Franklin M, and Field LJ (1996). Cardiomyocyte DNA synthesis and binucleation during murine development. Am J Physiol 271, H2183–2189. [DOI] [PubMed] [Google Scholar]
- Stewart C, and Burke B (1987). Teratocarcinoma stem cells and early mouse embryos contain only a single major lamin polypeptide closely resembling lamin B. Cell 51, 383–392. [DOI] [PubMed] [Google Scholar]
- Tanenbaum ME, and Medema RH (2010). Mechanisms of centrosome separation and bipolar spindle assembly. Dev Cell 19, 797–806. [DOI] [PubMed] [Google Scholar]
- Tsai MY, Wang S, Heidinger JM, Shumaker DK, Adam SA, Goldman RD, and Zheng Y (2006). A mitotic lamin B matrix induced by RanGTP required for spindle assembly. Science 311, 1887–1893. [DOI] [PubMed] [Google Scholar]
- Tzahor E, and Poss KD (2017). Cardiac regeneration strategies: Staying young at heart. Science 356, 1035–1039. [DOI] [PMC free article] [PubMed] [Google Scholar]
- Vergnes L, Peterfy M, Bergo MO, Young SG, and Reue K (2004). Lamin B1 is required for mouse development and nuclear integrity. Proc Natl Acad Sci U S A 101, 10428–10433. [DOI] [PMC free article] [PubMed] [Google Scholar]
- Walsh S, Ponten A, Fleischmann BK, and Jovinge S (2010). Cardiomyocyte cell cycle control and growth estimation in vivo--an analysis based on cardiomyocyte nuclei. Cardiovasc Res 86, 365–373. [DOI] [PubMed] [Google Scholar]
- Wei Y, Yu L, Bowen J, Gorovsky MA, and Allis CD (1999). Phosphorylation of histone H3 is required for proper chromosome condensation and segregation. Cell 97, 99–109. [DOI] [PubMed] [Google Scholar]
- Wills AA, Holdway JE, Major RJ, and Poss KD (2008). Regulated addition of new myocardial and epicardial cells fosters homeostatic cardiac growth and maintenance in adult zebrafish. Development 135, 183–192. [DOI] [PubMed] [Google Scholar]
- Yardeni T, Eckhaus M, Morris HD, Huizing M, and Hoogstraten-Miller S (2011). Retro- orbital injections in mice. Lab Anim (NY) 40, 155–160. [DOI] [PMC free article] [PubMed] [Google Scholar]
- Zerhouni EA (1993). Myocardial tagging by magnetic resonance imaging. Coron Artery Dis 4, 334–339. [DOI] [PubMed] [Google Scholar]
Associated Data
This section collects any data citations, data availability statements, or supplementary materials included in this article.
Supplementary Materials
Related to Figure 1. Cardiomyocytes were isolated from mAG-hGeminin transgenic mice at P1. The last frame of the video shows cells that were fixed and stained with a cardiac marker (α-actinin) to identify cardiomyocytes. One of those two dividing cells is cardiomyocyte. This video validates the use of the geminin-based cell cycle reporter.
Related to Figure 1. Cardiomyocytes were isolated from mouse pups (P1) expressing tnnt2-Cre and loxP-STOP-loxP-mCherry-hGeminin. Cardiomyocytes were transduced with an adenovirus leading to expression of Lmnb2- GFP under control of the CMV promoter. S, G2, and M-phases of the cell cycle are indicated in cardiomyocytes by the conditional mCherry-hGeminin reporter (red nuclei). During the observation period, four cardiomyocyte nuclei are red. Of these, one divides, two undergo binucleation, and one does not undergo karyokinesis. This video shows that increasing the expression of Lmnb2 increases cardiomyocyte karyokinesis. The duration of the movie was 24 hours and photomicrographs were taken every 20 min.
Related to Figure 3. The video was reconstructed from z-stack images taken with 100x magnification, 0.3 μm for each step, Aurora-B in green and microtubule spindle in grey.
Related to Figure 6. Representative movies of cMRI frames showing late gadolinium enhancement in the injury region of the heart at 9 dpi.
Related to Figure 7. Heart sections were stained with cardiomyocyte marker α-actinin (Grey), adherens junction Pan-Cadheren (Red), midbody marker Aurora-B kinase (Green) and DAPI. The z-stack images were taken under 100x lens with confocal microscopy and reconstructed into 3D volume view.
Related to Figure 7. Representative movie of cMRI frames showing late gadolinium enhancement 2 mm from the apex of the heart at 34 dpi.
Related to Figure 7. Representative movie of cMRI tagging 2 mm from the apex of the heart at 34 dpi.