Abstract
Introduction:
Climate change has been known to influence infectious diseases. The reason for this being the fact; disease agents and their vectors each have particular environments that are optimal for growth, survival, transport, and dissemination.
Materials and Methods:
The WHO's website was accessed to look for the Novel Coronavirus (COVID-19) situation dashboard and comprehensively study and assess the report. An attempt was made to look for countries, areas or territories with maximum and minimum number of cases of lab confirmed COVID cases. Further, we entered the words “Climate“ in google for each of the aforementioned countries and searched for the results. A comparison was established by including countries from both the hemispheres (northern and southern). The preliminary analysis was based on the reports from countries with established testing facilities for Covid-19.
Results:
The report suggests that countries with higher number of cases are the countries with cold weather. These are also the countries with low humidity which could be favoring the transmission and survival of the SARS-COV-2.
Conclusions:
The results though preliminary point to a pattern which favors the hypothesis that the extensive spread of Covid-19 maybe limited by temperature and humidity.
Keywords: COVID-19, humidity, temperature
Introduction
COVID-19, a pandemic involving almost all the nations on this planet as it began in December 2019 in Wuhan, the capital of Hubei Province of China, has been testing both primary and the emergency care. Starting as an outbreak of atypical pneumonia caused by COVID-19 (SARS-CoV-2 or 2019 nCov),[1,2] the virus has transmitted nationwide and internationally.[3,4] Clinically, public health and bench researchers across the world have been making efforts to meet with the challenges posed by the pandemic. Efforts are on to test drugs and develop vaccines; however it looks like that it may still take some time before we have some concrete evidence to test any of these. The good thing though is that scientists across the world are reading into the data obtained so far and attempting to draw conclusions. One such attempt is trying to identify a relation, if any, between temperature and humidity and the spread of the pandemic.
Climate change has been known to influence the emergence and re-emergence of many infectious diseases.[5,6,7,8] The reason for this being the fact; disease agents and their vectors each have particular environments that are optimal for growth, survival, transport, and dissemination.[9] Some known environmental factors like precipitation, temperature, humidity, and ultraviolet radiation intensity have been known to be of importance in transmission of diseases.[9] Each of these climatic factors has been known to have markedly different impacts on the epidemiology of various infectious diseases.[9] Again, it is known that infectious microorganisms have a replication rate proportional to the ambient temperature and human body temperature offers that to the microorganisms for replication and consequent disease in humans.[9] A deduction, though less well documented but apparently plausible, some infections of the human mucosal surfaces and skin are also sensitive to regional body temperatures, example being some respiratory viruses growing preferentially in the upper airways where the temperature is slightly lower than the core body temperatures.[9]
Does Covid-19 also behave differently under different climatic conditions? The current report is simply based on the data currently available and no further analysis has been conducted to avoid drawing conclusions in this fast evolving situation.
Materials and Methods
We went to the WHO's website to look for the Novel Coronavirus (COVID-19) situation dashboard and comprehensively studied and assessed the report and looked for countries, areas or territories with the number of cases of lab conformed COVID cases across the globe. We jotted down countries with maximum cases viz. United States of America, Italy, China, Iran, Spain, Germany, Republic of Korea, France, Japan, United Kingdom, and Switzerland. We also included countries with minimum number of cases. We entered the words “Climate“ in google for each of the countries and searched for the results. Out of the obtained google searches, we selectively looked for the government authorized data and narrowed down our search to understand the trends in “Temperature, Humidity, and Precipitation“ for the months of January, February, and March 2020.
All the countries thus included in this report were assigned to two hemispheres (northern and southern) based on their location to identify a comparison modifying models previously used.[10] However the analysis was restricted to countries with established healthcare systems to tackle COVID-19. Therefore only New Zealand and South Africa were included from Southern hemisphere. As already stated we did not look for independent association of each factor with COVID-19 transmission as that would seem very preliminary in fast evolving situation.
Results
The report suggests that countries with higher number of cases are the countries with cold weather (temperature is taken in degree Celsius). These are also the countries with low humidity (expressed in %) which could be favoring the transmission and survival of the SARS-COV-2. Figure 1 depicts the number of COVID-19 in 14 countries across the world.
Figure 1.
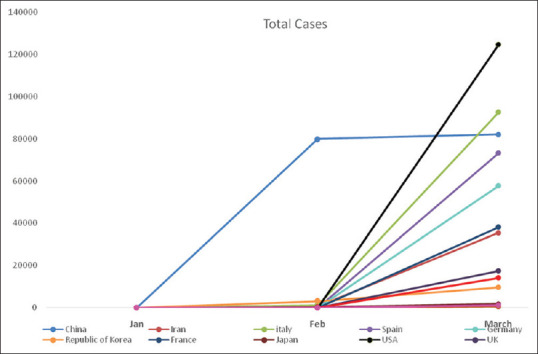
Depicts number of COVID19 cases in 14 countries from January onwards till March
For USA, the maximum temperature (°C) varies from 4 in January, 5 in February to 10 in March, whereas the minimum temperature (°C) varies from −3 in January, to 2 in February and March. The humidity (%) varies from 76 in January and February to 73 in March and precipitation (mm) varies from 95 in January, 80 in February to 110 in March. For UK, the maximum temperature (°C) varies from 8 in January and February to 11 in March, whereas the minimum temperature (°C) varies from 2 in January and February and 4 in March. The humidity (%) varies from 87 in January and 81 in February to 77 in March and precipitation (mm) varies from 55 in January to 40 in February and March [Figure 2–5].
Figure 2.
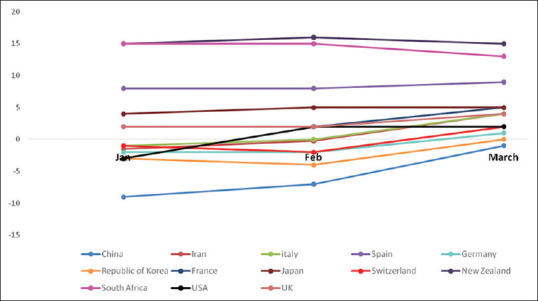
Depicts the minimum temperature from January onwards till March in countries including in the report
Figure 5.
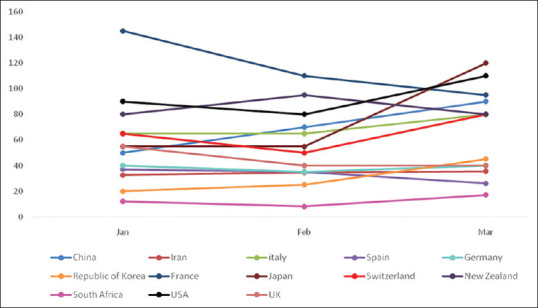
Depicts the precipitation from January onwards till March in countries including in the report
Figure 3.
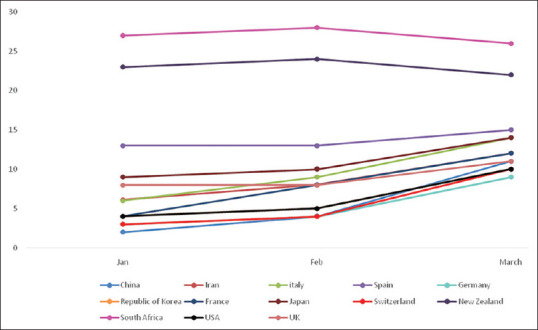
Depicts the maximum temperature from January onwards till March in countries including in the report
Figure 4.
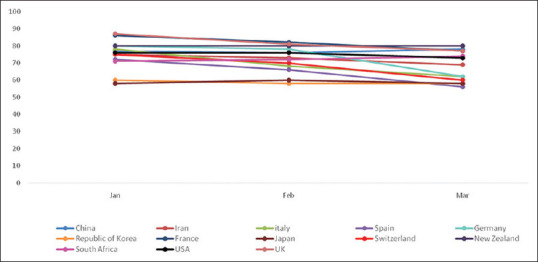
Depicts the minimum Humidity from January onwards till March in countries including in the report
For China the maximum temperature (°C) varies from 2 in the month of January, 4 in February to 11 in March, whereas the minimum temperature (°C) varies from -9 in January, -7 in February to -1 in March. The humidity (%) varies from 77 in January, 76 in February to 78 in March (almost similar) and precipitation (mm) varies from 50 in January, 70 in February to 90 in March (rise in precipitation) [Figure 2–5]. For Italy the maximum temperature (°C) varies from 6 in the month of January, 9 in February to 14 in March, whereas the minimum temperature (°C) varies from -1 in January, 0 in February to 4 in March. The humidity (%) varies from 78 in January, 68 in February to 62 in March (somewhat decreasing) and precipitation (mm) varies from 65 in January and February to 80 in March [Figure 2-5]. Similarly for Spain the maximum temperature (°C) varies from 13 in the month of January and February to 15 in March, whereas the minimum temperature (°Cs) varies from 8 in January and February to 9 in March. The humidity (%) varies from 72 in January, 66 in February to 56 in March (decreasing) and precipitation (mm) varies from 37 in January, 35 in February to 26 in March. For Germany the maximum temperature (°C) varies from 3 in the month of January, 4 in February to 9 in March, whereas the minimum temperature (°C) varies from -2 in January and February to 1 in March. The humidity (%) varies from 80 in January, 78 in February to 62 in March (decreasing) and precipitation (mm) varies from 40 in January, 35 in February to 40 in March. For France the maximum temperature (°C) varies from 4 in the month of January, 8 in February to 12 in March, whereas the minimum temperature (°C) varies from 2 in January and February to 5 in March. The humidity (%) varies from 86 in January, 82 in February to 77 in March (decreasing) and precipitation (mm) varies from 145 in January, 110 in February to 95 in March. For Iran the maximum temperature (Degree Celsius) varies from 6.1 in the month of January, 8 in February to 12 in March, whereas the minimum temperature (°C) varies from -1.5 in January, 0.2 in February to 4 in March. The humidity (%) varies from 75 in January, 73 in February to 69 in March (decreasing) and precipitation (mm) varies from 32.6 in January, 34.5 in February to 35.5 in March.
For S. Korea the maximum temperature (°C) varies from 4 in the month of January, 5 in February to 10 in March, whereas the minimum temperature (°C) varies from -3 in January, -4 in February to 0 in March. The humidity (%) varies from 60 in January, to 58 in February and March and precipitation (mm) varies from 20 in January, 25 in February to 45 in March. For Japan, the maximum temperature (°C) varies from 9 in the month of January, 10 in February to 14 in March, whereas the minimum temperature (°C) varies from 4 in January to 5 in February and March. The humidity (%) varies from 58 in January, 60 in February to again 58 in March and precipitation (mm) varies from 55 in January and February to 120 in March. For Switzerland, the maximum temperature (°C) varies from 3 in January, 4 in February to 10 in March, whereas the minimum temperature (°C) varies from -1 in January and February to 2 in March. The humidity (%) varies from 75 in January, 70 in February to again 60 in March and precipitation (mm) varies from 65 in January, 50 in February to 80 in March.
For New Zealand, the maximum temperature (°C) varies from 23 in January, 24 in February to 22 in March, whereas the minimum temperature (°C) varies from 15 in January, 16 in February to 15 in March. The humidity (%) remains same, i.e. 80 in January, February and March and precipitation (mm) varies from 80 in January, 95 in February to 80 in March. For South Africa, the maximum temperature (°C) varies from 27 in January, 28 in February to 26 in March, whereas the minimum temperature (°C) varies from 15 in January, 15 in February to 13 in March. The humidity (%) varies from 71 in January, 72 in February to 74 in March and precipitation (mm) varies from 12 in January, 8 in February to 17 in March.
Discussion
Reports published till now have shown that a one degree Celsius increase in temperature and one percent increase in relative humidity lower R by 0.0383 and 0.0224, respectively.[11] The findings of this report are consistent with the fact that the high temperature and high humidity has been seen to significantly reduce the transmission of influenza. Therefore, does this indicate that the arrival of summer and rainy season in the northern hemisphere will effectively reduce the transmission of the COVID-19.[11] Pointers towards this based on rough observations of outbreaks of COVID-19 outside China show a noteworthy phenomenon. For example, in the earlier part of the outbreak, countries with relatively lower air temperature and lower humidity (e.g. Korea, Japan, and Iran) see severe outbreaks than warmer and more humid countries (e.g. Singapore, Malaysia, and Thailand).[11] In line with the same argument, researchers at the University of Maryland School of Medicine found that the worst outbreaks were clustered in a narrow band across the Northern Hemisphere that has consistently similar weather between 30° latitude and 50° latitude North, which runs through China, South Korea, Japan, Iran, Italy, France and the U.S. Pacific Northwest.
As on date, Coronavirus Disease 2019 (COVID-19), has established significant community spread in cities and regions only along a narrow east west distribution roughly along the 30–50 N'' corridor at consistently similar weather patterns (5–11°C and 47–79% humidity).[11] Importantly also, as on date, there has been a lack of significant community establishment in expected locations that are based only on population proximity and extensive population interaction through travel, suggesting a simplified model that shows a zone at increased risk for COVID-19 spread.[10] This assumes significance in view of the fact that public health approaches like social distancing and lock downs are fast acquiring the status of principal preventive measure to contain the distance. Using the knowledge acquired on temperature and humidity, localization of a zone of susceptibility will further increase the significance of lock downs and social distancing. Such targeted lock downs will not only ensure fruitful diseases prevention but also better provision of healthcare with little adverse implications for economy. In future, it may be possible to predict the region's most likely to be at higher risk of significant community spread of COVID-19, using weather modeling, allowing for concentration of public health efforts on surveillance and containment.[11]
Conclusions
The results though preliminary point to a pattern which favors the hypothesis that the extensive spread of COVID-19 may be limited by temperature and humidity. Therefore, it may be possible to predict the region's most likely to be at higher risk of significant community spread of COVID-19, using weather modeling, allowing for concentration of public health efforts on surveillance and containment. This will also allow us to view measures like the social distancing measures and lockdowns in a more restrictive manner than currently used.
Financial support and sponsorship
Nil.
Conflicts of interest
There are no conflicts of interest.
Acknowledgement
We acknowledge the help provided by Dr. Suresh Kumar, Dr. Shweta Kanwal and Dr. Tarun, residents in the department of Community Medicine.
References
- 1.Wu F, Zhao S, Yu B, Chen YM, Wang W, Song ZG, et al. A new coronavirus associated with human respiratory disease in China. Nature. 2020;579:265–9. doi: 10.1038/s41586-020-2008-3. [DOI] [PMC free article] [PubMed] [Google Scholar]
- 2.Zhou P, Yang X-L, Wang XG, Hu B, Zhang L, Zhang W, et al. A pneumonia outbreak associated with a new coronavirus of probable bat origin. Nature. 2020;579:270–3. doi: 10.1038/s41586-020-2012-7. [DOI] [PMC free article] [PubMed] [Google Scholar]
- 3.Li Q, Guan X, Wu P, Wang X, Zhou L, Tong Y, et al. Early transmission dynamics in Wuhan, China, of novel coronavirus infected pneumonia. N Engl J Med. 2020;82:1199–207. doi: 10.1056/NEJMoa2001316. [DOI] [PMC free article] [PubMed] [Google Scholar]
- 4.Callaway E. Time to use the p-word? Coronavirus enters dangerous new phase. Nature. 2020 doi: 10.1038/d41586-020-00551-1. doi: 101038/d41586-020-00551-1. [DOI] [PubMed] [Google Scholar]
- 5.IPCC. Climate Change 2014 Synthesis Report Summary for Policy Makers. Geneva: Inter-Governmental Panel on Climate Change; 2014. [Google Scholar]
- 6.Barros VR, Field CB, Dokken DJ, et al. IPCC, 2014: Summary for Policymakers. In: Climate Change 2014: Impacts, Adaptation, and Vulnerability. Cambridge, United Kingdom and New York, NY, USA: Cambridge University Press; pp. 1–32. [Google Scholar]
- 7.Rodriguez-Morales A, Echezuria L, Risquez A. Impact of Climate Change on Health and Disease in Latin America, Climate Change and Variability, Suzanne Simard, IntechOpen. DOI: 105772/9822. Available from: https://wwwintechopencom/books/climate-change-and-variability/impact-of-climate-change-on-health-and-disease-in-latin-america .
- 8.Cascio A, Bosilkovski M, Rodriguez-Morales AJ, Pappas G. The socio-ecology of zoonotic infections? Clin Microbiol. 2011;17:336–42. doi: 10.1111/j.1469-0691.2010.03451.x. doi: 10.1111/j. 1469-0691.2010.03451.x. [DOI] [PubMed] [Google Scholar]
- 9.National Research Council (US) Committee on Climate, Ecosystems, Infectious Diseases, and Human Health, Under the Weather: Climate, Ecosystems, and Infectious Disease. Washington (DC): National Academies Press (US); 2001. [PubMed] [Google Scholar]
- 10.Sajadi MM, Habibzadeh P, Vintzelos A, Shokouhi S, Miralles-Wilhelm F, Amoroso A. Temperature, humidity and latitude analysis to predict potential spread and seasonality for COVID19. Available from: https://ssrncom/abstract=3550308 . [DOI] [PMC free article] [PubMed]
- 11.Wang J, Tang K, Feng K, Lv W. High Temperature and High Humidity Reduce the Transmission of COVID-19 SSRN. 2020. Available from: https://ssrncom/abstract=3551767 or http://dxdoiorg/102139/ssrn 3551767 .


