

Abstract
High-grade serous carcinoma, accounts for up to 70% of all ovarian cases. Furin, a proprotein convertase, is highly expressed in high-grade serous carcinoma of ovarian cancer patients, and its expression is even higher in tumor omentum than in normal omentum, the preferred site of ovarian cancer metastasis. The proteolytic actions of this cellular endoprotease helps the maturation of several important precursors of protein substrates and its levels increase the risk of several cancer. We show that furin activates the IGF1R/STAT3 signaling axis in ovarian cancer cells. Conversely, furin knockdown downregulated IGF1R-β and p-STAT3 (Tyr705) expression. Further, silencing furin reduced tumor cell migration and invasion in vitro and tumor growth and metastasis in vivo. Collectively, our findings show that furin can be an effective therapeutic target for ovarian cancer prevention or treatment.
Introduction
Ovarian cancer is the fifth-leading cause of cancer-related deaths among women, and it is the deadliest of gynecologic cancers. It’s high mortality rate is primarily due to the difficulty of diagnosing it early. Late diagnosis results in low cure rates (1). The majority (90%) of ovarian cancer cases are epithelial tumors, most commonly high-grade serous carcinomas (2–4).
Epidermal growth factor (EGF) receptors (the typical receptor tyrosine kinases) consist of four receptors: ERBB1, ERBB2, ERBB3, and ERBB4. When each one binds to its preferred ligand, intracellular tyrosine kinase activity follows (5–9). ERBB2 is the most potent oncoprotein with strong kinase activity, but no ligand has been identified to date. Conversely, ERBB3 is devoid of intrinsic kinase activity but often dimerizes with ERBB2 upon binding to the ligand neuregulin (NRG1) (10). Previous studies have shown that heterodimers of ERBB2 and ERBB3 induce potent downstream signaling critical for oncogenesis (10). In conjunction with those studies, we have demonstrated that the ERBB3-NRG1 axis is a dominant pathway for hematogenous metastasis of ovarian cancer cells (11). We demonstrated that elevated levels of ERBB3 in metastatic cells cause hematogenous metastasis and that NRG1 in the omentum allows tumor cells to localize and grow at that site (11, 12). Furthermore, disrupting the ERBB3-mediated signaling pathway, using target-specific siRNA and anti-ERBB3 monoclonal antibodies, reduced the metastatic spread of this disease (11).
Unexpectedly, we found that NRG1 stimulation alter the levels of endoprotesaes that are important for protein maturation in ovarian cancer cells. While the effects of ERBB on downstream signaling in cancer cells are well characterized, it is unclear how ERBB signaling regulates endoproteases for the maturation of proproteins to mature proteins. In the current study, we identified a novel mechanism that ERBB signaling increases levels of an endoprotease enzyme furin. This endoprotease proteolytically activates a large number of proprotein substrates, such as pro-ADAM, pro-MT1-MMP, pro-PDGF, and pro-mesothelin (13–15), resulting in the maturation of these proteins with putative oncogenic. Enhanced furin expression has been reported in various cancer types, and furin activity promotes many cancer-related processes such as cell proliferation, migration, and invasion (16–19). In addition, increased expression of furin predicts decreased survival in ovarian cancer (20). However, furin’s function in ovarian cancer is unclear. In this study, we uncovered a previously unrecognized mechanism: ERBB signaling upregulates furin in highly metastatic ovarian cancer cells via IGF1R maturation and subsequent activation of the STAT3 transcription factor.
Results
ERBB2/ERBB3 signaling regulates furin expression in ovarian cancer
To investigate whether furin is regulated by ERBB3, we used NRG1 to stimulate ERBB receptors that cause dimerization of ERBB3 and ERBB2 in ovarian cancer cells, such as OVCAR5 and SKOV3. Our results showed that NRG1 induced the phosphorylation of p-ERBB2 (Y1248) and p-ERBB3 (Y1289) (Fig. 1A and Fig. 1B) and upregulated furin levels (Fig. 1C, Fig. 1D and Supplementary Fig. 1A). To determine if blocking of ERBB3-signaling will reduce furin levels, we used an ERBB3 inhibitor, AZD8931, to treat OVCAR5 and SKOV3 cells at different time points with or without NRG1 stimulation. Our data shows that AZD8931 reduced the phosphorylation of p-ERBB2 (Y1248) and p-ERBB3 (Y1289) and also lowered the levels of furin (Fig. 1E, Fig. 1F and Supplementary Fig. 1B) suggesting that furin is a direct downstream effector of ERBB3 signaling. Importantly, the delivery of NRG1 siRNA-encapsulated nanoliposomes into mice bearing ovarian cancer cells also reduced furin levels in ovarian tumor (Supplementary Fig. 1C). Matrix metalloproteinase is one of the metalloproteinases specialized in degrading the extracellular matrix and allows cancer cells to escape from their in-situ location and intravasate into the bloodstream. Furin is an activator for MMP14, MMP15 and MMP17. In our results, we found that in addition to increasing furin levels, NRG1 stimulation also induced the expression of matrix metalloprotease (MMP)-14, MMP-15, and MMP-17 overtime points up to 48 h in OVCAR5 cells (Supplementary Fig. 1D and 1E).
Fig. 1. Furin was regulated by NRG1 stimulation through ERBB receptors.
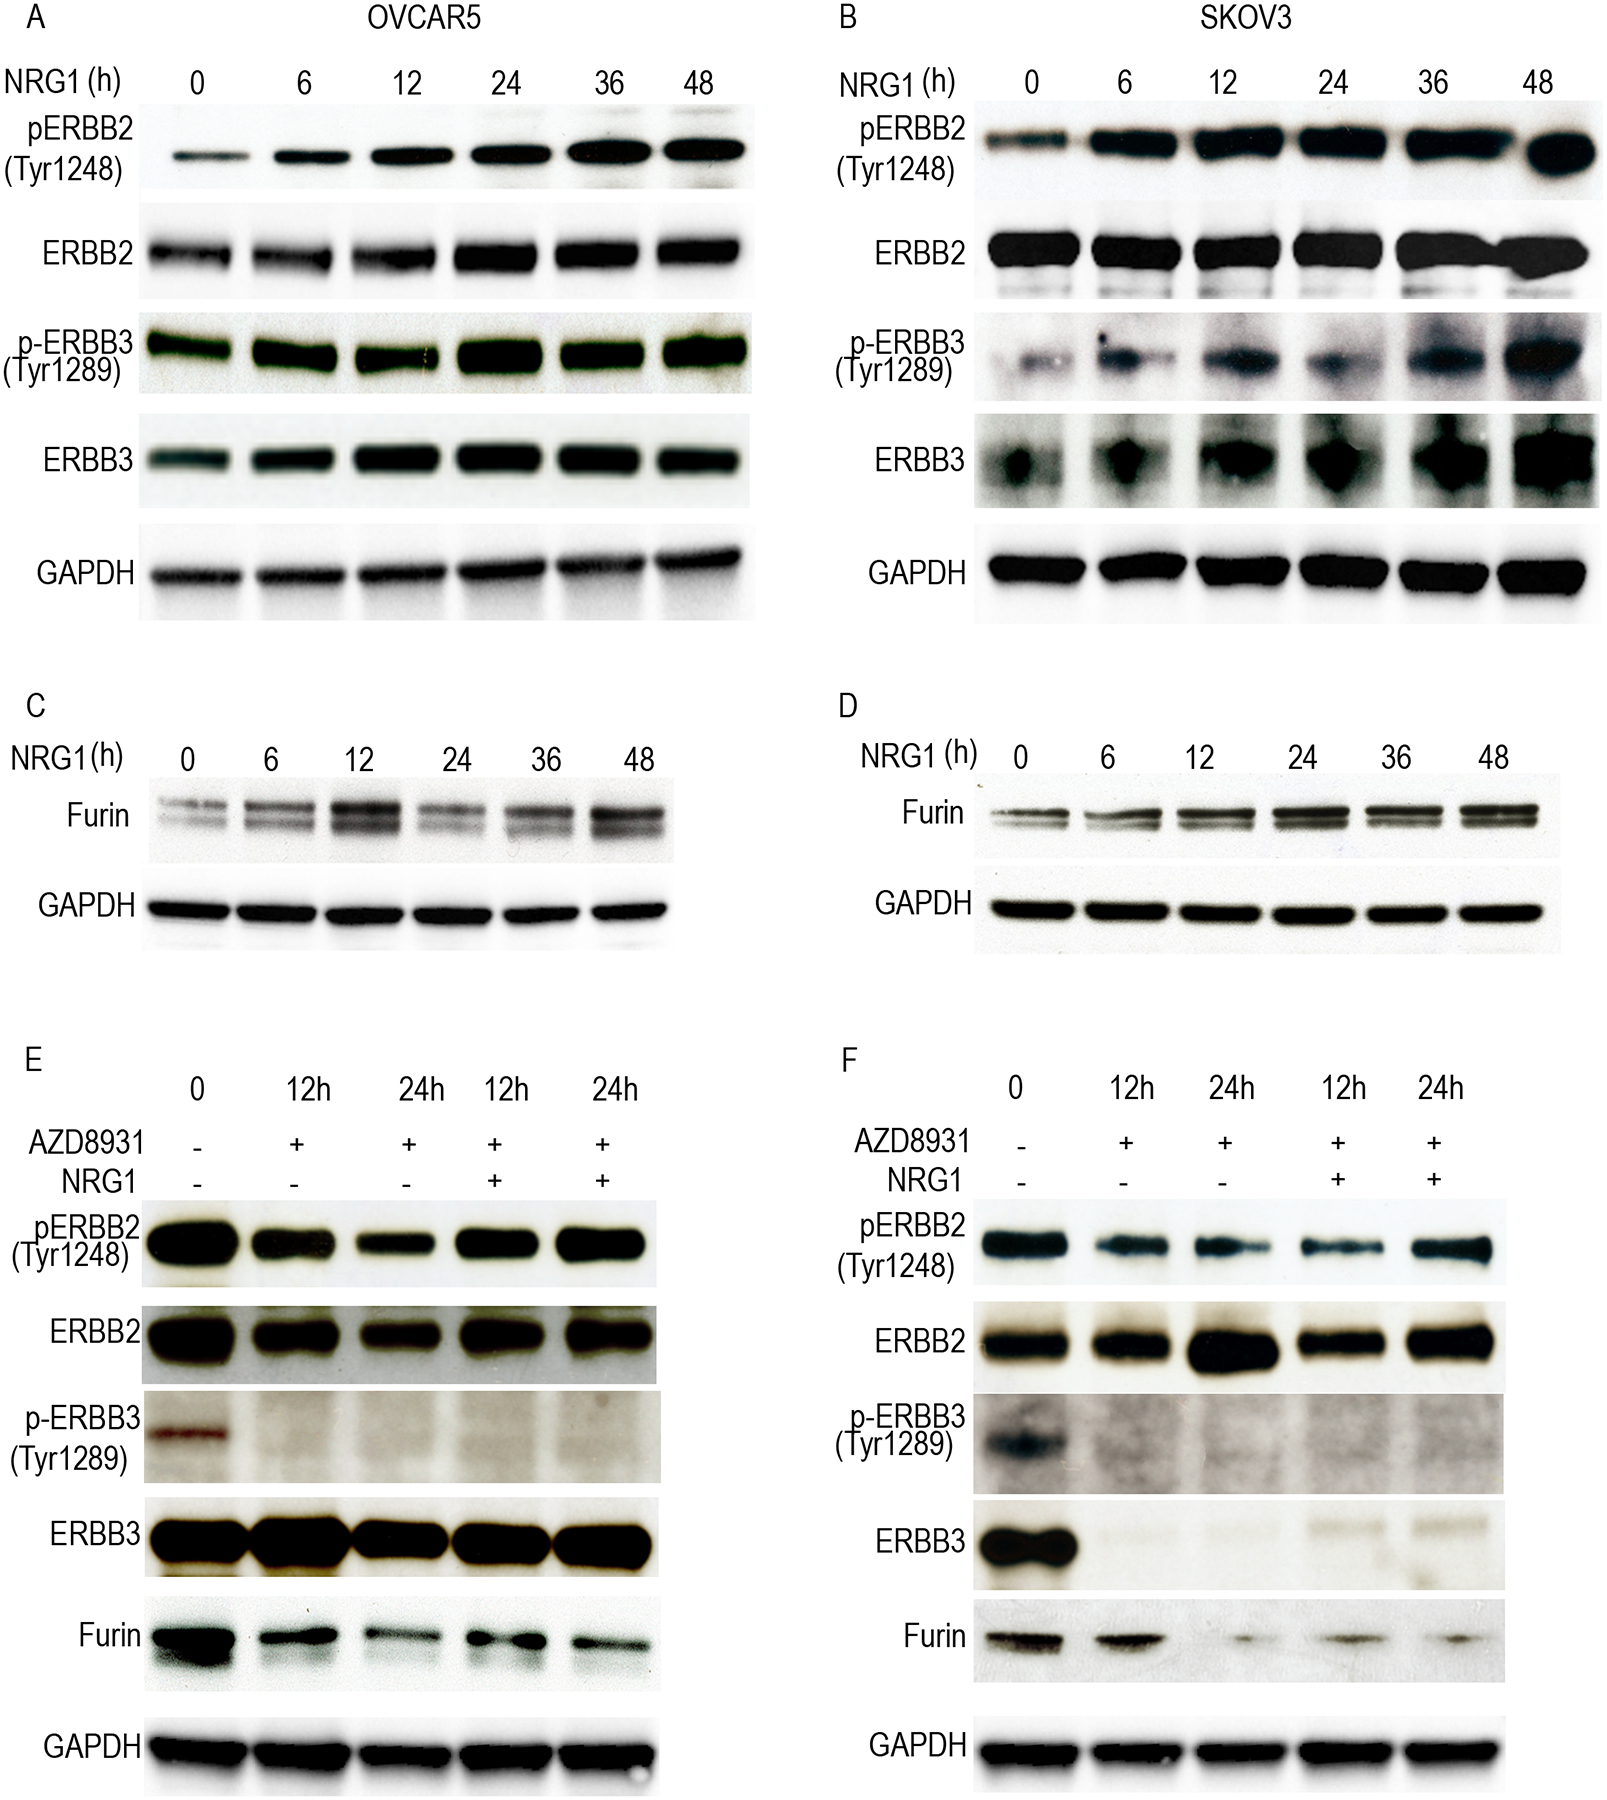
A and B, Cell lysates of NRG1 (20ng/ml) stimulation at the different timepoints were immunoblotted against ERBB receptors in OVCAR5 (A) and SKOV3 (B) cell lines. C and D, Cell lysates of NRG1 stimulation at the different time points cells were collected and immunoblotted against furin in OVCAR 5 (C) and SKOV3 (D). E and F. Cell lysates of ERBB3 inhibitor (AZD8931) treatment with or without NRG1 (20ng/ml) stimulation in the different times points were collected and immunoblotted against fruin and ERBB receptors in OVCAR 5 (E) and SKOV3 (F).
Furin expression associates with poor outcomes in ovarian cancer patients
To characterize furin’s oncogenic role in ovarian cancer, we examined its expression in clinical ovarian cancer patient tissue by western blotting. We found that furin is highly expressed in the tumor tissues as well as in ascites samples (Fig. 2A). To further correlate if furin makes any association with cancer aggressiveness in those samples, we have determined the levels of mesenchymal marker Vimentin, markers for cancer stem cells and ERBB family proteins. As expected, we found that the samples express high levels of furin also express high levels of CD44, high levels of vimentin, low levels of CD24 and high levels of native and phosphorylated forms of EGFR, ERBB2 and ERBB3 (Fig. 2B).
Fig 2. Furin is highly expressed in ovarian cancer patients.
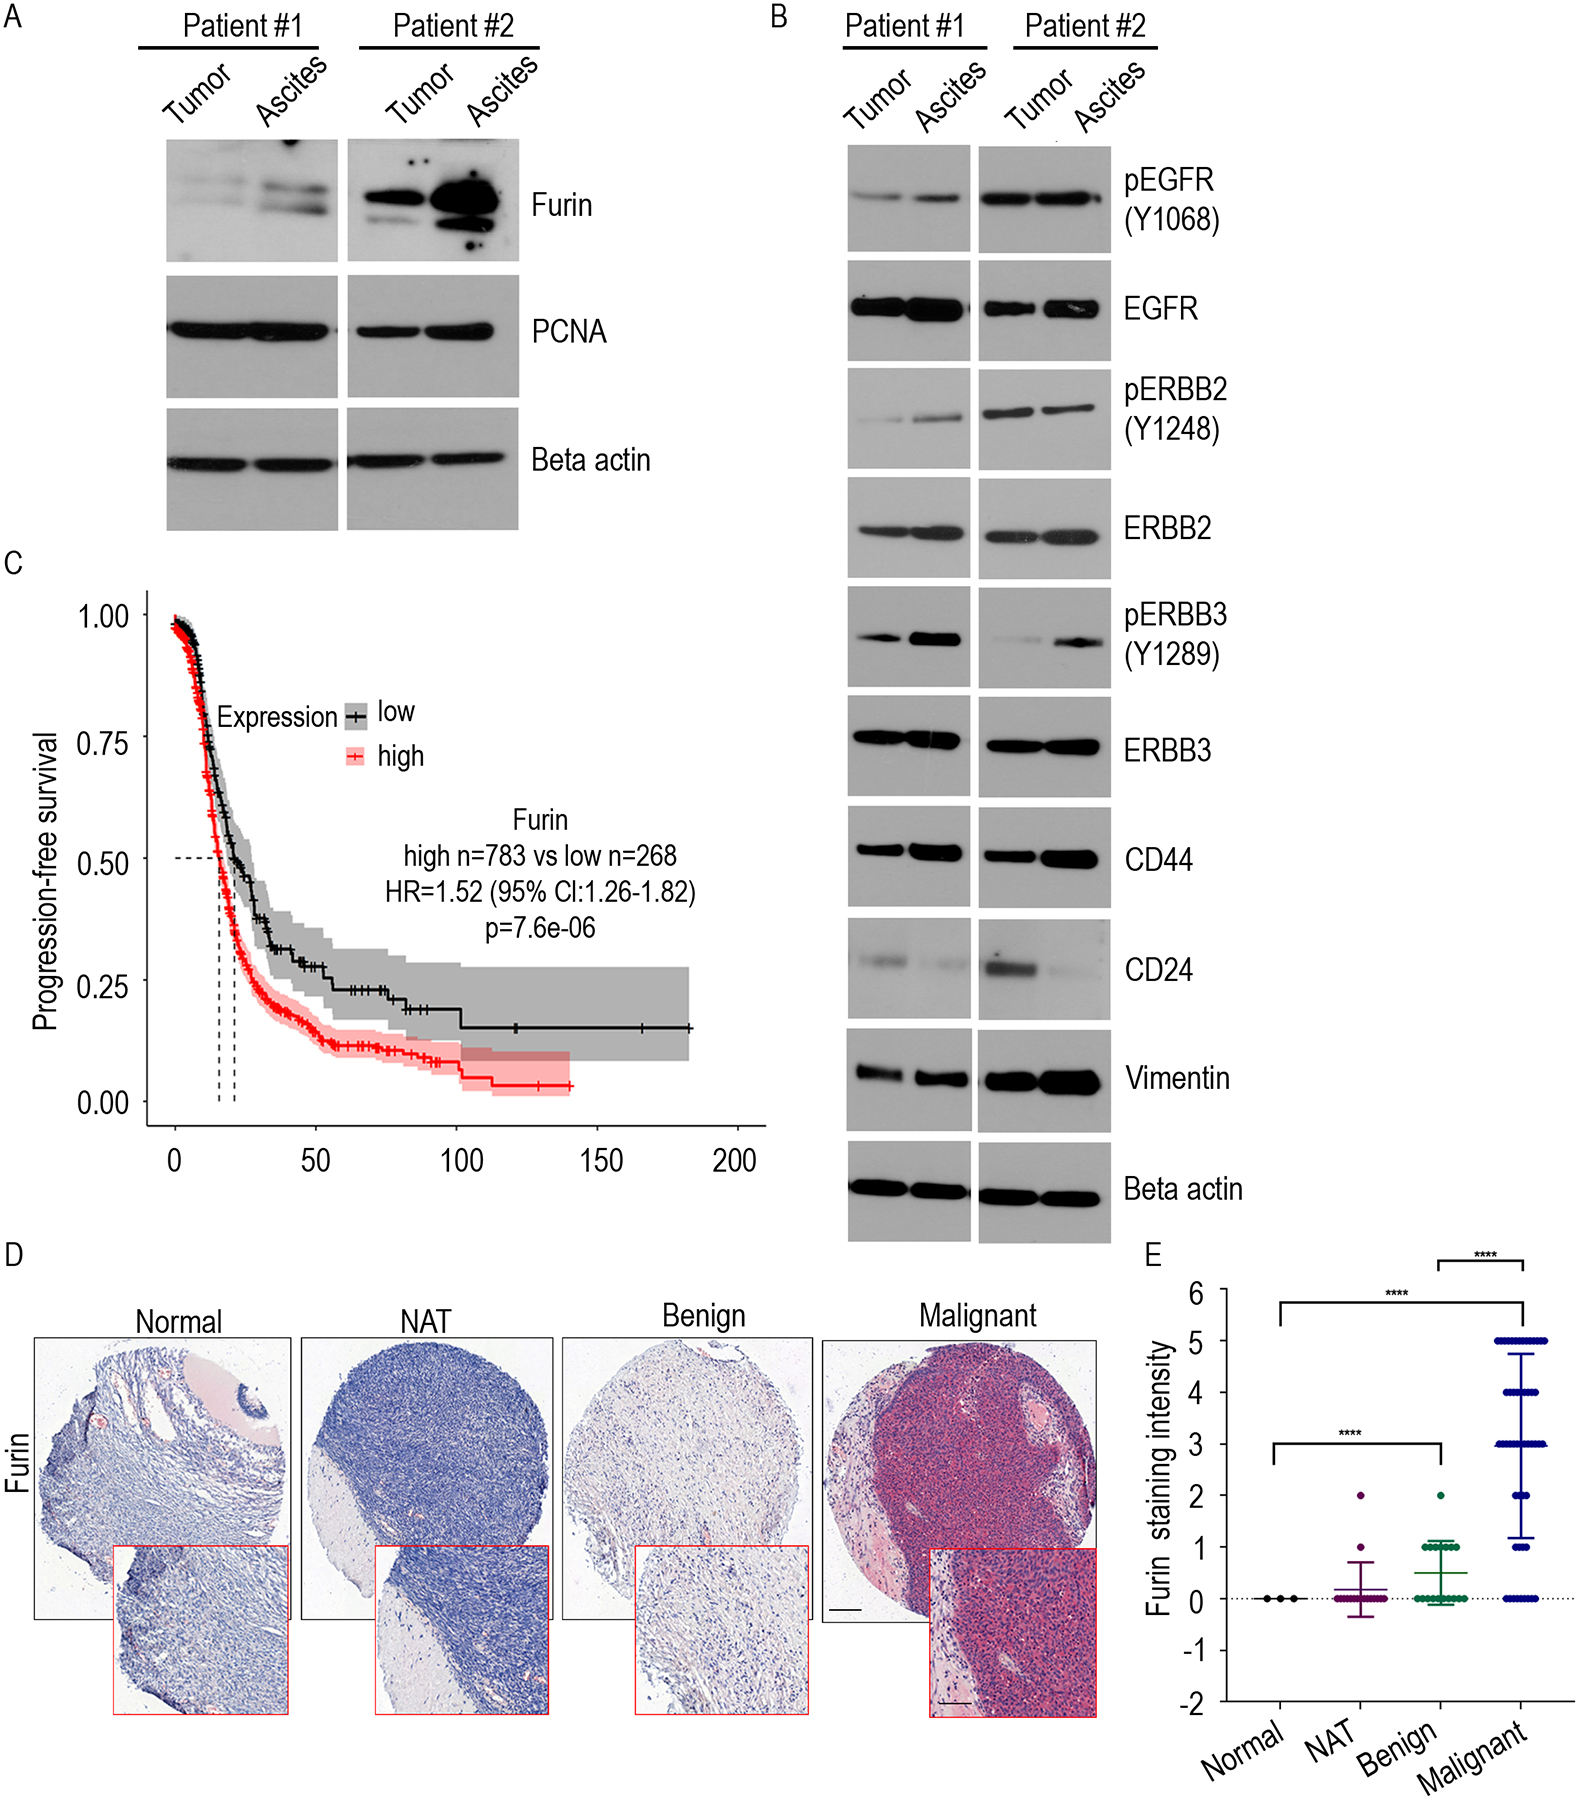
A. Immunoblot of indicated proteins were determined from the ovarian tumor and tumor cells isolated from the ascites fluid of ovarian cancer patients. B. Immunoblot of indicated proteins were determined from the ovarian tumor and, tumor cells isolated from the ascites fluid of ovarian cancer patients. C. Kaplan–Meier curves of Progression-free survival for furin expression in patients with stage II-IV serous ovarian cancer patients (high n=783, low n=268). D. Ovarian cancer tissue microarray was stained with an antibody that recognizes furin. Slides were visualized under 10x of delineated areas, scale bar: 200μm. E. Furin staining intensity in each group from (D) were quantified. ***p<0.0001.
We then assessed the effect of furin on patient survival using a publicly available ovarian cancer data set (21). Herein, our analysis using the mRNA expression dataset demonstrated a reduced progression-free and overall survival in the serous ovarian cancer patients in stage II–IV, whose samples express high level of furin expression (Fig. 2C and Supplementary Fig. 2A), suggesting that a significantly unfavorable prognosis associated with high furin expression. To confirm our results, we used immunohistochemical staining to examine furin expression on tissue microarrays (TMA) from a cohort of advanced-stage ovarian cancer patients. There were 62 malignant tissues, 18 benign tissues, 17 normal adjacent ovarian tissues (NAT), and 3 normal ovarian tissues. This TMA analysis demonstrated that furin was highly expressed in the malignant tissue (Fig. 2D, Fig. 2E and Supplementary Fig. 2B). Collectively, these data show that high furin expression in the tumor is associated with poor prognosis for ovarian cancer patients.
Downregulating furin inhibits cell migration, invasion, and spheroid formation
To investigate furin’s role in ovarian cancer cells, we prepared two different lentiviral-introduced furin short hairpin RNAs in OVCAR5 and SKOV3 cells and first confirmed the loss of expression of furin by western blotting (Fig. 3A, Fig. 3B and Supplementary Fig.3A). Next, we used a Transwell assay to evaluate furin’s effect on ovarian cancer cell migration and cell invasion. Silencing furin will not affect the viability (Supplementary Fig.3B), and both the migration and invasion of OVCAR5 and SKOV3 cancer cells were significantly reduced (Fig. 3C and Fig. 3D). We also investigated the spheroid formation and found a significant reduction in the size and number of spheroids that formed when those cells were grown in non-adherent conditions (Fig. 3E and Fig. 3F). These results show that furin is involved in cell migration, cell invasion, and spheroid formation in ovarian cancer cells.
Fig 3. Cell migration, cell invasion and spheroid formation were reduced by Furin knockdown.
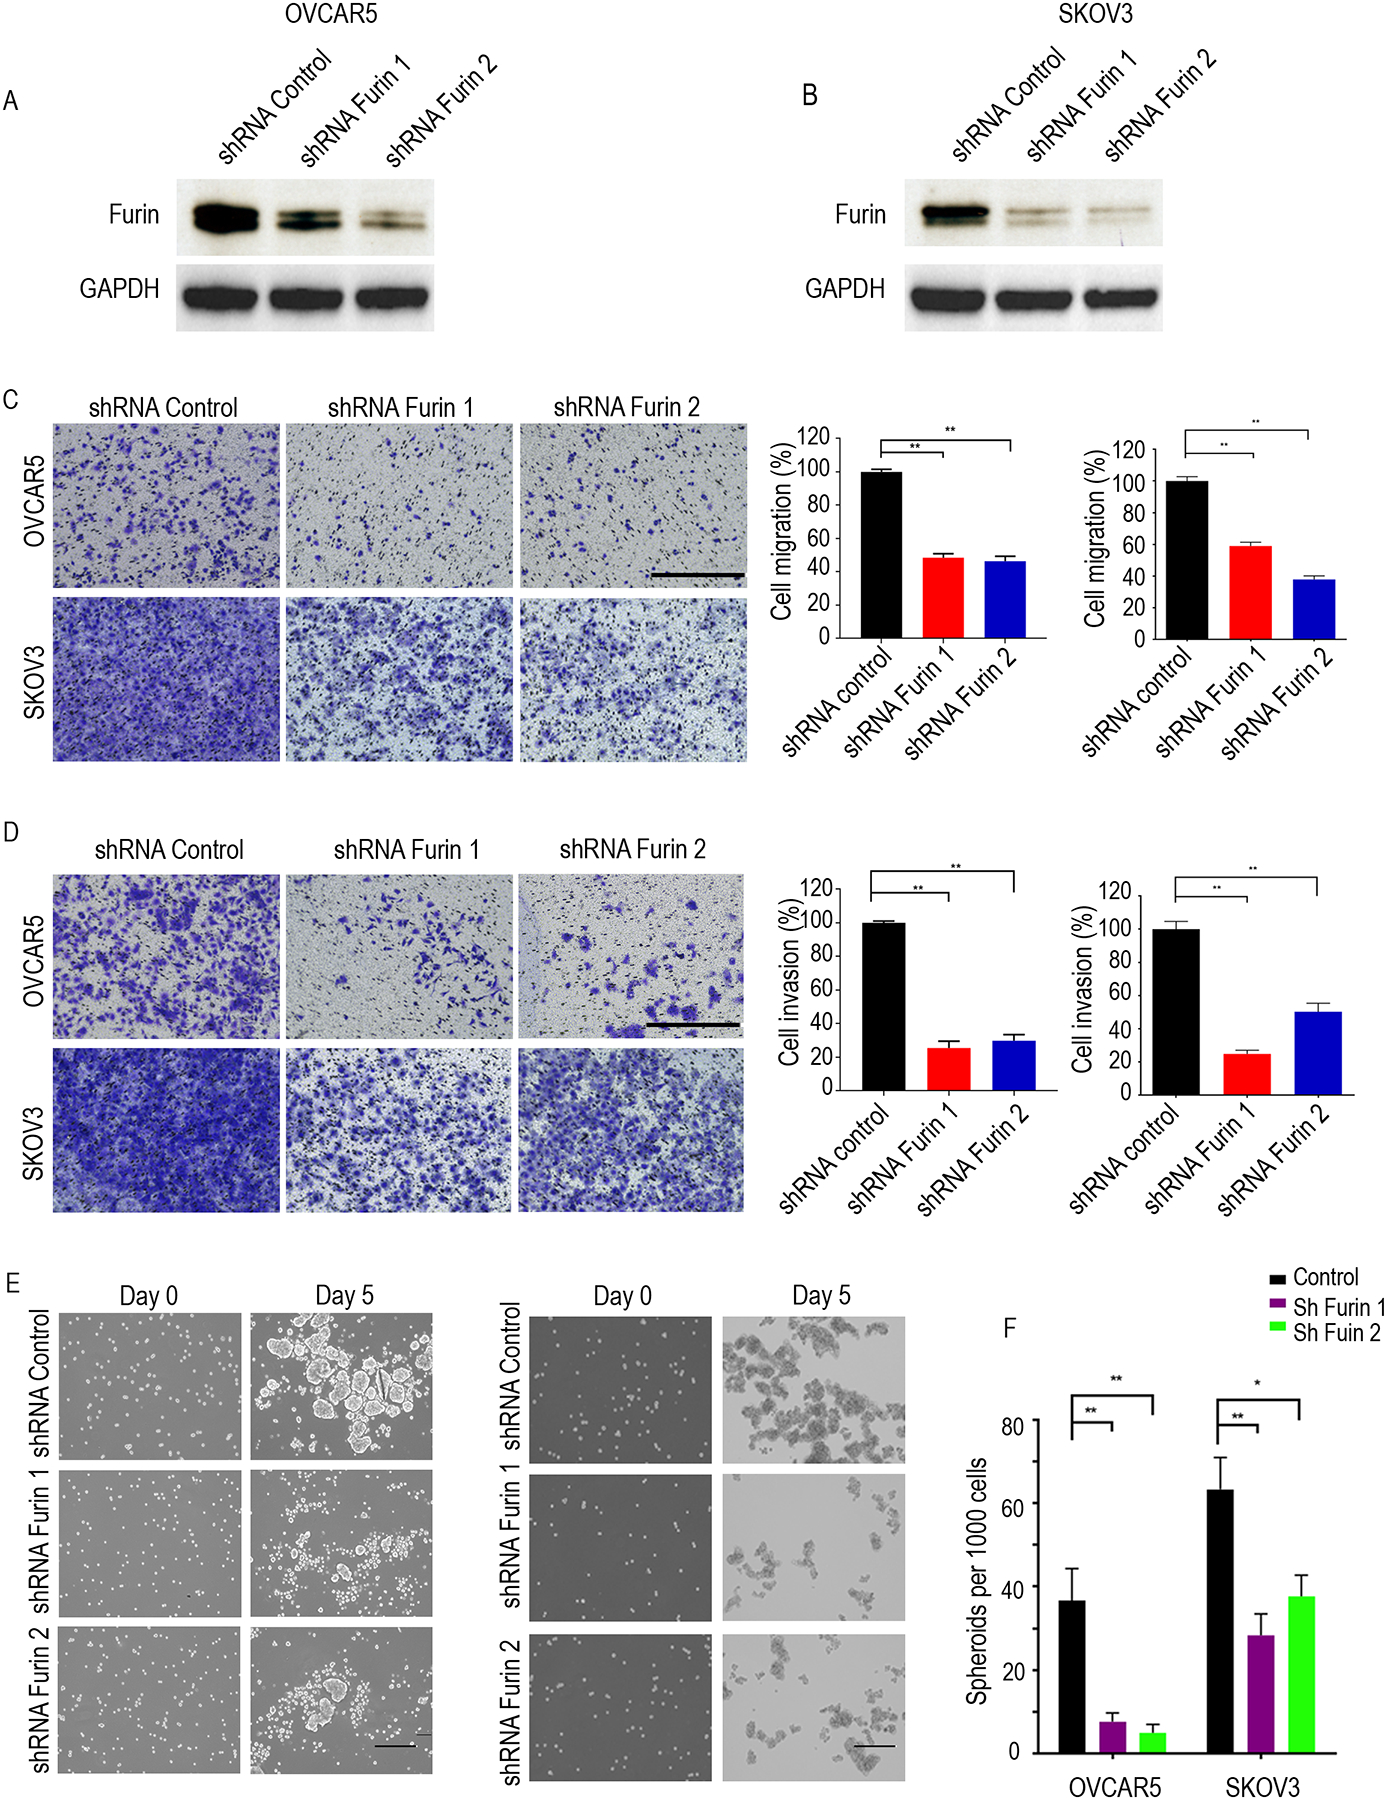
A and B. Western blotting of OVCAR5 (A) and SKOV3 (B) in the control and furin knockdown cell lysates. C. Cell migration assay in SKOV3 and OVCAR5 (n=3). Cells on the undersurface of Transwell chambers were stained and images were taken under a phase contrast microscope. Bright-field microscope at 10x magnification used and scaled bars represent 450 μm. D. Cell invasion assay in SKOV3 and OVCAR5 (n=3). Cells on the undersurface of Transwell chambers were stained and images were taken under a phase contrast microscope. Bright-field microscope at 10x magnification used and scaled bars represent 450 μm. E. Spheroid formation. Phase contrast micrographs of day 0 and day 5 in ultra-low attachment plate culture. Bright-field microscope at 10x magnification used and scaled bars represent 200 μm. F. Quantification the number of spheroids on day 5. *p<0.05, **p<0.01.
Loss of furin downregulated IGF1R- β expression in ovarian cancer cells
Furin processes a wide variety of cancer-related substrates, including pro-TGF-β, pro-IGF1R- β, and pro-mesothelin (14). To investigate the critical downstream targets of furin in ovarian cancer, we performed immunoblot analysis to detect TGF-β, IGF1R- β, and mesothelin expression after furin knockdown in OVCAR5 and SKOV3 cell lines. Loss of furin led to markedly increased levels of pro-IGF1R-β and reduced levels of mature IGF1R- β (Fig. 4A and Fig. 4B). However, we did not observe changes in the levels of the pro and mature forms of TGF- β or mesothelin with the two different shRNAs in either cell line indicating a level of specificity to furin’s substrate preference in ovarian cancer cells.
Fig 4. IGF1R-β was downregulated by furin knockdown.
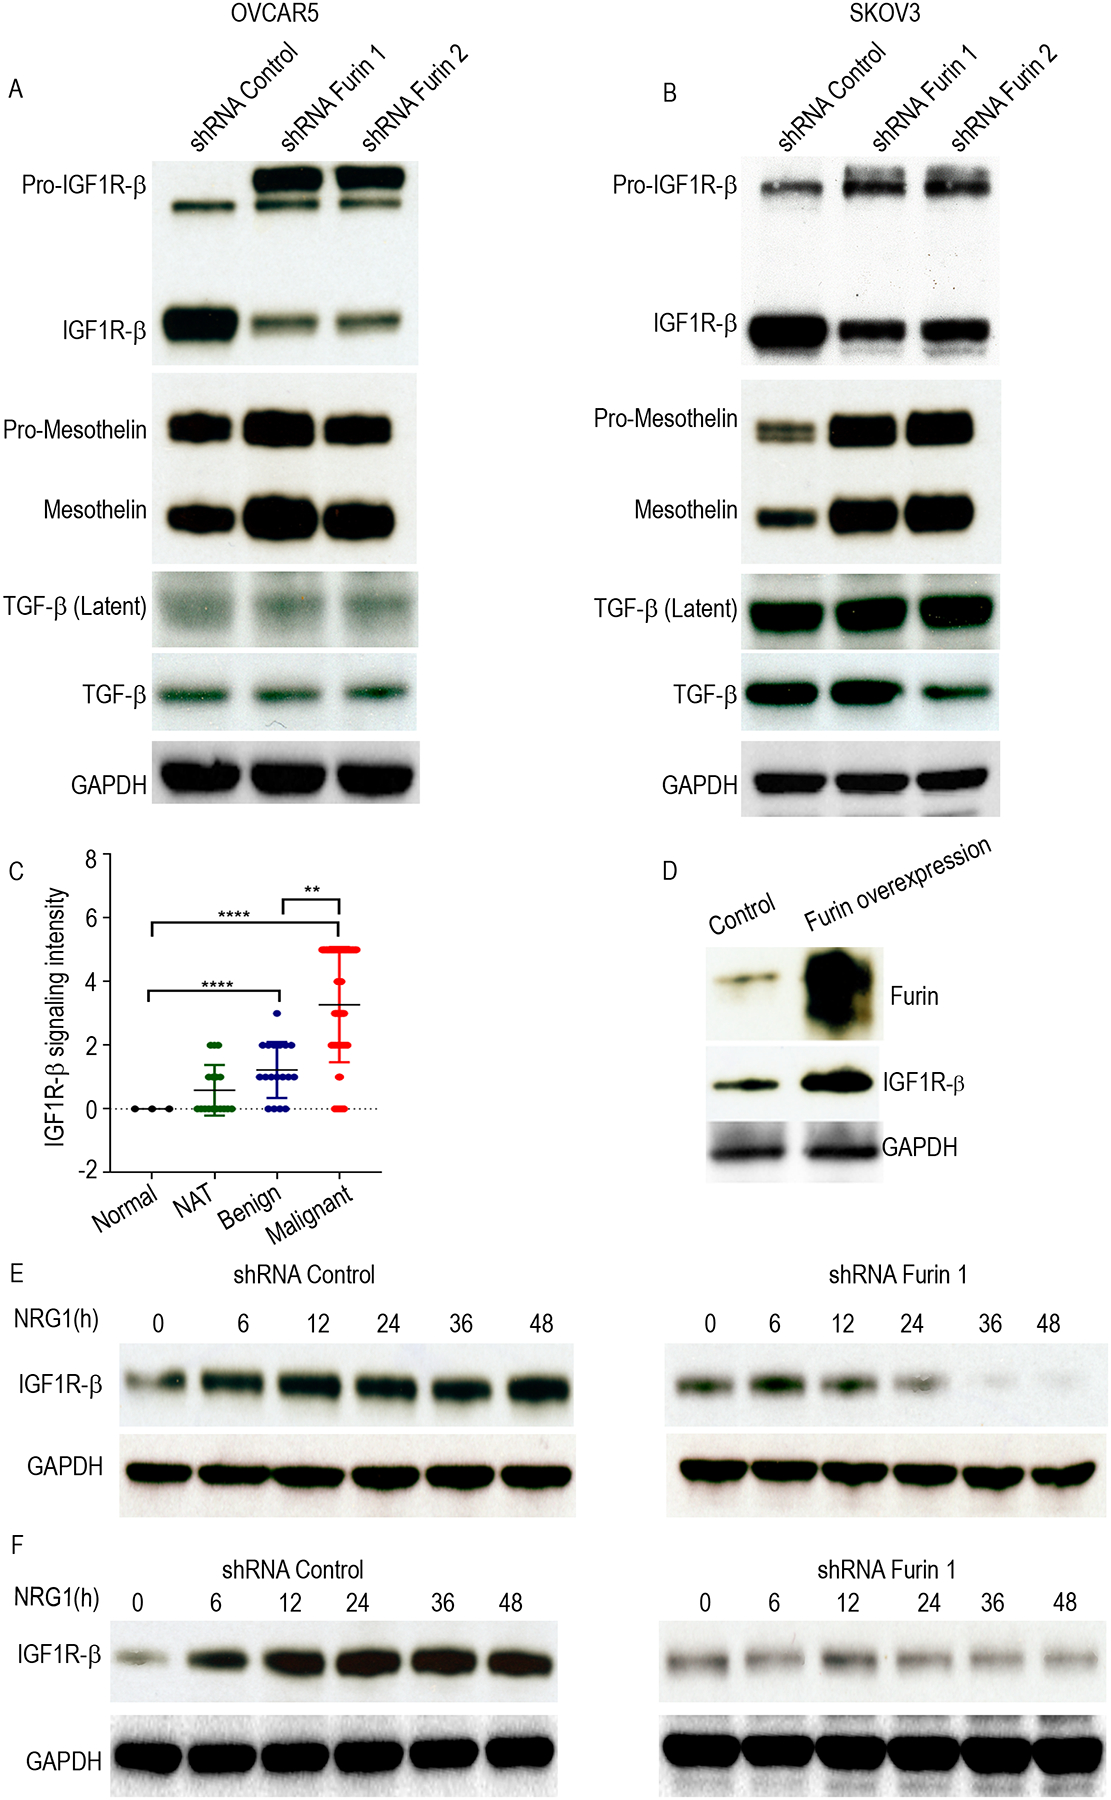
A and B. Cell lysates of shRNA control, shRNA furin 1 and shRNA furin 2 cells were immunoblotted against IGF1R-b, Mesothelin and TGF-β in OVCAR5 (A) and SKOV3 (B). C. Western blot of tissue lysate from the normal and tumor omentum of ovarian cancer patients against IGF1R-β. D. Scatter plot to show the IGF1R-β staining intensity in ovarian tumor tissue (n=62), normal adjacent ovarian tissue (17), benign tissue (18) and normal ovarian tissue (3). E. Western blot to test furin overexpression in HeyA8 cells. (E, F). Cell lysates of NRG1 stimulation in the different time points in the shRNA control or shRNA furin cell lines were collected and immunoblotted against IGF1R-β in OVCAR 5 (E) and SKOV3 (F). ****p<0.0001. **p<0.01.
To further explore the association of furin and IGF1R-βexamined mature IGF1R-β in tumor tissues adjacent to those we analyzed for furin expression using the ovarian tissue TMA (Supplementary Fig. 4A and 4B). Our analysis showed that the high-grade serous ovarian cancer tissues that expressed high levels of furin (Fig. 2D, and 2E) also expressed high levels of IGF1R-β (Fig. 4C). To confirm our results, we overexpressed furin in Hey-A8 cell lines, which expresses low levels of furin, and found that ectopic expression of furin upregulated levels of mature IGF1R- β (Fig. 4D).
To investigate whether furin is required for the expression of mature IGF1R-β, we used NRG1 to stimulate OVCAR5 and SKOV3 cells that stably expressed scrambled sh-RNA sequences or furin-shRNA and measured expression of IGF1R-β at multiple time points. NRG1 stimulation increased levels of mature IGF1R-β shRNA control cells. Strikingly, silencing furin in SKOV3 and OVCAR5, abolished the increase in levels of IGF1R-β and the expression of mature IGF1R-β after 24h of stimulation with NRG1 (Fig. 4E and 4F). Collectively, our results show that furin is necessary for the maturation of IGF1R-β.
Furin regulates JAK1/STAT3 pathway in ovarian cancer cells
IGF1R activation causes the phosphorylation and nuclear translocation of STAT3 (22). In turn, phosphorylation causes STAT3 to dimerize and enter the nucleus for transcription of genes that participate in cancer-associated phenotypes, such as survival, angiogenesis, metastasis, and immune evasion (23, 24). To investigate whether furin regulates IGF1R-mediated STAT3 activation in ovarian cancer cells, we measured levels of pTYK2 (Tyr1054/1055), pJAK1 (Tyr1034/1035), pJAK2 (Tyr1008) and p-STAT3 (Tyr705) in furin knocked down ovarian cancer cells. Importantly, loss of furin markedly reduced the levels of pJAK1 (Tyr1034/1035) and p-STAT3 (Tyr705) (Fig. 5A, 5B Supplementary Fig. 5A and 5B). Together, our results show that JAK1/STAT3 pathway is dysregulated by furin in ovarian cancer. We also found that NRG1 induced phosphorylation of STAT3 (Y705) was reduced by WP1066 treatment in the ovarian cancer cells OVCAR5 and SKOV3 (Fig. 5C–5E). As expected we also found that the treatment of WP1066 reduced the migration and invasion of OVCAR5 and SKOV3 cell lines in a dose-dependent manner (Fig. 5F and Fig. 5G).
Fig 5. p-STAT3 (Tyr705) was reduced by furin knockdown.
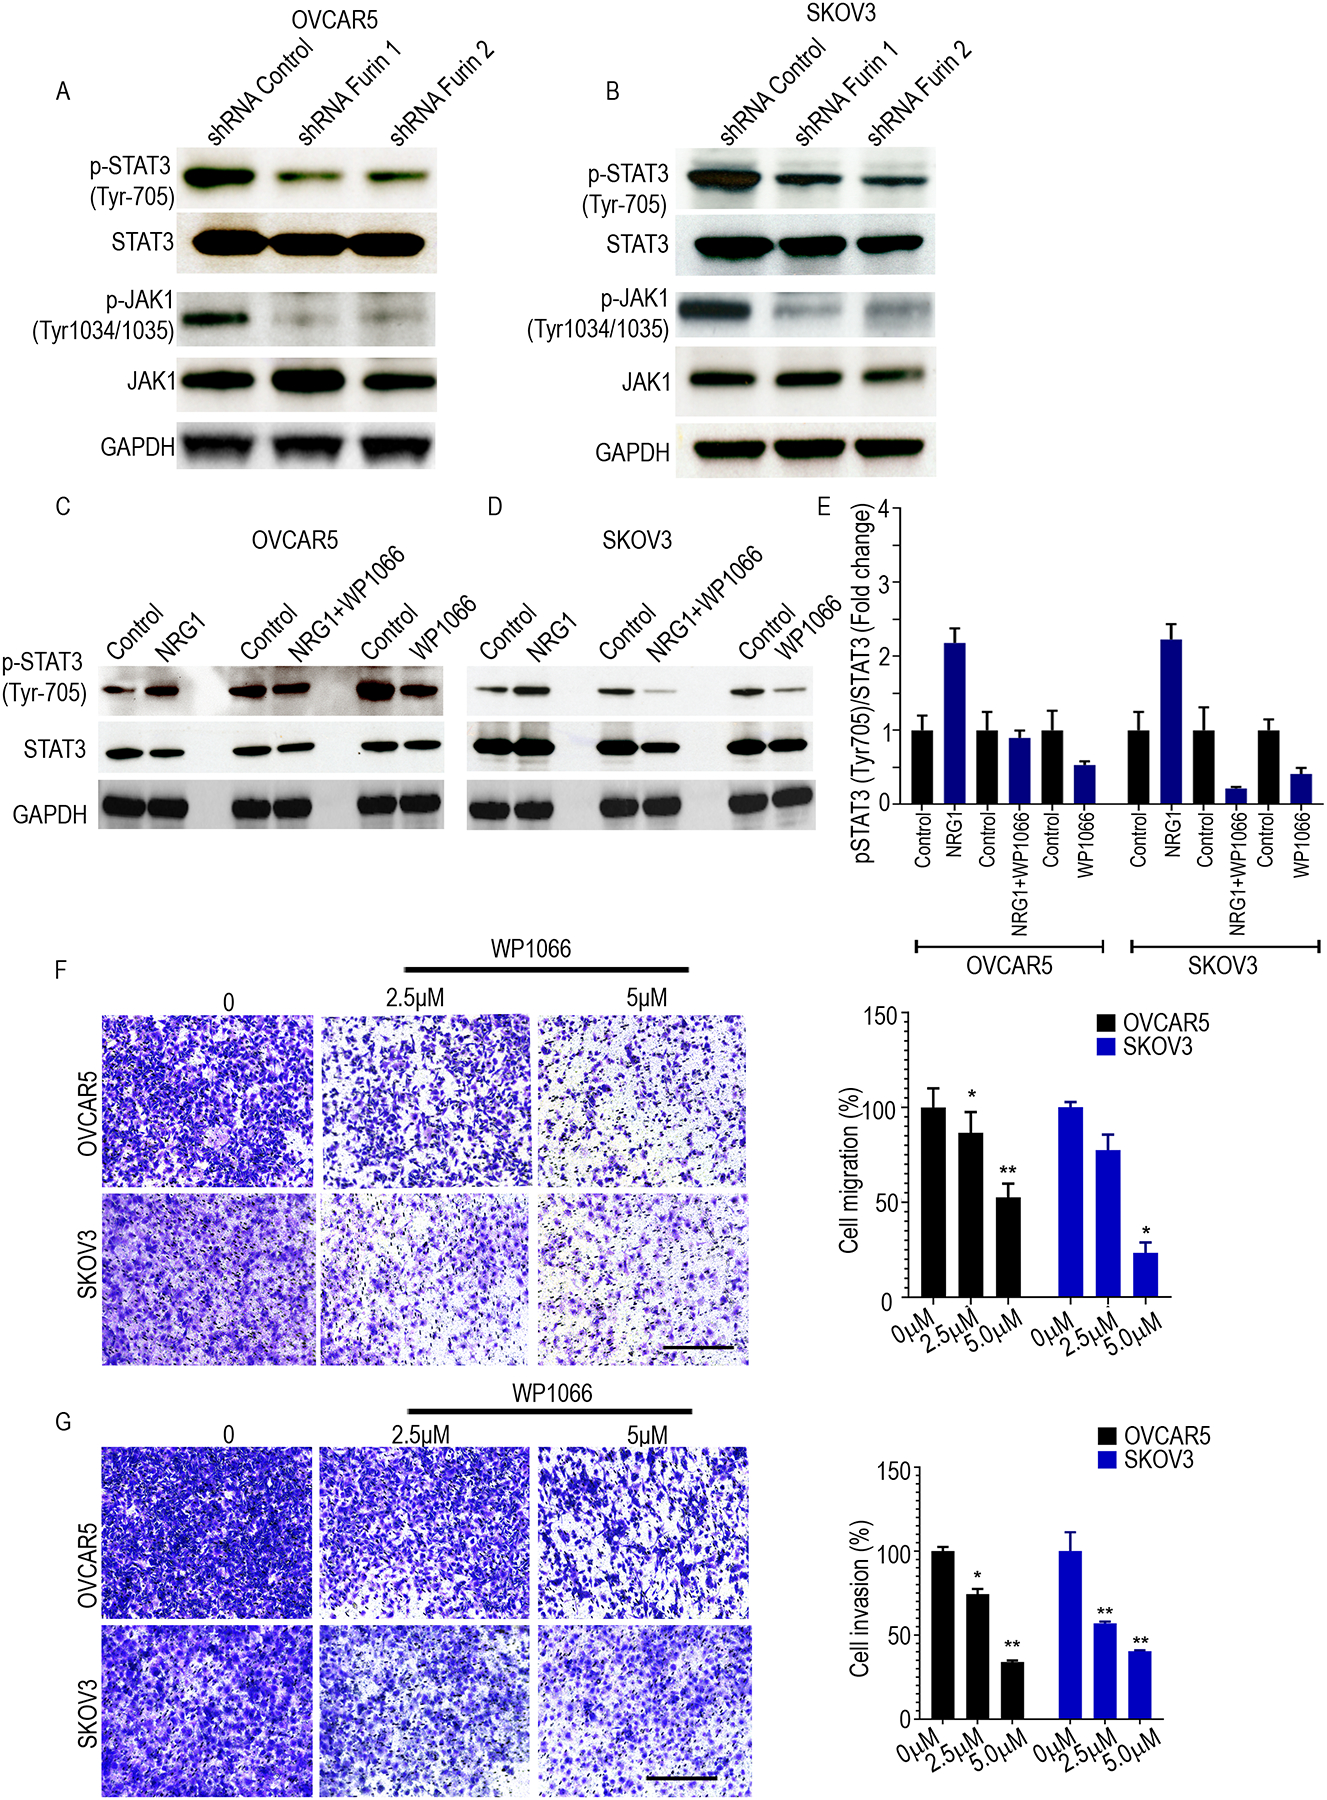
A and B. Cell lysates of shRNA control, shRNA furin 1 and shRNA furin 2 cells were immunoblotted against p-STAT3 (Tyr705), STAT3, p-JAK1(Tyr1034/1035), and JAK1 in OVCAR5 (A) and SKOV3 (B) cell lines. C and D. Cell lysates of STAT3 inhibitor (WP1066 5μM) treatment with or without NRG1 (20ng/ml) stimulation in 24 hrs were collected and immunoblotted against pSTAT3 (Tyr705) and STAT3 in OVCAR 5 (C) and SKOV3 (D). E. Quantitative analysis of relative p-STAT3 (Tyr705) expression after WP1066 treatment with or without NRG1 stimulation. F. Cell migration assay in OVCAR5 and SKOV3 (n=3). Cells were treated with vehicle, 2.5 or 5 μM WP1066 for 24h followed by the analysis of cell migration using Transwell chamber. Bright-field microscope at 10x magnification used and scaled bars represent 450 μm. G. Cell invasion assay in OVCAR5 and SKOV3 (n=3). Cells were treated with vehicle, 2.5 or 5 μM WP1066 for 24h followed by the analysis of cell invasion using Transwell chamber. Bright-field microscope at 10x magnification used and scaled bars represent 450 μm. *p<0.05, **p<0.01.
Furin knockdown reduced tumor burden in a murine model of ovarian cancer
We next used immune-competent mouse models to determine whether furin activates the IGF1R/STAT3 signaling axis in such models. For these experiments, we used ID8 cells, and similar findings to those described above were noted. To further confirm the effects of furin on the migration and invasion of ovarian cancer cells, we knocked down furin expression, using lentiviral particles that expressed furin sh-RNA in murine ovarian cancer cell line ID8. As expected, loss of furin expression reduced levels of mature IGF1R-β (Fig. 6A and Supplementary Fig. 6A). Next, we used Transwells to evaluate the effect of furin knockdown on the migration and invasion of ovarian cancer cells. Compared to the control cells, cell migration and invasion of ID8 cells were significantly reduced (Fig. 6B, Fig. 6C and Supplementary Fig. 6B and 6C).
Fig 6. Knockdown of furin reduces tumor growth in vivo.
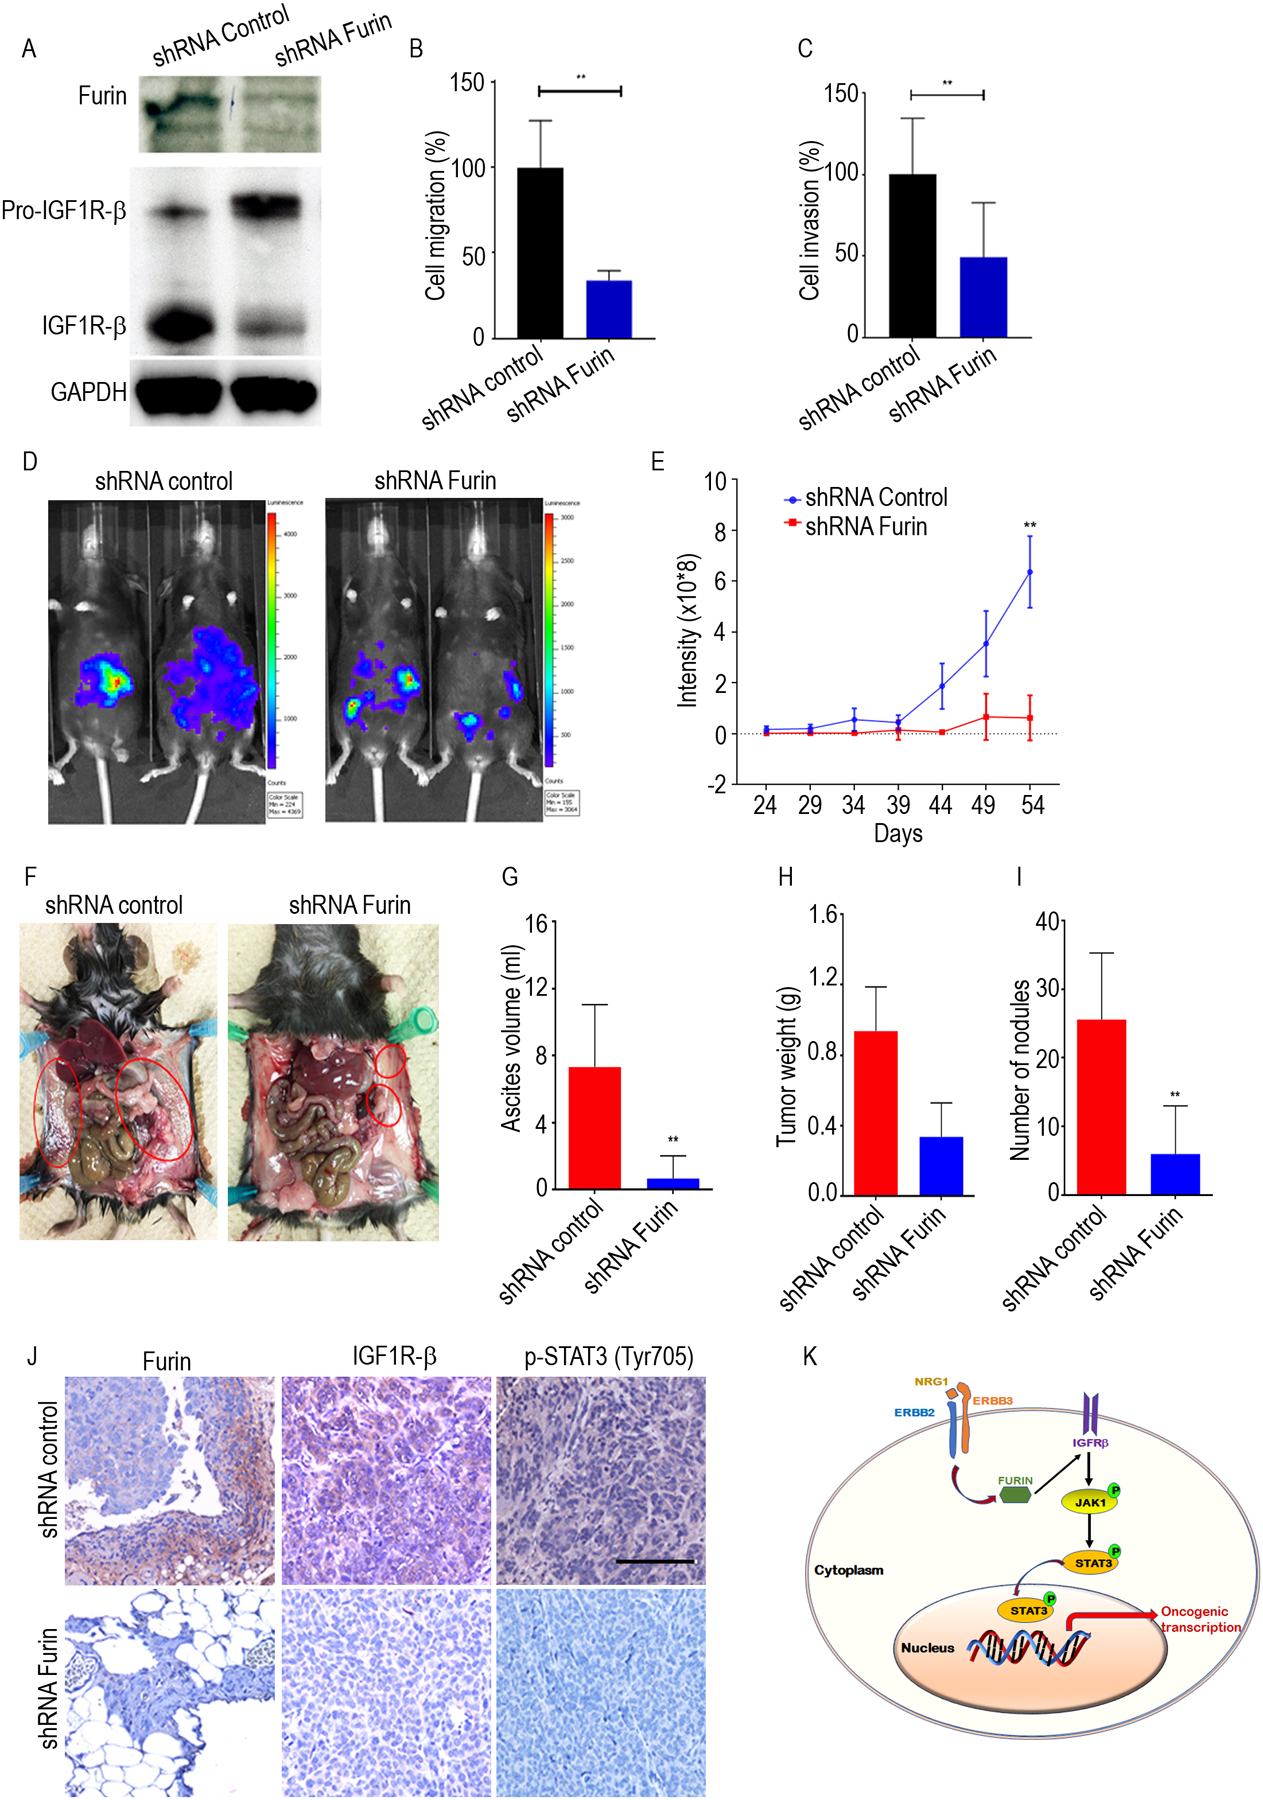
A. Cell lysates of shRNA control and shRNA furin in ID8 cells were immunoblotted against furin and IGF1R-β. B and C, Quantification of cell migration and cell invasion in ID8 cells. D. Representative bioluminescence image of shRNA furin treated mice following orthotropic injections of either shRNA control or shRNA furin ID8-Luc cells. E. Quantitative representation of bioluminescence in shRNA control and shRNA furin group. F. Representative images of the extent of metastatic spread in shRNA control and shRNA furin group. G. The average ascites volume, tumor weight (H) and number of tumor nodules (I) and are shown for shRNA control and shRNA furin group. J. IHC analysis of furin, IGF1Rβ and pSTAT3 (Tyr705) expression after in shRNA control and shRNA furin group. Scale bar: 450 μm. K. Schematic model shows ERBB pathway induces furin, and regulate IGF1R-STAT3 signaling axis. *p<0.05, **p<0.01.
To explore the oncogenic role of furin in ovarian cancer progression in an orthotopic model of ovarian cancer, we injected ID8-furin-shRNA or control-shRNA cells that stably expressed luciferase into the ovaries of C57Bl/6 mice orthotopically (10 mice/group). Tumor growth and metastasis were evaluated weekly by bioluminescence imaging. In line with our in vitro results, we found that loss of furin expression caused by shRNA reduced overall tumor growth, the number of tumor nodules that formed in the peritoneum, and the total volume of ascites fluid in the peritoneal cavity (Fig. 6D–6I).
To further determine whether inhibiting furin reduces levels of IGF1R-β /STAT3 signaling, we performed immunohistochemistry to validate levels of furin, IGF1R-β, and phosphorylated STAT3 in representative tumor tissues. The furin-shRNA tumor cells showed reduced expression of IGF1R-β and phosphorylated STAT3 (Fig. 6J). Taken together, our results demonstrate that furin promotes the tumor growth and metastasis of ovarian cancer cells by promoting the maturation of IGF1R-β and the phosphorylation of STAT3 (Fig. 6K)
Discussion
Furin is a ubiquitously expressed proprotein convertase implicated in many physiological and pathological processes (26, 27). Studies report that it plays a critical role in the maturation of multiple proteins by cleavage at the specific proprotein recognition sequence RXK/RR and is overexpressed in different types of cancer. Overexpression of furin promotes cell proliferation, cell migration, and cell invasion by affecting multiple proteins maturation (16, 17, 28). It was reported that high furin expression predicted decreased survival in ovarian cancer (20). However, the exact mechanism that enables furin to contribute to oncogenic signaling activation is not well studied. We previously demonstrated that the ERBB3-neuregulin 1 (NRG1) axis is critical for hematogenous metastasis of ovarian cancer cells and their growth in the omentum (11). The furin-like domain mediates the formation of homo- and heterodimers, which is a crucial first step in ERBB family signaling (29). However, the mechanism by which ERBB3 promotes the maturation of oncogenic proteins from proproteins was not addressed. Unexpectedly, we found that the stimulation of NRG1 induced the levels of mature IGF1R in ovarian cancer cells. As a consequence of the gain in the levels of mature IGF1R, we found an increase in the phosphorylation of JAK1 and STAT3 proteins in ovarian cancer cells. In this paper, we report that activation of the ERBB3/NRG1 axis increases the expression of furin, an important proprotein convertase, in high-grade serous ovarian cancer cells, which results in downstream activation of STAT3 signaling. This finding illustrates one underlying mechanism by which ERBB3 promotes maturation of pro-proteins to proteins with an oncogenic function in ovarian cancer.
In ovarian cancer cells, we found that furin expression is regulated by ERBB2/ERBB3 signaling and that furin is required for the maturation of IGF1R-β, which was not previously appreciated. Mature IGF-IR is a tetrameric type II receptor protein-tyrosine kinase consisting of two ligand-binding α-subunits and two transmembrane β-subunits. The binding of a ligand to IGF-IR triggers a conformational change and cross-phosphorylation between the β-subunits of the IGF-IR receptor complex. This leads to the phosphorylation of additional tyrosine residues and subsequent activation of the tyrosine kinase activity (30, 31). Phosphorylation of tyrosine residues further creates binding sites on the receptor for its immediate downstream signaling molecules, which typically contain phosphotyrosine-binding or SH2 domains, for the activation of MAPK or STAT3 (32, 33). Thus, mature IGF1R-β could promote malignant transformation by activating oncogenic signaling through various downstream effectors.
STAT3 is a member of the STAT seven-member family that regulates gene transcription by relaying signals from activated plasma membrane receptors to the nucleus. STAT3 signaling is related to the cell cycle, cell survival, and immune responses associated with cancer progression and malignancy in a number of cancer types (34–36). Phosphorylated STAT3 plays an important role in cancer initiation and progression, as it promotes cell survival and proliferation, cell cycle progression, angiogenesis, and metastasis of cancer cells (37, 38). In contrast to classical signaling mechanisms that operate through distinct signaling cues, the contributions of proprotein convertases such as furin to the induction of oncogenic signaling has not been previously well addressed. Therefore, inhibiting a tumor-promoting proprotein convertase such as furin could have therapeutic utility if target-specific furin inhibitors could be identified. The known pharmacological inhibitors of furin we used in our in vitro assays were unable to significantly reduce furin expression in non-toxic concentrations. Thus, it will be important to develop target-specific and less toxic compounds that would inhibit the activity of furin in cancer cells. To reduce levels of furin mRNA, we used genetic approaches that produced a remarkable reduction in levels of IGF1R-β and p-STAT3 and lowered overall tumor burden in vitro and in vivo.
In summary, our findings indicate that furin is a key downstream target of ERBB2/ERBB3 signaling that promotes the metastasis of ovarian cancer cells through IGF1R/STAT3 signaling. Therefore, therapeutic strategies that inhibit furin activity should have the potential to treat ovarian cancer in pre-clinical and clinical models.
Materials and methods
Patients and clinical tissues
This study was approved by the institutional review boards of the Medical College of Wisconsin. Clinical tissues were obtained from ovarian cancer patients who gave written informed consent in the Department of OB/GYN’s Tissue Bank.
Cell culture and reagents
Ovarian cancer cell line OVCAR5 cells were purchased from the National Cancer Institute’s cell line repository. SKOV3, cells were obtained from the American Type Culture Collection (ATCC, Manassas, VA) and HeyA8 cells were received from the characterized cell line core at MD Anderson Cancer Center. Cells were cultured in DMEM media (GIBCO, Carlsbad, CA) supplemented with 10% fetal bovine serum (FBS, Invitrogen Life Technologies, Carlsbad, CA) and 1% penicillin/streptomycin (GIBCO). ID8 cells (a kind gift from Dr. Weiguo Cui) were cultured in Dulbecco’s modified Eagle’s medium (GIBCO) supplemented with 10% FBS, 1% penicillin/streptomycin, 1% insulin (5 g/mL), 5 g/mL transferrin, 5 ng/mL sodium selenite (1X ITS; Sigma Cat. No. I3146). We obtained, ERBB2 (#2165), p-ERBB2 (Tyr1248)(#2247), ERBB3 (#12708), p-ERBB3 (Tyr1289), IGF1R-β (#3027), GAPDH (#5174), mesothelin (#99966S), TGF-β (#3711), STAT3 (#9139), p-STAT3 (Tyr705)(#9145), p-STAT3 (Ser727)(#34911), JAK1 (#3344S), p-JAK1(Tyr1034/1035) (#74129S), JAK2 (3230S), p-JAK2 (Tyr1008) (#8082S) TYK2 (#14193S) and p-TYK2 (Tyr1054/1055) (#68790S) from Cell Signaling Technology (Danvers, MA), Furin (#sc-133142) was obtained from Santa Cruz Biotechnology. Recombinant Human Neuregulin β−1 (NRG1), was purchased from PeproTech, Cat# 100–03.
Furin expression and knockdown
Furin cDNA ORF Clone, Human, N-DDK (Flag®) tag(#HG10141-NF) was obtained from Sino Biological. HeyA8 cells stably expressing pCMV3 or furin were generated following standard protocols, as previously described. The shRNA sequences for furin and the shRNA control were obtained from Sigma (SHCLNG, 11261829MN, 11261829MN). A lentiviral expression system was used to generate target virus supernatants that were used to infect OVCAR5, SKOV3 cells. After 96 h of infection, puromycin was used to select target cells.
Luciferase assay
ID8 cells were transfected with pLenti PGK V5-LUC Puro luciferase reporter plasmid (Plasmid #19360). Lysates were prepared 24 h after transfection, and the luciferase assay was performed as mentioned previously (38) using the Dual-Luciferase Reporter Assay kit (Promega, Madison, WI) according to the manufacturer’s instructions.
Quantitative real-time PCR analysis
Total RNA was isolated from cell line OVCAR5 by using the RNeasy Mini Kit (Qiagen, Valencia, CA). An iScript cDNA synthesis kit (Bio-Rad, Hercules, CA) was used to reverse-transcribe 1 μg RNA. We used a Bio-Rad CFX Connect Real-Time System (Bio-Rad) for quantitative real-time PCR (qRT-PCR). The threshold cycle number was calculated by Bio-Rad CFX manager software version 3.0. All primers were obtained from Integrated DNA Technologies (Supplementary Table 1). All the qRT-PCR reactions were performed in duplicate in three independent experiments. Using the ΔΔC(t) method, we calculated the fold change.
Western blotting analysis
Cells in monolayer were washed with phosphate-buffered saline and harvested with RIPA buffer containing protease inhibitors and phosphatase inhibitors (Santa Cruz Biotechnology, Dallas, TX). Bio-Rad protein assay dye reagent concentrate (#5000006) was used to measure protein concentrations. Cell lysates were electrophoresed on 10%–12% sodium dodecyl sulfate-polyacrylamide gels, and then transferred onto polyvinylidene difluoride (PVDF) membrane. The membranes were incubated overnight at 4°C with primary antibodies. After several washes, the membranes were incubated with secondary antibodies for 1 h at room temperature and developed with the SuperSignal™ West Pico PLUS Chemiluminescent Substrate (#34580, ThermoFisher Scientific). For the patient samples, we used tumor omentum and normal omentum from OB/GYN in the Medical College of Wisconsin. The tissues were snap-frozen, and lysates were subsequently prepared for protein isolation. All full blots are shown in Supplementary Fig. 7.
Immunofluorescence
Serial tissue sections (4μm) were sliced from paraffin-embedded formalin-fixed tissue, and immunohistochemical staining was performed as described earlier. Briefly, cold acetone was used to fix tissue sections for 10 min. The slides were then washed with PBS three times and then blocked with fish gelatin (4%) for 20 min. The tissue sections were then incubated with furin antibody (1:100) at 4°C overnight. The next day, they were washed with PBS three times, blocked with gelatin for 10 minutes, and incubated with secondary antibody (#115-546-068). They were then incubated with DAPI for 10 minutes, washed with PBS 3 times, and mounted the slides. Cell images were acquired using an EVOS FL auto imaging microscope.
In vitro invasion and cell migration assay
The in vitro invasion assay was performed using Matrigel invasion chambers (BD Biosciences, Bedford, MA, USA) as previously described (39). Briefly, 1×10⁵ serum starved cells were plated into each invasion into each upper chamber, and medium containing 10% fetal calf serum was added to the lower chambers. After the cells were allowed to invade for 24 h, the cells remaining in the invasion chambers were removed with a cotton swab. Cells on the undersurface of the invasion chambers were stained with 0.5% crystal violet. Cell migration was measured with the aid of Transwells (8.0 μm pore size), as described previously. Briefly, the undersurface of the Transwell was coated with 10 μg/ ml of collagen I, and 10% fetal calf serum was added to the lower chambers. Serum-starved cells (1×10⁵ cells in 100 μl/well) were added to the Transwells and allowed to migrate for 4 h. Cells that remained in the Transwells were removed with cotton swabs, and cells that attached to the undersurface were stained with crystal violet solution for visualization. To quantitate cell migration and invasion, stained cells on the undersurface were solubilized with 10% acetic acid and measured at 595 nm on a microplate reader.
Tissue microarray analysis (TMA)
In accordance with approved protocols, all tissue samples were obtained coded and de-identified. Samples were obtained from US Biomax, Inc (#OV1005b). A total of 100 paraffin-embedded human ovarian tissue samples (3 normal ovarian tissue, 17 normal adjacent normal ovary tissue (NAT), 18 benign tissues, and 62 tumor tissues) were available for immunohistochemical analysis (#OV1005b, US.Biomax). Representative regions were marked and selected for inclusion in a tissue array. Furin and IGF1R-β expression was determined by IHC on two TMA slides. IHC staining was performed according to a previous protocol, with minor modifications. After dehydration and clearance with xylene, the slides were mounted and photographed under a microscope. Furin and IGF1R-β expression were scored and classified into four levels according to staining intensity and positive cell percentage. Staining intensity was designated as strong (3), moderate (2), weak (1), or negative (0). Percentages of positive cells were designated as 75–100 (3), 50–74 (2), 6–49 (1), and <5 (0).
Immunohistochemistry analysis
Immunohistochemistry was performed as previously described (40). In brief, serial tissue sections (4μm) were sliced from paraffin-embedded formalin-fixed tissue, and immunohistochemical staining was performed as described earlier. Briefly, tissue sections were deparaffinized, hydrated, and stained using furin, IGF1R-β, and p-STAT3 primary antibodies (all at 1:100 dilution). The slides were deparaffinized in xylene and rehydrated through graded ethanol to PBS. For staining, we used the Vectastain ABC-AP Kit (Vector Labs, Burlingame, CA) and Vector Red Alkaline Phosphatase Substrate Kit, I (Vector Labs, Burlingame, CA) according to manufacturer’s protocol. The slides were counterstained with hematoxylin (Thermo Fisher Scientific Inc., Rockford, IL), dehydrated, and mounted with paramount.
Cell proliferation and cell viability assay
A 3-(4,5-dimethylthiazol-2-yl)-2,5-diphenyltetrazolium bromide (MTT) assay was performed to analyze cell growth, as previously described. In each assay, 1×10⁴ cells were seeded into 96-well culture plates, incubated overnight, and then treated with AZD8931 or other agents for several days.
Animals
All animal work was done in accordance with a protocol approved by the Institutional Animal Care and Use Committee (IACUC) at the Medical College of Wisconsin. Female C57BL/6J mice were obtained from the Jackson Laboratory. Animals were cared for according to IACUC guidelines. All animals were 6 to 8 weeks of age at the time of injection. shRNA control and shRNA furin ID8 cells (1× 10⁶ cells/animal) were prepared in Hanks’ balanced salt solution (Gibco, Carlsbad, CA) and injected into the ovarian bursa (10 mice/group). The mice were imaged once weekly for a bioluminescence signal, using a Xenogen IVIS system (PerkinElmer). At the time of necropsy, the weight, number, and distribution of tumors were recorded.
Statistics
Data are presented as means ± standard error (SE). Statistical comparisons were performed using unpaired two-tailed Student’s t-tests, where appropriate, with a probability value of 0.05 considered significant.
Supplementary Material
Acknowledgments
S.P. is supported by the Ovarian Cancer Research Fund Alliance (OCRFA) and by research funds from the Women’s Health Research Program (WHRP) in the Department of Obstetrics and Gynecology at the Medical College of Wisconsin (MCW). P.C.R. is supported by the 1R01CA229907, OCRFA, and WHRP as well as by the DoD Breast Cancer Research Program (W81XWH-18-1-0024). R. R. is supported by Children’s Research Institute, Department of Pediatrics, Department of OBGYN and funds from NIH grants. Authors acknowledge Dr. Anil Sood for providing tissue slides collected from the nude mice, treated with NRG-1 siRNA encapsulated nanoparticle.
Footnotes
Conflict of interest: The authors declare no conflict of interest.
References
- 1.Coleman RL, Monk BJ, Sood AK, Herzog TJ. Latest research and treatment of advanced-stage epithelial ovarian cancer. Nat Rev Clin Oncol. 2013;10(4):211–24. [DOI] [PMC free article] [PubMed] [Google Scholar]
- 2.Torre LA, Trabert B, DeSantis CE, Miller KD, Samimi G, Runowicz CD, et al. Ovarian cancer statistics, 2018. CA Cancer J Clin. 2018;68(4):284–96. [DOI] [PMC free article] [PubMed] [Google Scholar]
- 3.Gaitskell K, Green J, Pirie K, Barnes I, Hermon C, Reeves GK, et al. Histological subtypes of ovarian cancer associated with parity and breastfeeding in the prospective Million Women Study. Int J Cancer. 2018;142(2):281–9. [DOI] [PMC free article] [PubMed] [Google Scholar]
- 4.Fang D, Chen H, Zhu JY, Wang W, Teng Y, Ding HF, et al. Epithelial-mesenchymal transition of ovarian cancer cells is sustained by Rac1 through simultaneous activation of MEK1/2 and Src signaling pathways. Oncogene. 2017;36(11):1546–58. [DOI] [PMC free article] [PubMed] [Google Scholar]
- 5.Linardou H, Dahabreh IJ, Bafaloukos D, Kosmidis P, Murray S. Somatic EGFR mutations and efficacy of tyrosine kinase inhibitors in NSCLC. Nat Rev Clin Oncol. 2009;6(6):352–66. [DOI] [PubMed] [Google Scholar]
- 6.Soria JC, Ohe Y, Vansteenkiste J, Reungwetwattana T, Chewaskulyong B, Lee KH, et al. Osimertinib in Untreated EGFR-Mutated Advanced Non-Small-Cell Lung Cancer. N Engl J Med. 2018;378(2):113–25. [DOI] [PubMed] [Google Scholar]
- 7.Stephens P, Hunter C, Bignell G, Edkins S, Davies H, Teague J, et al. Lung cancer: intragenic ERBB2 kinase mutations in tumours. Nature. 2004;431(7008):525–6. [DOI] [PubMed] [Google Scholar]
- 8.Engelman JA, Zejnullahu K, Mitsudomi T, Song Y, Hyland C, Park JO, et al. MET amplification leads to gefitinib resistance in lung cancer by activating ERBB3 signaling. Science. 2007;316(5827):1039–43. [DOI] [PubMed] [Google Scholar]
- 9.Junttila TT, Sundvall M, Lundin M, Lundin J, Tanner M, Harkonen P, et al. Cleavable ErbB4 isoform in estrogen receptor-regulated growth of breast cancer cells. Cancer Res. 2005;65(4):1384–93. [DOI] [PubMed] [Google Scholar]
- 10.Yarden Y, Sliwkowski MX. Untangling the ErbB signalling network. Nature reviews Molecular cell biology. 2001;2(2):127–37. [DOI] [PubMed] [Google Scholar]
- 11.Pradeep S, Kim SW, Wu SY, Nishimura M, Chaluvally-Raghavan P, Miyake T, et al. Hematogenous metastasis of ovarian cancer: rethinking mode of spread. Cancer Cell. 2014;26(1):77–91. [DOI] [PMC free article] [PubMed] [Google Scholar]
- 12.Geethadevi A, Parashar D, Bishop E, Pradeep S, Chaluvally-Raghavan P. ERBB signaling in CTCs of ovarian cancer and glioblastoma. Genes Cancer. 2017;8(11–12):746–51. [DOI] [PMC free article] [PubMed] [Google Scholar]
- 13.Jaaks P, Bernasconi M. The proprotein convertase furin in tumour progression. Int J Cancer. 2017;141(4):654–63. [DOI] [PubMed] [Google Scholar]
- 14.Thomas G Furin at the cutting edge: from protein traffic to embryogenesis and disease. Nature reviews Molecular cell biology. 2002;3(10):753–66. [DOI] [PMC free article] [PubMed] [Google Scholar]
- 15.Hassan R, Bera T, Pastan I. Mesothelin: a new target for immunotherapy. Clin Cancer Res. 2004;10(12 Pt 1):3937–42. [DOI] [PubMed] [Google Scholar]
- 16.Bassi DE, Lopez De Cicco R, Mahloogi H, Zucker S, Thomas G, Klein-Szanto AJ. Furin inhibition results in absent or decreased invasiveness and tumorigenicity of human cancer cells. Proc Natl Acad Sci U S A. 2001;98(18):10326–31. [DOI] [PMC free article] [PubMed] [Google Scholar]
- 17.Bassi DE, Mahloogi H, Lopez De Cicco R, Klein-Szanto A. Increased furin activity enhances the malignant phenotype of human head and neck cancer cells. Am J Pathol. 2003;162(2):439–47. [DOI] [PMC free article] [PubMed] [Google Scholar]
- 18.Ma YC, Shi C, Zhang YN, Wang LG, Liu H, Jia HT, et al. The tyrosine kinase c-Src directly mediates growth factor-induced Notch-1 and Furin interaction and Notch-1 activation in pancreatic cancer cells. PLoS One. 2012;7(3):e33414. [DOI] [PMC free article] [PubMed] [Google Scholar]
- 19.Wang T, Zhao J, Ren JL, Zhang L, Wen WH, Zhang R, et al. Recombinant immunoproapoptotic proteins with furin site can translocate and kill HER2-positive cancer cells. Cancer Res. 2007;67(24):11830–9. [DOI] [PubMed] [Google Scholar]
- 20.Page RE, Klein-Szanto AJ, Litwin S, Nicolas E, Al-Jumaily R, Alexander P, et al. Increased expression of the pro-protein convertase furin predicts decreased survival in ovarian cancer. Cell Oncol. 2007;29(4):289–99. [DOI] [PMC free article] [PubMed] [Google Scholar]
- 21.Gyorffy B, Lanczky A, Szallasi Z. Implementing an online tool for genome-wide validation of survival-associated biomarkers in ovarian-cancer using microarray data from 1287 patients. Endocr Relat Cancer. 2012;19(2):197–208. [DOI] [PubMed] [Google Scholar]
- 22.Lee JH, Choi SI, Kim RK, Cho EW, Kim IG. Tescalcin/c-Src/IGF1Rbeta-mediated STAT3 activation enhances cancer stemness and radioresistant properties through ALDH1. Sci Rep. 2018;8(1):10711. [DOI] [PMC free article] [PubMed] [Google Scholar]
- 23.Bromberg JF, Wrzeszczynska MH, Devgan G, Zhao Y, Pestell RG, Albanese C, et al. Stat3 as an oncogene. Cell. 1999;98(3):295–303. [DOI] [PubMed] [Google Scholar]
- 24.Devarajan E, Huang S. STAT3 as a central regulator of tumor metastases. Curr Mol Med. 2009;9(5):626–33. [DOI] [PubMed] [Google Scholar]
- 25.Huang G, Yan H, Ye S, Tong C, Ying QL. STAT3 phosphorylation at tyrosine 705 and serine 727 differentially regulates mouse ESC fates. Stem Cells. 2014;32(5):1149–60. [DOI] [PMC free article] [PubMed] [Google Scholar]
- 26.Horimoto T, Nakayama K, Smeekens SP, Kawaoka Y. Proprotein-processing endoproteases PC6 and furin both activate hemagglutinin of virulent avian influenza viruses. J Virol. 1994;68(9):6074–8. [DOI] [PMC free article] [PubMed] [Google Scholar]
- 27.Baumann J, Huang SF, Gassmann M, Tsao CC, Ogunshola OO. Furin inhibition prevents hypoxic and TGFbeta-mediated blood-brain barrier disruption. Exp Cell Res. 2019:111503. [DOI] [PubMed] [Google Scholar]
- 28.Coppola JM, Bhojani MS, Ross BD, Rehemtulla A. A small-molecule furin inhibitor inhibits cancer cell motility and invasiveness. Neoplasia. 2008;10(4):363–70. [DOI] [PMC free article] [PubMed] [Google Scholar]
- 29.Elster N, Toomey S, Fan Y, Cremona M, Morgan C, Weiner Gorzel K, et al. Frequency, impact and a preclinical study of novel ERBB gene family mutations in HER2-positive breast cancer. Ther Adv Med Oncol. 2018;10:1758835918778297. [DOI] [PMC free article] [PubMed] [Google Scholar]
- 30.Weiss A, Schlessinger J. Switching signals on or off by receptor dimerization. Cell. 1998;94(3):277–80. [DOI] [PubMed] [Google Scholar]
- 31.Hubbard SR, Wei L, Ellis L, Hendrickson WA. Crystal structure of the tyrosine kinase domain of the human insulin receptor. Nature. 1994;372(6508):746–54. [DOI] [PubMed] [Google Scholar]
- 32.Blenis J Signal transduction via the MAP kinases: proceed at your own RSK. Proc Natl Acad Sci U S A. 1993;90(13):5889–92. [DOI] [PMC free article] [PubMed] [Google Scholar]
- 33.Pawson T, Gish GD. SH2 and SH3 domains: from structure to function. Cell. 1992;71(3):359–62. [DOI] [PubMed] [Google Scholar]
- 34.Geiger JL, Grandis JR, Bauman JE. The STAT3 pathway as a therapeutic target in head and neck cancer: Barriers and innovations. Oral Oncol. 2016;56:84–92. [DOI] [PMC free article] [PubMed] [Google Scholar]
- 35.Siveen KS, Sikka S, Surana R, Dai X, Zhang J, Kumar AP, et al. Targeting the STAT3 signaling pathway in cancer: role of synthetic and natural inhibitors. Biochim Biophys Acta. 2014;1845(2):136–54. [DOI] [PubMed] [Google Scholar]
- 36.Furtek SL, Backos DS, Matheson CJ, Reigan P. Strategies and Approaches of Targeting STAT3 for Cancer Treatment. ACS Chem Biol. 2016;11(2):308–18. [DOI] [PubMed] [Google Scholar]
- 37.Pradeep S, Huang J, Mora EM, Nick AM, Cho MS, Wu SY, et al. Erythropoietin Stimulates Tumor Growth via EphB4. Cancer Cell. 2015;28(5):610–22. [DOI] [PMC free article] [PubMed] [Google Scholar]
- 38.Chaluvally-Raghavan P, Jeong KJ, Pradeep S, Silva AM, Yu S, Liu W, et al. Direct Upregulation of STAT3 by MicroRNA-551b-3p Deregulates Growth and Metastasis of Ovarian Cancer. Cell Rep. 2016;15(7):1493–504. [DOI] [PMC free article] [PubMed] [Google Scholar]
- 39.Chen C, Shenoy AK, Padia R, Fang D, Jing Q, Yang P, et al. Suppression of lung cancer progression by isoliquiritigenin through its metabolite 2, 4, 2’, 4’-Tetrahydroxychalcone. J Exp Clin Cancer Res. 2018;37(1):243. [DOI] [PMC free article] [PubMed] [Google Scholar]
- 40.Chaluvally-Raghavan P, Zhang F, Pradeep S, Hamilton MP, Zhao X, Rupaimoole R, et al. Copy number gain of hsa-miR-569 at 3q26.2 leads to loss of TP53INP1 and aggressiveness of epithelial cancers. Cancer Cell. 2014;26(6):863–79. [DOI] [PMC free article] [PubMed] [Google Scholar]
Associated Data
This section collects any data citations, data availability statements, or supplementary materials included in this article.