

Abstract
A cell membrane-specific fluorescent probe was prepared by conjugating a coumarin dye with a tetraphenylethene (TPE) derivative through an α,β-unsaturated ketone connection. The probe has two absorptions: one from the TPE moiety at 300 nm and a second one due to the coumarin moiety at 458.5 nm. The probe fluoresces at 470 nm in tetrahydrofuran (THF) solution. The probe exhibits a useful aggregation-induced emission (AIE) property. A gradual increase in the water content of a THF solution causes a significant decrease and 12 nm red shift in the fluorescence peak at 470 nm, giving rise to a new strong fluorescence peak at 591 nm at a 95% water content. The probe is hydrophobic with an AIE property and binds to cell membranes, resulting in 591 nm fluorescence upon implantation into cells. The probe possesses a long retention time despite the lack of a long, cell membrane-anchored hydrophobic alkyl chain, which is typical for traditional membrane-specific probes. Our probe also displays low cytotoxicity and excellent photostability.
Keywords: coumarin, tetraphenylethene, aggregation-induced emission, dual emission, cell membrane, cellular imaging
Graphical Abstract
INTRODUCTION
All living cells are protected by cell membranes consisting primarily of proteins, lipids (phospholipids and cholesterol), and carbohydrate residues from glycoproteins and glycolipids. The cell membrane keeps toxic materials outside the cell, facilitates the transport of substances across the membrane, contains enzymes that control metabolic processes, and plays important roles in cell signaling and communication. Many cell membrane-specific fluorescent probes have been developed to visualize membrane structures. The traditional approach to design and prepare cell membrane-specific fluorescent probes is to introduce a hydrophilic zwitterionic head and a hydrophobic aliphatic tail to different fluorophores, such as 4′-(diethylamino)-3-hydroxyflavone,1,2 perylene,3,4 Nile red,5–7 rhodamine, tetraphenylethene,8,9 BODIPY,10,11 squaraine12 and fluorescent-conjugated polymers,13–15 which then interact through hydrophobic and electrostatic interactions with the phospholipid bilayers. Recently, the unique aggregation-induced emission feature of tetraphenylethylene fluorophores has received a lot of attention.16–20 These fluorophores can be used to develop highly fluorescent turn-on probes in hydrophobic environments due to restricted intramolecular rotation in aqueous solutions. Hydrophilic peptides with hydrophobic aliphatic residues have been used to modify TPE to develop cell membrane-specific probes with long-term tracking features.8 Furthermore, a deep-red fluorescent probe based on an amphiphilic tetraphenylethene pyridinium salt for cell membrane-specific imaging was developed.9 It is desirable to develop membrane-specific fluorescent probes containing two well-defined emissions and excellent photostability through a nontraditional approach for long-term observation and real-time tracking.
Here, we report on a hybrid fluorescent probe, Chart 1, produced by incorporating a coumarin organophoshorus ylide into 4-[2,2-bis(4-methoxyphenyl)-1-phenylethenyl]-benzaldehyde through an α,β-unsaturated ketone (i.e., chalcone) connection, using the Wittig reaction, which did not follow the traditional design of membrane-specific probes, as outlined above. The probe displays two absorption peaks at 300 and 457.5 nm in pure THF. Our probe shows an aggregation-induced emission property. It displays only one emission peak at 470 nm in pure tetrahydrofuran (THF) solution. However, in a 5:95% THF/water solution and thus in the aggregated state, a bright emission at 591 nm with a significant fluorescence decrease of the 470 nm emission accompanied by a 12 nm red shift occurs. As the probe is highly hydrophobic, it becomes strongly fluorescent with a longer-wavelength emission at 591 nm upon being embedded in the cell membrane, where intramolecular rotations of the phenyl groups in the probe are highly restricted. This probe is suitable for long-term and real-time studies as it contains very good photostability and low cytotoxicity. We demonstrated its usefulness in Drosophila melanogaster first-instar larvae.
Chart 1.
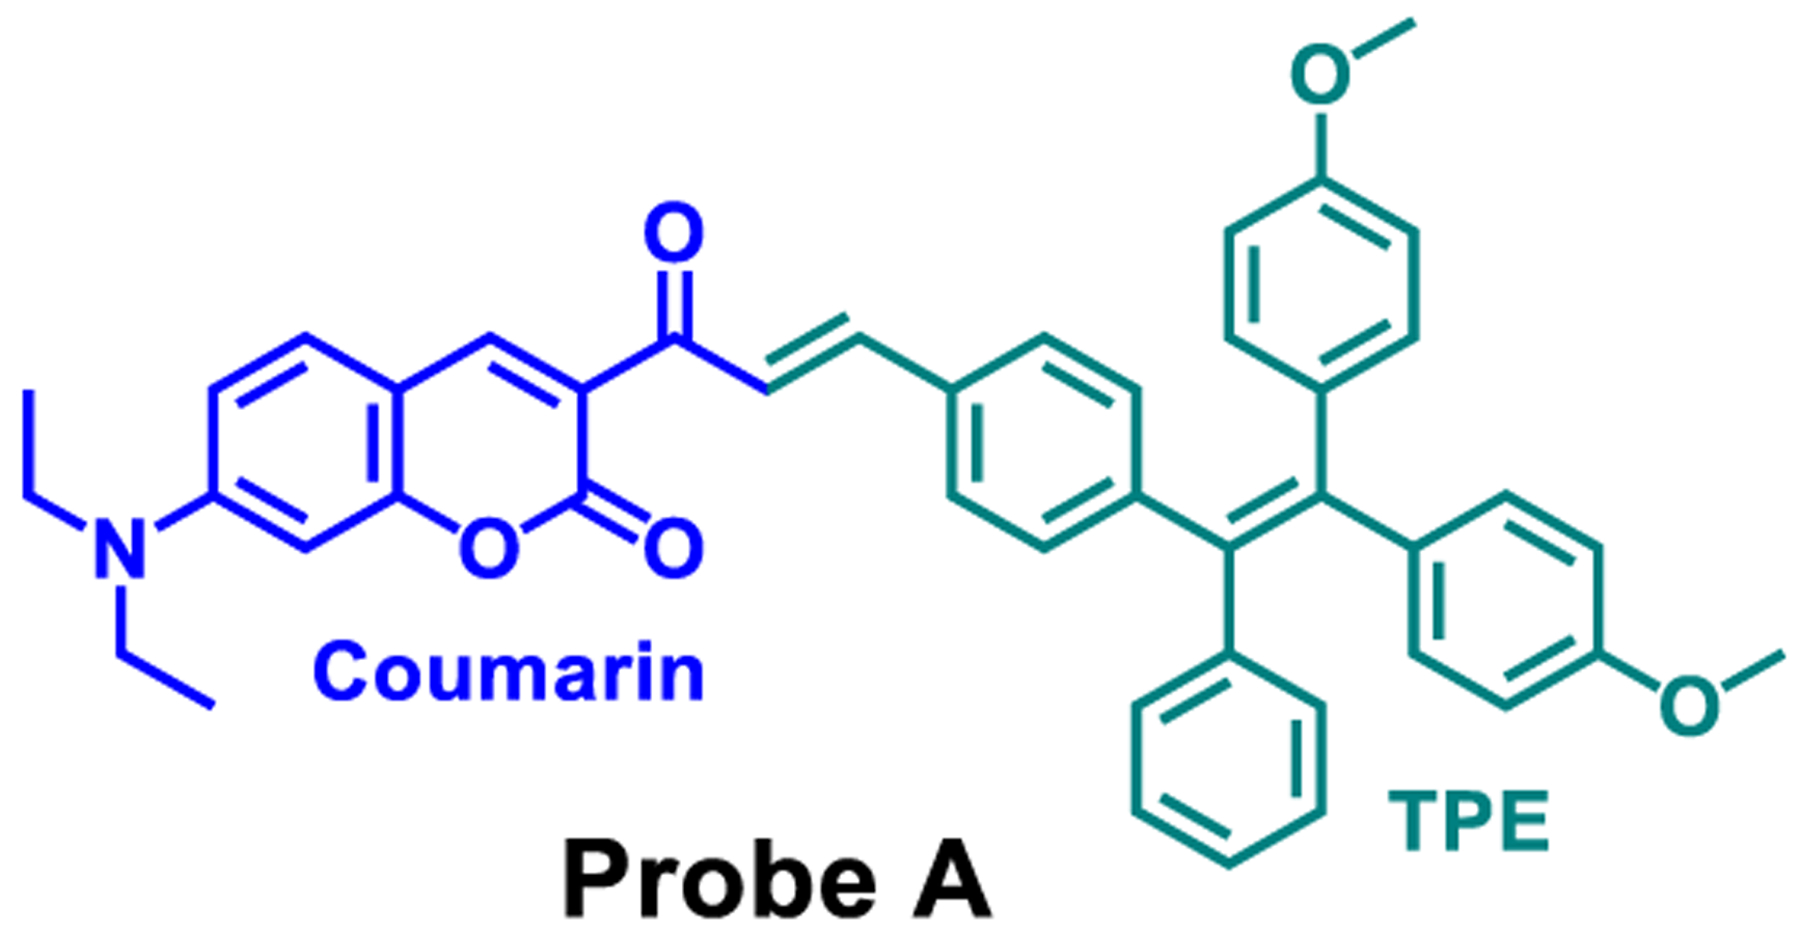
Chemical Structure of Cell Membrane-Specific Probe A
RESULTS AND DISCUSSION
Probe Design and Preparation.
We synthesized formylfunctionalized TPE (4) by formylating the bromo group of the TPE derivative (3) with n-butyllithium and dimethylformamide (DMF) in dry THF solution at −78 °C.21 The coumarin organophosphorus ylide (5) was prepared by reacting the acetyl bromide of 3-(2-bromoacetyl)-7-(diethylamino)-2H-chromen-2-one (8) with triphenylphosphine under basic conditions.22 Probe A was then prepared through the Wittig reaction by reacting coumarin organophosphorus ylide (5) with an aldehyde of the TPE derivative (4), resulting in a substituted alkene product, Scheme 1.
Scheme 1.
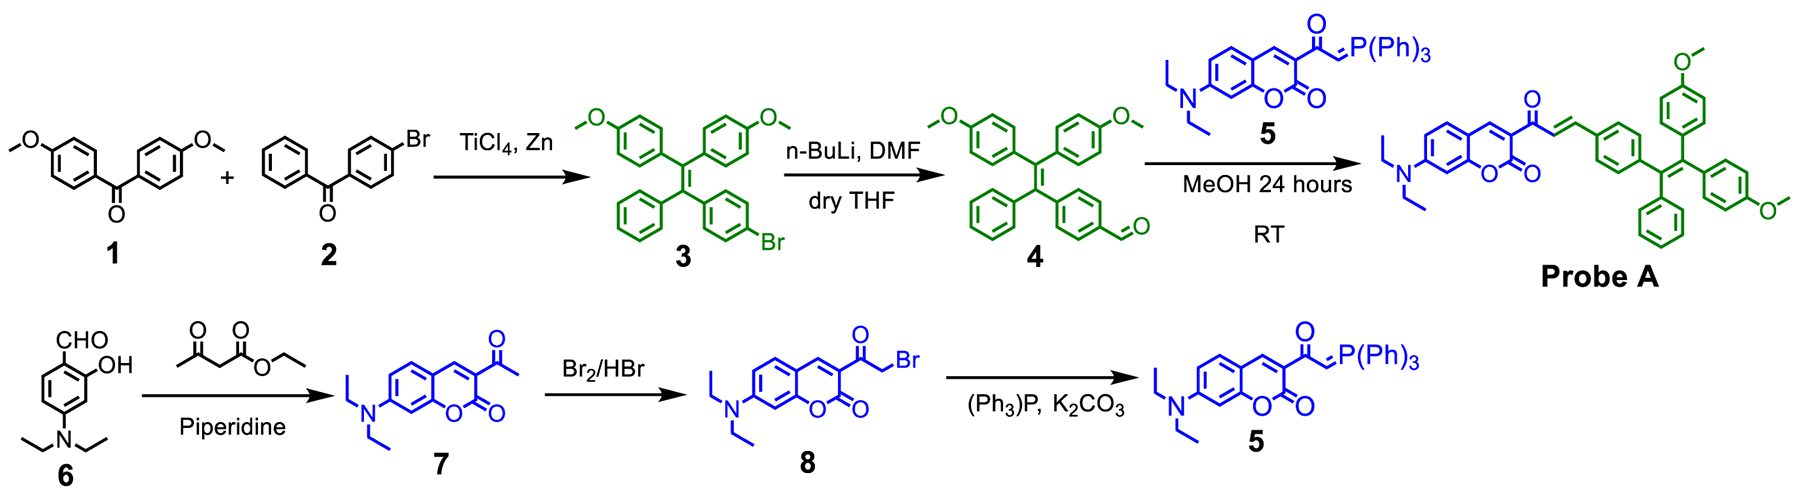
Synthetic Approach to Prepare a Cell Membrane-Specific Fluorescent Probe A
Aggregation-Induced Emission Property of the Probe.
We investigated whether the probe displays aggregation-induced emission by collecting absorption and emission spectra while gradually increasing the water content in a THF solution (Figure 1). The probe shows two absorption peaks at 300 and 457.5 nm in pure THF. A gradual increase of water from 0 to 80% to THF causes a slight red shift of the 457.5 nm absorption peak (Figure 1). The probe shows only one fluorescence peak at 470 nm in pure THF solution. However, gradual increases in water to 90% result in a gradual decrease of the fluorescence peak at 470 nm with a 12 nm red shift and a new fluorescence peak at 591 nm (Figures 1 and 2). A further increase of the water percentage to 95% causes a slight decrease of the fluorescence at 591 nm (Figures 1 and 2). Similar results of the probe absorbance and fluorescence changes were observed in water/acetonitrile solutions (Figures S10 and S11). These results indicate that the probe displays an aggregation-induced emission property and that the conjugation of the coumarin moiety to the TPE moiety through the chalcone connection maintains the AIE property of TPE.
Figure 1.
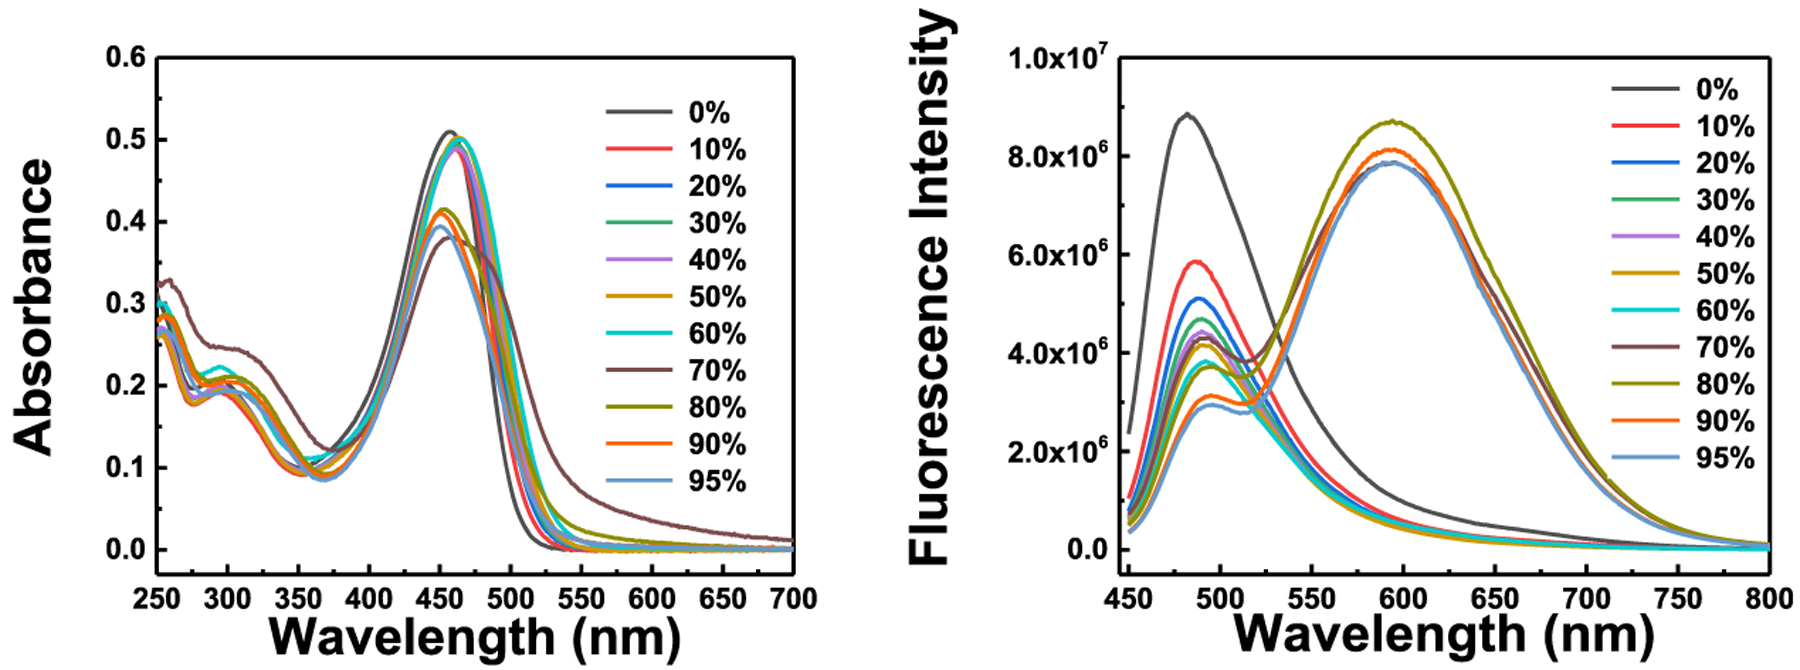
Absorption and fluorescence spectra of probe A in the mixture solutions of water and acetonitrile with various water percentages. Concentration of probe A: 10 μM; excitation wavelength: 430 nm.
Figure 2.
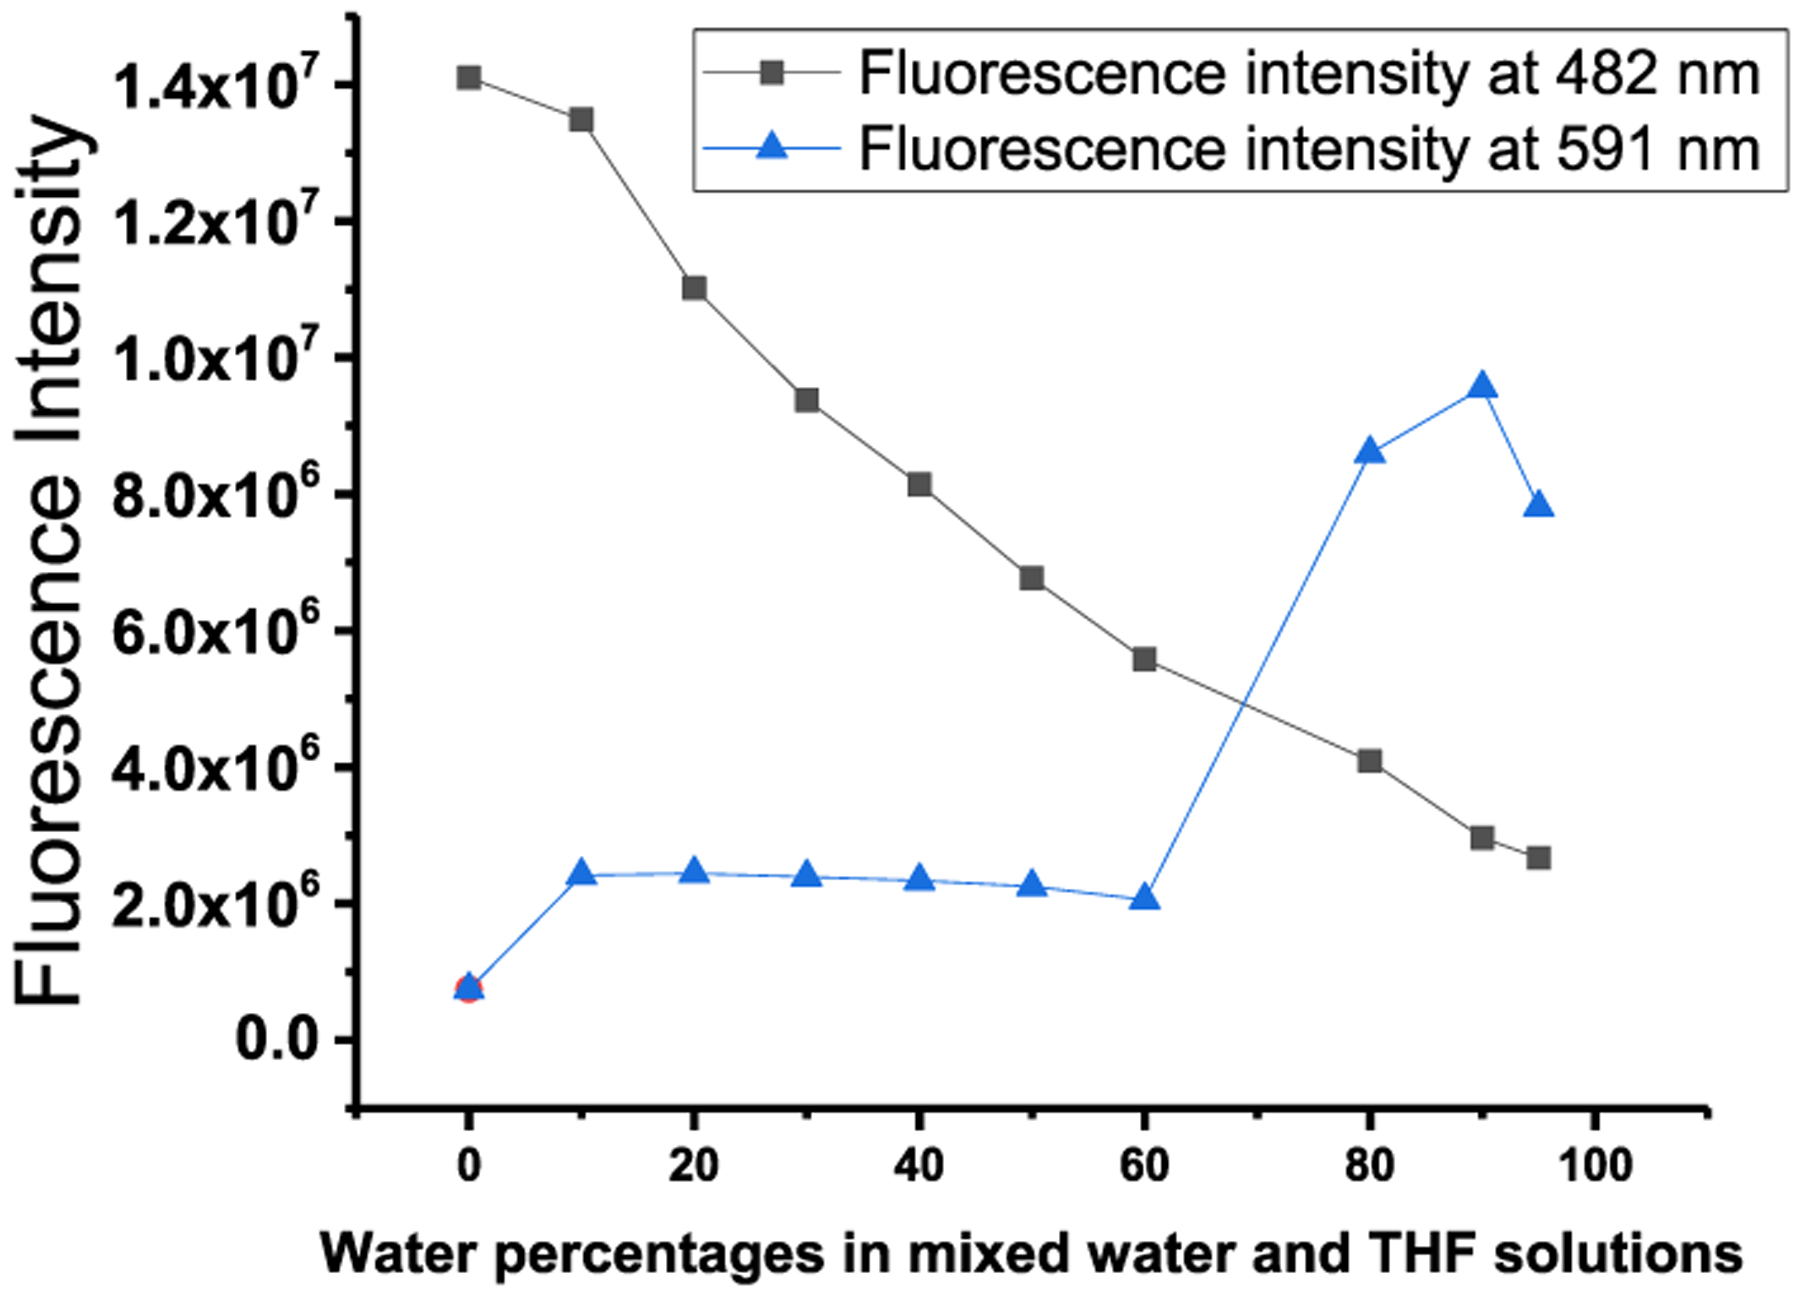
Fluorescence intensity of probe A in the mixture solutions of water and THF with various water percentages. Concentration of probe A: 10 μM; excitation wavelength: 430 nm.
Theoretical Calculations.
Calculations were conducted to confirm the nature of the transitions and, in particular, whether transmission through the chalcone linkage was possible. In the THF solution, two transitions were calculated (Figure S3) at 346 and 490 nm, which correspond to the experimental values of 300 and 457.5 nm, respectively. We note that the differences between the calculated and experimental values were 0.53 and 0.18 eV for the two transitions, respectively, the first one being outside and the second one within the range of 0.20–0.25 eV. Differences within this range are usually obtained in these calculations.23 In water, a slight red shift was also noted as the peak positions were calculated to be 347 and 495 nm. In both solvents, equivalent orbitals were used for these transitions as evident in the LCAO listings presented in Tables S3 and S5 for tetrahydrofuran and water, respectively. The transition around 345 emanates from mainly orbitals localized on the TPE section of the molecule (64.6%, LCAO 172 (i.e., HOMO-3) in Figure S4) going to an LCAO on the coumarin moiety (i.e., specifically 176 (LUMO) in Figure S4). This transition is represented as a current density drawing in Figure 3. The transitions listed as ES1 and ES2 overlap to produce the one experimentally observed transition at 457 nm due to their close proximity of 80 nm, Figure S3. As displayed in Figure 3, they originate and involve identical LCAOs though with differences in the oscillating strengths of the transitions. Interestingly, this transition appears to be a composite originating from orbitals at either the coumarin (ES2, LCAO 172) or TPE (ES1, LCAO 175) ends of the molecule, ending up in the connecting moiety (Figure 3) and demonstrates conjugation through the chalcone linkage.
Figure 3.
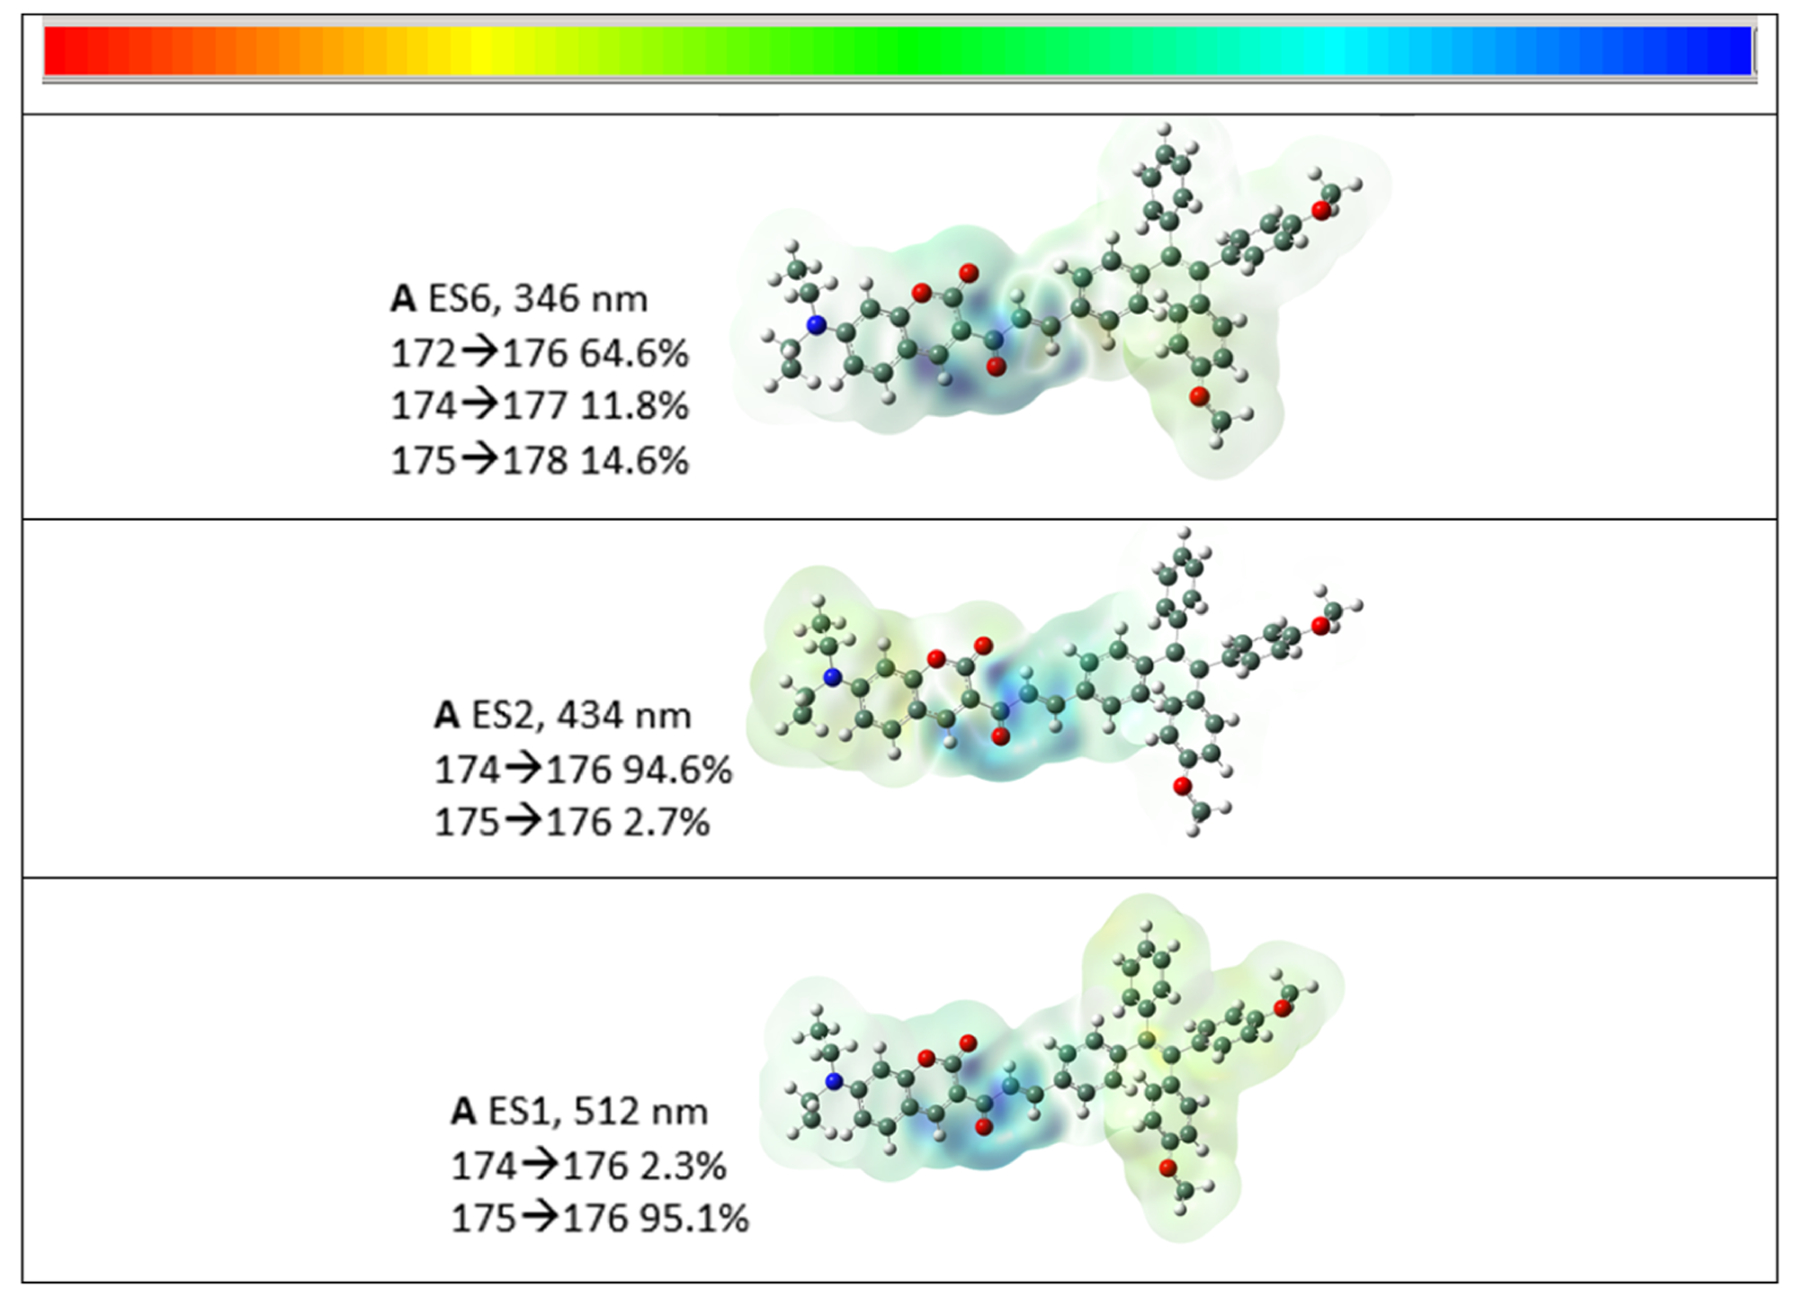
Drawings of the current density difference as isosurfaces of probe A in tetrahydrofuran showing the excited states (ESs) and the calculated wavelengths. The numerical range values of the color scale displayed at the top of the figure are ±1.001 e−4, ±1.324 e−4, and ±1.377 e−4 (top to bottom). The nature of the specific transitions is indicated, and illustrations of the LCAOs are presented in the Supporting Information. LCAO 175 is the HOMO and LCAO176 is the LUMO.
Probe Insensitivity to pH, Anions, Cations, Amino Acids, and Biothiols.
The probe shows slight fluorescence and absorbance increases as the pH is varied from 4.0 to 9.2 (Figure 4). The probe does not display significant responses to a 200 μM concentration of cations, such as Mg2+, Ag+, Zn2+, Co2+, Al3+, Mg2+, Pb2+, Fe2+, Hg2+, K+, Cr3+, and Fe3+ (Figure S10); a 200 μM concentration in anions, such as NO3−, SO42−, SO32−, HCO3–, PO43−, and CO32− (Figure S11), and reactive oxygen, nitrogen, and sulfur species, such as cysteine (Cys), homocysteine (Hcy), glutathione (GSH), HSO3−, S2O32−, H2S, O2−, H2O2, ONOO−, and ClO− (Figure S12). These results indicate that the probe is not sensitive to the named conditions and chemical interferences.
Figure 4.
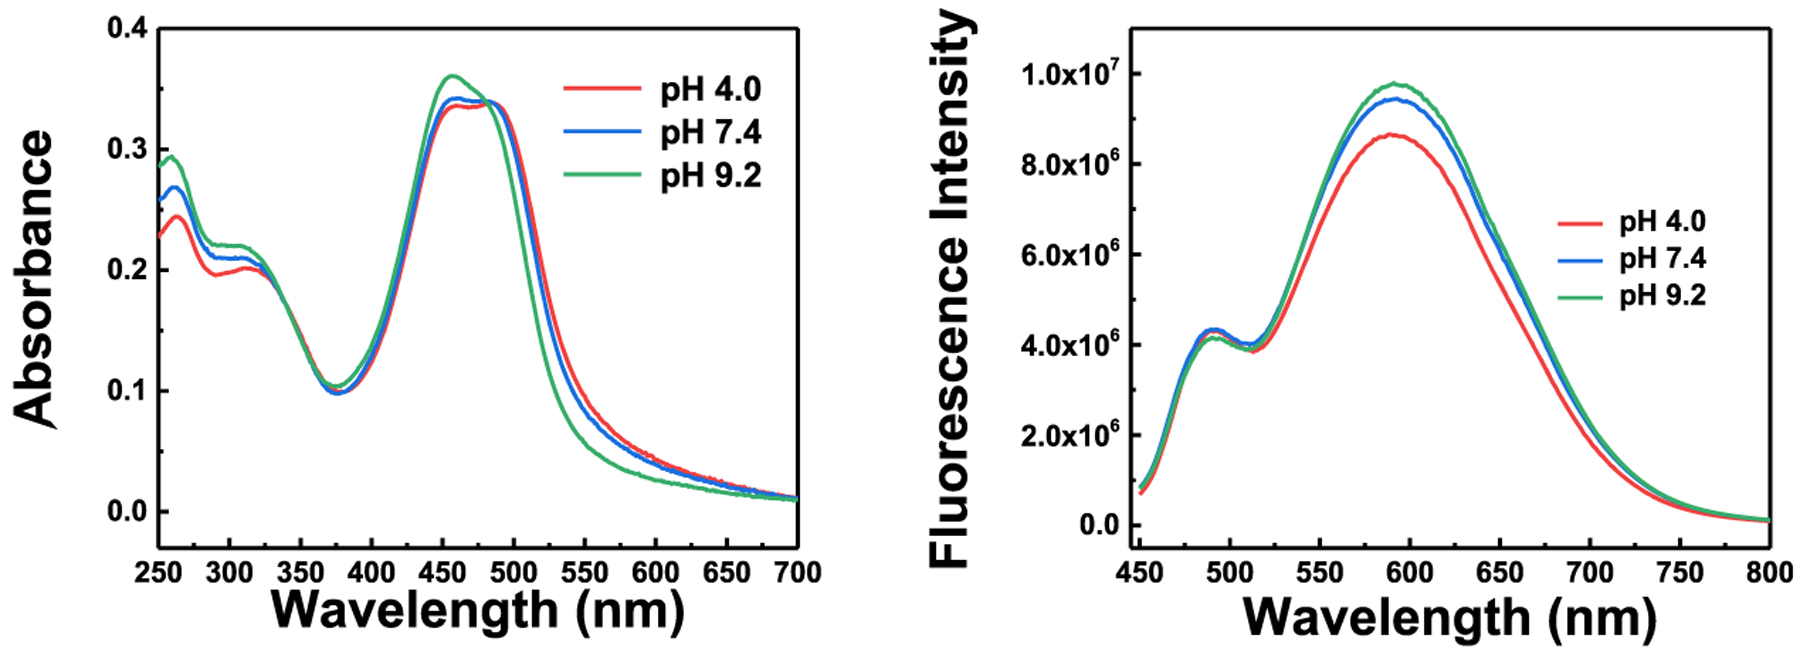
Absorption and fluorescence spectra under excitation of 430 nm of the probe (10 μM) in different pH buffers containing 20% acetonitrile.
Photostability of the Probe.
We have conducted photostability experiments by comparing the photostability of probe A with that of the CellBrite cell membrane NIR dye. The photostability of the probe was investigated under continuous excitation at 488 nm by comparing it to that of the CellBrite cell membrane NIR dye under continuous excitation at 630 nm (Figure S12). Fluorescence intensity of the probe decreased by 2.5% under a 40 min excitation at 488 nm. The probe shows a similar photostability under shorter excitation wavelength at 488 nm to that of the CellBrite cell membrane NIR dye (Figure S12).
Cytotoxicity of the Probe.
We investigated the probe’s cytotoxicity, using a standard MTT cell viability assay by incubating HeLa cells with 0, 5, 10, 15, 25, and 50 μM concentrations of the probe for 24 h (Figure 5). Cell viability with a 50 μM probe concentration was more than 86% (Figure 5), indicating that the probe possesses low cytotoxicity at high probe concentrations and can thus be used as a live cell-staining reagent.
Figure 5.
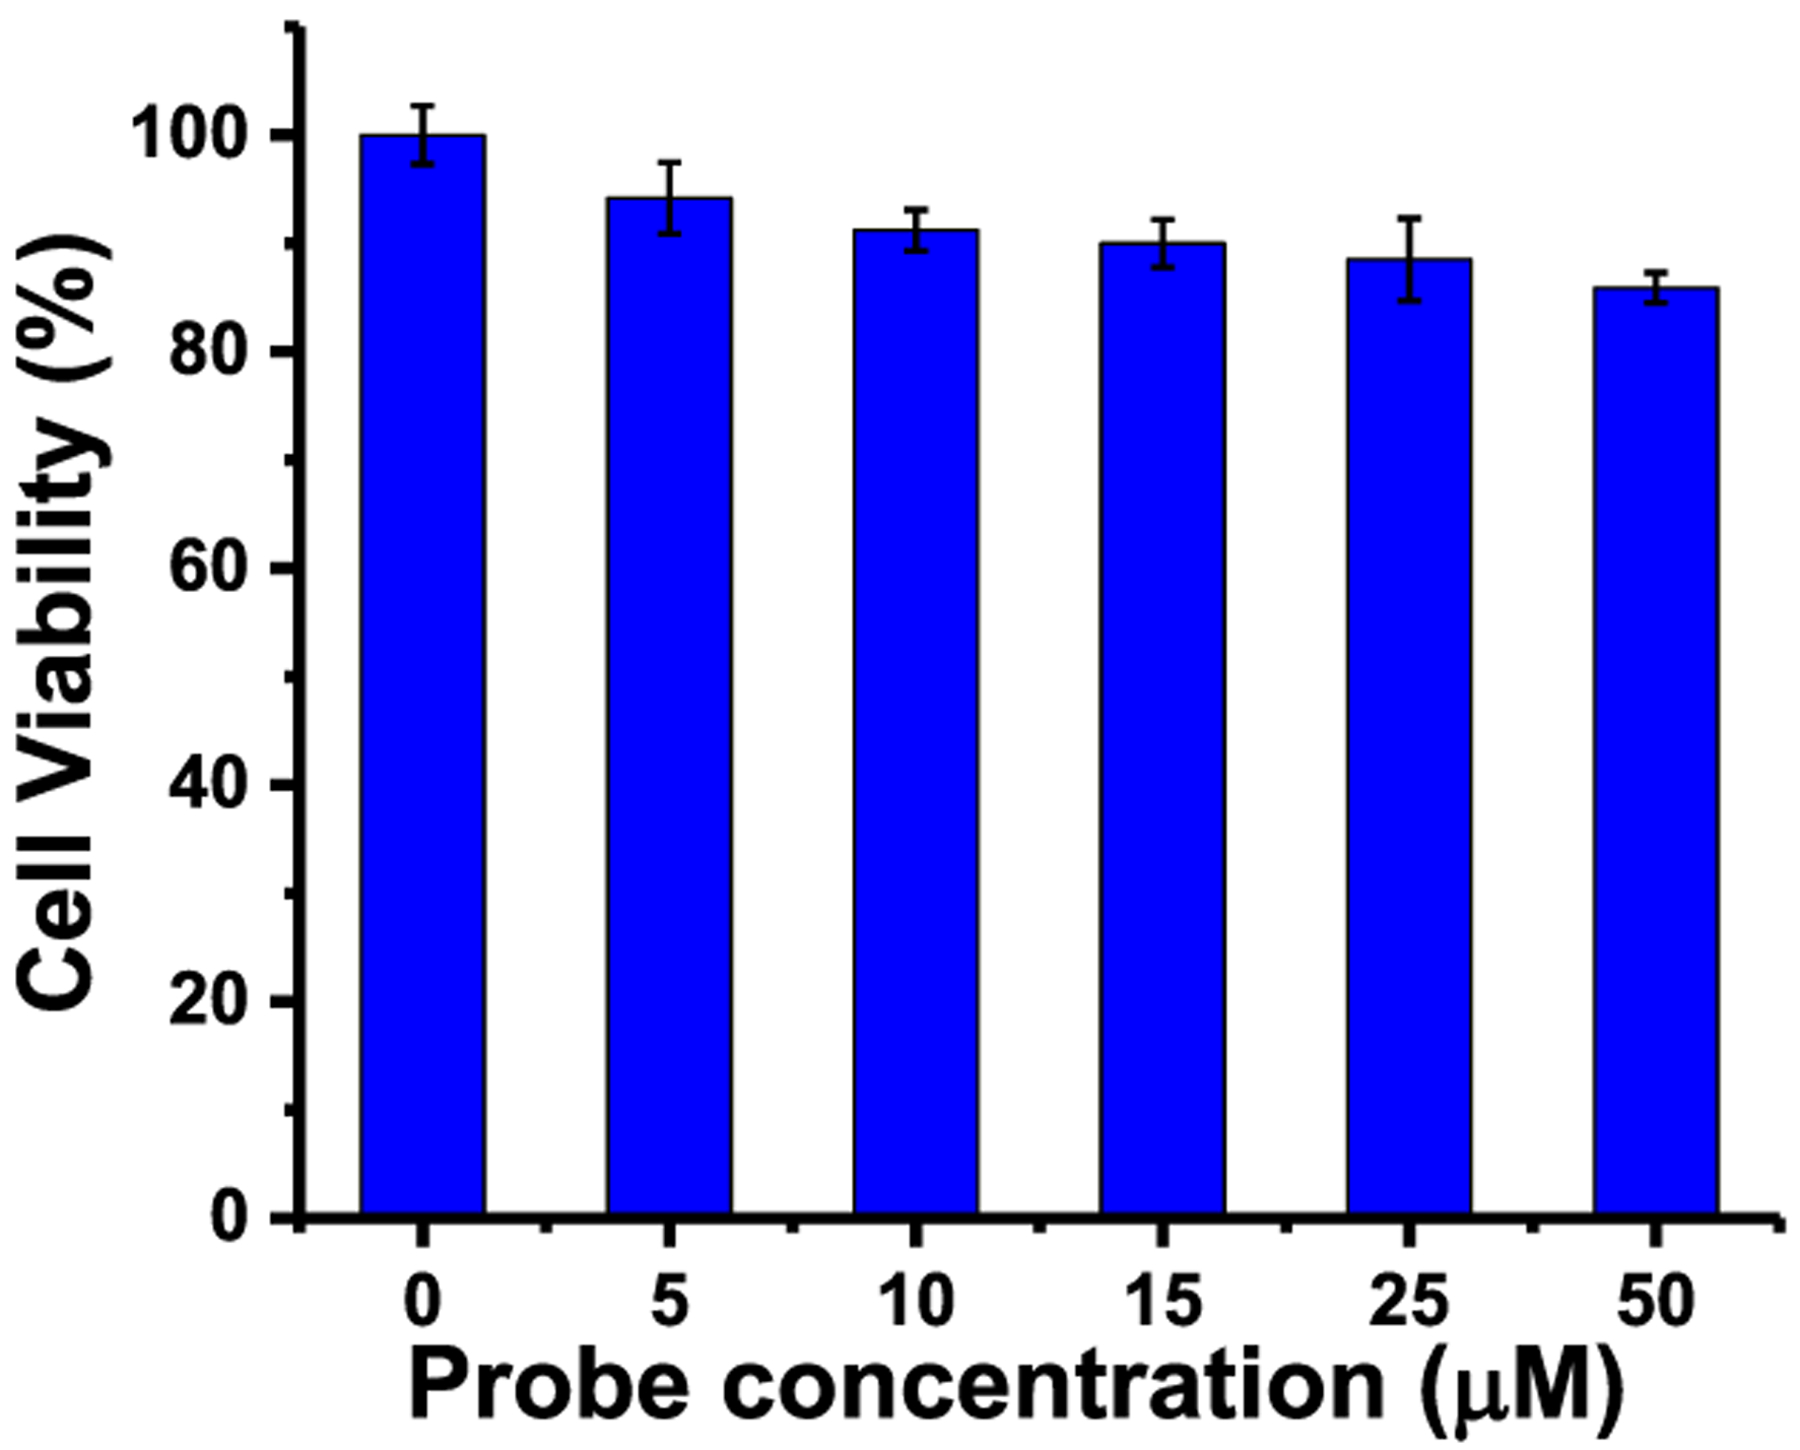
Cell viability under different probe concentrations by an MTT assay.
Cellular Fluorescence Imaging of the Probe.
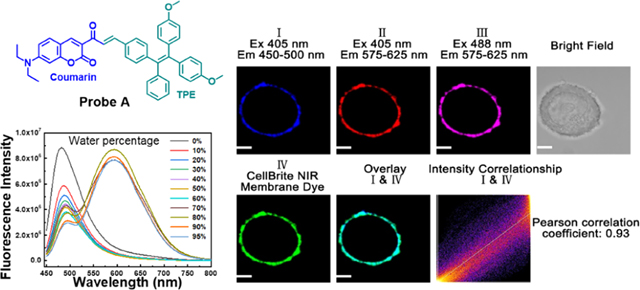
To demonstrate that our probe can specifically stain the cell membrane, a colocalization experiment consisting of the incubation of HeLa cells with the probe and a commercially available CellBrite cell membrane NIR dye for 15 min was conducted (Figure 6). Bright fluorescence around the cell membrane in the blue and red channels was detected under 405 nm excitation, while strong fluorescence around the cell membrane in the pink channel was observed under 488 nm excitation (Figure 6). To further confirm where the probe was located in live cells, we used the CellBrite cell membrane NIR dye to specifically label the cell membrane and merged the probe fluorescence in the blue channel with the near-infrared fluorescence of the CellBrite cell membrane NIR dye in the green channel under 630 nm excitation, demonstrating that the blue fluorescence of our probe colocalizes with the CellBrite Cell membrane NIR dye (Pearson correlation coefficient is 0.88) (Figure 6). Thus, the probe specifically stains the cell membrane (Figures 6 and S17).
Figure 6.
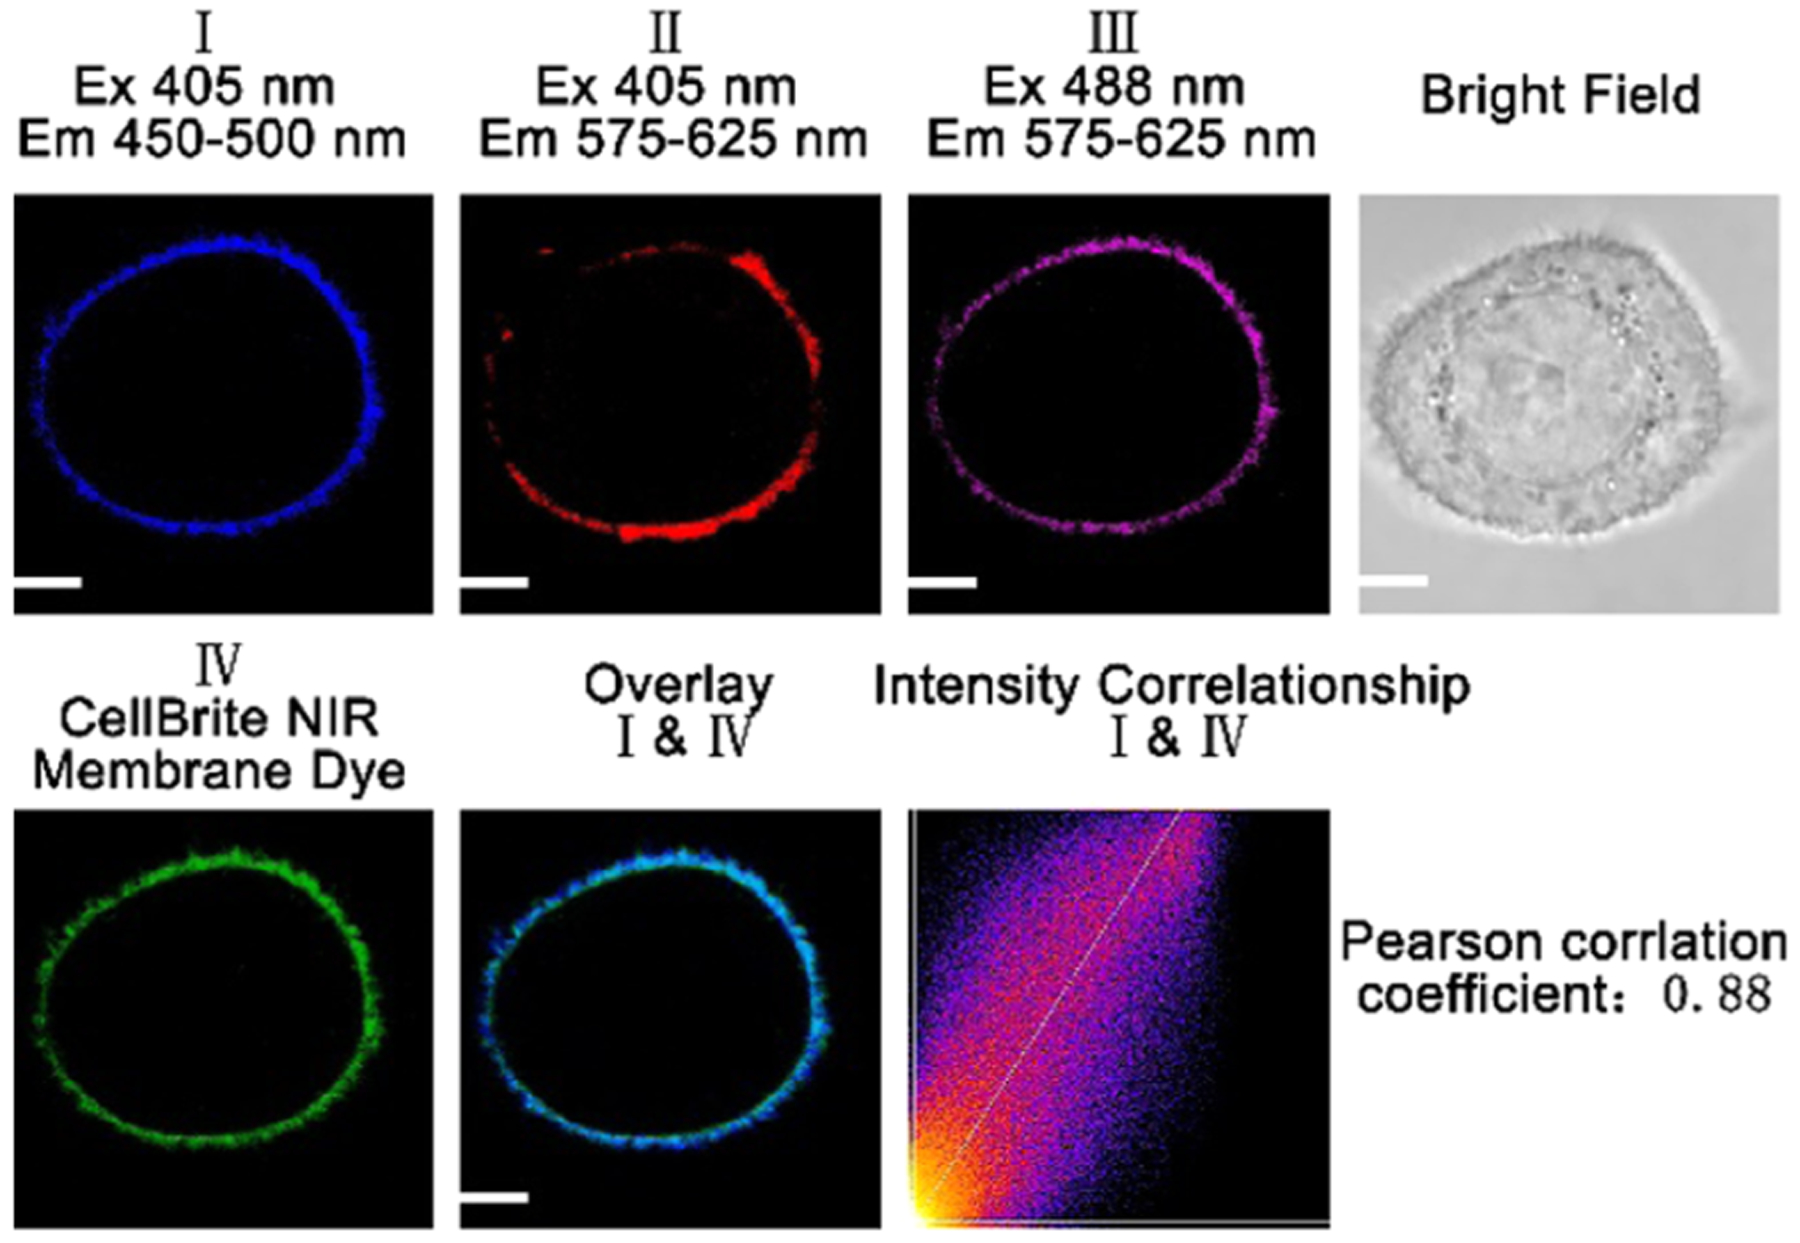
Fluorescence images of a HeLa cell incubated with 10 μM probe and 5 μM CellBrite cytoplasmic NIR dye for 15 min under excitation of 405 and 488 nm for probe A, and 630 nm for CellBrite cytoplasmic NIR dye. Pearson correlation coefficient of channel I with channel IV is 0.88. A confocal fluorescence microscope (Olympus IX 81) was employed to collect cellular fluorescence images.
We further studied the effect of the probe incubation time on the probe fluorescence in HeLa cells. When we increased the probe incubation time from 5 to 25 min, we observed enhanced fluorescence at the cell membrane (Figure 7). We next investigated the influence of the probe concentration on the fluorescence of the probe at a constant incubation time of 15 min (Figure 8). An increase from 5 to 15 μM in the concentration of the probe strongly enhanced fluorescence around the cell membrane, as demonstrated by the dramatic increase in intensity (Figure 8).
Figure 7.
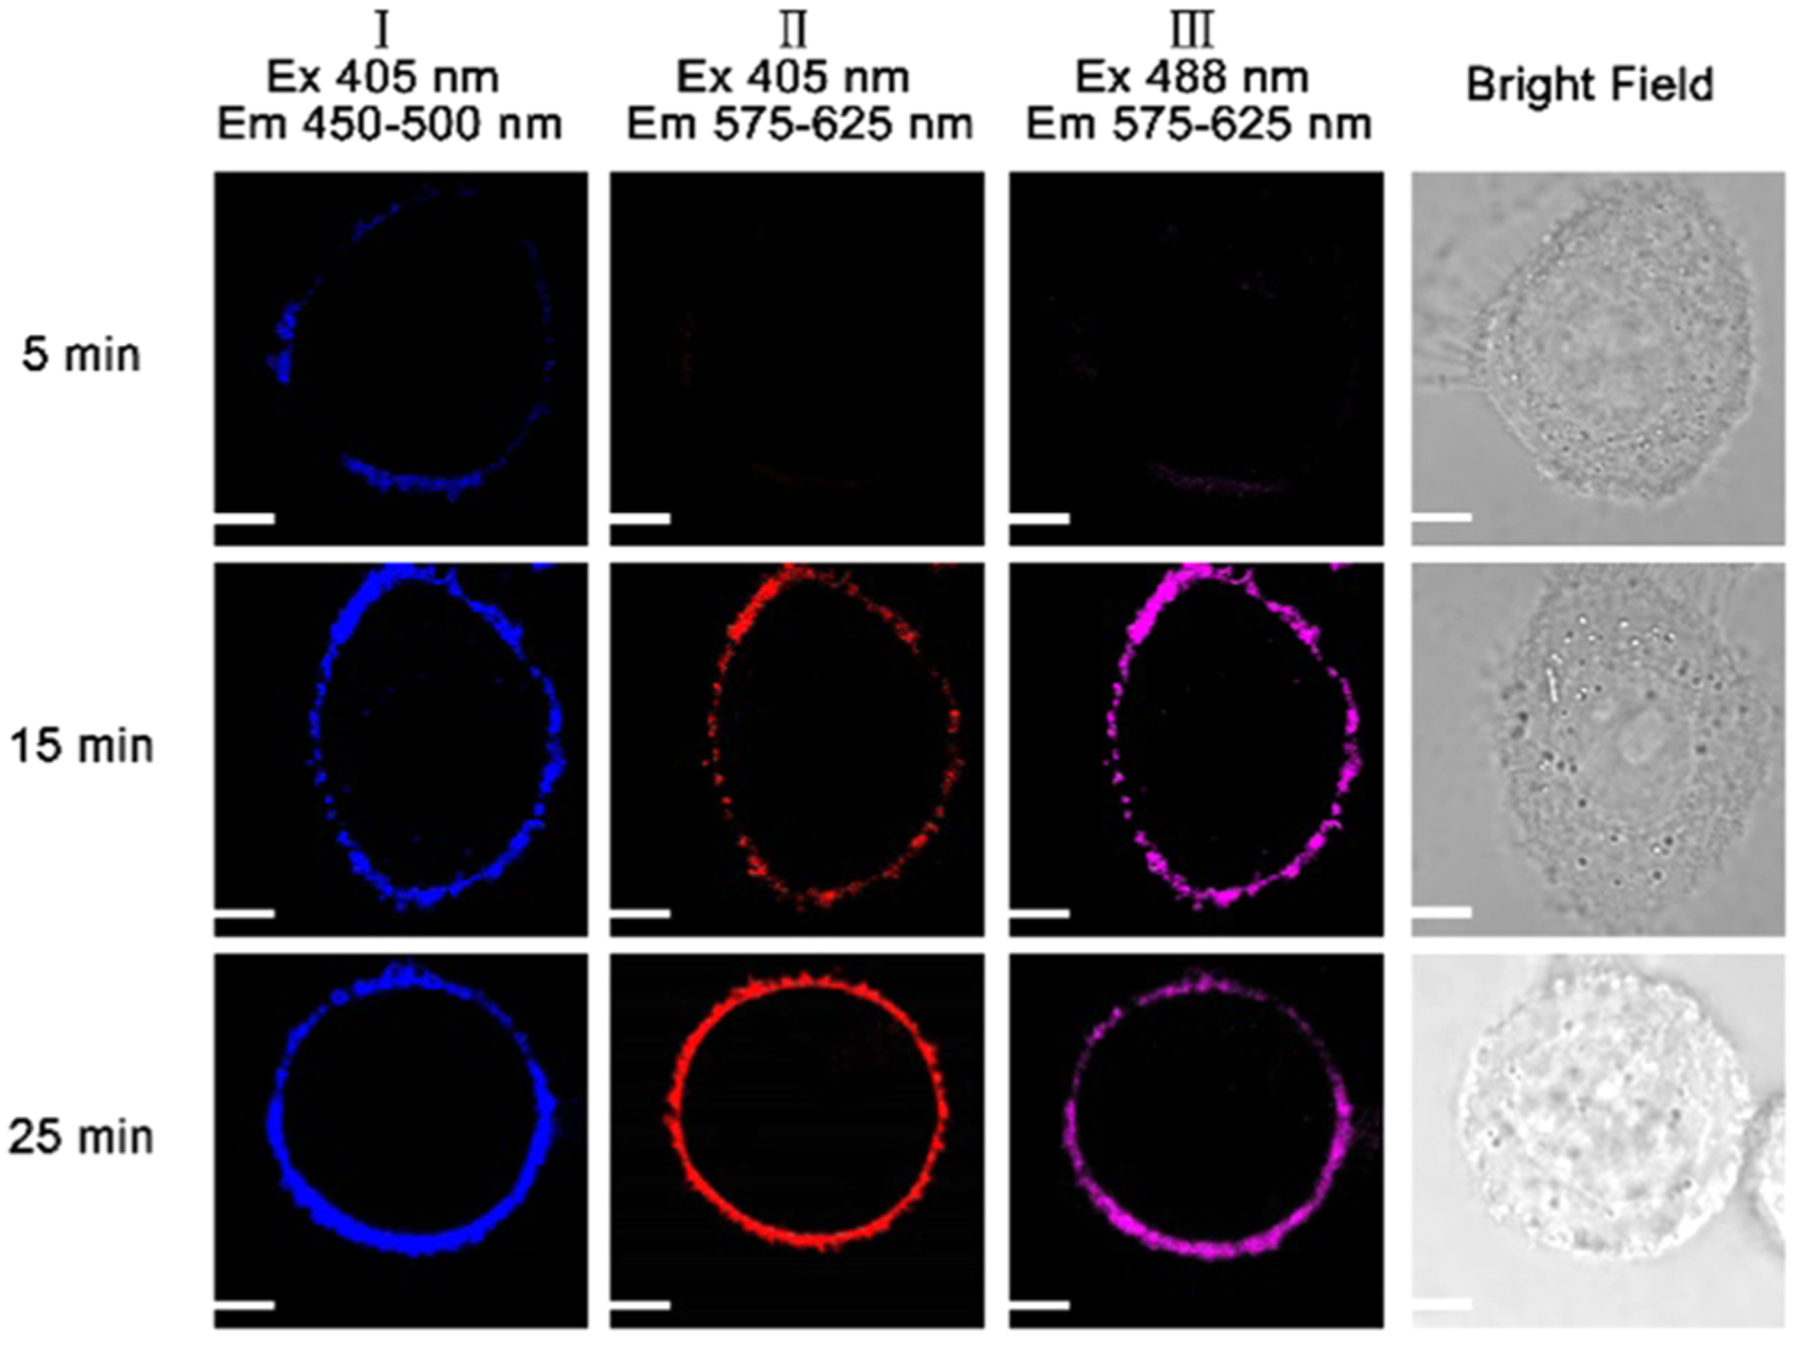
Fluorescence images of HeLa cells under different incubation times with 10 μM probe at 405 and 488 nm excitations. A confocal fluorescence microscope (Olympus IX 81) was used to gather cellular fluorescence images. Scale bar: 2 μm.
Figure 8.
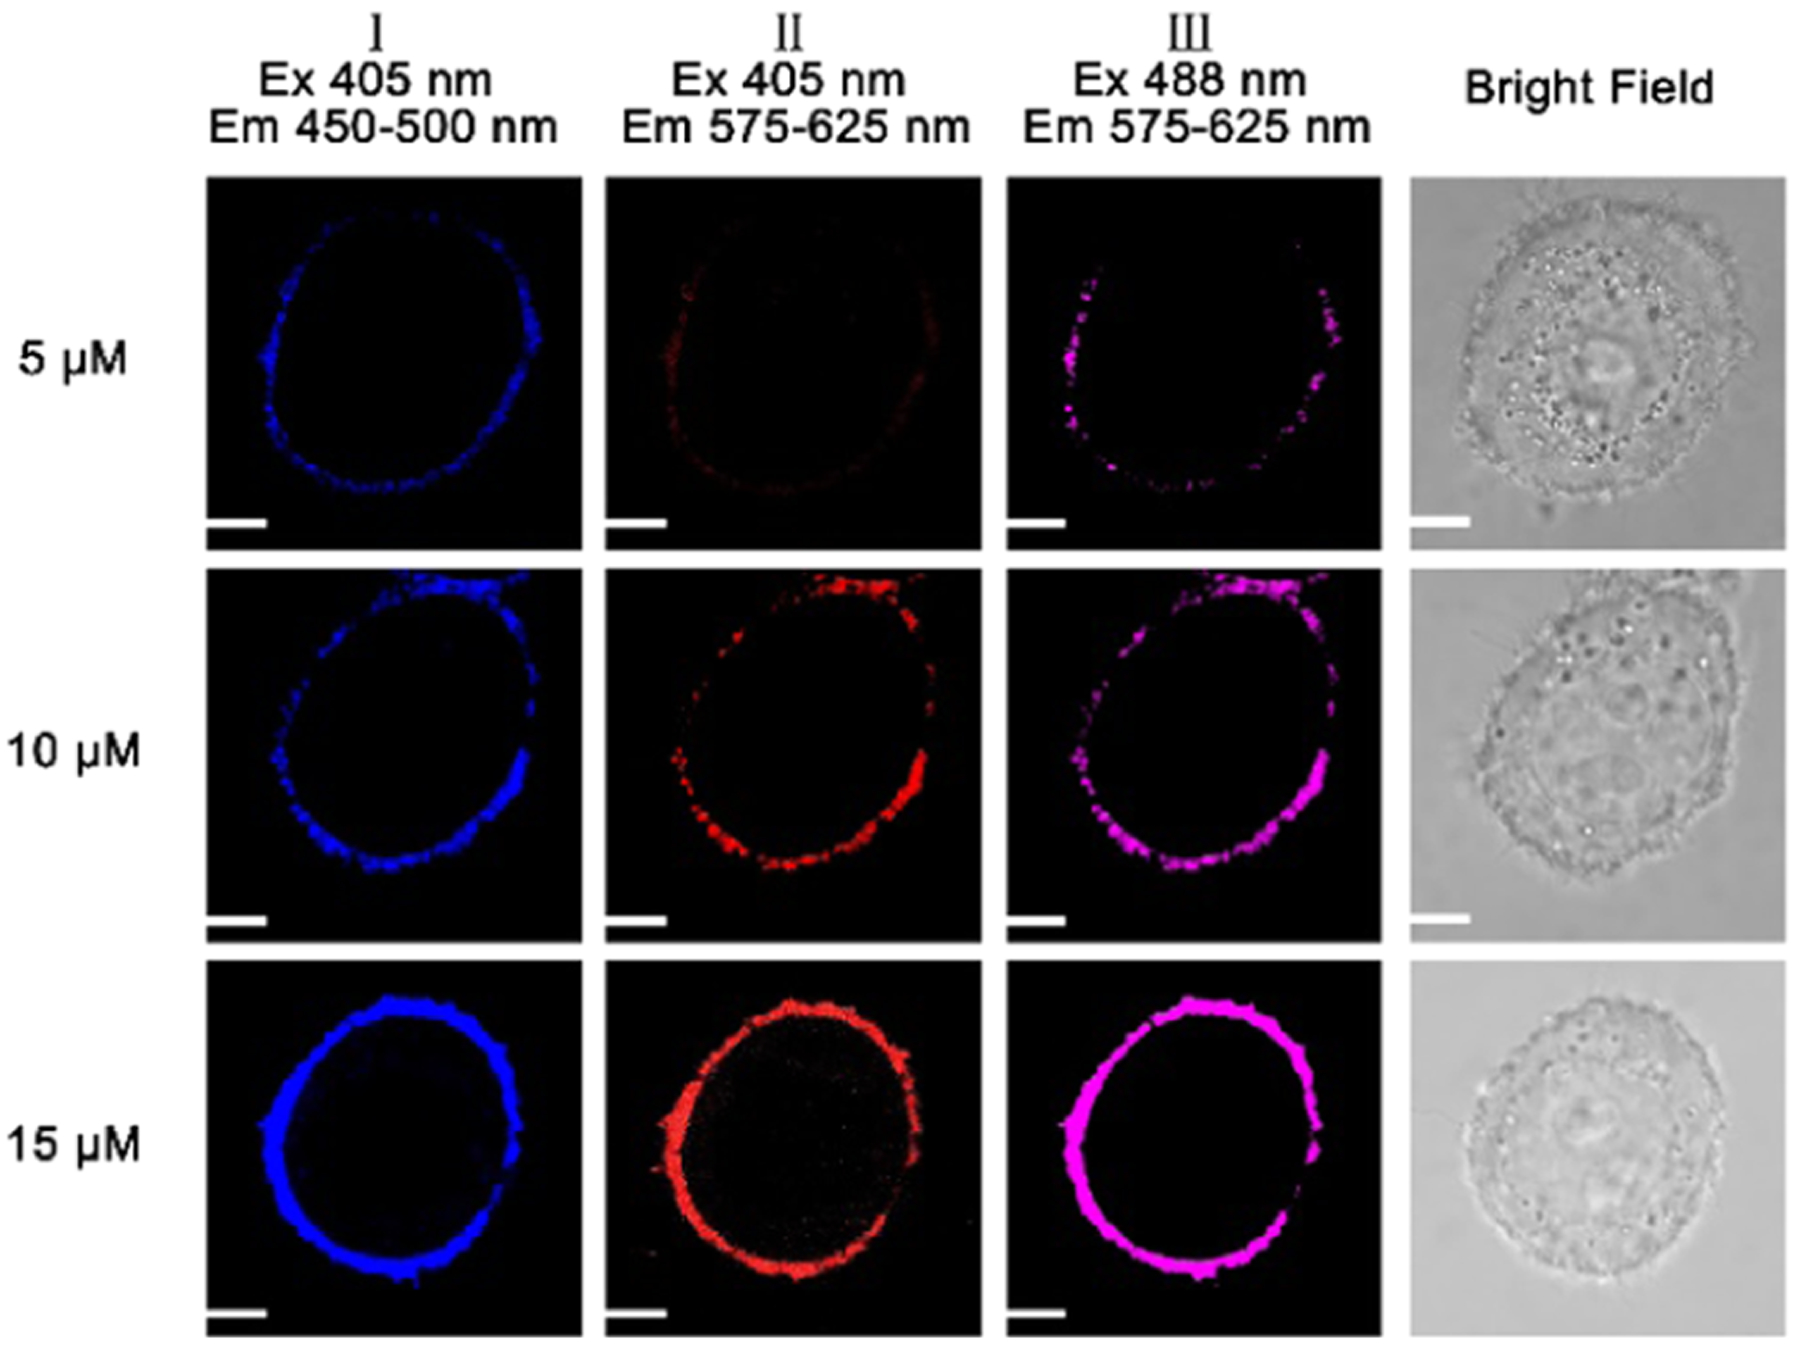
Fluorescence images of HeLa cells incubated with different probe concentrations of 5, 10, and 15 μM for 15 incubation minutes under 405 and 488 nm excitations. A confocal fluorescence microscope (Olympus IX 81) was applied to obtain cellular fluorescence images. Scale bar: 2 μm.
To demonstrate that the probe can also stain other cell membranes, we incubated breast cancer MCF-7 cells with probe A and commercial membrane-specific probe (CellBrite cytoplasmic NIR dye) for 15 min under excitation of 405 and 488 nm for probe A, and 630 nm for the commercial probe (Figure 9). Colocalization experiments of fluorescence of probe A in blue channel I with near-infrared fluorescence of the commercial membrane-specific probe gave a Pearson correlation coefficient of 0.93, which indicates that the probe can specifically target cell membranes of breast cancer MCF-7 cells (Figure 9).
Figure 9.
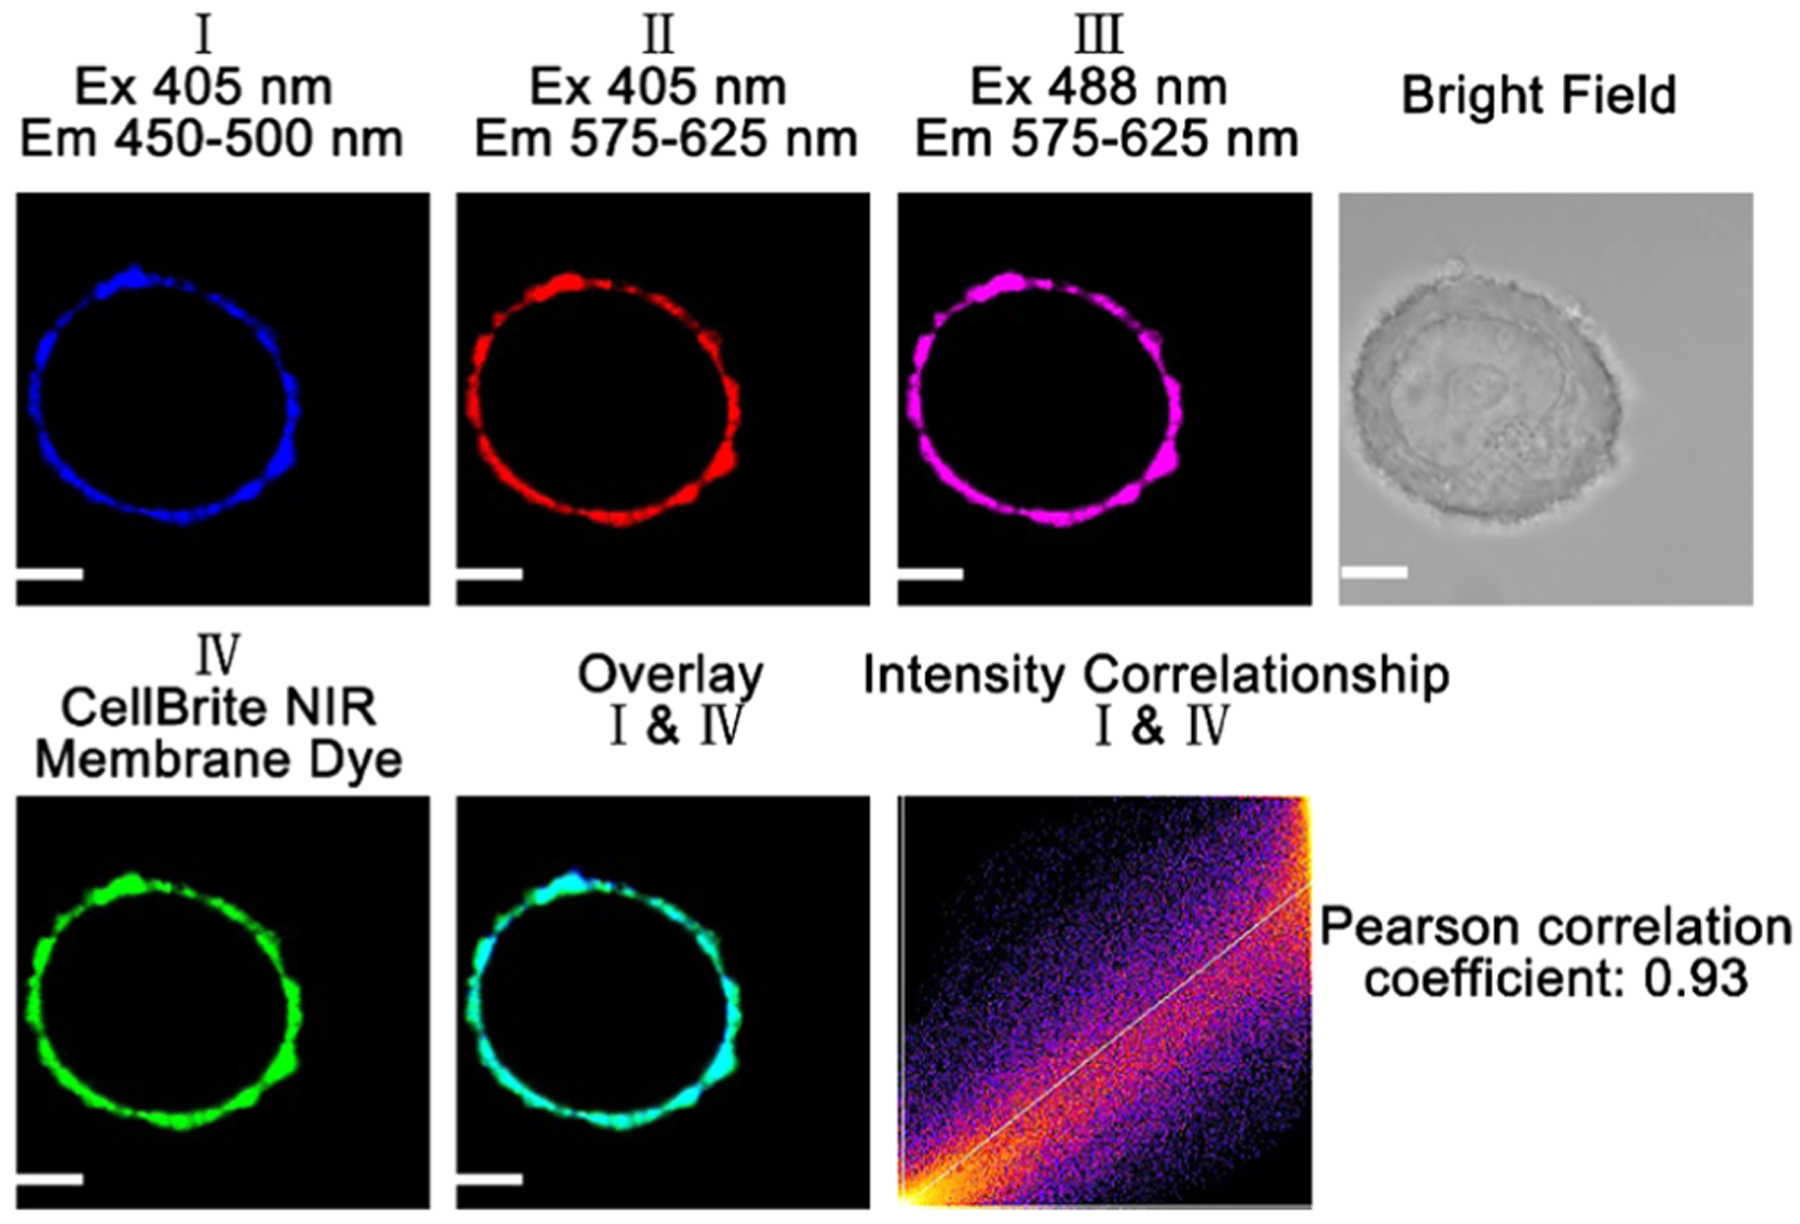
Fluorescence images of a breast cancer MCF-7 cell incubated with 10 μM probe A and 5 μM CellBrite cytoplasmic NIR dye under excitation of 405 and 488 nm for the probe, and 630 nm for CellBrite cytoplasmic NIR dye. Pearson correlation coefficient of channel I with channel IV is 0.93. A confocal fluorescence microscope (Olympus IX 81) was utilized to perform cellular fluorescence imaging. Scale bar: 2 μm.
We next studied the photostability of the probe in cellular imaging by increasing the scanning time during cellular imaging with confocal fluorescence microscopy (Figure 10). The cellular fluorescence intensity did not increase without the probe in DMEM after HeLa cells were incubated with 10 μM probe A for 15 min and washed twice with PBS buffer and once with DMEM before cellular imaging was conducted. During a 2 min continuous laser exposure, the cellular fluorescence intensities in channels I, II, and III are unchanged under continuous excitation at 405 and 488 nm (Figure 10). Under a 5 min continuous laser exposure, the cellular fluorescence intensity of channel I slightly decreases under excitation of 405 nm, while the cellular fluorescence intensities of channels II and III decrease by 5% under excitation at 405 and 488 nm (Figure 10). These results indicate that the probe has excellent photostability under two different excitation wavelengths, i.e., at 405 and 488 nm.
Figure 10.
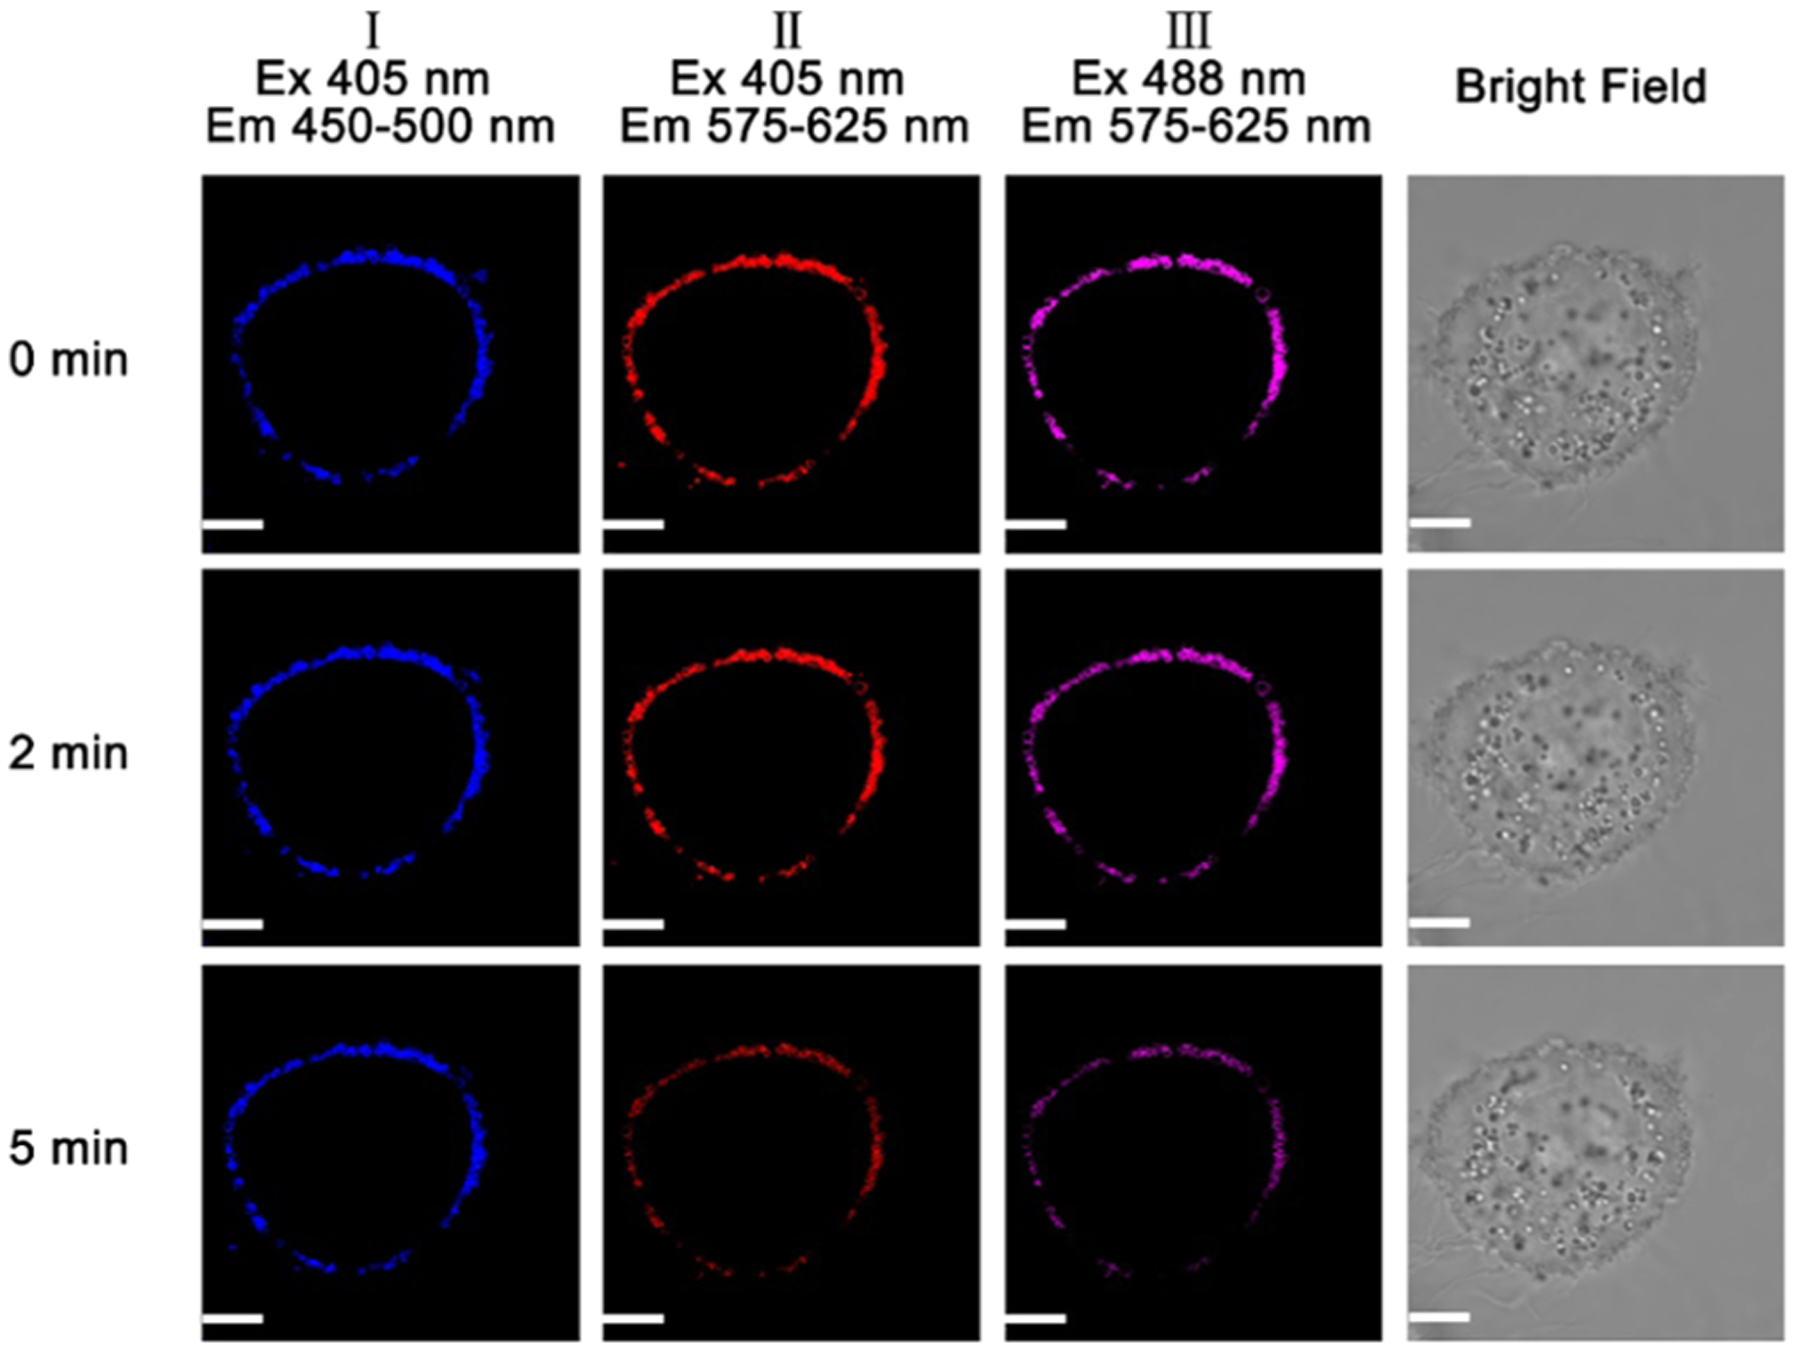
Fluorescence images of HeLa cells incubated with 10 μM probe for 15 min of initial incubation under 405 and 488 nm excitations with increasing scanning time (0–5 min). A confocal fluorescence microscope (Olympus IX 81) was used to conduct cellular fluorescence imaging. Scale bar: 2 μm.
Florescence Imaging of D. melanogaster First-Instar Larvae.
Fluorescence imaging on live D. melanogaster first-instar larvae was conducted to verify if probe A is suitable for use in a multicellular organism (Figure 11). The unstained larvae did not show any background fluorescence. They were then incubated for 2 h with probe A, and intense fluorescence in the red and green channels was observed under excitation at 405 and 488 nm, while a weaker fluorescence in the blue channel was detected under 405 nm excitation. We detected fluorescence in the tracheal system of the larvae, as well as the anal plate and parts of the hindgut.
Figure 11.
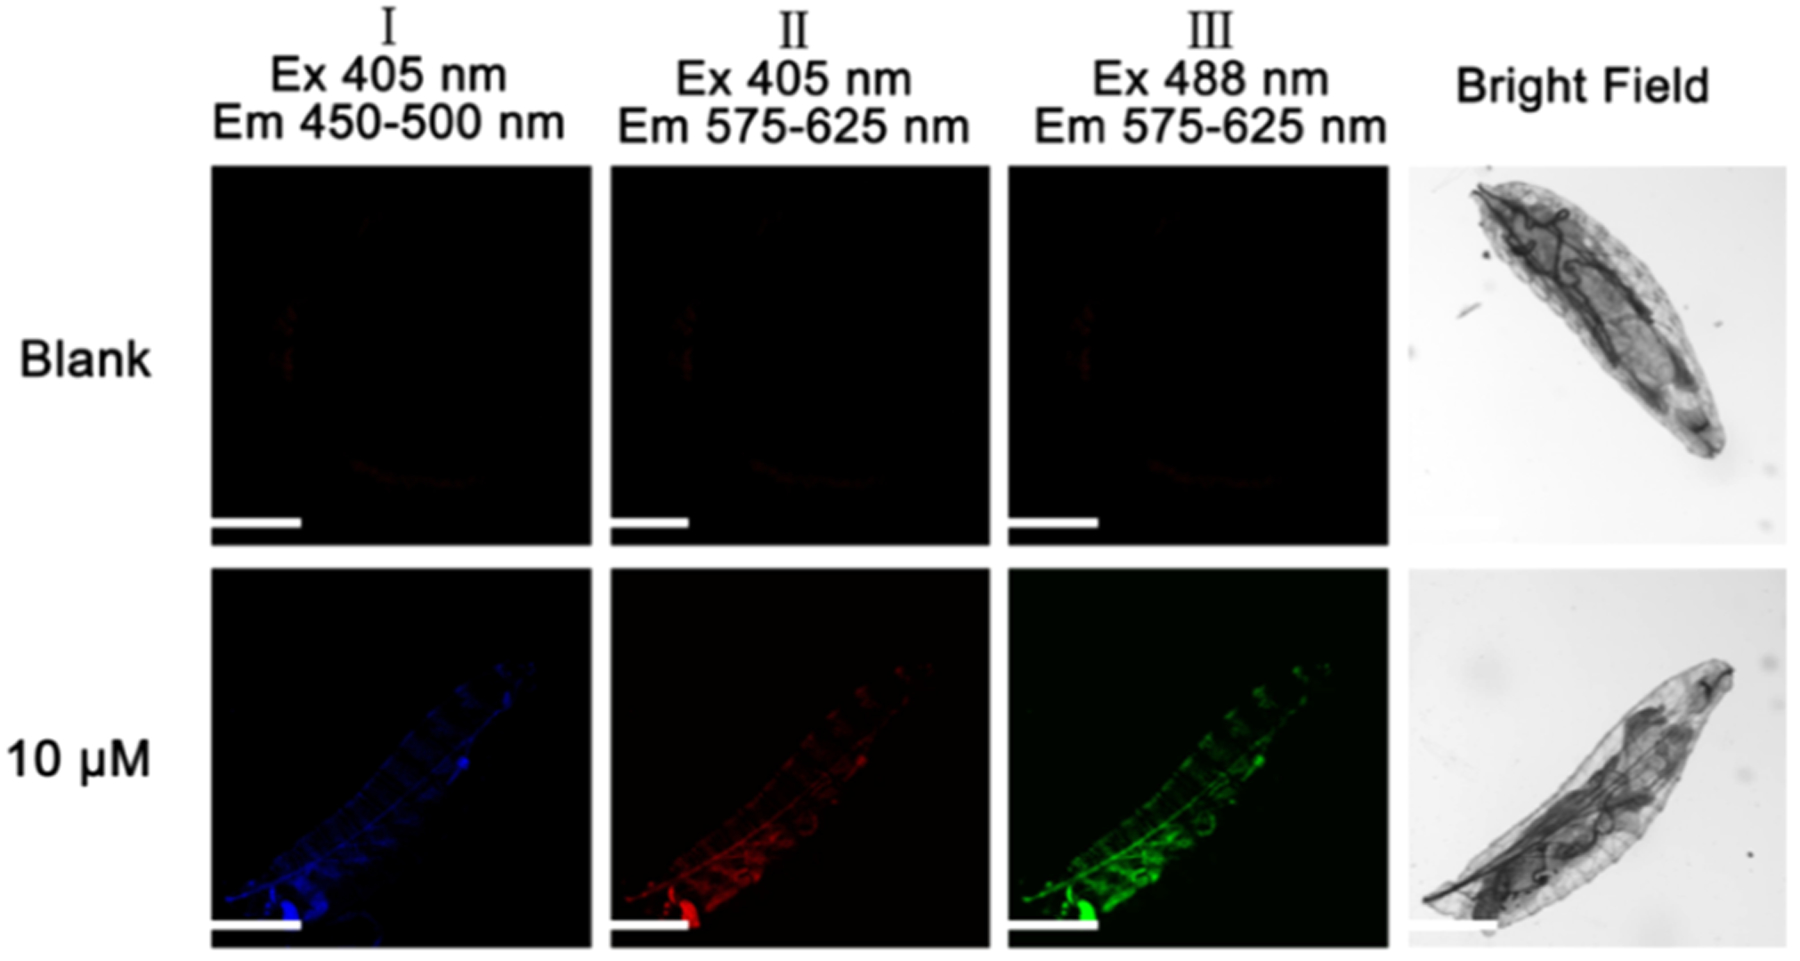
Fluorescence imaging of D. melanogaster first-instar larvae in blank form and also incubated for 2 h with 10 μM probe A under 405 and 488 nm excitations. A confocal fluorescence microscope (Olympus IX 81) was utilized to acquire cellular fluorescence images. Scale bar: 200 μm.
CONCLUSIONS
A fluorescent probe consisting of a coumarin dye and a TPE derivative with an α,β-unsaturated ketone (chalcone) connection has been prepared for specifically staining cell membranes. The probe exhibits an outstanding aggregation-induced emission (AIE) property with well-defined dual emissions of 482 and 591 nm in mostly aqueous solutions. The probe displays low cytotoxicity and good photostability. The probe binds well to cell membranes, although it lacks a long, cell membrane-anchored hydrophobic alkyl chain of previously described membrane-specific probes.
EXPERIMENTAL SECTION
Materials and Instruments.
Synthesis of Compound 3.
Compound 3 was synthesized according to a slightly modified, previously reported procedure. First, zinc powder (5.9 g, 90.8 mmol) was added to a mixed solution of 4-bromobenzophenone (5.3 g, 20.3 mmol) and 4,4′-dimethoxybenzophenone (3.8 g, 15.7 mmol) in THF (80 mL). Titanium tetrachloride (5.0 mL) was added dropwise to the mixture at 0 °C, after which the mixture was slowly heated to room temperature, followed by heating at reflux temperatures for 8 h. After the mixture was cooled down in an ice-water bath, a saturated sodium bicarbonate aqueous solution (50 mL) was slowly added. The resulting mixture was extracted 3 times with ethyl acetate (100 mL), and the combined organic phase was further washed with brine solution (100 mL) twice and, finally, dried over MgSO4. The filtrate was collected through the mixture filtration and concentrated. The residue was purified with column chromatography and eluted with hexane/DCM = 5:1, yielding compound 3 as a white solid. Compound 3 was characterized and found to display NMR spectra consistent with those reported previously.21
Synthesis of Compound 4.
1.6 M n-Butyllithium in hexane (6.0 mL) was added slowly to compound 3 (3.0 g, 6.4 mmol) in 50 mL of dry THF at −78 °C. After the mixture was stirred at −78 °C for 2 h, 3.5 mL dry DMF was added to the reaction. The reaction mixture was warmed up to room temperature under stirring for 4 h. A saturated ammonium chloride aqueous solution (10 mL) was used to quench the reaction, and the mixture was extracted with ethyl acetate (100 mL) and washed with water (100 mL) and twice with brine (100 mL). The organic phase was collected and dried over MgSO4. The filtrate was collected through filtration of the mixture and concentrated. The residue went through column chromatography with an eluent (hexane/DCM = 5:1) to give compound 4 as a green solid.21
Synthesis of Compound 7.
A solution of 100 mL acetic acid, 50% HBr (10 mmol), and 3-acetyl-7-(diethylamino)-2H-chromen-2-one was added to Br2 liquid (6 mmol) slowly. This mixture was stirred overnight at room temperature. The solution was concentrated to dryness under reduced pressure, followed by the addition of a 100 mL saturated solution of sodium bicarbonate, allowing for the adjustment of the pH to 8.0. The mixture was extracted with DCM, dried over MgSO4, and filtered. After the filtrate was concentrated, the residue was run through column chromatography with an eluent (hexane/DCM = 6:1), affording compound 7: 3-(2-bromoacetyl)-7-(diethylamino)-2H-chromen-2-one as a yellow-green solid. Compound 7 was characterized and found to be consistent with the reported NMR data.22 1H NMR (400 MHz, chloroform-d) δ 8.51 (d, J = 0.7 Hz, 1H), 7.41 (d, J = 9.0 Hz, 1H), 6.63 (dd, J = 9.0, 2.5 Hz, 1H), 6.46 (d, J = 2.5 Hz, 1H), 4.75 (s, 2H), 3.46 (d, J = 7.1 Hz, 4H), 1.24 (t, J = 7.2 Hz, 6H).
Synthesis of Coumarin Organophoshorus Ylide (8).
A catalytic amount of potassium iodide was added to dichloromethane (DCM) containing triphenylphosphine (1.12 g, 4.57 mmol) and compound 7 (1.29 g, 3.81 mmol), and the reaction mixture was refluxed with heat for 8 h. The solvent was removed, and the residue was run through column chromatography (DCM/methanol = 30:1) to afford the intermediate as a red solid. This solid was dissolved in a mixture of 50 mL DCM and 50 mL saturated aqueous K2CO3 and stirred vigorously for an additional 3 h at room temperature. The organic layer was separated, dried over anhydrous MgSO4, and concentrated in vacuo. The crude solid was run through silica gel column chromatography with an eluent (DCM/methanol = 50:1, v/v), yielding compound 8 as an orange solid.22 Compound 8 was characterized and found to be consistent with the reported NMR data. 1H NMR (400 MHz, chloroform-d) δ 8.79 (s, 1H), 7.88−7.34 (m, 16H), 6.63−6.53 (m, 1H), 6.46−6.35 (m, 1H), 3.51–3.33 (q, J = 5.2 Hz 4H), 1.21 (d, J = 5.0 Hz, 6H).
Synthesis of Probe A.
Compounds 4 (420 mg, 1 mmol) and 8 (560 mg, 1.05 mmol) were put in 10 mL methanol and stirred for 24 h at room temperature. The solvent was then removed, and the residue was extracted with dichloromethane (100 mL) 3 times and washed with saline. The organic layer was collected, dried over anhydrous MgSO4, filtered, and concentrated under vacuum to yield the crude product. Further purification of the crude product was conducted by silica gel column chromatography eluting with dichloromethane to give probe A as a yellow solid, with a reaction yield of 90%. 1H NMR (400 MHz, chloroform-d) δ 8.51 (s, 1H), 8.02 (d, J = 15.7 Hz, 1H), 7.72 (d, J = 15.6 Hz, 1H), 7.40 (d, J = 8.5, Hz, 3H), 7.08 (s, 3H), 7.05–6.97 (m, 4H), 6.93 (d, J = 6.2 Hz, 4H), 6.66−6.57 (m, 5H), 6.46 (d, J = 2.1 Hz, 1H), 3.72 (d, J = 6.7 Hz, 6H), 3.44 (d, J = 7.1 Hz, 4H), 1.27−1.17 (m, 6H). 13C NMR (101 MHz, chloroform-d) δ 186.54, 161.05, 153.03, 148.08, 144.05, 143.43, 141.23, 138.70, 136.27, 133.17, 132.79, 131.98, 128.44, 127.96, 126.43, 124.37, 116.94, 113.14, 110.03, 108.82, 96.80, 55.38, 45.48, 12.83. HRMS = 661.2823, calculated MS = 661.2828.
Theoretical Calculation on Probe A.
A model of the probe was generated using previously published procedures.24 This consisted of MM2 minimizing of the energies of a Chem3d model,25 followed by force field (UFF) calculations in Avogadro.26 Density functional theory (DFT), using the APFD functional27 and electron basis sets initially at the 6–31g(d) level, led to convergence of the atomic positions in Gaussian 16.28 The results from this level were refined in a polarizable continuum model (PCM) of water29 with 6–31g(d,p) basis sets and frequency calculations conducted. Imaginary frequencies were not obtained. This was followed by refinement with the 6–311+g(d) level to convergence using the same criteria, and again imaginary frequencies were not observed. The excited states were assessed using TD-DFT optimizations30 in a polarizable continuum model (PCM)29 in both water and tetrahydrofuran29 with the 6–311+g(d) basis set. Results for all data and figures were interpreted using GaussView 631 and are presented in the Supporting Information.
Cytotoxicity of the Probe via an MTT Assay.
A standard MTT assay was conducted by seeding HeLa cells with a density of about 6000 cells per well in a 96-well plate, treating the cells with probe A at various concentrations from 0, 5, 10, 15, 20 to 50 μM in fresh culture medium and further incubating them for 48 h. The cells under the probe treatment were further incubated with a proliferation reagent, tetrazolium salt (3-(4,5-dimethylthiazol-2-yl)-2,5-diphenyl tetrazolium bromide) (500 μg/mL) for 4 h, and detected by measuring the absorbance of the purple formazan at 490 nm through reduction of the yellow proliferation reagent by a cellular reductase. The cell viability percentage was determined by using the following equation
where A stands for the absorbance of the experimental group, AC represents the absorbance of the control group with only cell medium in the absence of the probe, and AB is the absorbance of the blank group without any cells.
Cell Imaging.
HeLa or MCF-7 cells were put in confocal glass dishes (35 mm, MatTek) with 1 × 10⁵ cells each dish and cultured in Dulbecco’s modified Eagle’s medium (DMEM) with 10% FBS and 100 IU/mL penicillin and streptomycin at 37 °C under humidified conditions equilibrated with 5% CO2 for 24 h. HeLa or MCF-7 cells were incubated with 10 μM of the probe and the CellBrite cell membrane NIR dye in normal medium containing 1% DMSO for 15 min and washed twice with PBS buffer and once with DMEM before cellular imaging was conducted by employing a confocal fluorescence microscope from Olympus IX 81, Olympus America Inc. with a 100× objective lens. The fluorescence of the CellBrite cell membrane NIR dye was under 630 nm excitation, while the fluorescence of the probe was excited at 405 and 488 nm. An Olympus FV10-ASW 3.1 viewer with Image Pro6 software, and Fiji (ImageJ) were used to further process the cellular images.
Fluorescence Imaging of D. melanogaster Larvae.
First-instar larvae were incubated in 5 μM probe A or deionized water (negative control) for 2 h and then washed 3 times with water. The larvae were mounted between a slide and a coverslip and imaged under the conditions described for the HeLa cells.
Supplementary Material
ACKNOWLEDGMENTS
This research work was supported by the National Institute of General Medical Sciences of the National Institutes of Health under Award Numbers R15GM114751 and 2R15GM114751-02 (H.L.). R.L.L. appreciated using a high-performance computing infrastructure at Michigan Technological University for the calculations. The authors thank the Graduate School of Michigan Technological University for financial support for S.X. in the form of a Finishing Fellowship.
Footnotes
Supporting Information
The Supporting Information is available free of charge at https://pubs.acs.org/doi/10.1021/acsami.0c00903.
Summary of cell membrane-specific fluorescent probes, theoretical calculation of probe A, fluorescence quantum yield, 1H and 13C NMR spectra of probe A, absorption and fluorescence spectra of probe A in mixed THF and water solutions, selectivity of probe A, and cellular images of HeLa cells incubated with 10 μM probe A (PDF)
The authors declare no competing financial interest.
Contributor Information
Yibin Zhang, Department of Chemistry, Michigan Technological University, Houghton, Michigan 49931, United States.
Yunnan Yan, Department of Chemistry, Michigan Technological University, Houghton, Michigan 49931, United States.
Shuai Xia, Department of Chemistry, Michigan Technological University, Houghton, Michigan 49931, United States.
Shulin Wan, Department of Chemistry, Michigan Technological University, Houghton, Michigan 49931, United States.
Tessa E. Steenwinkel, Department of Biological Sciences, Michigan Technological University, Houghton, Michigan 49931, United States
Jerry Medford, Department of Chemistry, Michigan Technological University, Houghton, Michigan 49931, United States.
Emma Durocher, Department of Chemistry, Michigan Technological University, Houghton, Michigan 49931, United States.
Rudy L. Luck, Department of Chemistry, Michigan Technological University, Houghton, Michigan 49931, United States
Thomas Werner, Department of Biological Sciences, Michigan Technological University, Houghton, Michigan 49931, United States.
Haiying Liu, Department of Chemistry, Michigan Technological University, Houghton, Michigan 49931, United States.
REFERENCES
- (1).Kreder R; Oncul S; Kucherak OA; Pyrshev KA; Real E; Mely Y; Klymchenko AS Blue fluorogenic probes for cell plasma membranes fill the gap in multicolour imaging. RSC Adv 2015, 5, 22899–22905. [Google Scholar]
- (2).Shynkar VV; Klymchenko AS; Kunzelmann C; Duportail G; Muller CD; Demchenko AP; Freyssinet JM; Mely Y Fluorescent biomembrane probe for ratiometric detection of apoptosis. J. Am. Chem. Soc 2007, 129, 2187–2193. [DOI] [PubMed] [Google Scholar]
- (3).Heek T; Nikolaus J; Schwarzer R; Fasting C; Welker P; Licha K; Herrmann A; Haag R An Amphiphilic Perylene Imido Diester for Selective Cellular Imaging. Bioconjugate Chem 2013, 24, 153–158. [DOI] [PubMed] [Google Scholar]
- (4).Ye Y; Zheng Y; Ji CD; Shen J; Yin MZ Self-Assembly and Disassembly of Amphiphilic Zwitterionic Perylenediimide Vesicles for Cell Membrane Imaging. ACS Appl. Mater. Interfaces 2017, 9, 4534–4539. [DOI] [PubMed] [Google Scholar]
- (5).Danylchuk DI; Moon S; Xu K; Klymchenko AS Switchable Solvatochromic Probes for Live-Cell Super-resolution Imaging of Plasma Membrane Organization. Angew. Chem., Int. Ed 2019, 58, 14920–14924. [DOI] [PubMed] [Google Scholar]
- (6).Kucherak OA; Oncul S; Darwich Z; Yushchenko DA; Arntz Y; Didier P; Mely Y; Klymchenko AS Switchable Nile Red-Based Probe for Cholesterol and Lipid Order at the Outer Leaflet of Biomembranes. J. Am. Chem. Soc 2010, 132, 4907–4916. [DOI] [PubMed] [Google Scholar]
- (7).Xu S; Liu HW; Yin X; Yuan L; Huan SY; Zhang XB A cell membrane-anchored fluorescent probe for monitoring carbon monoxide release from living cells. Chem. Sci 2019, 10, 320–325. [DOI] [PMC free article] [PubMed] [Google Scholar]
- (8).Zhang CQ; Jin SB; Yang KN; Xue XD; Li ZP; Jiang YG; Chen WQ; Dai LR; Zou GZ; Liang XJ Cell Membrane Tracker Based on Restriction of Intramolecular Rotation. ACS Appl. Mater. Interfaces 2014, 6, 8971–8975. [DOI] [PubMed] [Google Scholar]
- (9).Zhang WJ; Huang YH; Chen YL; Zhao EG; Hong YN; Chen SJ; Lam JWY; Chen YC; Hou JQ; Tang BZ Amphiphilic Tetraphenylethene-Based Pyridinium Salt for Selective Cell-Membrane Imaging and Room-Light-Induced Special Reactive Oxygen Species Generation. ACS Appl. Mater. Interfaces 2019, 11, 10567–10577. [DOI] [PubMed] [Google Scholar]
- (10).Zhang XF; Wang C; Jin LJ; Han Z; Xiao Y Photostable Bipolar Fluorescent Probe for Video Tracking Plasma Membranes Related Cellular Processes. ACS Appl. Mater. Interfaces 2014, 6, 12372–12379. [DOI] [PubMed] [Google Scholar]
- (11).Collot M; Boutant E; Lehmann M; Klymchenko AS BODIPY with Tuned Amphiphilicity as a Fluorogenic Plasma Membrane Probe. Bioconjugate Chem 2019, 30, 192–199. [DOI] [PubMed] [Google Scholar]
- (12).Collot M; Kreder R; Tatarets AL; Patsenker LD; Mely Y; Klymchenko AS Bright fluorogenic squaraines with tuned cell entry for selective imaging of plasma membrane vs. endoplasmic reticulum. Chem. Commun 2015, 51, 17136–17139. [DOI] [PubMed] [Google Scholar]
- (13).Liu P; Li S; Jin YC; Qian LH; Gao NY; Yao SQ; Huang F; Xu QH; Cao Y Red-Emitting DPSB-Based Conjugated Polymer Nanoparticles with High Two-Photon Brightness for Cell Membrane Imaging. ACS Appl. Mater. Interfaces 2015, 7, 6754–6763. [DOI] [PubMed] [Google Scholar]
- (14).Huang BH; Geng ZR; Yan SH; Li Z; Cai J; Wang ZL Water-Soluble Conjugated Polymer as a Fluorescent Probe for Monitoring Adenosine Triphosphate Level Fluctuation in Cell Membranes during Cell Apoptosis and in Vivo. Anal. Chem 2017, 89, 8816–8821. [DOI] [PubMed] [Google Scholar]
- (15).Cui QL; Wang XY; Yang Y; Li SL; Li LD; Wang S Binding-Directed Energy Transfer of Conjugated Polymer Materials for Dual-Color Imaging of Cell Membrane. Chem. Mater 2016, 28, 4661–4669. [Google Scholar]
- (16).Gao M; Tang BZ Fluorescent Sensors Based on Aggregation-Induced Emission: Recent Advances and Perspectives. ACS Sens 2017, 2, 1382–1399. [DOI] [PubMed] [Google Scholar]
- (17).Wang LY; Yang LL; Cao DR Application of Aggregation-Induced Emission (AIE) Systems in Sensing and Bioimaging. Curr. Org. Chem 2014, 18, 1028–1049. [Google Scholar]
- (18).Liang J; Tang B; Liu B Specific light-up bioprobes based on AIEgen conjugates. Chem. Soc. Rev 2015, 44, 2798–2811. [DOI] [PubMed] [Google Scholar]
- (19).Wang JB; Xia S; Bi JH; Zhang YB; Fang MX; Luck RL; Zeng YB; Chen TH; Lee HM; Liu HY Near-infrared fluorescent probes based on TBET and FRET rhodamine acceptors with different pK(a) values for sensitive ratiometric visualization of pH changes in live cells. J. Mater. Chem. B 2019, 7, 198–209. [DOI] [PMC free article] [PubMed] [Google Scholar]
- (20).Wang JB; Xia S; Bi JH; Fang MX; Mazi WF; Zhang YB; Conner N; Luo FT; Lu HP; Liu HY Ratiometric Near-Infrared Fluorescent Probes Based On Through Bond Energy Transfer and pi-Conjugation Modulation between Tetraphenylethene and Hemicyanine Moieties for Sensitive Detection of pH Changes in Live Cells. Bioconjugate Chem 2018, 29, 1406–1418. [DOI] [PMC free article] [PubMed] [Google Scholar]
- (21).Yuan Y; Zhang C-J; Gao M; Zhang R; Tang BZ; Liu B Specific Light-Up Bioprobe with Aggregation-Induced Emission and Activatable Photoactivity for the Targeted and Image-Guided Photodynamic Ablation of Cancer Cells. Angew. Chem., Int. Ed 2015, 54, 1780–1786. [DOI] [PubMed] [Google Scholar]
- (22).Zhou Q; Li K; Liu Y-H; Li L-L; Yu K-K; Zhang H; Yu X-Q Fluorescent Wittig reagent as a novel ratiometric probe for the quantification of 5-formyluracil and its application in cell imaging. Chem. Commun 2018, 54, 13722–13725. [DOI] [PubMed] [Google Scholar]
- (23).Adamo C; Jacquemin D The calculations of excited-state properties with Time-Dependent Density Functional Theory. Chem. Soc. Rev 2013, 42, 845–856. [DOI] [PubMed] [Google Scholar]
- (24).Zhang Y; Bi J; Xia S; Mazi W; Wan S; Mikesell L; Luck RL; Liu H A near-infrared fluorescent probe based on a FRET rhodamine donor linked to a cyanine acceptor for sensitive detection of intracellular pH alternations. Molecules 2018, 23 (10), 2679/1–2679/15. [DOI] [PMC free article] [PubMed] [Google Scholar]
- (25).ChemBio 3D. ChemBio3D http://www.cambridgesoft.com/software/chembio3d, 2012.
- (26).Hanwell MD; Curtis DE; Lonie DC; Vandermeersch T; Zurek E; Hutchison GR Avogadro: an advanced semantic chemical editor, visualization, and analysis platform. J. Cheminf 2012, 4 (1), 17. [DOI] [PMC free article] [PubMed] [Google Scholar]
- (27).Austin A; Petersson GA; Frisch MJ; Dobek FJ; Scalmani G; Throssell K A Density Functional with Spherical Atom Dispersion Terms. J. Chem. Theory Comput 2012, 8 (12), 4989–5007. [DOI] [PubMed] [Google Scholar]
- (28).Frisch MJ; Trucks GW; Schlegel HB; Scuseria GE; Robb MA; Cheeseman JR; Scalmani G; Barone V; Mennucci B; Petersson GA; Nakatsuji H; Caricato M; Li X; Hratchian HP; Izmaylov AF; Bloino J; Zheng G; Sonnenberg JL; Hada M; Ehara M; Toyota K; Fukuda R; Hasegawa J; Ishida M; Nakajima T; Honda Y; Kitao O; Nakai H; Vreven T; Montgomery JA Jr.; Peralta JE; Ogliaro F; Bearpark M; Heyd JJ; Brothers E; Kudin KN; Staroverov VN; Kobayashi R; Normand J; Raghavachari K; Rendell A; Burant JC; Iyengar SS; Tomasi J; Cossi M; Rega N; Millam JM; Klene M; Knox JE; Cross JB; Bakken V; Adamo C; Jaramillo J; Gomperts R; Stratmann RE; Yazyev O; Austin AJ; Cammi R; Pomelli C; Ochterski JW; Martin RL; Morokuma K; Zakrzewski VG; Voth GA; Salvador P; Dannenberg JJ; Dapprich S; Daniels AD; Farkas O; Foresman JB; Ortiz JV; Cioslowski J; Fox DJ Gaussian 16, Gaussian, Inc.: Wallingford, CT, 2016. [Google Scholar]
- (29).Cances E; Mennucci B; Tomasi J A new integral equation formalism for the polarizable continuum model: Theoretical background and applications to isotropic and anisotropic dielectrics. J. Chem. Phys 1997, 107 (8), 3032–3041. [Google Scholar]
- (30).Casida ME; Jamorski C; Casida KC; Salahub DR Molecular excitation energies to high-lying bound states from time-dependent density-functional response theory: Characterization and correction of the time-dependent local density approximation ionization threshold. J. Chem. Phys 1998, 108, 4439–4449. [Google Scholar]
- (31).GaussView; 6, V Dennington R; Keith TA; Millam JM Semichem Inc.: Shawnee Mission, KS, 2016. [Google Scholar]
Associated Data
This section collects any data citations, data availability statements, or supplementary materials included in this article.