

Abstract
Tantalate is considered as a valuable and efficient luminescence host because of its intense absorption in the ultraviolet area and excellent chemical properties. In this work, a series of pure YTaO4:Eu3+ and/or Tb3+ crystals were prepared via a sol–gel combustion method. The morphology, structure, and optical properties of the samples were discussed in detail. The Eu3+, Tb3+ co-doped YTaO4 samples are consisted of small spherical particles of around 18 nm. The prepared YTaO4:Tb3+ and/or Eu3+ samples exhibit the characteristic wide excitation band around 210–300 nm, the characteristic narrow red emission of Eu3+ (5D0 → 7F2) transitions and green emission of the Tb3+ (5D4 → 7F5) transitions when excited by UV light. It is focused on the energy transfer processes from the YTaO4 to Tb3+ as well as Eu3+ ions and from Tb3+ to Eu3+ ions of YTaO4:Eu3+/Tb3+ phosphors. Color-tunable emissions are realized through adjusting the types of rare earth ion (Eu3+ and Tb3+) and relative doping concentrations excited by a single wavelength. That is to say, the obtained Tb3+ and Eu3+ co-doped YTaO4 phosphors have a promising prospect in lasers, white light diodes (WLED), fluorescent lamp, and field emission display devices, etc.
Introduction
At present, owing to the advantages of friendly environment, nice color rendering index and excellent luminescent performance, rare earth active oxide phosphors have been got quite attention in imaging, lighting, display, and other fields. In general, high temperature solid-state method is a common way to synthesize rare earth activated oxide phosphors. Unfortunately, the traditional solid reaction route is not beneficial to control the particle size and separation of components, and may lead to other problems such as long reaction times and stoichiometric losses caused by evaporation at high temperature in general [1]. Therefore, it is still necessary to develop some timesaving and low temperature methods to synthesize the target product such as the hydrothermal method, supersonic microwave co-assistance method, sol–gel method[2–6]. Among these routes, sol–gel combustion method is a good choice because it can obtain stable precursors and nanometer phosphors with homogeneous composition and high purity. Compared with bulk materials, nanophosphors have a large number of surface atoms. Therefore, the interaction between nanophosphor and the incident UV light is much higher than that of its bulk counterpart. Additionally, nanophosphors have the advantages of better absorption, high conversion efficiency, and high color rendering [7–11]. All of these advantages of reduced dimension phosphors make them easier to use in modern applications [12].
Compared with the common LED used for lighting, the deep UV LED with the wavelength of 240–280 nm has the outstanding advantages of safety, environmental protection, cold light source, pure light quality, high efficiency, rich wavelength type, easy to compound spectral energy, convenient modulation, etc., which is much suitable for civil use. In addition to being a common germicidal lamp, deep UV LED has been widely used in medical and health fields [13, 14]. At the same time, with the outbreak of the coronavirus, the research on UV-C (280–200 nm) LED with bactericidal effect is more and more urgent. Recently, rare earth ions doped tantalate phosphors have received considerable concern for their important applications in lighting fields [15–19]. YTaO4 is known as an excellent chemical and photoactive host material in virtue of its luminescence performance, high density, high irradiation hardness, strong X-ray absorption, and stable physical and chemical properties [20]. YTaO4 has two crystal phases, one is tetragonal phase (T), namely scheelite structure, with space group I41/a [21], the other is monoclinic phase, including the pyrite phase (M) with I2/a space group and the prime phase (Mʹ) with P2/a space group [22, 23]. The difference of the two structures is essentially on account of the different coordination number of atoms. With M structure, Ta atoms occupy tetrahedral lattice, while in Mʹ structure, Ta atoms exist in twisted octahedral structure [24, 25]. As reported, Rare earth-doped YTaO4 crystal with Mʹ structure can present the charge transfer process more effectively and provide splendid luminescent emission [26–28].
Eu3+ along with Tb3+ ions doped phosphors have been extensively studied on account of their ideal luminescent properties [29, 30]. Besides, based on energy transfer mechanism, the phosphors doped with Eu3+/Tb3+ ions can realize tunable multicolor emission. Particularly, thanks to the 5D0 → 7F1, 2 transitions, the Eu3+-doped phosphors can emit red light [31–37]. Tb3+ can be used as both activator and sensitizer to achieve green light emission due to its 5D4 → 7F5 transitions at approximately 547 nm [38, 39] and improve the emission intensity of activator ions (Eu3+). In addition, Tb3+ ions also broaden the UV–visible absorption region when Tb3+ along with Eu3+ ions co-doping in some hosts owing to the existence of more level transitions [40–43]. It means that owing to the effective energy transfer, the characteristic emission light of Tb3+ and Eu3+ ions can be adjusted to obtain color-tunable phosphors excited by ultraviolet light. Moreover, the strong excitation band in the ultraviolet region of YTaO4 host can effectively transfer absorbed energy to the doped activators. Thereby, it allows the energy to be more fully transmitted to rare earth ions to improve the fluorescence efficiency of the phosphors. Hence, we focus on synthesizing color adjustable phosphors by doping Tb3+ and Eu3+ in YTaO4 host.
In this work, we prepared the phosphors with the composition of YTaO4:Eu3+/Tb3+ by sol–gel combustion method. Photoluminescence properties, energy transfer, and adjustable color were studied closely. Due to the excellent luminescence properties and colorimetric properties of YTaO4:Ln3+ (Ln3+ = Eu3+ and/or Tb3+) samples, there will be potential phosphors used in the fields of display and lighting.
Experimental section
Materials
Yttrium oxide (Y2O3) (99.99%), Terbium oxide (Tb4O7) (99.99%), Europium oxide (Eu2O3) (99.99%), Tantalum oxide (Ta2O5) (99.99%), Citric acid (CA) (Analytical reagent, AR), Nitric acid (HNO3), Ammonia, Ammonium nitrate (NH4NO3) (AR) were used as starting materials. The reagents we used were analytical grade and utilized as purchased without further purification.
Preparation
The corresponding quantities of Y2O3, Eu2O3, and Tb4O7 were put into dilute HNO3 solution, stirred, and heated in ambient atmosphere, and then after evaporation, crystallization, and cooling, the obtained rare earth nitrate crystals were finally configured into the corresponding aqueous solutions to obtain 0.1 mol L−1 Y(NO3)3, 0.05 mol L−1 Eu(NO3)3 and 0.05 mol L−1 Tb(NO3)3 solutions. Eu3+-, Tb3+-doped YTaO4 nanocrystals were obtained by sol–gel combustion method. The typical steps for preparing YTaO4:0.07Tb3+, 0.02Eu3+ are as follows: First, 0.5 mmol of Ta2O5 was completely dissolved in HF acid (40%), and then ammonia solution (25%) was added until the pH equals to 9. The obtained precipitate was centrifuged and washed with deionized water to get rid of the redundant F−, and then dissolved in citric acid aqueous solution at 50 ℃. Subsequently, 0.97 mmol Y(NO3)3, 0.01 mmol Eu(NO3)3, 0.02 mmol Tb(NO3)3 and 1.20 g of NH4NO3 were added into the above solution. Under vigorous stirring at 80 ℃, a high viscosity gel with pale-yellow was formed. Further, the gel was heated at 180 ℃ for 3 h to get a highly condensed porous network dry gel. After that, it was transferred to the muffle furnace and heated to 500 ℃ for 3 h. Finally, grind the solid taupe mass obtained in the previous process into a fine powder and put it into the alumina crucible then for heat treatment at 1000 ℃ for 5 h. The target phosphors were obtained and used for further characterization. The synthesis steps of other samples are the same as that of YTaO4:0.07Tb3+, 0.02 Eu3+ samples except for doping different concentrations of rare earth ions.
Characterization
X-ray diffraction (XRD) measurements were carried out on a Rigaku-Dmax-RA diffractometer using Cu Kα radiation (λ = 0.15406 nm), operating at a scanning speed of 10° min–1 in the 2θ range from 10° to 90°. The morphologies of the samples were analyzed using a FEI-30 field emission scanning electron microscope (FE-SEM) equipped with an energy dispersive X-ray spectrometer (EDX). The photoluminescence measurements were carried out on a HITACHIF-7000 spectrophotometer equipped with a 150-W Xenon lamp as the excitation source. All the measurements were carried out at room temperature.
Results and discussion
Phase identification, structure, and morphology analysis
The XRD patterns of YTaO4:Eu3+/Tb3+ samples synthesized via sol–gel combustion method are shown in Fig. 1a. We can see that all measured peak positions match with YTaO4 standard card (PDF# 24-1425) properly. The obtained YTaO4 powder is a monoclinic structure (M' structure) with P2/a space group and the lattice parameters are a = 5.29, b = 5.45, c = 5.11 Å, and Z = 2. No any other impure phase is detected, suggesting that the replacement of Y3+ ions by Eu3+ and Tb3+ions does not affect the purity of the YTaO4. This is because the radii of Y3+ (r = 0.908 Å), Tb3+ (r = 0.923 Å) and Eu3+ (r = 0.947 Å) ions are similar, and all three ions have the same coordination number (CN = 8). Figure 1b shows the lattice structure as well as atomic coordination of YTaO4. We can see that each tantalum ion and yttrium ion are encircled by six and eight oxygen ions in the YTaO4Mʹ-type structure, respectively, to form a distorted octahedron (TaO6) and a twisted cube (YO8).
Fig. 1.

a XRD patterns of the as-prepared YTaO4:Tb3+, YTaO4:Eu3+ and YTaO4:0.07Tb3+, 0.02 Eu3+ samples, and the corresponding standard data of YTaO4 (PDF No. 24-1425) are given as reference, b the crystal structure of YTaO4 host
The morphology and elemental component of YTaO4:0.07Tb3+, 0.02Eu3+ sample are characterized by FE-SEM and EDX, respectively. Figure 2a illuminates that the phosphors are uniform nanoparticles with a small number of agglomerates and the particle size is about 18 nm, seen from the size distribution histogram of the samples (insert of Fig. 2a). Figure 2b exhibits the EDX spectrum of YTaO4:0.07Tb3+, 0.02Eu3+ phosphor, and we can see the existence of O, Ta, Y, Tb, Eu, and Si elements. The Si element comes from silicon wafer.
Fig. 2.

a FE-SEM image and b EDX spectrum of YTaO4:0.07Tb3+, 0.02 Eu3+ sample. Inset of a is the size distribution histogram
Luminescence properties
The photoluminescence excitation (PLE) and photoluminescence (PL) spectra of Tb3+ singly activated YTaO4 samples are presented in Fig. 3a. When monitored at 547 nm (5D4 → 7F5 transition of Tb3+), there is a strong broadband around 210–300 nm with a maximum at 270 nm in PLE spectrum, corresponding to the charge transfer band of Tb3+–O2− and O2−–Ta5+ in TaO43− group [13], which lead to better luminescent properties of Tb3+ ions in YTaO4 host for UV excitation [44]. It also indicates that the existence of energy transfer between the host lattice (TaO43− group) and the active centers (Tb3+ ions) [45]. In addition, the f-f transitions of Tb3+ ions from the ground state (7F6) to the 5D2 (354 nm), 5L10 (369 nm) and 5G6 (378 nm) states result in several sharp PLE peaks ranged from 320 to 380 nm [46, 47]. Upon 270 nm excitation, the representative emission peaks at 492 nm, 547 nm, 585 nm, and 621 nm in the PL spectrum are corresponded to 5D4 → 7F6, 5, 4, 3 transitions of Tb3+ ions, respectively [48]. The strongest emission peak of YTaO4:0.07Tb3+ phosphor situates at 547 nm in the green area. The PL spectra of the YTaO4:xTb3+ phosphors under 270 nm excitation illuminate that the luminescence intensity of Tb3+ reaches maximum at x = 0.07. When Tb3+ concentration exceeds 0.07, the emission intensity decreases owing to the concentration quenching effect [49, 50].
Fig. 3.

PL excitation spectrum (left) for YTaO4: 0.07Tb3+ and emission spectra (right) for YTaO4:xTb3+ (x = 0.01–0.08) samples. Inset is enlarged excitation spectrum of YTaO4: 0.07Tb3+ at the range of 320 to 380 nm
The PLE and PL spectra of the Eu3+ singly activated YTaO4 phosphor are illustrated in Fig. 4. When 613 nm (5D0 → 7F2 transition) is used as monitoring wavelength, the PLE spectrum consists of a broad band of 210—300 nm centered at 258 nm and a few of weak sharp peaks ranging from 300 to 450 nm, which are corresponded to the charge transfer band transitions of Eu3+–O2− and O2−–Ta5+ [51–53] and the f-f transitions of Eu3+ from the ground state (7F0) to the 5H6 (321 nm), 5D4 (362 nm), 5G4 (384 nm), 5L6 (395 nm), 5D3 (418 nm), 5D2 (466 nm) and 5D1 (537 nm) states [54, 55]. At 258 nm excitation, in PL spectrum, we can see the main peaks at around 578, 593, 613 and 656 nm, which correspond to the 5D0 → 7F0, 5D0 → 7F1, 5D0 → 7F2 and 5D0 → 7F3 transitions of Eu3+ [56]. In addition, the symmetry of the doping position of Eu3+ directly affects the emission intensity of 5D0 → 7F1 and 5D0 → 7F2. If the Eu3+ ion has a site with inversion symmetry, the 5D0 → 7F1 (593 nm) transition dominates, while if the Eu3+ ion holds a site with non-inversion symmetry, the 5D0 → 7F2 transition predominates. In our study, the peak at 613 nm (5D0 → 7F2) is the strongest, which shows that Eu3+ ions locate at non-inversion symmetry center in YTaO4 [57]. It can be concluded that the luminescence intensity reaches maximum at y = 0.02 from the PL spectra of the YTaO4:yEu3+ (y = 0.005–0.04) phosphors under 258 nm excitation. When Eu3+ concentration exceeds to 0.02, the emission intensity reduces owing to the concentration quenching effect [38].
Fig. 4.

PL excitation spectrum (left) for YTaO4: 0.02 Eu3+ and emission spectra (right) for YTaO4:yEu3+ (y = 0.005–0.04) samples
To obtain the multicolor tunable emission and further prove the possibility of energy transfer process of the YTaO4:Tb3+, Eu3+ phosphors, a series of YTaO4:xTb3+, 0.02Eu3+ (x = 0.01, 0.03, 0.05, 0.07, 0.09) phosphors were synthesized. The emission spectra of YTaO4:xTb3+, 0.02Eu3+ (x = 0.01, 0.03, 0.05, 0.07 and 0.09) phosphors excited by 270 nm are illustrated in Fig. 5, which shows the variation of luminescence intensity and the intense characteristic emission peaks of Tb3+ and Eu3+ ions. Because of the concentration quenching, the emission intensity of Tb3+ increases first and then decreases with the increase of Tb3+content. Although the concentration of Eu3+ is constant, the emission of Eu3+ (613 nm) increases gradually in a certain range with the increase of the Tb3+ content, which due to the energy transfer from Tb3+ to Eu3+ ions, but then the emission of Eu3+ (613 nm) decreases when Tb3+ content is from 0.05 to 0.09, which due to the concentration quenching of Eu3+, the results prove that Tb3+ can transfer energy to Eu3+ [30].
Fig. 5.

Emission spectra of YTaO4:xTb3+, 0.02Eu3+ (x = 0.01, 0.03, 0.05, 0.07, 0.09) phosphors under 270 nm excitation, and inset is variation of the normalized intensities at 547 and 613 nm emission corresponding to the Tb3+ content (x)
To further understand the energy transfer process between Tb3+ and Eu3+, the emission spectra of YTaO4:0.07Tb3+, yEu3+ (y = 0.01, 0.02, 0.03, 0.04, 0.05) samples under 270 nm excitation are shown in Fig. 6. In the emission spectra of YTaO4:0.07Tb3+, yEu3+ phosphors, we can observe the characteristic sharp peaks of Eu3+ and Tb3+ ions. As there is increase in doping concentration of Eu3+ (y), the emission intensity of Eu3+ continues to rise until y = 0.03, afterward the characteristic emission intensity of Eu3+ begins to decrease. In addition, when the doping concentration of Eu3+ goes up, the emission intensity of Tb3+ declines as a result of the energy transfer from Tb3+ to Eu3+ in YTaO4 host [42].
Fig. 6.

Emission spectra of YTaO4:0.07Tb3+, yEu3+ (y = 0.01, 0.02, 0.03, 0.04, 0.05) phosphors under 270 nm excitation, and inset is variation of the normalized intensities at 547 and 613 nm emission corresponding to the Eu3+ content (y)
Figure 7 shows the fluorescence lifetime of YTaO4:0.07Tb3+, yEu3+ (y = 0, 0.01, 0.02, 0.03, 0.04, 0.05). Test data can be fitted and processed according to the following formula:
Fig. 7.
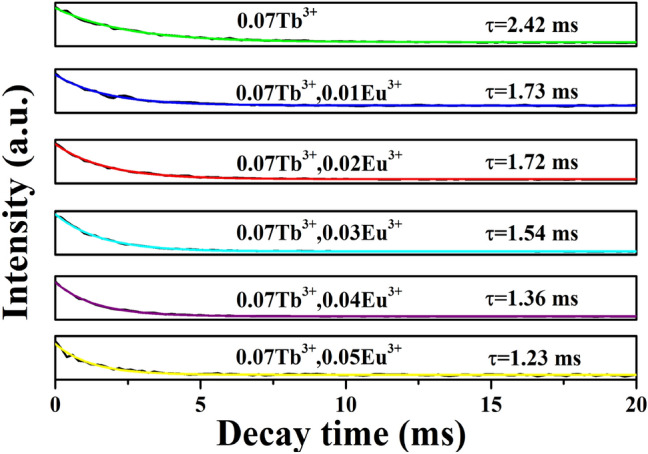
Decay curves of YTaO4:0.07Tb3+, yEu3+ (y = 0, 0.01, 0.02, 0.03, 0.04, 0.05) phosphors under the excitation of 270 nm and monitoring at 547 nm
Here I corresponds to the fluorescence intensity at t, I0 corresponds to the fluorescence intensity of the t = 0, and τ is on behalf of the fluorescence lifetime. The fluorescence lifetime of Tb3+ are 2.42, 1.73, 1.72, 1.54, 1.36 and 1.23 ms for y = 0, 0.01, 0.02, 0.03, 0.04, 0.05, respectively. With the increase of Eu3+ doping concentration, the fluorescence lifetime of Tb3+ decreases gradually as we can obviously see, which further proves that Tb3+ transfers energy to Eu3+ ions.
The energy transfer efficiency could be roughly calculated by the related luminescence intensities as the following equation:
Here Is and Is0 correspond to the luminescence intensity of Tb3+ ions with and without Eu3+ ions, respectively. Figure 8 shows that the energy transfer efficiency increases gradually till about 86% of phosphors with the increase of Eu3+ content, indicating that the effective energy transfer between Tb3+ and Eu3+ is occurred in YTaO4 host.
Fig. 8.

Energy transfer efficiency (ƞET) from Tb3+ to Eu3+ in YTaO4:0.07Tb3+, yEu3+ (y = 0–0.05) samples under 270 nm excitation
According to the energy transfer theory of Dexter and Reisfeld, the possible mechanism can be analyzed by the following formula [58]:
where Iso and Is are the luminescence intensity of Tb3+ with or without Eu3+, respectively. C is the sum concentration of Tb3+ and Eu3+, and n = 6, 8, and 10 are corresponding to the dipole–dipole, dipole-quadrupole, and quadrupole–quadrupole interactions, respectively. Plots of the value of Iso/Is and Cn/3 are depicted in Fig. 9. It is found that when n = 8, the fitting result is the best, indicating that the energy transfer mechanism is dipole-quadrupole interaction.
Fig. 9.

The dependence Iso/Is of Tb3+ on the (n = 6, 8, 10) in YTaO4:0.07Tb3+, yEu3+ (y = 0–0.05) phosphors
Energy transfer mechanism
Figure 10 describes the energy levels and energy transfer mechanism from Tb3+ to Eu3+ in YTaO4 host which explain the polychromatic luminescence mechanism of YTaO4:Tb3+, Eu3+ clearly. For YTaO4:Tb3+, Eu3+ phosphors, both Tb3+/Eu3+–O2− charge transfer band and TaO43− group make contributions for the emissions of Tb3+ and Eu3+ [13]. In the whole process of excitation, electrons are transferred from O2− valence to the Tb3+ and Eu3+ conduction band upon the excitation of ultraviolet light. Subsequently, the electrons transfer to 5D3 state of Tb3+ ions and 5L6 of Eu3+ ions, respectively. As is known to all, electrons in excited state are unstable. Therefore, the electrons of Tb3+ ions relax from 5D3 to 5D4 level through non-radiative transition, then transmit to 7F6, 7F5, 7F4 and 7F3 energy level, leading to the emission of 492 nm, 547 nm, 585 nm, and 621 nm, respectively. Similarly, the electrons of Eu3+ relax from 5L6 to 5D0 state, then go back to 7F1 and 7F2, corresponding to the emission of 593 nm and 613 nm, respectively. In addition, the transitions from ground state 1A1 of TaO43− group to excited levels take place and TaO43− group transfers energy to Tb3+ and Eu3+ ions leading to the characteristic emission of Tb3+ and Eu3+ ions. Meanwhile, the characteristic emission of Eu3+ ions can be checked, owing to that some electrons of Tb3+ ions make a non-radiative transition from 5D4 to the 5D0 of Eu3+ ions. Due to the manageable energy transfer efficiency, the YTaO4:Tb3+, Eu3+ samples upon excitation of ultraviolet light can show the Tb3+ and Eu3+ emissions with different intensities at the same time. Consequently, the emission color of phosphors is adjustable.
Fig. 10.

Schematic energy-level diagram of Tb3+ and Eu3+ in YTaO4 and the energy transfer process
Adjustable color
The luminescence properties of YTaO4:0.07Tb3+ (1), YTaO4:0.07Tb3+, yEu3+ (y = 0.01(2), 0.02 (3), 0.03 (4), 0.04 (5) and 0.05(6)) and YTaO4:0.02Eu3+ (7) samples upon 270 nm excitation have been investigated in detail, and the corresponding CIE chromaticity diagrams are shown in Fig. 11. It is worth mentioning that the CIE chromaticity coordinate of YTaO4:0.07Tb3+ locates in the green emission zone with 1 point (0.3119, 0.5294). The emissive color of YTaO4:0.02Eu3+ is in the red emission zone and the CIE chromaticity coordinate is calculated to be (0.4165, 0.2909) (7 point). With the change of doping amount of Eu3+ ion, the YTaO4:0.07Tb3+, yEu3+ (y = 0.01–0.05) phosphors can achieve color adjustable emission from green to yellow and the corresponding CIE chromaticity coordinates are calculated to be (2, 0.368, 0.5176), (3, 0.3864, 0.5142), (4, 0.3854, 0.4838), (5, 0.2634, 0.5935), (6, 0.3754, 0.4225). The results show that multi color luminescence can be achieved through adjusting the Eu3+/Tb3+ ratio.
Fig. 11.

CIE chromaticity diagram of YTaO4:0.07Tb3+ (1), YTaO4:0.07Tb3+, yEu3+ (y = 0.01(2), 0.02 (3), 0.03 (4), 0.04 (5) and 0.05(6)) and YTaO4:0.02Eu3+ (7) samples upon 270 nm excitation
Conclusions
In summary, Eu3+-and/or Tb3+-doped Mʹ-YTaO4 phosphors were prepared by a sol–gel combustion method, which needs lower temperature than before. Under excitation at 270 nm, due to the typical 5D4–7F5 transition of Tb3+, the YTaO4:Tb3+ phosphors show characteristic green emission. Meanwhile, the PL intensity is strongly dependent on the Tb3+ doping concentration and the optimal doping concentration is determined to be 0.07. YTaO4:Eu3+ phosphors show excellent red emission on account of the 5D0–7F1, 2 transitions. The emission color of the samples is transformed from green to red by adjusting the doping ratio of Tb3+ and Eu3+. The energy transfers from YTaO4 host to Tb3+ and Eu3+ and Tb3+–Eu3+ are systematically discussed. The energy transfer efficiency of Tb3+–Eu3+ in the YTaO4:0.07Tb3+,0.05Eu3+ phosphor can reach up to about 86%. From the above experimental results, it can be concluded that the YTaO4:Tb3+, Eu3+ phosphors have a broad application prospect in phosphor conversion LEDs.
Acknowledgements
This work was financially supported by the National key R&D Program of China (Grant No. 2019YFA0705204), National Natural Science Foundation of China (NSFC) (Grant No. 51072026, 51573023) and Natural Science Foundation of Jilin province of China (Grant No. 20170101185JC).
Compliance with ethical standards
Conflict of interest
There are no conflicts of interest to declare.
Footnotes
Publisher's Note
Springer Nature remains neutral with regard to jurisdictional claims in published maps and institutional affiliations.
References
- 1.I. Arellano, M. Nazarov, C.C. Byeon, E.J. Popovici, H. Kim, H.C. Kang, D.Y. Noh, Mater. Chem. Phys. 119, 48–51 (2010) [Google Scholar]
- 2.J.S. Huo, Q. Wang, J Nanosci Nanotechnol. 15, 549–555 (2015) [DOI] [PubMed] [Google Scholar]
- 3.F.H. Borges, F.J. Caixeta, R.R. Pereira, S.R. Oliveira, R.R. Gonçalves, J. Lumin. 199, 143–153 (2018) [Google Scholar]
- 4.S. Yildirim, S. Demirci, K. Ertekin, E. Celik, Z.A. Alicikus, J. Adv. Ceram. 6, 33–42 (2017) [Google Scholar]
- 5.J. Huo, J.D. Zhu, S.H. Wu, H.J. Zhang, M.Q. Wang, J. Lumin. 158, 417–421 (2015) [Google Scholar]
- 6.H. Brunckova, E. Mudra, L. Medvecky, A. Kovalcikova, J. Durisin, M. Sebek, V. Girman, Mater. Des. 134, 455–468 (2017) [Google Scholar]
- 7.A. Varma, A.S. Mukasyan, A.S. Rogachev, K.V. Manukyan, Chem. Rev. 116, 14493–14586 (2016) [DOI] [PubMed] [Google Scholar]
- 8.H. Huang, H. Zhou, J. Zhou, T. Wang, D. Huang, Y. Wu, L. Sun, G. Zhou, J. Zhan, J. Hua, RSC Adv. 27, 16777–16786 (2017) [Google Scholar]
- 9.S.K. Gupta, K. Sudarshan, P.S. Ghosh, A.P. Srivastava, S. Bevara, P.K. Pujari, R.M. Kadam, J. Mater. Chem. C 4, 4988–5000 (2016) [Google Scholar]
- 10.S. Zhang, Y. Zhao, M. Díaz-Somoano, J. Yang, J. Zhang, Energy Fuel. 32, 11785–11795 (2017) [Google Scholar]
- 11.N. Yahya, F. Aziz, A. Jamaludin, A. Aizat, J. Jaafar, W.J. Lau, N. Yusof, W.N.W. Salleh, A.F. Ismail, Ind. Eng. Chem. Res. 58, 609–617 (2018) [Google Scholar]
- 12.A. Das, S. Saha , K. Panigrahi, U. K. Ghorai and K. K. Chattopadhyay, Microsc. Microanal. 1–9 (2019). [DOI] [PubMed]
- 13.H. Zhang, Y. Wang, L. Xie, J. Lumin. 130, 2089–2092 (2010) [Google Scholar]
- 14.A.G. Sarwar, B.J. May, M.F. Chisholm, Nanoscale. 8(15), 8024–8032 (2016) [DOI] [PubMed] [Google Scholar]
- 15.S. Ding, H. Zhang, W. Liu, D. Sun, Q. Zhang, J. Mater. Sci. 29, 11878–11885 (2018) [Google Scholar]
- 16.S. Wang, M. Jiang, L. Gao, Z. Ma, F. Wang, Materials. 9, 55–66 (2016) [DOI] [PMC free article] [PubMed] [Google Scholar]
- 17.Y. Zhao, C. Guo, C. Shi, F. Peng, H. Yang, D. Sun, J. Luo, W. Liu, J. Lumin. 155, 165–169 (2014) [Google Scholar]
- 18.Y. Zhong, P. Sun, X. Gao, Q. Liu, S. Huang, B. Liu, B. Deng, R. Yu, J. Lumin. 212, 45–51 (2019) [Google Scholar]
- 19.T. Ahmad, U. Farooq, R. Phul, Ind. Eng. Chem. Res. 57, 18–41 (2017) [Google Scholar]
- 20.F. Zhang, G. Zhang, L. Yang, Y. Zhou, Y. Du, J. Eur. Ceram. Soc. 39, 5036–5047 (2019) [Google Scholar]
- 21.F. Jiang, S. Shian, B. Xiao, D.R. Clarke, Phys. Rev. B 90, 94–102 (2014) [Google Scholar]
- 22.C. Kelle, Z. Anorg. Allg. Chem. 318, 89–106 (1962) [Google Scholar]
- 23.L.L. Noto, S.S. Pitale, M.A. Gusowki, O.M. Ntwaeaborwa, J.J. Terblans, H.C. Swart, J. Lumin. 145, 907–913 (2014) [Google Scholar]
- 24.P. Wu, Y. Zhou, F. Wu, M. Hu, X. Chong, J. Feng, J. Am. Ceram. Soc. 102, 7656–7664 (2019) [Google Scholar]
- 25.Q. Flamant, M. Gurak, D.R. Clarke, J. Eur. Ceram. Soc. 38, 3925–3931 (2018) [Google Scholar]
- 26.W. Liu, Q. Zhang, L. Ding, D. Sun, J. Luo, S. Yin, J. Alloys Compd. 474, 226–228 (2019) [Google Scholar]
- 27.J.Y. Gao, Y.P. Zhao, Q.L. Zhang, X.F. Wang, W.P. Liu, S.J. Ding, D.L. Sun, S.T. Yin, J. Mater. Res. 31, 3255–3261 (2016) [Google Scholar]
- 28.F. Peng, Q. Zhang, C. Shi, C. Guo, Y. Zhao, H. Yang, D. Sun, J. Luo, W. Liu, Opt. Mater. 39, 148–152 (2015) [Google Scholar]
- 29.Y. Tian, B. Chen, B. Tian, N. Yu, J. Sun, X. Li, J. Zhang, L. Cheng, H. Zhong, Q. Meng, R. Hua, J Colloid Interface Sci. 393, 44–52 (2013) [DOI] [PubMed] [Google Scholar]
- 30.W. Wang, P. Yang, Z. Cheng, Z. Hou, C. Li, J. Lin, ACS Appl. Mater. Interface 3, 3921–3928 (2011) [DOI] [PubMed] [Google Scholar]
- 31.J.P. Zuniga, S.K. Gupta, M. Abdou, Y. Mao, ACS Omega 3, 7757–7770 (2018) [DOI] [PMC free article] [PubMed] [Google Scholar]
- 32.J.S. Bae, K.S. Shim, S.B. Kim, J.H. Jeong, S.S. Yi, J.C. Park, J. Cryst. Growth 264, 290–296 (2014) [Google Scholar]
- 33.P. Dai, X. Zhang, M. Zhou, X. Li, J. Yang, P. Sun, C. Xu, Y. Liu, J. Ballato, J. Am. Ceram. Soc. 95, 658–662 (2012) [Google Scholar]
- 34.M. Ma, W.G. Zhu, D. Zhao, C.T. Han, S. Cao, Y. Lei, M. Tu, Chin. Sci. Bull. 57, 1728–1732 (2012) [Google Scholar]
- 35.F. Kang, L. Li, J. Han, D. Lei, M. Peng, J. Mater. Chem. C 5, 390–398 (2017) [Google Scholar]
- 36.X. Zhang, D. Yan, G. Yuan, H.J. Seo, ECS Solid State Lett. 4, R43–R45 (2015) [Google Scholar]
- 37.S.Y. Qi, H. Xie, Y. Huang, S. Kim, H. Seo, Opt. Mater. Express 4, 190–198 (2014) [Google Scholar]
- 38.X. Ge, L. Sun, S. Dang, J. Liu, Y. Xu, Z. Wei, L. Shi, H. Zhang, Microchim. Acta. 182, 1653–1660 (2015) [Google Scholar]
- 39.H. Huang, B. Yan, Appl. Surf. Sci. 252, 2967–2972 (2006) [Google Scholar]
- 40.Q. Dan, T. Wanjun, Ceram. Int. 42, 1538–1544 (2016) [Google Scholar]
- 41.J. Li, Z. Zhang, X. Li, Y. Xu, Y. Ai, J. Yan, J. Shi, J. Mater. Chem. C 5, 6294–6299 (2017) [Google Scholar]
- 42.F. Kang, G. Sun, A. Wang, X. Xiao, Y. Li, J. Lu, B. Huang, ACS Appl. Mater. Interfaces 10, 36157–36170 (2018) [DOI] [PubMed] [Google Scholar]
- 43.J. Huang, W. Lu, J. Wang, Q. Li, B. Tian, C. Li, Z. Wang, L. Jin, J. Hao, Inorg. Chem. 57, 8662–8672 (2018) [DOI] [PubMed] [Google Scholar]
- 44.M.H. Im, Y.J. Kim, Mater. Res. Bull. 112, 399–405 (2019) [Google Scholar]
- 45.J. Lin, Z. Zhou, Q. Wang, Mater. Res. Bull. 48, 2771–2775 (2013) [Google Scholar]
- 46.İ.Ç. Keskin, S. Gültekin, J. Alloys Compd. 789, 932–940 (2019) [Google Scholar]
- 47.Y. Feng, J. Huang, C. Li, G. Hu, J. Liu, X. Yu, J. Alloys Compd. 706, 478–484 (2017) [Google Scholar]
- 48.X. Ju, X. Li, W. Li, W. Yang, C. Tao, Mater. Lett. 65, 2642–2644 (2011) [Google Scholar]
- 49.D. Thi Lien, D.T. Mai Huong, L. Van Vu, N. Ngoc Long, J. Lumin. 161, 389–394 (2019) [Google Scholar]
- 50.X. Huang, B. Li, H. Guo, J. Alloys Compd. 695, 2773–2780 (2017) [Google Scholar]
- 51.K.P.F. Siqueira, A.P. Carmo, M.J.V. Bell, A. Dias, J. Lumin. 179, 146–153 (2016) [Google Scholar]
- 52.M. Wu, X. Liu, M. Gu, C. Ni, B. Liu, S. Huang, Mater. Res. Bull. 60, 652–658 (2014) [Google Scholar]
- 53.A.H. Krumpel, P. Boutinaud, P. Dorenbos, J. Lumin. 130, 1357–1365 (2010) [Google Scholar]
- 54.I.E. Kolesnikov, D.V. Mamonova, E. Lähderanta, A.V. Kurochkin, M.D. Mikhailov, J. Lumin. 187, 26–32 (2017) [Google Scholar]
- 55.Y. Zhang, X.C. Zhu, Y. Zhao, Q.Q. Zhang, Nano Mater. 2, 7095–7102 (2019) [Google Scholar]
- 56.B. Li, X. Huang, H. Guo, Y. Zeng, Dyes Pigments. 150, 67–72 (2018) [Google Scholar]
- 57.X. Huang, B. Li, H. Guo, D. Chen, Dyes Pigments. 143, 86–94 (2017) [Google Scholar]
- 58.P. Karamjyoti, S. Subhajit, S. Sumanta, C. Rituparna, D. Antika, K.G. Uttam, S.D. Nirmalya, K.C. Kalyan, Dalton Trans. 47, 12228–12242 (2018)30106407 [Google Scholar]